Quality and Inequality in Academic Labor Markets by James Moody The Ohio State University.
58
ality and Inequality in Academic Labor Marke by James Moody The Ohio State University
-
Upload
april-franklin -
Category
Documents
-
view
218 -
download
4
Transcript of Quality and Inequality in Academic Labor Markets by James Moody The Ohio State University.

Quality and Inequality in Academic Labor Markets
by
James MoodyThe Ohio State University

Quality & Inequality in Academic Labor Markets
1) Introduction & Background• Academic Caste Systems• Suggestive Findings from a sociology
market• A reasonable null?
2) Simulation Setup• Market Elements• An example run
3) Simulation Results• Market Clearing• Size & Quality • Position Stability• Academic Castes?
4) Tentative Conclusions• Some mechanisms• Potential implications• Future changes / extensions

Introduction & BackgroundAcademic Caste Systems
Merton (1942,1968)Two key features that shape the academic market:
•Universalistic criteria to evaluate quality•“Mathew effect:” the cumulative advantage of prestige
Burris (2004:239) states as fact that prestige is ascribed rather than achieved, arguing that
“Moreover, through a process of cumulative advantage, academic scientists and scholars who secure employment in the more prestigious departments gain differential access to resources and rewards that enhance their prospects. This cycle results in a stratified system of departments and universities, ranked in terms of prestige, that is highly resistant to change.” (p.239)
Burris attribute’s much of this stability to “Social Capital” in the PhD hiring market.
Introduction & BackgroundAcademic Caste Systems
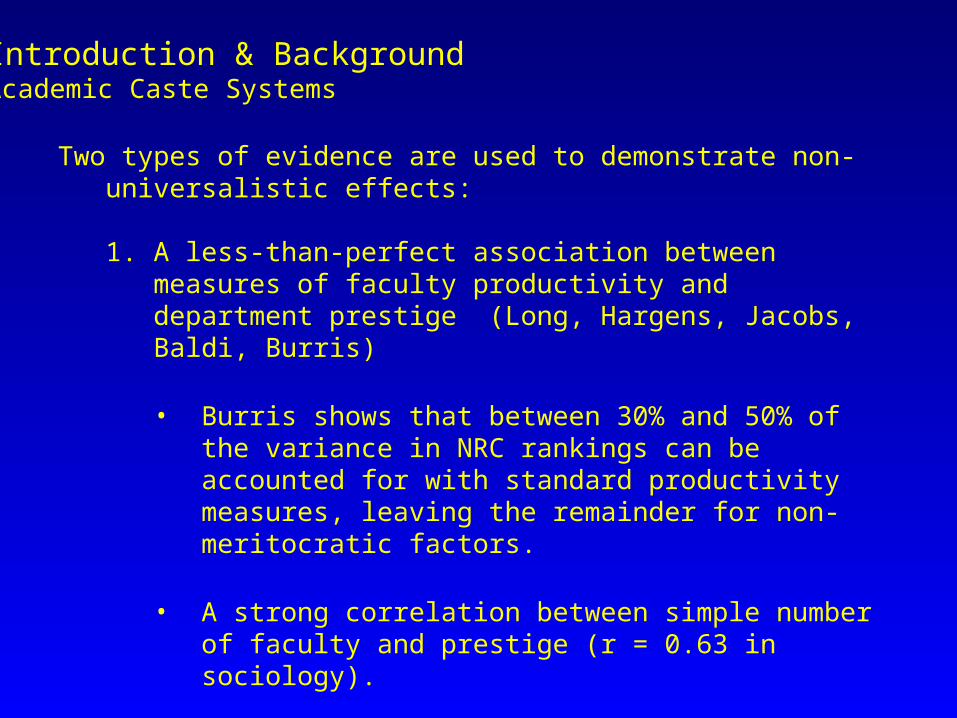
Two types of evidence are used to demonstrate non-universalistic effects:
1. A less-than-perfect association between measures of faculty productivity and department prestige (Long, Hargens, Jacobs, Baldi, Burris)
• Burris shows that between 30% and 50% of the variance in NRC rankings can be accounted for with standard productivity measures, leaving the remainder for non-meritocratic factors.
• A strong correlation between simple number of faculty and prestige (r = 0.63 in sociology).
• Probability / prestige of first job due to origin of PhD rather than publication record (but see Cognard-Black, 2004 and below).

Introduction & BackgroundAcademic Caste Systems
Two types of evidence are used to demonstrate non-universalistic effects:2. An extreme stability of department rankings over time
Burris, ASR 2004
The correlation in NRC faculty quality scores in Sociology from 1982 to 1993 is 0.92

Hanneman (2001), overlapping PhD exchange networks, Sociology
Introduction & BackgroundAcademic Caste Systems
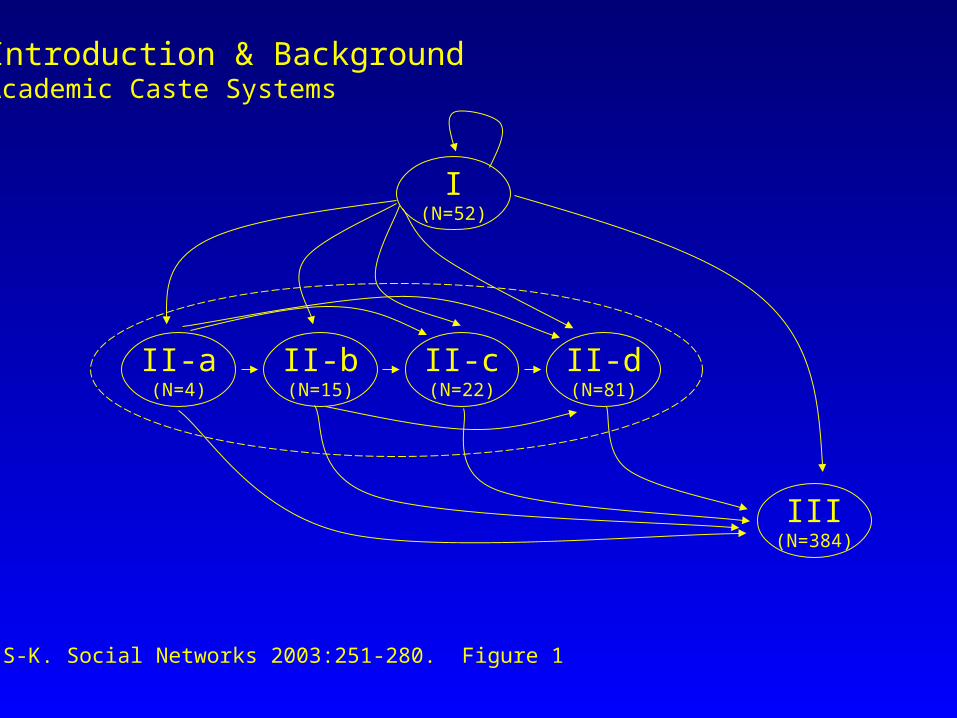
The combined effect becomes clear in the PhD exchange network:

The combined effect becomes clear in the PhD exchange network
Introduction & BackgroundAcademic Caste Systems
Hanneman (2001), overlapping PhD exchange networks, Sociology
Introduction & BackgroundAcademic Caste Systems
I(N=52)
II-a(N=4)
II-b(N=15)
II-c(N=22)
II-d(N=81)
III(N=384)
Han, S-K. Social Networks 2003:251-280. Figure 1

Introduction & BackgroundAcademic Caste Systems
“Social Capital” = Bonacich Centrality on symmetric version of the PhD exchange Network
The resulting status-based network has a strong correlation between centrality in the hiring network & quality ranking

Introduction & BackgroundAcademic Caste Systems
Can we square this stability & centrality with universalistic scientific norms?
First, research on markets and cultural consumption suggests that quality is accurately perceived particularly when external measures show small differences (White 2002, J. Blau, Bourdieu).
“Quality exists, whether it's defined or not. ”- Robert Pirsig (1972)
That is, we know quality even if our systematic measures of quality are poor, which is reflected (in part) through market convergence on particular candidates (see below).

Introduction & BackgroundAcademic Caste Systems
Second, most data on the market structure systematically selects on the dependent variable, as only those who are eventually hired are observed.
This has the effect of:a) limiting variation on observed quality measuresb) makes it impossible to disentangle PhD volume from placement patterns
Recent dissertation work by Cognard-Black, for example, shows that the independent effect of PhD institution on placement is often lower than publication quality measures, once you expand the sample of PhDs beyond those hired to major research universities.
Can we square this stability & centrality with universalistic scientific norms?
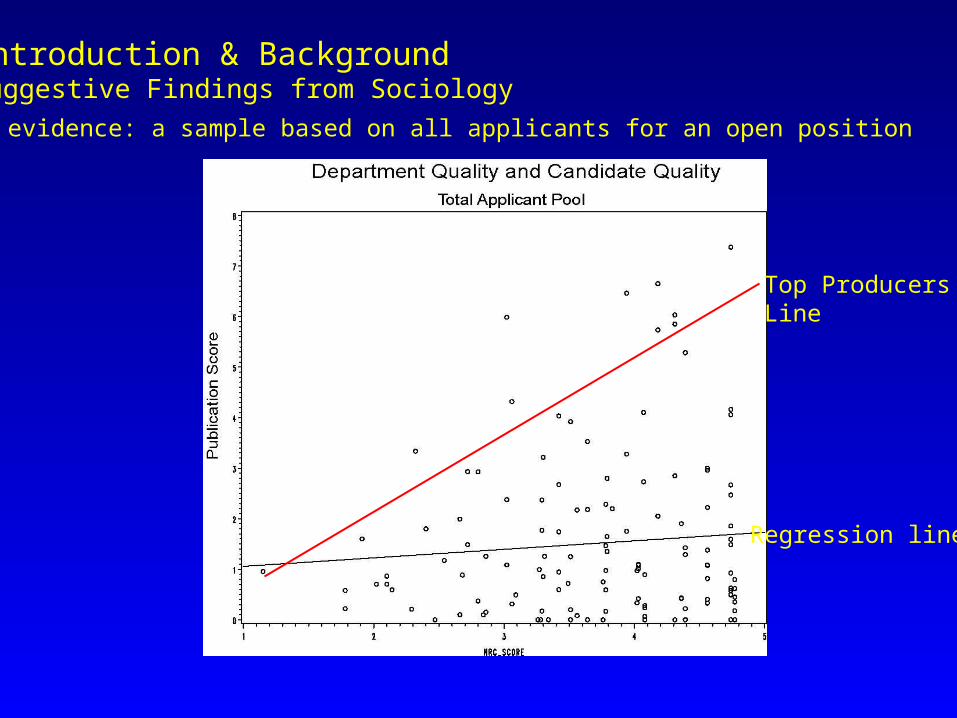
Introduction & BackgroundSuggestive Findings from Sociology
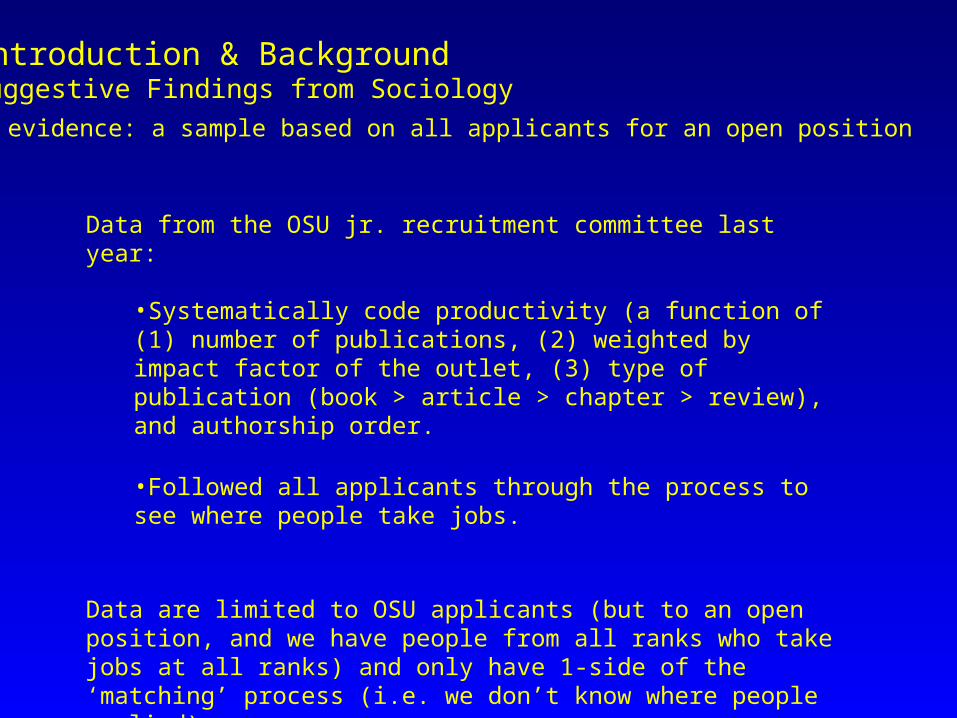
Further evidence: a sample based on all applicants for an open position
Data from the OSU jr. recruitment committee last year:
•Systematically code productivity (a function of (1) number of publications, (2) weighted by impact factor of the outlet, (3) type of publication (book > article > chapter > review), and authorship order.
•Followed all applicants through the process to see where people take jobs.
Data are limited to OSU applicants (but to an open position, and we have people from all ranks who take jobs at all ranks) and only have 1-side of the ‘matching’ process (i.e. we don’t know where people applied).
Introduction & BackgroundSuggestive Findings from Sociology
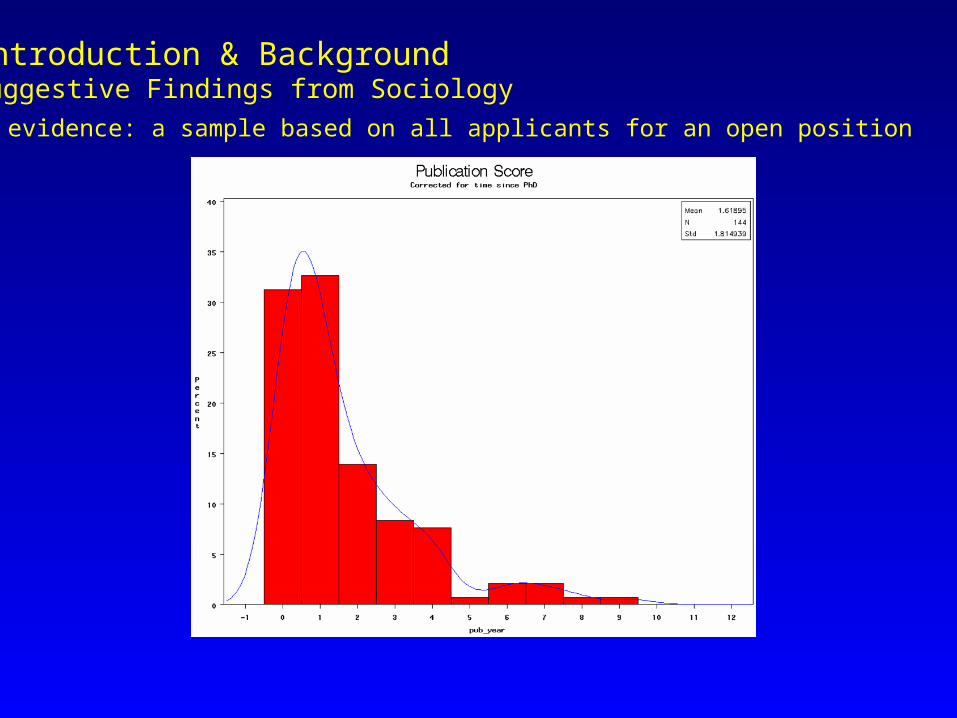
Further evidence: a sample based on all applicants for an open position
Introduction & BackgroundSuggestive Findings from Sociology
Further evidence: a sample based on all applicants for an open position
Regression line
Top ProducersLine

Introduction & BackgroundAcademic Caste Systems
Further evidence: a sample based on all applicants for an open position
No Job
Hired atNon-PhDGranting
Institution
Bottom (51+) Dept
50 - 21 Dept
20 – 11 Dept
Top 10 Dept
Based on 116 new PhDs applying to the OSU open search in 2004
Treat this distribution as a ranked outcome, and model by productivity & prestige
Job Placement

Introduction & BackgroundAcademic Caste Systems
Further evidence: a sample based on all applicants for an open position
Odds Ratios for Job Placementw. 95% Confidence Intervals
0
0.2
0.4
0.6
0.8
1
1.2
1.4
1.6
1.8
2
Productivity Time to PhD Years Since PhD Department Rank
Od
ds
Rat
io
Based on coefficients from an ordered logistic regression model for job placement rank, using 116 new PhDs applying to the OSU open search in 2004 (model also controls for minority status & gender)
Introduction & BackgroundIdentifying a Reasonable Null
What should the PhD production system look like?
In systems with open markets, merit-based hiring & rational actors:
1) How stable will quality rankings be?2) Will size and quality be correlated?3) Will network exchange centrality predict quality?
Each has been used as evidence for non-meritocratic prestige systems, but we don’t know how the observed cases match the expected cases, because we have no reasonable null distribution.
A key advantage of using a simulation is to identify a range of reasonable null distributions.
Introduction & BackgroundStructure from Action
A key question in sociology is where structure comes from.
A long line of simulation studies have show how very simple individual rules can generate complex global patterns:
Schelling on racial segregationAxlerod on systems of cooperationEpstein & Axtell's “Sugarscape” for inequality
In all of these cases, we can often generate a macro-system with all of the relevant characteristics (spatial segregation, high gini coefficients) from very clear local behavior that is indifferent to the global features.
Introduction & BackgroundTwo Sided Matching Markets
A long-line of work (building on Roth), focuses on the incentive structure and performance of markets where two sets of actors rank each other.
Non-academic examples include:•Artists and galleries•Medical interns and hospitals•Rushees and Greek houses•Law graduates and Federal Clerkships
These markets are distinguished from commodity markets in that goods are not easily substitutable, there is usually a constrained time-frame for action in the market, and each “side” of the market plays an active role in completing the market transaction.
The market is characterized by two ‘dirty sorts’ where each side ranks the other to make an exchange.

Introduction & BackgroundTwo Sided Matching Markets
Two-sided matching markets are famous for their dramatic failures:
• “Market unraveling” where timing is pushed ever earlier to jump the competition (rushing high-school students, appointing 1st year students to clerkships, etc.)
• Exchanges that do not please all/most actors• Holding places / offers to “trade up”• “Opportunistic” contract arrangements
Many of these failures have two things in common:1) They rob actors of information necessary to make good
choices2) They result in placements that do not maximize preferences

Introduction & BackgroundTwo Sided Matching Markets
The Sociology market, for example, is clearly inching toward unraveling:
Typical application dates are moving up, and variance is becoming smaller.
Dec. 31Jul 19 Aug 3 Aug 18 Sep 18 Sep 17 Oct 2 Oct 17 Nov 1 Nov 16 Dec 1 Dec 16
Nov 1
Oct 22
Oct 23
Oct 15
Oct 7
Introduction & BackgroundTwo Sided Matching Markets
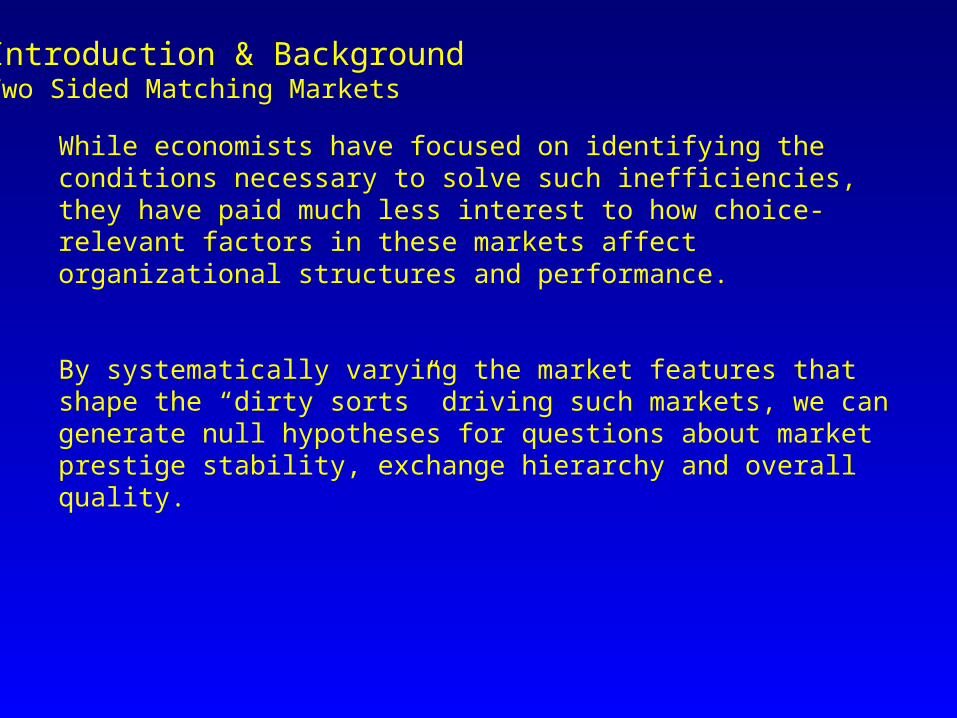
While economists have focused on identifying the conditions necessary to solve such inefficiencies, they have paid much less interest to how choice-relevant factors in these markets affect organizational structures and performance.
By systematically varying the market features that shape the “dirty sorts” driving such markets, we can generate null hypotheses for questions about market prestige stability, exchange hierarchy and overall quality.
Simulation SetupPurpose & Questions
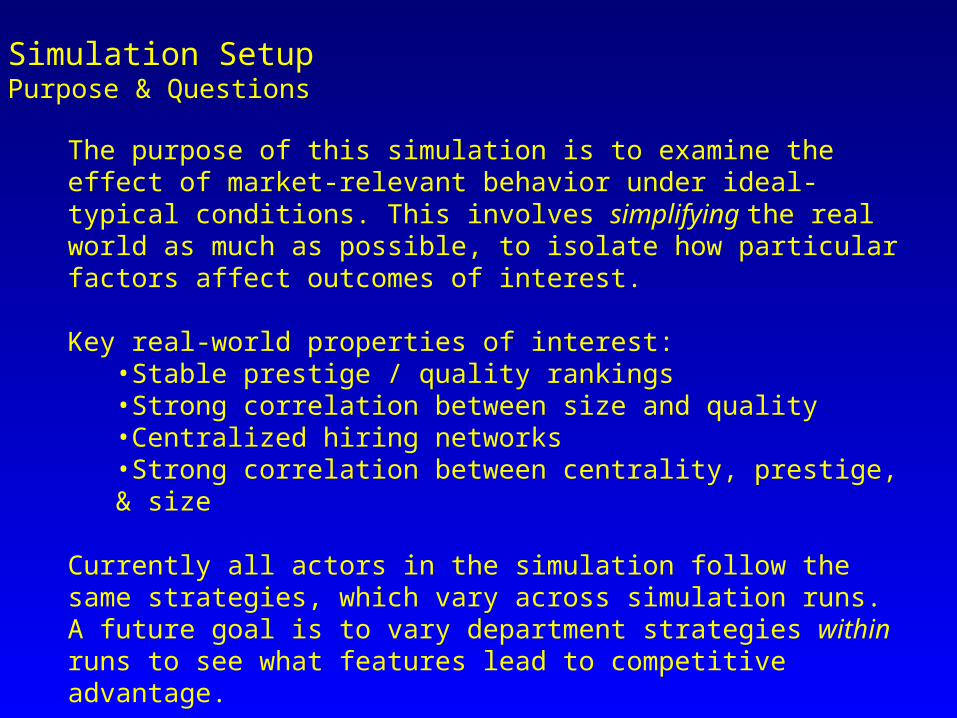
The purpose of this simulation is to examine the effect of market-relevant behavior under ideal-typical conditions. This involves simplifying the real world as much as possible, to isolate how particular factors affect outcomes of interest.
Key real-world properties of interest:•Stable prestige / quality rankings•Strong correlation between size and quality•Centralized hiring networks•Strong correlation between centrality, prestige, & size
Currently all actors in the simulation follow the same strategies, which vary across simulation runs. A future goal is to vary department strategies within runs to see what features lead to competitive advantage.
Simulation SetupMarket elements
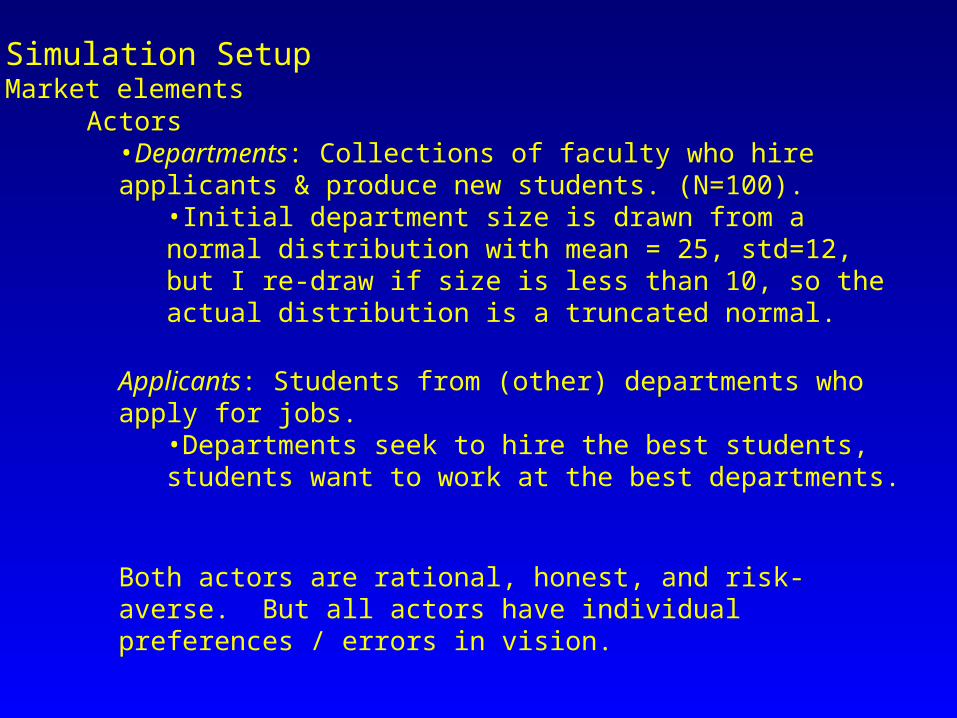
Actors•Departments: Collections of faculty who hire applicants & produce new students. (N=100).
•Initial department size is drawn from a normal distribution with mean = 25, std=12, but I re-draw if size is less than 10, so the actual distribution is a truncated normal.
Applicants: Students from (other) departments who apply for jobs.•Departments seek to hire the best students, students want to work at the best departments.
Both actors are rational, honest, and risk-averse. But all actors have individual preferences / errors in vision.
Simulation SetupMarket elements
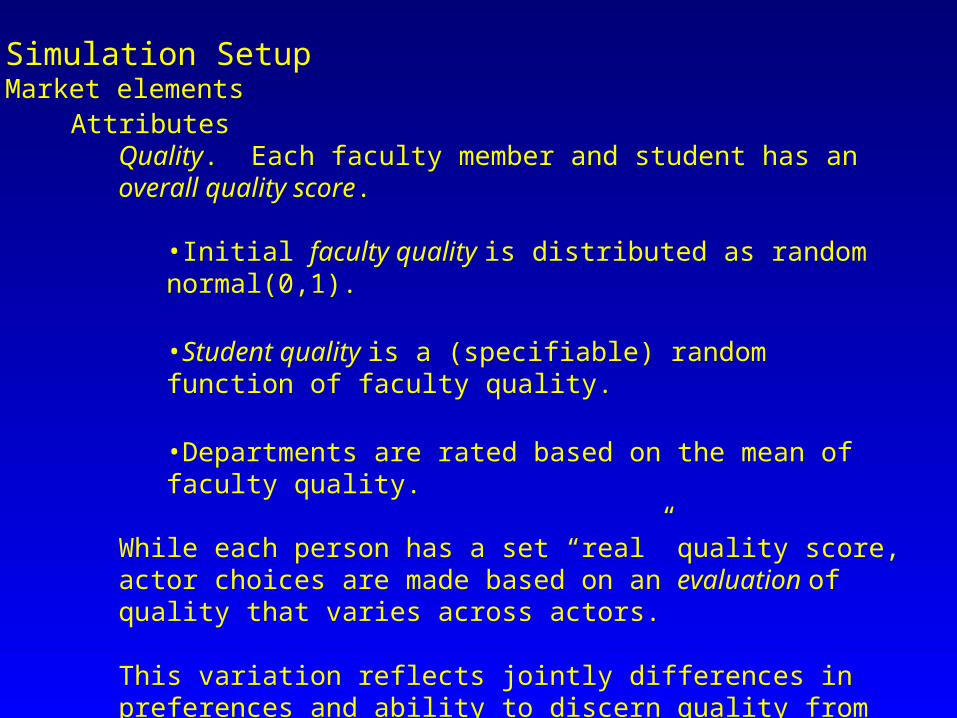
AttributesQuality. Each faculty member and student has an overall quality score.
•Initial faculty quality is distributed as random normal(0,1).
•Student quality is a (specifiable) random function of faculty quality.
•Departments are rated based on the mean of faculty quality.
While each person has a set “real” quality score, actor choices are made based on an evaluation of quality that varies across actors.
This variation reflects jointly differences in preferences and ability to discern quality from production.
Simulation SetupMarket elements
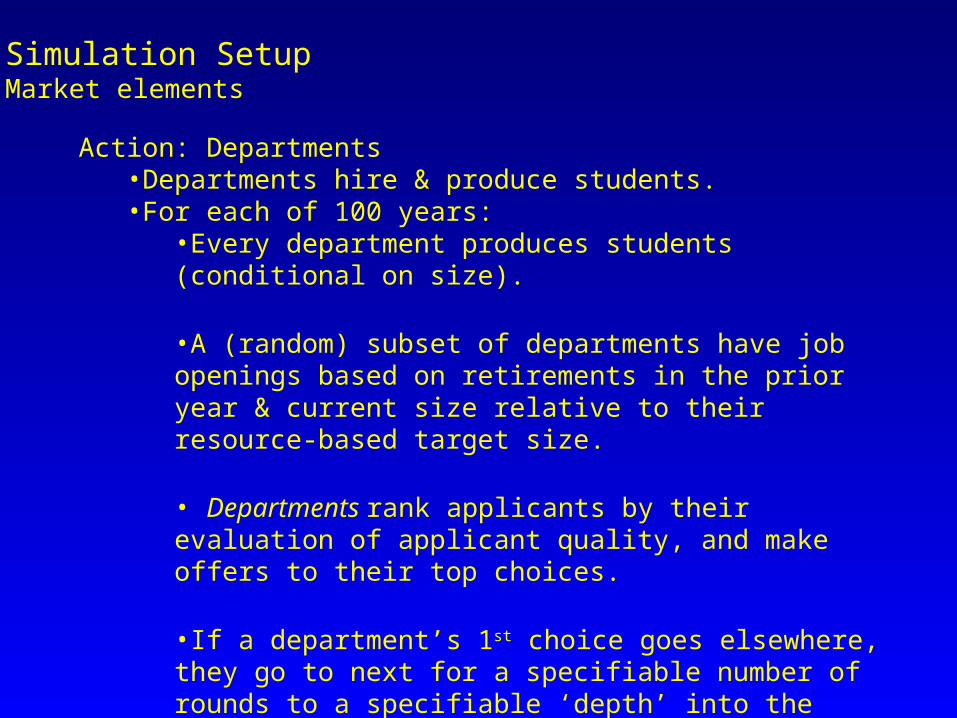
Action: Departments•Departments hire & produce students.•For each of 100 years:
•Every department produces students (conditional on size).
•A (random) subset of departments have job openings based on retirements in the prior year & current size relative to their resource-based target size.
• Departments rank applicants by their evaluation of applicant quality, and make offers to their top choices.
•If a department’s 1st choice goes elsewhere, they go to next for a specifiable number of rounds to a specifiable ‘depth’ into the pool.
•Jobs can go unfilled, which means that departments can both grow and shrink
Simulation SetupMarket elements
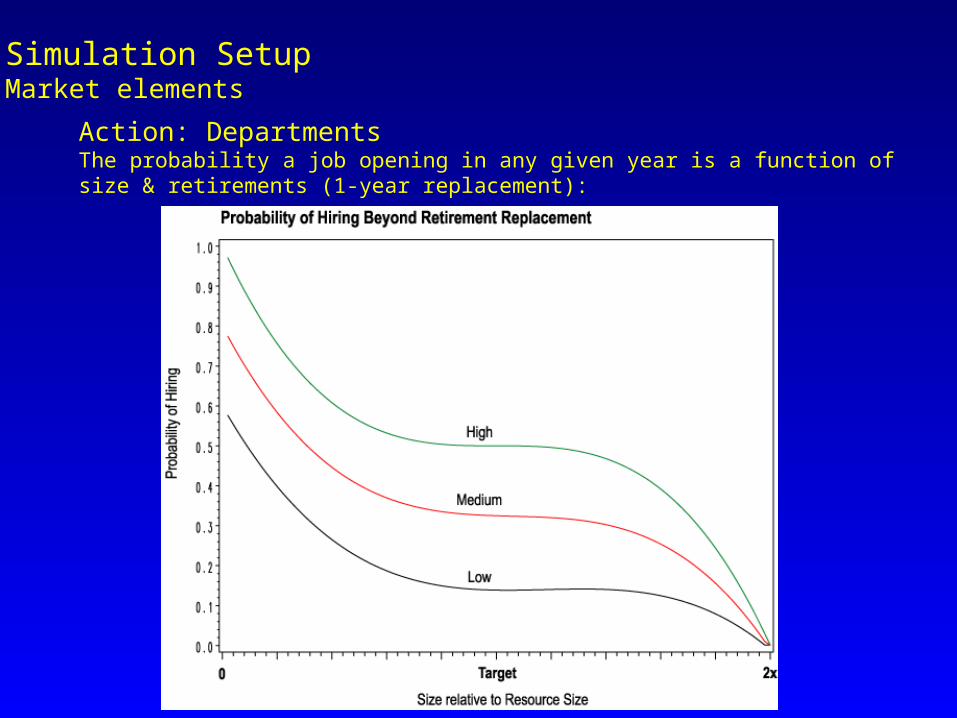
Action: DepartmentsThe probability a job opening in any given year is a function of size & retirements (1-year replacement):

Simulation SetupMarket elements
Action: DepartmentsFaculty size decreases through retirement
Simulation SetupMarket elements
Action: Students / Applicants•Students rank departments that make them an offer by their evaluation of department quality, and take the best job they are offered.
•If an applicant does not receive a job offer in a given year, they move out of the system
•Lots of applicants don’t get jobs (at PhD granting universities…)
•Applicants are not strategic: they do not hold a good offer while waiting for a better one (though this could be added)
Simulation SetupVariable Market Parameters
Parameter Description Specification
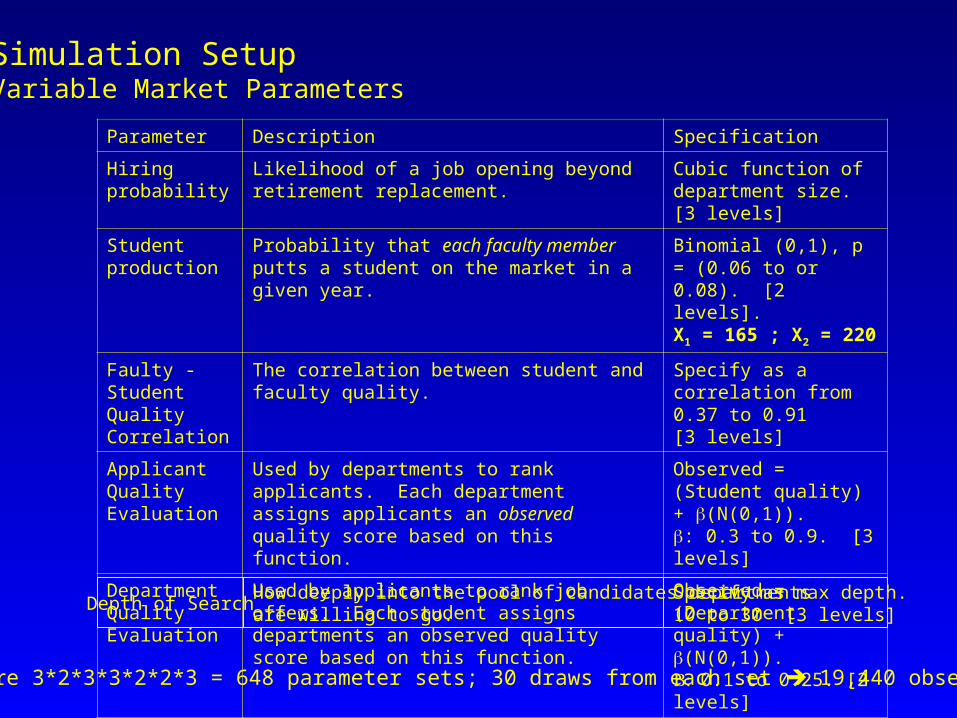
Hiring probability
Likelihood of a job opening beyond retirement replacement.
Cubic function of department size. [3 levels]
Student production
Probability that each faculty member putts a student on the market in a given year.
Binomial (0,1), p = (0.06 to or 0.08). [2 levels]. X1 = 165 ; X2 = 220
Faulty - Student Quality Correlation
The correlation between student and faculty quality. Specify as a correlation from 0.37 to 0.91[3 levels]
Applicant Quality Evaluation
Used by departments to rank applicants. Each department assigns applicants an observed quality score based on this function.
Observed = (Student quality) + (N(0,1)). : 0.3 to 0.9. [3 levels]
Department Quality Evaluation
Used by applicants to rank job offers. Each student assigns departments an observed quality score based on this function.
Observed = (Department quality) + (N(0,1)). 0.1 to 0.25. [2 levels]
Hiring Rounds Number of offer rounds made. Approximates time by limiting opportunity to make alternative offers.
Specify as number. 3 or 4 [2 levels]
There are 3*2*3*3*2*2*3 = 648 parameter sets; 30 draws from each set 19,440 observations
Depth of SearchHow deeply into the pool of candidates departments are willing to go.
Specify as max depth.10 to 30 [3 levels]

Simulation SetupA single simulation run
Initial Conditions100 departmentsSize distributed normally with mean of 25 std of 12 and an initial floor of
10. This is the resource-based target size for departments.Faculty quality is distributed normally (N(0,1))Age is initially distributed uniformly from 0 to 40 (starting with a
distribution means that retirements don’t go in waves)
Parameter Settings• Hiring curve: Medium• Student Production: 0.06 (~150 applicants per year)• Student-Faculty Quality Correlation: 0.67• Disagreement on applicant quality: 0.60 • Disagreement on department quality: 0.1• Hiring Rounds: 4• Depth of Search: 20
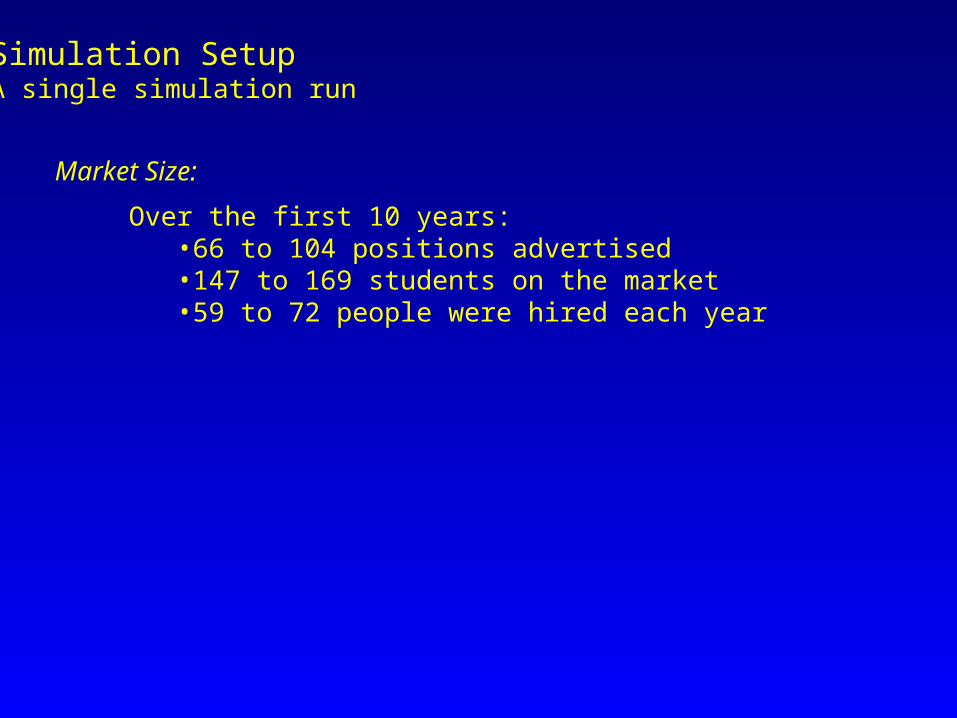
Simulation SetupA single simulation run
Over the first 10 years:•66 to 104 positions advertised•147 to 169 students on the market•59 to 72 people were hired each year
Market Size:

Simulation SetupA single simulation run
Distribution of size over time

Simulation SetupA single simulation run
Correlation between final size and target size
Quality > Mean + 1std
Quality < Mean + 1std
Target Size
Fin
al S
ize
TargetEquality
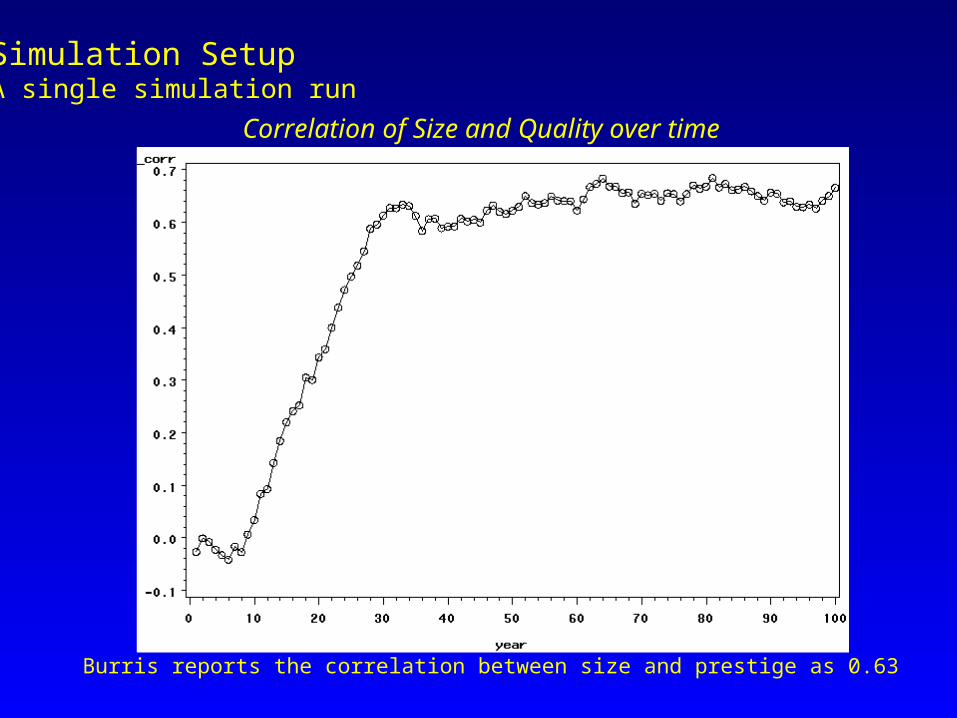
Burris reports the correlation between size and prestige as 0.63
Simulation SetupA single simulation run
Correlation of Size and Quality over time

Simulation SetupA single simulation run
Correlation of Quality 10 years prior
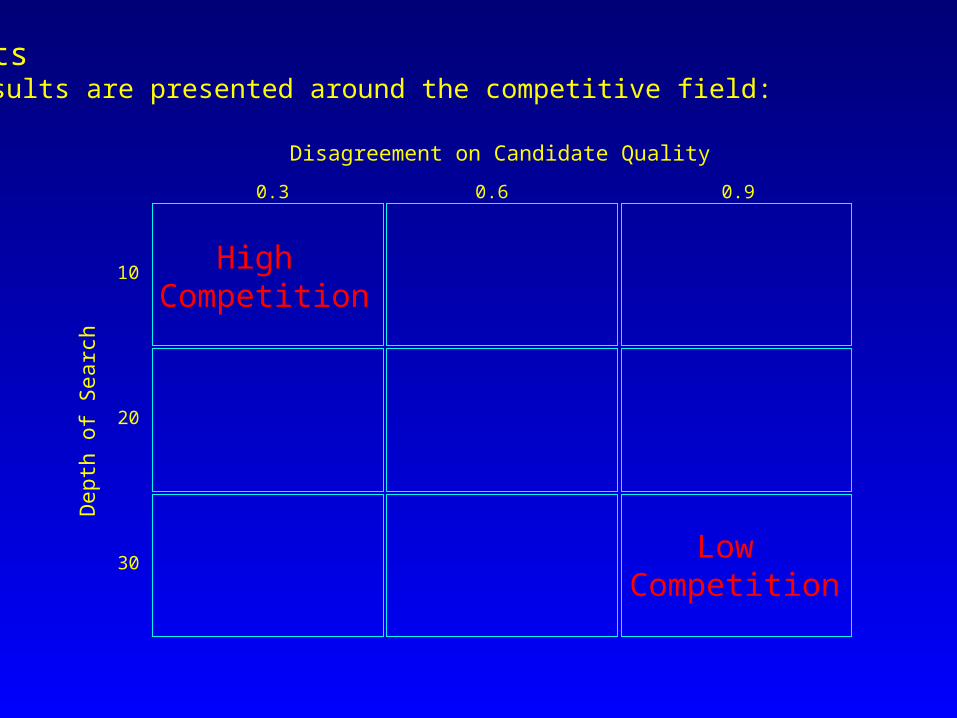
ResultsAll results are presented around the competitive field:
High Competition
Low Competition
Disagreement on Candidate Quality
Dep
th o
f S
earc
h
0.3 0.6 0.9
10
20
30
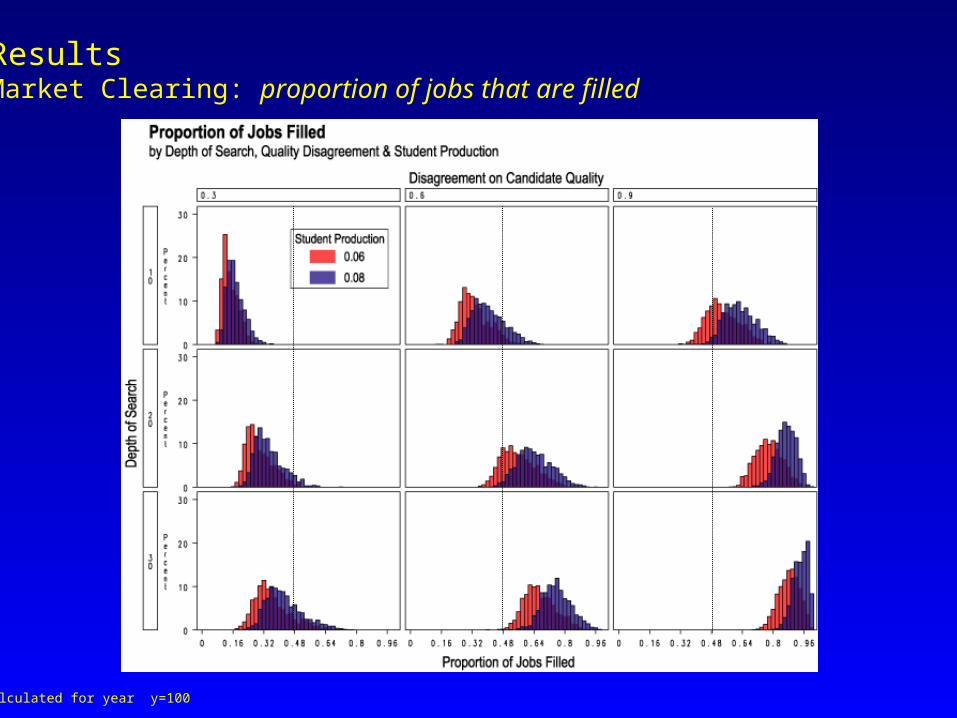
ResultsMarket Clearing: proportion of jobs that are filled
Calculated for year y=100

ResultsSize & Quality: Department Size
Calculated for year y=100

Calculated at final year ( y=100)
ResultsSize & Quality: Average Department Quality
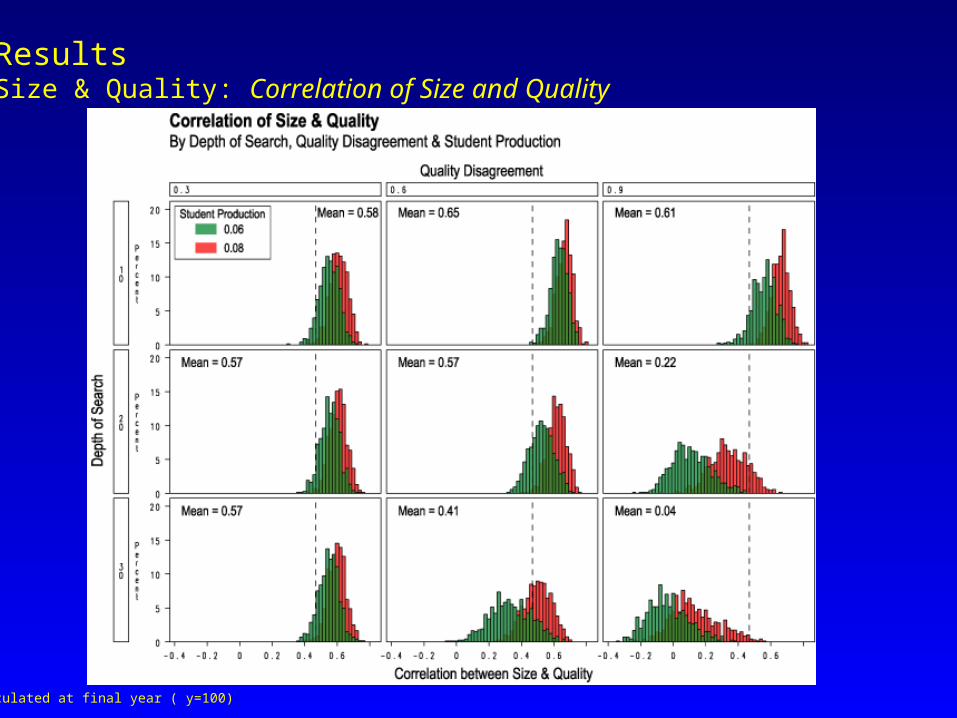
ResultsSize & Quality: Correlation of Size and Quality
Calculated at final year ( y=100)
Calculated at final year ( y=100)
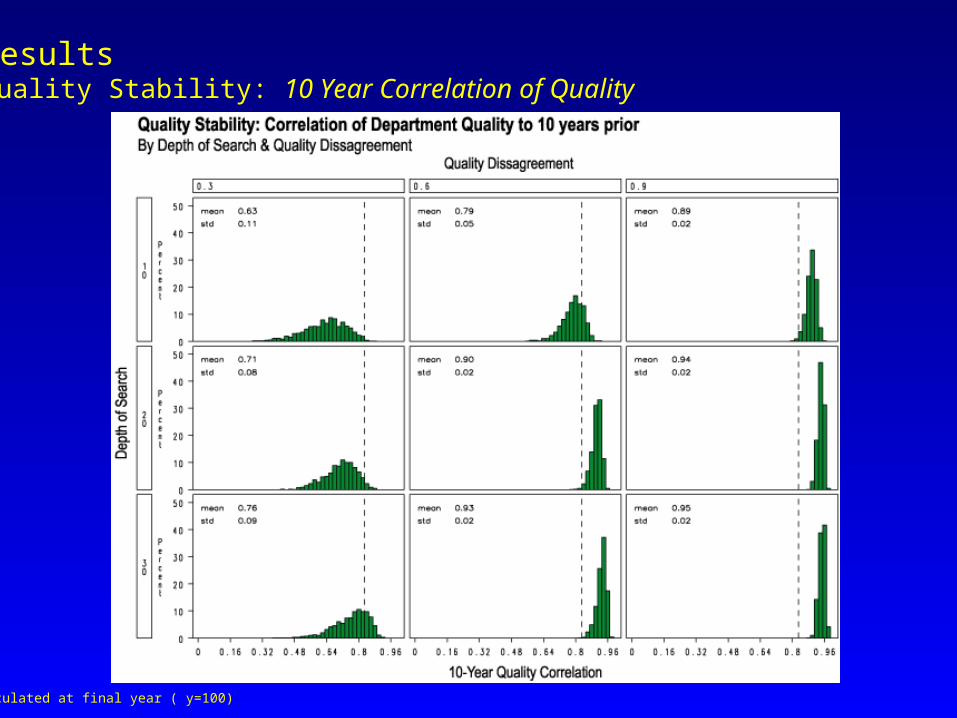
ResultsQuality Stability: 10 Year Correlation of Quality

Calculated at final year ( y=100)
ResultsDepartment Features Summary
Variable Jobs
Filled Mean Size
Mean Quality
Size/Qual Corr
Corr Stability
Intercept -0.54*** -44.99***
1.83*** 1.52*** 0.97*** 0.48***
Hire Curve -0.03***
-.17 1.84***
0.16 -0.045*** -0.10
-0.01*** -0.07
-0.013*** -0.07
0.004*** 0.04
Student Production 3.38***
0.13 200.87***
0.14 44.06*** 0.76
-5.23*** -0.23
-5.23*** -0.23
-1.23*** -0.09
Dept Disagreement on Students
0.80***
0.79 45.54***
0.79 -0.99*** -0.42
-0.47*** -0.52
0.447*** 0.49
0.38*** 0.75
Student Disagreement on Dept
0.01 0.002
0.22 0.001
0.008 0.001
-0.04*** -0.01
-0.04*** -0.01
-0.01 -0.01
Student Faculty Qual. Cor -0.02***
-0.02 0.006 0.00
-0.65*** -0.25
-0.007 -0.007
-0.007 -0.007
0.013*** 0.02
Depth of Search 0.02***
0.49 0.87***
0.51 -0.01*** -0.27
-0.01*** -0.50
0.014*** 0.53
0.005*** 0.35
Hiring Rounds 0.04***
0.09 2.40***
0.085 -0.05*** -0.04
-0.025*** -0.06
-0.025*** -0.057
0.025*** 0.10
Depth x Q. Disagree -0.046*** -1.51
R2 0.92 0.93 0.91 0.59 0.76 0.72
ResultsAcademic Castes?
The production and hiring of PhDs generates an exchange network, connecting the “sending” department to the hiring department.
I record this network for all hires in the last 10 years of the simulation history, and construct two measures:
a) The network centralization scoreb) The correlation between network centrality & quality & size.
10 years is conservative all of the centralization effects I describe below are stronger if you limit the network to the last 5 years (which is closer to what people have done in the literature).
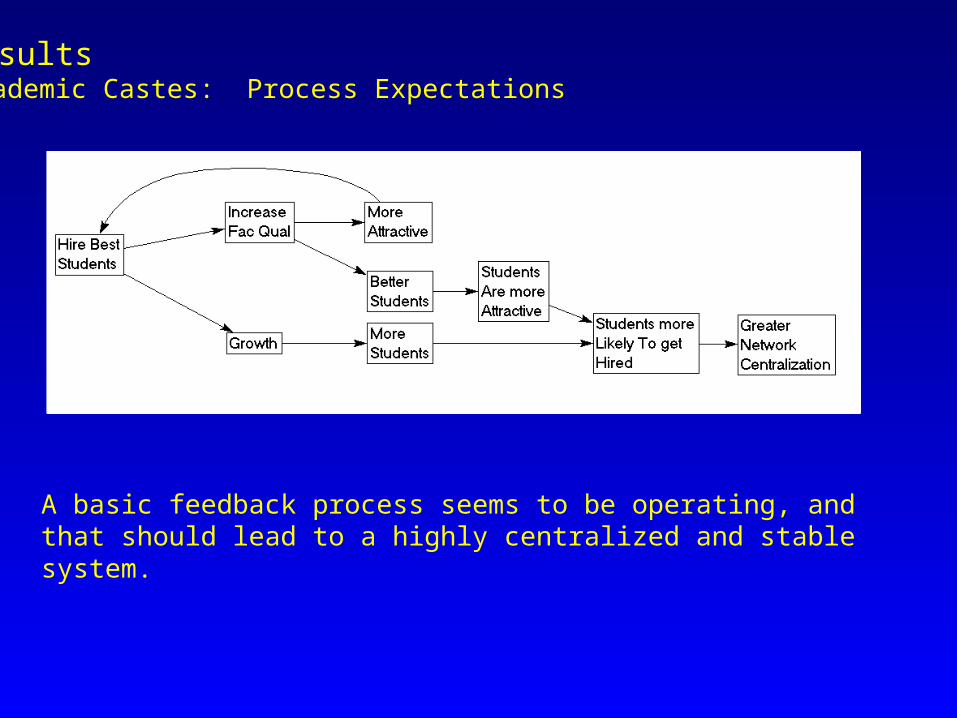
ResultsAcademic Castes: Process Expectations
A basic feedback process seems to be operating, and that should lead to a highly centralized and stable system.

ResultsAcademic Castes?
Disagreement on Candidate QualityD
epth
of
Sea
rch
For what follows, working within one region of the parameter space
A preliminary regression over the entire space shows that hiring rates & quality correlation matter most for centralization
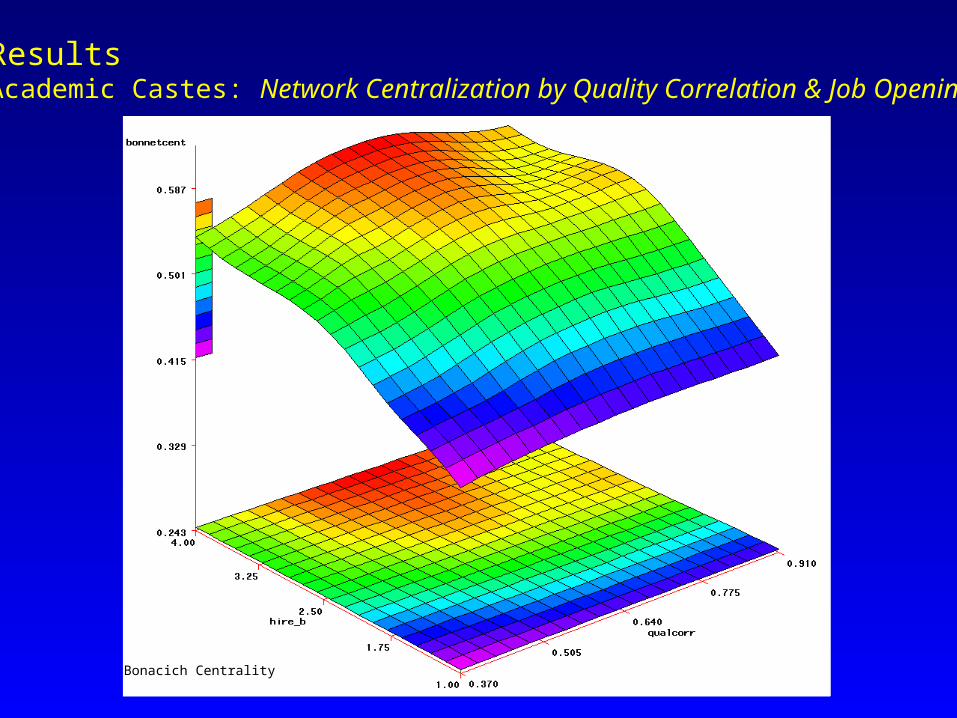
ResultsAcademic Castes: Network Centralization by Quality Correlation & Job Openings
Bonacich Centrality

ResultsAcademic Castes: Network Centralization by Quality Correlation & Job Openings
Degree Centralization
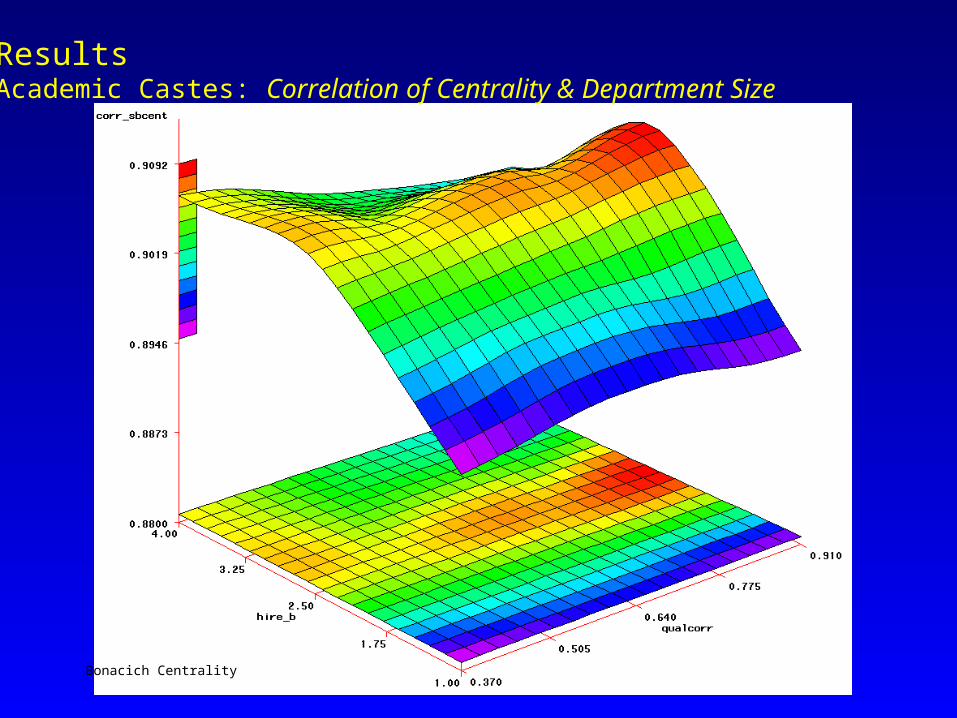
ResultsAcademic Castes: Correlation of Centrality & Department Size
Bonacich Centrality
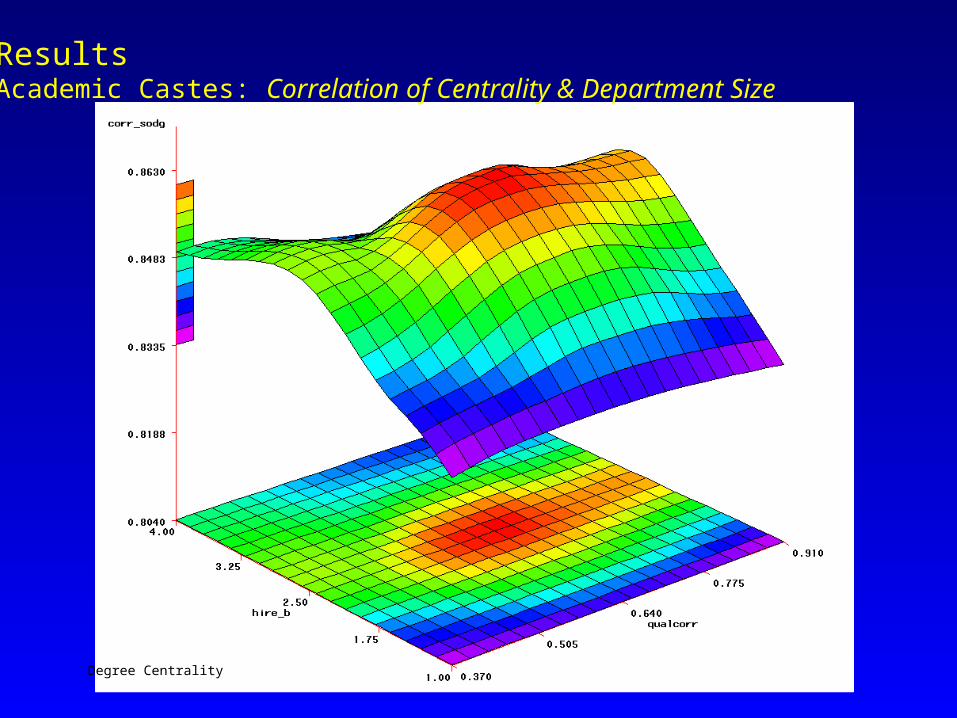
ResultsAcademic Castes: Correlation of Centrality & Department Size
Degree Centrality

ResultsAcademic Castes: Correlation of Centrality & Department Quality
Bonacich Centrality
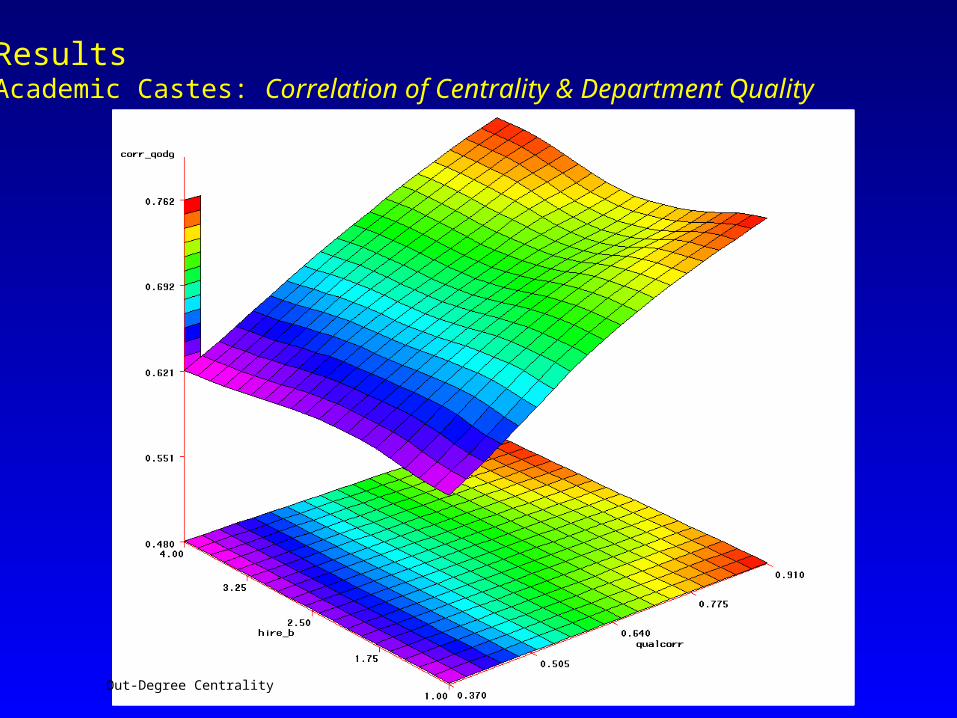
ResultsAcademic Castes: Correlation of Centrality & Department Quality
Out-Degree Centrality
Tentative Conclusions & ObservationsSummary: Market Effects
The very simple market model proposed here can account for many of the features we see in real PhD exchange markets:
a) Stable quality rankingsb) Strong Correlation between Size & Qualityc) Highly Centralized Networksd) Correlation between Quality ranking and Centralization
Though to be fair, this correlation is not as strong as reported empirically.
Qualitatively, it is appears that you can order most of these networks with a pretty clear distinction between “top” or “core” departments and a periphery, characterized by asymmetric flow of students.

Tentative ConclusionsSummary: Some Potential Mechanisms
There are two broad features that shape these networks.
1) Market competitionMarket competition factors (mainly agreement on quality & depth of search, but also simple student production & hiring rates) have a huge effect on the mean levels of department characteristics seen across the simulation settings.
• When the competition for students is high, offers converge on small numbers of market stars. This generates a “seller’s market,” where a small number of market stars dominate hiring patters, take jobs at the most prestigious institutions, leaving many departments with failed searches, and ultimately lowering the quality for the discipline as a whole.
This mechanism can account for much of the observed stability, growth and quality outcomes observed over the simulation runs
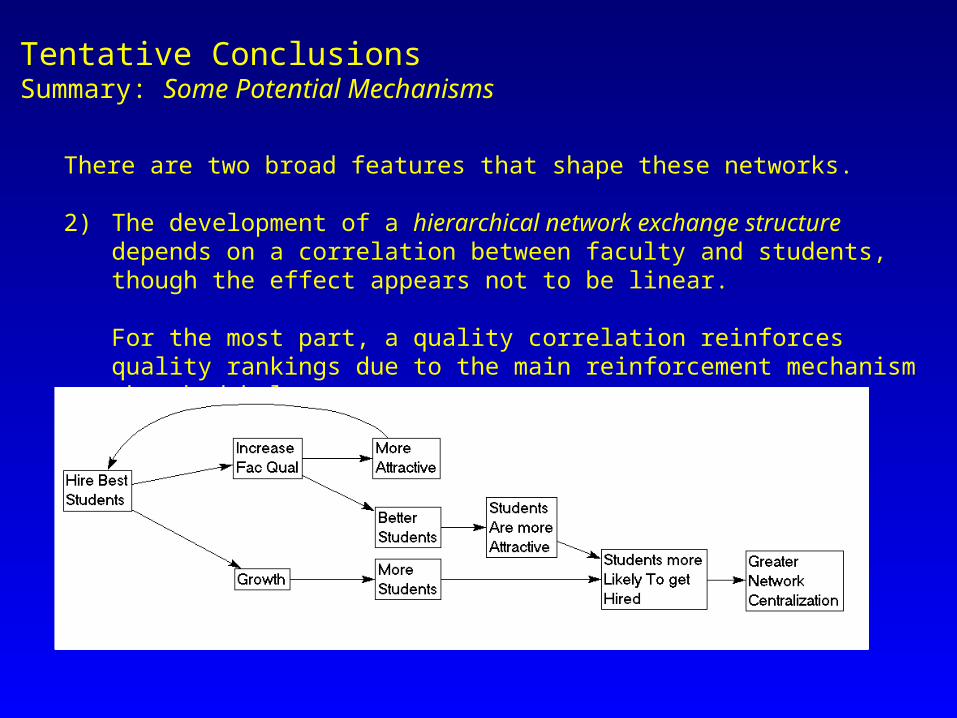
There are two broad features that shape these networks. 2) The development of a hierarchical network exchange structure depends on a
correlation between faculty and students, though the effect appears not to be linear.
For the most part, a quality correlation reinforces quality rankings due to the main reinforcement mechanism sketched below:
Tentative ConclusionsSummary: Some Potential Mechanisms

There are two broad features that shape these networks. 2) The development of a hierarchical network exchange structure depends on a
correlation between faculty and students, though the effect appears not to be linear.
But when the correlation is too high, the inequality in student production starts to dominate. This has the result of
(a) flooding the market with relatively low-quality students, that(b) has the effect of mirroring tight-market competition factors.
Since the hiring practices in this simulation were tied to quality ranks instead of cardinal values (or values relative to self), this means departments are forced by retirements to dig too deep in the pool, resulting in a lowering of overall relative quality, which then gets translated into lower centralization in the networks.
Tentative ConclusionsSummary: Some Potential Mechanisms

Tentative Conclusions & ObservationsSummary: Market Effects
There is still some room for non-market effects here, however, since the resulting hierarchies are not perfect:
a) Self-selection Effectsa) Students avoiding applying “out of their league”b) Adjusting depth of search to be linked to current quality
b) Social Network Effectsa) Burris Social Capital effect: Give a positive weight to students who
come from departments where current faculty originatedc) Reputation effects
a) Add a positive intercept shift in the perception of students who come from highly ranked departments