
Quality and Cost Analysis of Nurse Staffing, Discharge ... ARTICLE Quality and Cost Analysis of...
22
RESEARCH ARTICLE Quality and Cost Analysis of Nurse Staffing, Discharge Preparation, and Postdischarge Utilization Marianne E. Weiss, Olga Yakusheva, and Kathleen L. Bobay Objectives. To determine the impact of unit-level nurse staffing on quality of dis- charge teaching, patient perception of discharge readiness, and postdischarge readmis- sion and emergency department (ED) visits, and cost-benefit of adjustments to unit nurse staffing. Data Sources. Patient questionnaires, electronic medical records, and administrative data for 1,892 medical–surgical patients from 16 nursing units within four acute care hospitals between January and July 2008. Design. Nested panel data with hospital and unit-level fixed effects and patient and unit-level control variables. Data Collection/Extraction. Registered nurse (RN) staffing was recorded monthly in hours-per-patient-day. Patient questionnaires were completed before discharge. Thirty-day readmission and ED use with reimbursement data were obtained by cross- hospital electronic searches. Principal Findings. Higher RN nonovertime staffing decreased odds of readmission (OR 5 0.56); higher RN overtime staffing increased odds of ED visit (OR 5 1.70). RN nonovertime staffing reduced ED visits indirectly, via a sequential path through dis- charge teaching quality and discharge readiness. Cost analysis projected total savings from 1SD increase in RN nonovertime staffing and decrease in RN overtime of U.S.$11.64 million and U.S.$544,000 annually for the 16 study units. Conclusions. Postdischarge utilization costs could potentially be reduced by invest- ment in nursing care hours to better prepare patients before hospital discharge. Key Words. Hospital discharge, discharge readiness, readmission, emergency department utilization, cost Readmission and emergency department (ED) use within the first 30 days following hospital discharge represent adverse, potentially avoidable, and costly outcomes of hospitalization (Friedman and Basu 2004; Goldfield et al. 2008; Jencks, Williams, and Coleman 2009). The aims of this study were to determine the following: (1) the direct effect of nursing unit staffing r Health Research and Educational Trust DOI: 10.1111/j.1475-6773.2011.01267.x 1 Health Services Research
Transcript of Quality and Cost Analysis of Nurse Staffing, Discharge ... ARTICLE Quality and Cost Analysis of...

RESEARCH ARTICLE
Quality and Cost Analysis of NurseStaffing, Discharge Preparation, andPostdischarge UtilizationMarianne E. Weiss, Olga Yakusheva, and Kathleen L. Bobay
Objectives. To determine the impact of unit-level nurse staffing on quality of dis-charge teaching, patient perception of discharge readiness, and postdischarge readmis-sion and emergency department (ED) visits, and cost-benefit of adjustments to unit nursestaffing.Data Sources. Patient questionnaires, electronic medical records, and administrativedata for 1,892 medical–surgical patients from 16 nursing units within four acute carehospitals between January and July 2008.Design. Nested panel data with hospital and unit-level fixed effects and patient andunit-level control variables.Data Collection/Extraction. Registered nurse (RN) staffing was recorded monthlyin hours-per-patient-day. Patient questionnaires were completed before discharge.Thirty-day readmission and ED use with reimbursement data were obtained by cross-hospital electronic searches.Principal Findings. Higher RN nonovertime staffing decreased odds of readmission(OR 5 0.56); higher RN overtime staffing increased odds of ED visit (OR 5 1.70). RNnonovertime staffing reduced ED visits indirectly, via a sequential path through dis-charge teaching quality and discharge readiness. Cost analysis projected total savingsfrom 1 SD increase in RN nonovertime staffing and decrease in RN overtime ofU.S.$11.64 million and U.S.$544,000 annually for the 16 study units.Conclusions. Postdischarge utilization costs could potentially be reduced by invest-ment in nursing care hours to better prepare patients before hospital discharge.
Key Words. Hospital discharge, discharge readiness, readmission, emergencydepartment utilization, cost
Readmission and emergency department (ED) use within the first 30 daysfollowing hospital discharge represent adverse, potentially avoidable, andcostly outcomes of hospitalization (Friedman and Basu 2004; Goldfield et al.2008; Jencks, Williams, and Coleman 2009). The aims of this study wereto determine the following: (1) the direct effect of nursing unit staffing
r Health Research and Educational TrustDOI: 10.1111/j.1475-6773.2011.01267.x
1
Health Services Research

structure onpostdischarge utilization of readmissions and ED visits within30 days; (2) the indirect effect through its influence on the quality of dischargeteaching and patient’s perception of readiness for discharge; and (3) the cost-benefit of adjustments to unit-level nurse staffing on postdischarge utilization.
BACKGROUND
One in five Medicare patients was readmitted within 30 days after hospitaldischarge in 2003–2004. Ninety percent of these readmissions were un-planned. The cost of readmission has been estimated to exceed U.S.$17 billionannually ( Jencks, Williams, and Coleman 2009). Approximately 6.8 percentof patients discharged from hospitals in 2005–2006 visited EDs within 7 days,of which 31 percent were readmitted (Burt, McCaig, and Simon 2008).
Little is known about the relationship between nurse staffing duringhospitalization and postdischarge outcomes. However, there is a growing ev-idence base supporting the relationship between nurse staffing structure andwithin-hospitalization patient outcomes, primarily using staffing data aggre-gated to the hospital level (Aiken et al. 2002, 2003; Needleman et al. 2002;Cho et al. 2003; Seago, Williamson, and Atwood 2006; Kane et al. 2007). Twostudies of unit-level nurse staffing have found associations of nurse experiencewith inpatient medication errors (Blegen, Vaughn, and Goode 2001) andmortality (Van den Heede et al. 2009). Lower unit nurse staffing have beenassociated with higher inpatient care costs (Titler et al. 2005, 2007).
This study expands existing evidence by linking nurse staffing to post-discharge utilization. Unlike earlier studies that linked nurse staffing directly topatient outcomes in a reduced-form approach, this study estimates a structuralmodel, based on Donabedian’s (1966) quality model, that includes a corenursing process (discharge teaching) as an explanatory link between unitstaffing structure and patient outcomes at discharge (readiness for discharge) andbeyond hospitalization (readmissions and ED visits within 30 days).
Address correspondence to Marianne E. Weiss, D.N.Sc., R.N., Associate Professor and Wheaton-Franciscan Healthcare/Sister Rosalie Klein Professor of Women’s Health, Marquette UniversityCollege of Nursing, PO Box 1881 Milwaukee, WI 53201-1881; e-mail: [email protected]. Olga Yakusheva, Ph.D., Assistant Professor, is with the Department of Economics,Marquette University College of Business Administration, Milwaukee, WI. Kathleen L. Bobay,Ph.D., R.N., Associate Professor, is with the Marquette University College of Nursing, Milwaukee,WI.
2 HSR: Health Services Research xx:xx

Poor discharge preparation contributes to readmissions to the hospital(Mistiaen, Francke, and Poot 2007; Jack et al. 2009). Patients and their familycaregivers often perceive they are not adequately prepared for discharge andattribute postdischarge problems to their unmet informational needs (Mamonet al. 1992; Reiley et al. 1996; Driscoll 2000; Henderson and Zernike 2001).Quality of discharge teaching provided by nurses has been associated withpatient perception of discharge readiness (Weiss et al. 2007) and both have beenassociated with readmission (Koelling et al. 2005; Weiss et al. 2007). Whilereasons for readmission are multifactorial and influenced by complex and in-teracting comorbidities (Anderson et al. 2006; Strunin, Stone, and Jack 2007),many readmissions within 30 days are viewed as preventable and consideredfailures of discharge processes (Goldfield et al. 2008; Minott 2008).
Current efforts to improve hospital discharge are focused on establishingevidence-based physician and health team practices using discharge transitionmodels that include discharge advocates (Greenwald, Denham, and Jack2007; Jack et al. 2009), transition coaches (Coleman et al. 2008), advancedpractice nurses (Naylor et al. 1999), and community-based services (Grimmer,Moss, and Falco 2004; Center for Allied Health Evidence 2010) to assist withcare coordination, negotiating the complexities of the health system, and sur-veillance. These models have demonstrated promising results in terms ofreductions in adverse outcomes, postdischarge utilization, and associated costsin elderly patients and others at high risk for readmission. In many hospitals,however, the staff nurse, the focus of this study, is the front-line interface withpatients and has responsibility for discharge teaching and other dischargepreparation processes (Nosbusch, Weiss, and Bobay 2011).
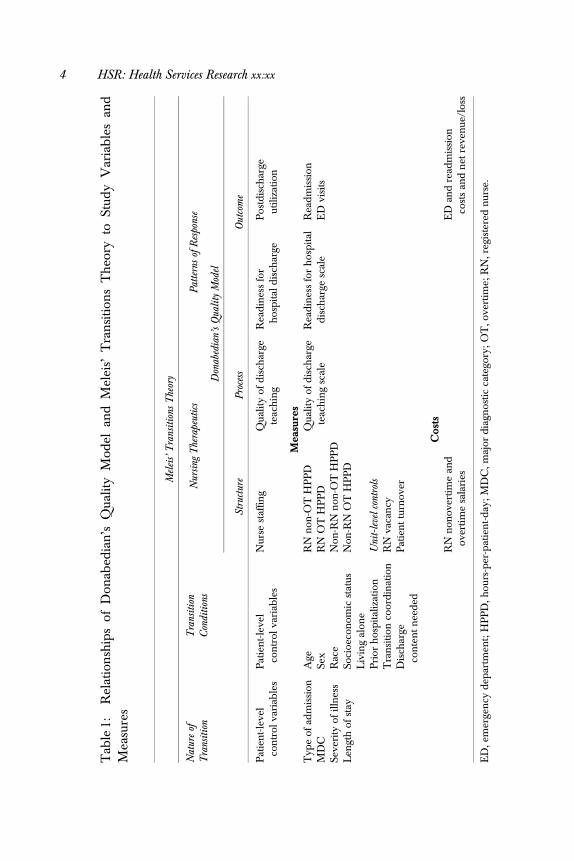
Meleis’ Transitions Theory (2000) provides additional insights for con-ceptualizing the discharge process and its outcomes. The nature of the tran-sition (type, pattern, properties), the conditions that facilitate or inhibit theperson’s transitional journey, and nursing therapeutic practices impact pat-terns of response, or outcomes. In this study, nursing therapeutics includes thestructure within which nurses practice and the processes of care that are directlydelivered to the patient. ‘‘Nature of the transition’’ and ‘‘transition condition’’variables serve as control variables. Table 1 specifies the theoretical concepts,study variables, and empirical measures.
In addition to the conceptual strength, this study has several method-ological advantages. Unit-level nurse staffing data better reflects the reality ofpoint-of-service patient care than hospital-aggregate data (Lake and Friese2006). Modeling the impact of variations in staffing within nursing units overtime strengthens causal inference compared to earlier cross-sectional studies.
Quality and Cost Analysis of Nurse Staffing 3
Tab
le1:
Rel
atio
nsh
ips
ofD
onab
edia
n’s
Qua
lity
Mod
elan
dM
elei
s’T
ran
siti
ons
Th
eory
toSt
udy
Var
iab
les
and
Mea
sure
s
Mel
eis’
Tra
nsit
ions
The
ory
Nat
ure
ofT
rans
itio
nT
rans
itio
nC
ondi
tion
sN
ursi
ngT
hera
peut
ics
Pat
tern
sof
Res
pons
e
Don
abed
ian’
sQ
ualit
yM
odel
Stru
ctur
eP
roce
ssO
utco
me
Pat
ien
t-le
vel
con
trol
vari
able
sP
atie
nt-
leve
lco
ntr
olva
riab
les
Nur
sest
affin
gQ
ualit
yof
dis
char
gete
ach
ing
Rea
din
ess
for
hos
pit
ald
isch
arge
Pos
tdis
char
geut
iliza
tion
Mea
sure
sT
ype
ofad
mis
sion
Age
RN
non
-OT
HP
PD
Qua
lity
ofd
isch
arge
teac
hin
gsc
ale
Rea
din
ess
for
hos
pit
ald
isch
arge
scal
eR
ead
mis
sion
MD
CSe
xR
NO
TH
PP
DE
Dvi
sits
Seve
rity
ofill
nes
sR
ace
Non
-RN
non
-OT
HP
PD
Len
gth
ofst
aySo
cioe
con
omic
stat
usN
on-R
NO
TH
PP
DL
ivin
gal
one
Pri
orh
osp
ital
izat
ion
Uni
t-le
velc
ontr
ols
Tra
nsi
tion
coor
din
atio
nR
Nva
can
cyD
isch
arge
con
ten
tn
eed
edP
atie
nt
turn
over
Cost
sR
Nn
onov
ertim
ean
dov
erti
me
sala
ries
ED
and
read
mis
sion
cost
san
dn
etre
ven
ue/l
oss
ED
,em
erge
ncy
dep
artm
ent;
HP
PD
,hou
rs-p
er-p
atie
nt-
day
;M
DC
,maj
ord
iagn
ostic
cate
gory
;O
T,o
vert
ime;
RN
,reg
iste
red
nur
se.
4 HSR: Health Services Research xx:xx

Estimation of quality and cost implications permits identification of potentialbenefits to investment in hospital nurse labor within current and emergingpayment models.
METHODS
Within a prospective, longitudinal, observational design, a nested multilevelpanel data approach was used to test direct and indirect sequential relation-ships between unit-level nurse staffing variables, patient-reported quality ofdischarge teaching process, patient-reported readiness for hospital discharge,and postdischarge utilization of readmission and ED visits and related cost-benefit.
Sample and Setting
The sampling goal was to obtain a study sample representing the spectrum ofpatients admitted to acute care hospitals for medical–surgical conditions.Sample selection criteria were at least 18 years of age, spoke English or Span-ish, hospitalized on a medical–surgical unit, and discharged directly homewith or without home health services and without hospice care. Equivalentnumbers of subjects were randomly selected within each of 16 participatingmedical–surgical units of four hospitals within a single health care system inthe Midwestern United States. The health system has been recognized by theAmerican Nurses Credentialing Center’s Magnet Recognition Program forexcellence in professional nursing practice. The target sample size of 110patients per unit, for a total of 1,760 patients, was estimated to provide 80percent power at 0.05 significance in estimating the impact of nurse staffingvariables on discharge process and subsequent outcome measures (Bosker,Snijders, and Guldemond 2003).
A total of 4,050 patients were prescreened as eligible, of whom 395 (9.8percent) were deemed ineligible due to insufficient English or Spanish lan-guage proficiency, lack of decisional capacity without presence of a familycaregiver, admission for observation only, or unavailable for enrollment, and1,616 (39.9 percent) refused participation. Of the 2,039 who enrolled, 128 (6.3percent) later became ineligible due to discharge to a destination other thanhome, 12 (0.6 percent) were duplicate enrollees within 30 days (the secondenrollment was recoded as readmission), and 7 (0.3 percent) withdrew. Thefinal sample included 1,892 patients for whom complete data were availableon nurse staffing and readmission variables. Of the 1,892, 1,458 (77.1 percent)
Quality and Cost Analysis of Nurse Staffing 5

completed the Quality of Discharge Teaching Scale (QDTS) and 1,449 (76.6percent) completed the Readiness for Hospital Discharge Scale (RHDS).Sample characteristics are presented in Table 2.
Study Variables and Measures
Unit-level nurse staffing structure variables were obtained from administrativedata routinely collected for submission to the National Database of NursingQuality Indicators. Variables reported monthly as hours-per-patient-day in-cluded the following: registered nurse (RN) nonovertime staffing and non-RNnonovertime staffing (productive nonovertime hours worked by RN and non-RN unit staff with direct patient care responsibilities, divided by inpatientdays); and RN and non-RN overtime staffing (RN and non-RN overtimehours divided by inpatient days).
Discharge teaching was defined as the composite of teaching occurringduring the hospitalization to prepare the patient and family for discharge. TheQDTS (Weiss et al. 2007) is a patient self-report measure that uses an 11-point(0 to10) scale format to record patients’ perceptions about the quality of dis-charge teaching received from their nurses during the course of dischargepreparation. For this study, it served as a measure of the nursing process ofdischarge teaching as received by the patient. Two ‘‘content’’ subscales of sixpaired items measure the amount of ‘‘content needed’’ and ‘‘content received’’related to information about managing care at home after discharge. The‘‘delivery’’ subscale consists of 12 items measuring perceptions about the skillof nurses as educators (e.g., listening, answering concern, consistence, timing,promoting confidence) in presenting discharge teaching to the patient andfamily. Higher scores indicate greater amount of discharge-related informa-tion needed and received and higher quality approach used to ‘‘deliver’’ dis-charge preparation content.
For this study sample, Cronbach’s a reliability estimates were 0.86, 0.85,and 0.93 for the three subscales, respectively. Confirmatory factor analysis pro-vided further evidence of construct validity to the results of prior testing (Weisset al. 2007). Because ‘‘content received’’ and ‘‘delivery’’ subscales had differentpredictive relationships with readiness for discharge in the prior study, thesubscales were included separately as primary variables in the analysis model.The ‘‘content needed’’ subscale was used as a patient-level control variable.
The RHDS (Weiss and Piacentine 2006; Weiss et al. 2007) measurespatient perception of readiness to go home from the hospital on a 21-item scaleusing a 0–10 rating format. Higher scores indicate greater perceived readiness.
6 HSR: Health Services Research xx:xx

Table 2: Sample Characteristics (N 5 1,892)
Mean SD
Staffing variablesRN nonovertime staffingn 5.0 0.8Non-RN nonovertime staffingn 3.8 0.7RN overtime staffingn 0.2 0.1Non-RN overtime staffingn 0.1 0.1
Discharge process variablesQuality of Discharge Teaching Scale (QDTS):
‘‘Content received’’ subscale (0–10w) 5.0 2.7‘‘Delivery’’ subscale (0–10w) 7.8 2.1
Outcome variablesReadiness for Hospital Discharge Scale (RHDS)
(0–10w)8.0 1.4
n %
ED visits only (unplanned/related) 80 4.2Readmission (unplanned/related) 183 9.7Any unplanned/related postdischarge
occurrence (ED or readmission)263 13.9
Mean SD
Unit control variablesAdmission–discharge ratio 0.02 0.01RN vacancy rate 10.3 8.1
Patient control variablesQDTS 4.0 2.6
‘‘Content needed’’ subscale (0–10w)Age (range 18–102) 58.2 16.8Socioeconomic statusz (8–66w) 36.9 13.1Length of stay (range 1–46) 4.3 3.8
n %
Sex: male 856 45.2Race:
White 1486 80.4Black 247 13.4Hispanic 78 4.2Other 38 2.0
Prior hospitalization for same condition 796 42.1Transition coordination§ 679 35.9
continued
Quality and Cost Analysis of Nurse Staffing 7

The scale includes four dimensions of discharge readiness: personal status——how the patient is feeling on the day of discharge; knowledge——how much thepatient knows about discharge-related topics; perceived coping ability——howwell the patient expects to be able to handle medical and nonmedical de-mands at home; and expected support——the amount of emotional and tan-gible support the patient expects to have after discharge. For this study sample,the Cronbach’s a reliability estimate was 0.90 and confirmatory factor analysissupported the a priori scale structure (Weiss and Piacentine 2006).
Postdischarge utilization of ED visits and readmissions within 30 days wasextracted from electronic hospital information systems. Encounters were re-viewed by three reviewers and were included in the analysis if they wereunplanned and related to the primary diagnosis or a comorbidity of the indexhospitalization. Because readmissions and ED visits without readmission onthe same encounter have different implications for patient well-being, re-source use, and costs, the two types of encounters were examined separately.To assess completeness of readmission and ED visit data, a telephone inter-view was conducted at 31 days postdischarge with a 10 percent random sam-ple of study participants. Of 138 contacted, one readmission and one ED visitto a nonstudy hospital were identified (1.4 percent).
Patient turnover, measured as admission–discharge ratio ([admis-sions1discharges]/patient days), and RN vacancy rate (ratio of vacant tobudgeted RN full-time equivalent positions [FTEs]) were included as unit-levelcontrol variables to account for differences in patient flow and underlyingstaffing insufficiency that could impact the delivery of care processes andoutcomes. Patient-level control variables included demographics (sex, age, race,
Severity of illness:1 (minor) 456 24.12 (moderate) 776 41.03 (major) 548 29.04 (extreme) 112 5.9
Medical type (nonsurgical) admission 843 44.6Lives alone 448 26.2
nMeasured in hours-per-patient day.wTheoretical and actual range of scores.zSocioeconomic status——Hollingshead Four Factor Index of Social Status.§Transition coordination includes case manager, care coordinator, community services assessmentand/or referral, home health referral.
Table 2. Continued
n %
8 HSR: Health Services Research xx:xx

socioeconomic status [Hollingshead 1975], living alone), clinical condition(major diagnostic category, type of admission [medical, surgical], severity ofillness), and resource utilization (previous hospitalization, transition coordi-nation, length of stay) (Corrigan and Martin 1992; McCusker et al. 2000;Phillips et al. 2004; Anderson et al. 2006; Billings et al. 2006; Van Walravenet al. 2010). Socioeconomic status and living alone were self-reported by thepatient. All other variables were extracted from hospital information systems.Transition coordination was coded as present if a discharge transition supportservice (e.g. case manager, discharge coordinator, home health referral, com-munity services assessment/referral) was recorded.
Cost and reimbursement data for postdischarge encounters were obtainedfrom hospital cost accounting systems. Data were extracted at least 120 dayspostencounter to assure costs and reimbursement had been posted.
Data Collection Procedures
The study protocol was approved by university and health system InstitutionalReview Boards. Data were collected between January and July 2008. Using awithin-unit randomization procedure, eligible patients were contacted bystudy research assistants. Informed consent was obtained on the day before orday of discharge. QDTS and RHDS were given to study patients within 4hours before discharge by the research assistants or unit staff (using remindertriggers). Readmission and ED data for eligible encounters at any of the fourstudy hospitals were extracted through cross-hospital electronic searchingwith multiple patient identifiers.
Analysis Methods
Stata Statistical Software Version 11.0 (Stata Corporation 2009) was used forstatistical analyses. Patient and unit-level data were matched by date of dis-charge. Missing data on QDTS and RHDS were mean-substituted if morethan 50 percent of item responses were completed. Designed as a system offour simultaneous recursive equations (Appendix SA2), the estimation modelallowed testing of direct and indirect relationships among variables that ap-pear in more than one equation. To reflect the sequential nature of the re-lationships, outcome variables became predictor variables in all subsequentequations. Linear regression equations for quality of discharge teaching (equa-tion [1]: QDTS ‘‘content received’’ and equation [2]: QDTS ‘‘delivery’’)included the four unit-level nurse staffing variables (RN and non-RN non-overtime and overtime hours-per-patient-day) as predictor variables. Linear
Quality and Cost Analysis of Nurse Staffing 9

regression equation for Readiness for Hospital Discharge (equation [3]) in-cluded nurse staffing and the QDTS variables as predictors. Multinomial lo-gistic regression equation for readmission and ED visits (equation [4]) includednurse staffing, QDTS, and RHDS as predictors. All models included patientand unit-level control variables in order to determine the independentinfluence of the primary variables of interest. The panel structure of the datawas modeled by including hospital-level and unit-level fixed effects in allmodels, as well as a linear time trend, which eliminated the influence ofbetween-unit variance in the study variables and allowed estimation of therelationship between the study variables within-unit over-time. This proceduremakes the estimation robust to confounding that could result from not fullycontrolling for unobserved underlying differences among the study units. Thefull model was estimated with robust standard errors using the seeminglyunrelated estimation technique [suest command], which accounted for thepossibility of interdependence of individual observations that arise from theclustered multilevel data structure, and for the interrelated nature of the errorterms between the equations.
Direct and the indirect relationships among the study variables wereestimated with regression coefficients from equations (1), (2), and (3). For thelogistic model (equation [4]), the coefficients were replaced with average mar-ginal effects (ME) (i.e. the average marginal change in the probability of post-discharge utilization for a unit change in the predictor variable), calculatedusing the margins command. Indirect effects were calculated through recur-sive substitution using estimated coefficients from multiple equations. Indi-vidual coefficients and their combinations were tested using standardnonlinear hypothesis testing techniques and the variance–covariance matrixof regression coefficients that includes both within- and between-equationsparameter covariances.
A cost-benefit analysis estimated the total financial impact of modifyingnurse staffing to improve postdischarge utilization. The cost basis for nursestaffing variables was derived from the 2008 average hourly cost of compen-sation, including salary and benefits, from the Bureau of Labor Statistics (USDepartment of Labor 2009). RN hourly compensation was U.S.$45.83 (salary,U.S.$31.66; benefits, U.S.$14.17) and non-RN hourly compensation wasU.S.$29.66 (salary, U.S.$19.28; benefits, U.S.$10.38). Cost of overtime wascalculated as 1.5 times the hourly salary without benefits. Costs associated withreadmission and ED visits were calculated from actual cost and reimburse-ment data for these encounters derived from the study health system’s costaccounting system.
10 HSR: Health Services Research xx:xx
Staffing costs and postdischarge utilization costs were estimated on aper-patient basis for the index hospitalization (n 5 1,892). The estimated per-patient costs of additional staffing were calculated for a 1 SD increase in non-overtime and overtime hours-per-patient-day multiplied by the length of stay.These staffing costs were combined with the expected per-patient reduction inthe hospital’s revenue margin (reimbursement for postdischarge utilizationminus its cost) derived from the predicted magnitude of reduction (ME) inreadmission and ED visits to obtain the total per-patient financial impact onthe hospital. Payer cost savings per hospitalized patient were estimated bycalculating the expected reduction in reimbursement payments for readmis-sion and ED visits (ME times reimbursement for each encounter type, re-spectively). Annual patient volume for the l6 units participating in the studywas estimated and annual net potential cost savings were calculated.
RESULTS
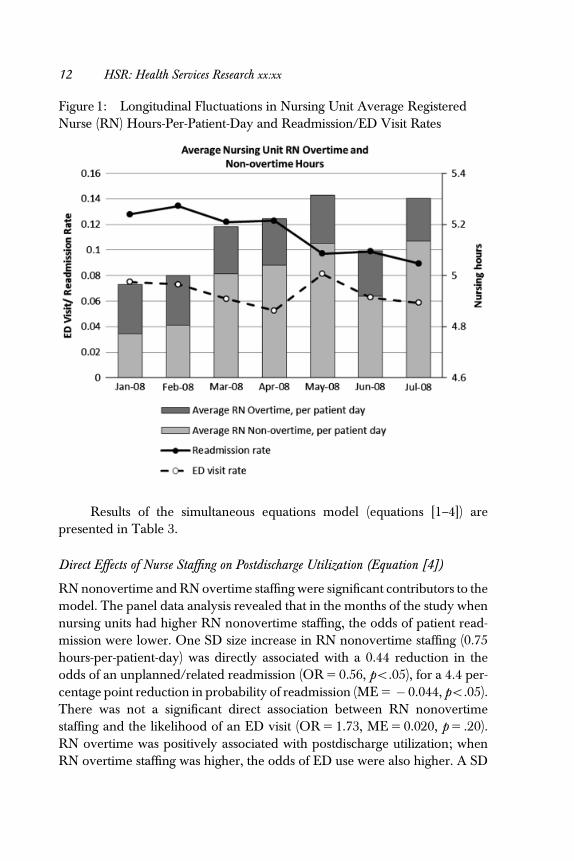
Descriptive statistics for primary study variables and patient and unit-levelcontrol variables are reported in Table 2. On average, patients received 9.1total hours of combined RN and non-RN care (nonovertime and overtime),comprised predominantly of regular (nonovertime) hours. Few overtimehours were used during the study period, a reflection of cost-containmentefforts. Fluctuations in average unit RN staffing and postdischarge utilizationrates over the 7-month study period are displayed in Figure 1.
Patients generally rated the quality of their discharge teaching as rela-tively high, with the ‘‘delivery’’ of teaching rated at 7.8 (SD 5 2.1) out of 10.The amount of discharge teaching ‘‘content received’’ was rated at the mid-point of the 0–10 scale (mean 5 5.0, SD 5 2.7), exceeding the amount ofteaching patients reported needing (QDTS ‘‘content needed’’ 5 4.0,SD 5 2.6). Patients reported high levels of readiness for discharge with ascale mean of 8.0 (SD 5 1.4) out of 10.
The 30-day all-cause readmission rate for the sample was 11.9 percent(n 5 225) of which 9.7 percent (n 5 183) were unplanned and related to theprimary diagnosis or a comorbidity of the index hospitalization. In addition,5.1 percent (n 5 96) of patients had ED visits without readmission in the sameperiod, of which 4.2 percent, (n 5 80) were unplanned and related. These ratesare lower than reported in population samples that exclude patients o65years and/or include encounters for other than adult medical–surgical con-ditions and discharges to long-term and continuing care facilities (Burt,McCaig, and Simon 2008; Jencks, Williams, and Coleman 2009).
Quality and Cost Analysis of Nurse Staffing 11
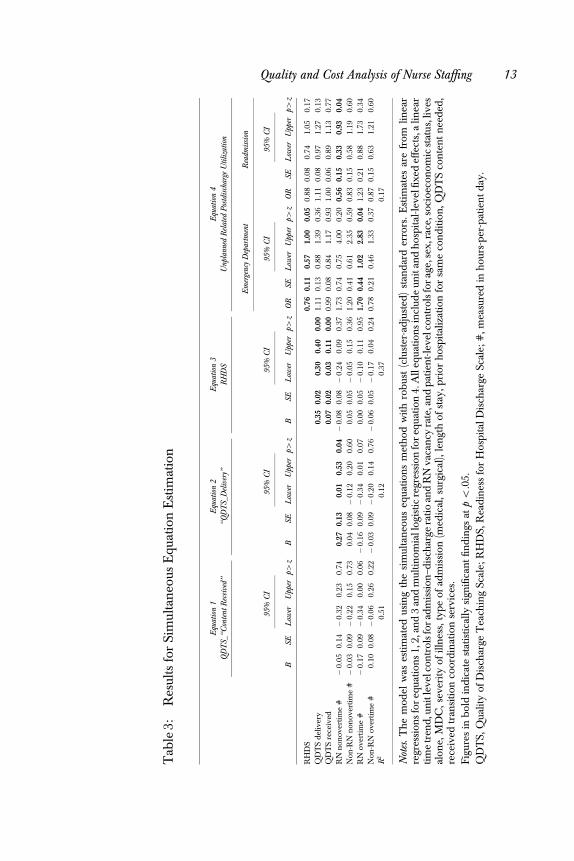
Results of the simultaneous equations model (equations [1–4]) arepresented in Table 3.
Direct Effects of Nurse Staffing on Postdischarge Utilization (Equation [4])
RN nonovertime and RN overtime staffing were significant contributors to themodel. The panel data analysis revealed that in the months of the study whennursing units had higher RN nonovertime staffing, the odds of patient read-mission were lower. One SD size increase in RN nonovertime staffing (0.75hours-per-patient-day) was directly associated with a 0.44 reduction in theodds of an unplanned/related readmission (OR 5 0.56, po.05), for a 4.4 per-centage point reduction in probability of readmission (ME 5 � 0.044, po.05).There was not a significant direct association between RN nonovertimestaffing and the likelihood of an ED visit (OR 5 1.73, ME 5 0.020, p 5 .20).RN overtime was positively associated with postdischarge utilization; whenRN overtime staffing was higher, the odds of ED use were also higher. A SD
Figure 1: Longitudinal Fluctuations in Nursing Unit Average RegisteredNurse (RN) Hours-Per-Patient-Day and Readmission/ED Visit Rates
12 HSR: Health Services Research xx:xx
Tab
le3:
Res
ults
for
Sim
ulta
neo
usE
quat
ion
Est
imat
ion
Equ
atio
n1
Equ
atio
n2
Equ
atio
n3
Equ
atio
n4
QD
TS_
‘‘Con
tent
Rec
eive
d’’
‘‘QD
TS_
Del
iver
y’’
RH
DS
Unp
lann
edR
elat
edP
ostd
isch
arge
Uti
lizat
ion
BSE
95%
CI
p4z
BSE
95%
CI
p4z
BSE
95%
CI
p4z
Em
erge
ncy
Dep
artm
ent
Rea
dmis
sion
OR
SE
95%
CI
p4z
OR
SE
95%
CI
p4z
Low
erU
pper
Low
erU
pper
Low
erU
pper
Low
erU
pper
Low
erU
pper
RH
DS
0.76
0.11
0.57
1.00
0.05
0.88
0.08
0.74
1.05
0.17
QD
TS
del
iver
y0.
350.
020.
300.
400.
001.
110.
130.
881.
390.
361.
110.
080.
971.
270.
13Q
DT
Sre
ceiv
ed0.
070.
020.
030.
110.
000.
990.
080.
841.
170.
931.
000.
060.
891.
130.
77R
Nn
onov
ertim
e#
�0.
050.
14�
0.32
0.23
0.74
0.27
0.13
0.01
0.53
0.04�
0.08
0.08�
0.24
0.09
0.37
1.73
0.74
0.75
4.00
0.20
0.56
0.15
0.33
0.93
0.04
Non
-RN
non
over
tim
e#�
0.03
0.09�
0.22
0.15
0.73
0.04
0.08�
0.12
0.20
0.60
0.05
0.05�
0.05
0.15
0.36
1.20
0.41
0.61
2.35
0.59
0.83
0.15
0.58
1.19
0.60
RN
over
tim
e#
�0.
170.
09�
0.34
0.00
0.06�
0.16
0.09�
0.34
0.01
0.07
0.00
0.05�
0.10
0.11
0.95
1.70
0.44
1.02
2.83
0.04
1.23
0.21
0.88
1.73
0.34
Non
-RN
over
tim
e#
0.10
0.08�
0.06
0.26
0.22�
0.03
0.09�
0.20
0.14
0.76�
0.06
0.05�
0.17
0.04
0.24
0.78
0.21
0.46
1.33
0.37
0.87
0.15
0.63
1.21
0.60
R2
0.51
0.12
0.37
0.17
Not
es.
Th
em
odel
was
esti
mat
edus
ing
the
sim
ulta
neo
useq
uatio
ns
met
hod
wit
hro
bus
t(c
lust
er-a
dju
sted
)st
and
ard
erro
rs.
Est
imat
esar
efr
omlin
ear
regr
essi
ons
for
equa
tion
s1,
2,an
d3
and
mul
tin
omia
llog
istic
regr
essi
onfo
req
uati
on4.
All
equa
tion
sin
clud
eun
itan
dh
osp
ital
-lev
elfix
edef
fect
s,a
linea
rti
me
tren
d,u
nit
leve
lcon
trol
sfo
rad
mis
sion
–dis
char
gera
tio
and
RN
vaca
ncy
rate
,an
dp
atie
nt-
leve
lcon
trol
sfo
rag
e,se
x,ra
ce,s
ocio
econ
omic
stat
us,l
ives
alon
e,M
DC
,sev
erit
yof
illn
ess,
typ
eof
adm
issi
on(m
edic
al,s
urgi
cal),
len
gth
ofst
ay,p
rior
hos
pit
aliz
atio
nfo
rsa
me
con
diti
on,Q
DT
Sco
nte
nt
nee
ded
,re
ceiv
edtr
ansi
tion
coor
din
atio
nse
rvic
es.
Fig
ures
inb
old
ind
icat
est
atis
tical
lysi
gnifi
can
tfin
din
gsat
po
.05.
QD
TS,
Qua
lity
ofD
isch
arge
Tea
chin
gSc
ale;
RH
DS,
Rea
din
ess
for
Hos
pit
alD
isch
arge
Scal
e;#
,mea
sure
din
hou
rs-p
er-p
atie
nt
day
.
Quality and Cost Analysis of Nurse Staffing 13

size increase in RN overtime staffing (0.07 hours-per-patient-day) was directlyassociated with a 0.70 increase in the odds of an ED visit (OR 5 1.70, po.05),or a 1.7 percentage point increase in the probability of an ED visit(ME 5 0.017, po.05). No direct effects were observed between non-RNstaffing and postdischarge utilization.
Indirect Sequential Effect of Nurse Staffing on Utilization through QDTS and RHDS(Equations [1–4])
There was a path of significant associations from RN staffing to patient-re-ported quality of discharge teaching, from quality of discharge teaching topatient-reported discharge readiness, and from discharge readiness to postdis-charge ED use. While the association between nurse staffing variables andquality of discharge teaching (QDTS) ‘‘content received’’ subscale was non-significant (equation [1]), a SD size increase in RN nonovertime staffing wassignificantly associated with a 0.27 (p 5o.05) higher score (on a 10-point scale)on the quality of discharge teaching (QDTS) ‘‘delivery’’ subscale (equation [2]).A 1-point increase (out of 10) in the mean QDTS ‘‘delivery’’ subscale score wasassociated with 0.35-point (po.001) increase in the mean discharge readiness(RHDS) score (equation [3]). The amount of discharge information (QDTS‘‘content received’’ subscale) was also significantly but less strongly associatedwith discharge readiness (a 1-point higher QDTS ‘‘content received’’ scoreincreased RHDS by 0.07 points [po.001]) (equation [3]). Higher dischargereadiness scores were in turn associated with 0.24 lower odds of an ED visit(OR 5 0.76, p 5 .05) (equation [4]). No effects were observed for RN overtimestaffing or non-RN staffing on quality of discharge teaching or discharge readi-ness. Importantly, quality of discharge teaching scores was not significantlyassociated with postdischarge utilization, suggesting a path of influence fromquality of discharge teaching to the proximate outcome of patient’s perceptionof discharge readiness, which is then associated with ED use.
Cost-Benefit Analysis
A cost-benefit analysis of modifying nurse staffing was performed for the twostaffing variables with significant impact on postdischarge utilization. Increas-ing RN nonovertime staffing by 1 SD (0.75 hours-per-patient-day) was esti-mated to have a negative impact on hospitals of U.S.$197.92 per hospitalizedpatient (sum of increased RN staffing costs, U.S.$145.74, and loss of revenuefrom reduced readmissions, U.S.$52.18, per hospitalized patient), while sav-ing payers U.S.$607.51 per hospitalized patient from reduced postdischarge
14 HSR: Health Services Research xx:xx

utilization, for a net potential savings of U.S.$409.59 per hospitalized patient.Likewise, reducing RN overtime staffing by 1 SD (0.07 hours-per-patient-day)was estimated to result in savings to hospitals of U.S.$8.18 per hospitalizedpatient derived from offsetting reduced revenue from ED visits with reducedovertime salary costs. Reduced utilization of ED visits would benefit payers inthe amount of U.S.$10.98 per hospitalized patient, for a net potential savingsof U.S.$19.16 per hospitalized patient.
For the 16 units included in the study, the annualized estimated net costsavings is U.S.$11.64 million from investment in additional RN nonovertimestaffing and U.S.$544,000 from reducing RN overtime staffing, although costsaccrue to hospitals and savings to payers in current payment models.
DISCUSSION
The findings of this study add to the substantial body of work on the impact ofnurse staffing on inpatient care outcomes by (1) documenting the impact ofhospital nursing care beyond hospital discharge; (2) linking unit-level staffingto quality of a nursing care process (discharge teaching), and to outcomes atdischarge (readiness) and postdischarge (utilization); (3) estimating the costsand savings associated with investment in nurse staffing. The use of unit-levelstaffing data measured within-unit over time and inclusion of structure andprocess measures provides stronger evidence of a link to patient outcomes andcost-benefit than in prior cross-sectional studies that used between-unit orbetween-hospital comparisons.
In this study sample, there was a direct, negative association betweenRN hours to which patients were exposed during hospitalization and the oddsof subsequent readmission. Among patients hospitalized on the same nursingunit, those who were discharged when RN nonovertime staffing was higherwere less likely to subsequently be readmitted. When RN overtime staffingwas higher, the odds of postdischarge occurrence of ED visits increased, con-sistent with previous findings that nurses’ performance may be suboptimal inextended work hour situations (Rogers et al. 2004). Variation in amount ofnon-RN staffing did not explain postdischarge utilization, pointing to the im-portance of the amount of RN-level care provider time to patient outcomes(Aiken et al. 2002; Needleman et al. 2002; Cho et al. 2003).
To understand the mechanism through which nurse staffing levels couldaffect postdischarge outcomes, the relationship to a nursing process measure(quality of discharge teaching) was evaluated. As anticipated, when RNstaffing hours were higher, patients reported higher quality discharge teaching.
Quality and Cost Analysis of Nurse Staffing 15

With more hours allocated per-patient-day, nurses have more time availablefor core functions, particularly time-consuming functions like discharge teach-ing. Effective discharge preparation goes beyond basic information-giving toplanning and problem solving for self-care management in the home afterdischarge. Patient engagement in self-management is an important part ofsuccessful transition to home-based care (Glasgow et al. 2002; Hibbard et al.2004; Ryan, Aloe, and Mason-Johnson 2009).
The study documented a path of influence from RN nonovertimestaffing through discharge teaching and patient perception of discharge readi-ness to ED use, but not readmission. Posthospitalization ED use occurs due toconcerns about symptoms, complications (that may arise from failure to followhome instructions or inadequate knowledge about recovery), or lack ofaccess to other care sources (Burt, McCaig, and Simon 2008). Effective dis-charge teaching and the subsequent increase in discharge readiness mayhave prevented ED use associated with self-care deficiencies but not postdis-charge complications unrelated to self-care abilities that require readmission.
Explanations of nursing process mediators of the relationship betweennurse staffing and readmission are needed. Although others have documentedbeneficial effects of programmed discharge transition activities on readmissionand the role of discharge planning on patient outcomes (Coleman et al. 2008; Jacket al. 2009; Popejoy, Moylan, and Galambos 2009), the unique role and contri-bution of the hospital staff nurse, who is often responsible for carrying out dis-charge preparation functions, is still unclear. With direct interaction and indirectcoordination time for discharge processes approaching 1.5 hours per patient( Jack et al. 2009), differentiation of discharge processes requiring RN-level skillcould support planning for adequate staffing to achieve critical patient outcomes.
Three recommendations for health care policy and practice emergefrom the study findings: (1) manage nurse staffing levels to achieve optimalpatient outcomes; (2) implement assessment of quality of discharge teachingand discharge readiness as standard predischarge practices; and (3) alignpayment models to encourage nurse staffing levels supportive of postdischargeoutcomes. These recommendations contribute to the arsenal of strategies ad-dressing health care quality and cost reforms.
Management of within-unit variation in nurse staffing holds the potentialto improve postdischarge outcomes and costs of care. Staffing management isboth a hospital and unit-level function. Strategic decisions to increase nursestaffing and recruitment/retention efforts to sustain optimal staffing levels arehospital-level management actions; control strategies to avoid understaffingare the role of unit-based managers.
16 HSR: Health Services Research xx:xx

Assessment of quality of discharge teaching and discharge readiness arenot standard predischarge practices either for quality measurement purposesor as opportunities for anticipatory correction. Implementation of these as-sessments within discharge protocols will promote early identification of pa-tients without adequate discharge knowledge and skills for self-managementafter discharge. The assessments could trigger anticipatory interventions forreinforcement of discharge preparation and for transitional support servicesduring the posthospitalization period. The QDTS and RHDS tools have beenused in research with adults of all ages (Bobay et al. 2010). Shortened forms arecurrently being tested.
The cost-benefit analysis revealed a substantial potential economic ben-efit to increasing nurse staffing. Costs of improved hospital RN staffing couldbe offset by costs avoided through averting postdischarge utilization. How-ever, there is no business case for increasing nurse staffing when the financialbeneficiaries of reduced postdischarge utilization are the payer and patient(Needleman 2008). Implementation of payment reforms such as gain-sharing,bundling of payments for hospital and posthospital care, and creation ofstructures accountable for continuum of care services will incentivize optimalstaffing to improve discharge processes, and achieve desired patient outcomesand cost savings (Guterman and Drake 2010).
Limitations
There are several limitations to the study design and methods. The patientsample included patients at least 18 years of age who were discharged home.Patients discharged to long-term care were not included. Postdischarge en-counters outside the four study hospitals were not accessible. The Magnet-recognized health system that served as the study site may not represent thestaffing patterns and quality of care, including discharge preparation process,within non-Magnet facilities. Therefore, the relationships of nurse staffing todischarge preparation and postdischarge utilization may be different in otherpatient and health system samples.
The focus of the study was the impact of within-unit variation of directRN and non-RN hours of care. Within-unit variation was sampled over 7monthly intervals. The availability of monthly staffing averages rather thandaily staffing assigned to individual patients precluded linking patient-specificdata directly to the actual days of hospitalization. Unit-level staffing aggregatedwithin the month of discharge is the best routinely available approximation ofcare delivered to individual patients and offers better explanatory support
Quality and Cost Analysis of Nurse Staffing 17

than hospital-level aggregate data. As information technology systems evolve,direct linking of nurse staffing data to the individual patient’s hospital stay willbe possible. The precision with which staffing estimates and patient-level dataare linked should be a consideration in planning future studies.
The study model did not include variables related to models of nursingand interdisciplinary care coordination and delivery, other measures ofstaffing such as FTEs or nurse-patient ratios, or direct observation of dischargeteaching and other preparatory activities. Nurse staffing variables that havebeen previously linked to hospitalization outcomes, such as RN education andexperience (Blegen, Vaughn, and Goode 2001; Aiken et al. 2003), were re-ported annually by the study units and therefore were insufficient for within-unit panel analysis. Nonnurse factors that could impact readmission, such asphysician practices, were not investigated.
The cost model used regional nurse staffing cost estimates. While thiswas done to increase generalizability of the study findings, it may be differentthan the health care system’s actual staffing costs. Projections for costs andsavings included hospital-reported costs only and did not include paymentsfor physician services.
CONCLUSIONS
This study extends previous health services research on the impact of nursestaffing on patient outcomes of hospitalization by linking the unit-level nursestaffing directly to postdischarge readmission and indirectly through dischargeteaching process to patient readiness for discharge and subsequent ED visits.Findings support recommendations to (1) monitor and manage unit-level nursestaffing to optimize impact on postdischarge outcomes, (2) implement assessmentof quality of discharge teaching and discharge readiness as standard predischargepractices, and (3) realign payment structures to offset costs of increasing nursestaffing with costs avoided through improved postdischarge utilization.
ACKNOWLEDGMENTS
Joint Acknowledgment/Disclosure Statement: The study was funded through agrant from the Robert Wood Johnson Foundation Interdisciplinary NursingQuality Research Initiative.
Disclosures: None.Disclaimers: None.
18 HSR: Health Services Research xx:xx

REFERENCES
Aiken, L. H., S. P. Clarke, R. B. Cheung, D. M. Sloane, and J. H. Silber. 2003. ‘‘Ed-ucational Levels of Hospital Nurses and Surgical Patient Mortality.’’ Journal of theAmerican Medical Association 290 (12): 1617–23.
Aiken, L. H., S. P. Clarke, D. M. Sloane, J. Sochalski, and J. H. Silber. 2002. ‘‘HospitalNurse Staffing and Patient Mortality, Nurse Burnout, and Job Dissatisfaction.’’Journal of the American Medical Association 288 (16): 1987–93.
Anderson, M. A., J. Levsen, M. E. Dusio, P. J. Bryant, S. M. Brown, C. M. Burr, andC. Brown-Benn. 2006. ‘‘Evidence-Based Factors in Readmission of Patientswith Heart Failure.’’ Journal of Nursing Care Quality 21 (2): 160–7.
Billings, J., J. Dixon, T. Mijanovich, and D. Wennberg. 2006. ‘‘Case Finding for Pa-tients At Risk of Readmission to Hospital: Development of Algorithm to IdentifyHigh Risk Patients.’’ British Medical Journal 333 (7563): 327. doi: 10.1136/bmj.38870.657917.AE.
Blegen, M. A., T. E. Vaughn, and C. J. Goode. 2001. ‘‘Nurse Experience and Edu-cation: Effect on Quality of Care.’’ Journal of Nursing Administration 31 (1): 33–9.
Bobay, K., T. Jerofke, M. Weiss, and O. Yakusheva. 2010. ‘‘Age-related Differences inPerception of Quality of Discharge Teaching and Readiness for Hospital Dis-charge.’’ Geriatric Nursing 31 (3): 178–87.
Bosker, R. J., T. A. B. Snijders, and H. Guldemond. 2003. PINT (Power IN Two-LevelDesigns): Estimating Standard Errors of Regression Coefficients [computerprogram].
Burt, C. V., L. F. McCaig, and A. E. Simon. 2008. Emergency Department Visits by PersonsRecently Discharged from U.S. Hospitals. National Health Statistics Reports, no.6.Hyattsville, MD: National Center for Health Statistics
Center For Allied Health Evidence. ‘‘University Of South Australia’’ [accessed onMarch 1, 2010]. Available a http://www.unisa.edu.au/cahe/resources/DCP/default.asp
Cho, S. H., S. Ketefian, V. H. Barkauskas, and D. G. Smith. 2003. ‘‘The Effects of NurseStaffing on Adverse Events, Morbidity, Mortality, and Medical Costs.’’ NursingResearch 52 (2): 71–9.
Coleman, E. A., C. Parry, S. A. Chalmers, and S.-J. Min. 2008. ‘‘The Care TransitionIntervention: Results of a Randomized Clinical Trial.’’ Archives of Internal Med-icine 166: 1822–8.
Corrigan, J. M., and J. B. Martin. 1992. ‘‘Identification of Factors Associated withHospital Readmission and Development of a Predictive Model.’’ Health ServicesResearch 27 (1): 81–101.
Donabedian, A. 1966. ‘‘Evaluating the Quality of Medical Care.’’ Milbank MemorialFund Quarterly 44 (3, suppl): 166–206.
Driscoll, A. 2000. ‘‘Managing Post-Discharge Care at Home: An Analysis of Patients’and Their Carers’ Perceptions of Information Received during Their Stay inHospital.’’ Journal of Advanced Nursing 31 (5): 1165–73.
Friedman, B., and J. J. Basu. 2004. ‘‘The Rate and Cost of Hospital Readmissions forPreventable Conditions.’’ Medical Care Research and Review 61 (2): 225–40.
Quality and Cost Analysis of Nurse Staffing 19
Glasgow, R. E., M. M. Funnell, A. E. Bonomi, C. Davis, V. Beckham, and E. H.Wagner. 2002. ‘‘Self-Management Aspects of the Improving Chronic IllnessCare Breakthrough Series: Implementation with Diabetes and Heart FailureTeams.’’ Annals of Behavioral Medicine 24 (2): 80–7.
Goldfield, N. I., E. C. McCullough, J. S. Hughes, A. M. Tang, B. Eastman, L. K.Rawlins, and R. F. Averill. 2008. ‘‘Identifying Potentially Preventable Readmis-sions.’’ Health Care Financing Review 30 (1): 75–91.
Greenwald, J. L., C. R. Denham, and B. W. Jack. 2007. ‘‘The Hospital Discharge: AReview of a High Risk Care Transition with Highlights of a Reengineered Dis-charge Process.’’ Journal of Patient Safety 3 (2): 97–106.
Grimmer, K., J. Moss, and J. Falco. 2004. ‘‘Experiences of Elderly PatientsRegarding Independent Community Living after Discharge from Hospital: ALongitudinal Study.’’ International Journal for Quality in Health Care 16 (6): 465–72.
Guterman, S., and H. Drake. 2010. Developing Innovative Payment Approaches: Finding thePath to High Performance. New York: The Commonwealth Fund.
Henderson, A., and W. Zernike. 2001. ‘‘A Study of the Impact of DischargeInformation for Surgical Patients.’’ Journal of Advanced Nursing 35 (3):435–41.
Hibbard, J. H., J. Stockard, E. R. Mahoney, and M. Tusler. 2004. ‘‘Development of thePatient Activation Measure (PAM): Conceptualizing and Measuring Activationin Patients and Consumers.’’ Health Services Research 39 (4, part 1): 1005–26.
Hollingshead, A. 1975. Four Factor Index of Social Status. New Haven, CT: YaleUniversity.
Jack, B. W., V. K. Chetty, D. Anthony, J. L. Greenwald, G. M. Sanchez, A. E. Johnson,S. R. Forsythe, J. K. O’Donnell, M. K. Paasche-Orlow, C. Manasseh, S. Martin,and L. Culpepper. 2009. ‘‘A Reengineered Hospital Discharge Program toDecrease Rehospitalization: A Randomized Trial.’’ Annals of Internal Medicine150 (3): 178–87.
Jencks, S. F., M. V. Williams, and E. A. Coleman. 2009. ‘‘Rehospitalizations amongPatients in the Medicare Fee-For-Service Program.’’ New England Journal ofMedicine 360 (14): 1418–2.
Kane, R. L., T. Shamliyan, C. Mueller, S. Duval, and T. Wilt. 2007. ‘‘NursingStaffing and Quality of Patient Care.’’ Evidence Report/Technology AssessmentNo. 151 (Prepared by the Minnesota Evidence-Based Practice Center underContract No. 290-02-0009). AHRQ Publication No. 07-E005 [accessed on April8, 2009]. Available at http://www.Ahrq.Gov/Downloads/Pub/Evidence/Pdf/Nursestaff/Nursestaff.Pdf
Koelling, T. M., M. L. Johnson, R. J. Cody, and K. D. Aaronson. 2005. ‘‘DischargeEducation Improves Clinical Outcomes in Patients with Chronic Heart Failure.’’Circulation 111 (2): 179–85.
Lake, E. T., and C. R. Friese. 2006. ‘‘Variations in Nursing Practice Environments:Relation to Staffing and Hospital Characteristics.’’ Nursing Research 55 (1): 1–9.
Mamon, J., D. M. Steinwachs, M. Fahey, L. R. Bone, J. Oktay, and L. Klein. 1992.‘‘Impact of Hospital Discharge Planning on Meeting Patient Needs after Re-turning Home.’’ Health Services Research 27 (2): 155–7.
20 HSR: Health Services Research xx:xx

McCusker, J., S. Cardin, F. Bellavance, and E. Belzile. 2000. ‘‘Return to the EmergencyDepartment among Elders: Patterns and Predictors.’’ Academic Emergency Med-icine 7 (3): 249–5.
Meleis, A. I., L. M. Sawyer, E. Im, D. K. H. Messias, and K. Schumacher. 2000.‘‘Experiencing Transitions: An Emerging Middle-range Theory.’’ Advances inNursing Science 23 (1): 12–28.
Minott, J. 2008. ‘‘Reducing Hospital Readmissions’’ [accessed on April 8, 2009].Available at http://www.academyhealth.Org/Files/Publications/Reducing_Hospital_Readmissions.pdf
Mistiaen, P., A. L. Francke, and E. Poot. 2007. ‘‘Interventions Aimed at ReducingProblems in Adult Patients Discharged from Hospital to Home: A SystematicMeta-review.’’ BMC Health Services Research 7: 47–65.
Naylor, M. D., D. Brooten, R. Campell, B. S. Jacobsen, M. D. Mezey, and M. V. Pauly.1999. ‘‘Comprehensive Discharge Planning and Home Follow-Up of Hospital-ized Elders: A Randomized Clinical Trial.’’ Journal of the American MedicalAssociation 281: 613–20.
Needleman, J. 2008. ‘‘Is What’s Good for the Patient Good for the Hospital? AligningIncentives and the Business Case for Nursing.’’ Policy, Politics, and Nursing Practice9 (2): 80–7.
Needleman, J., P. Buerhaus, S. Mattke, M. Stewart, and K. Zelevinsky. 2002. ‘‘Nurse-Staffing Levels and the Quality of Care in Hospitals.’’ New England Journal ofMedicine 346 (22): 1715–22.
Nosbusch, J. M., M. E. Weiss, and K. L. Bobay. 2011. ‘‘Challenges Confronting theAcute Care Staff Nurse in Discharge Planning: An Integrated Review of theLiterature.’’ Journal of Clinical Nursing 20 (5-6): 754–74.
Phillips, C. O., S. M. Wright, D. E. Kern, R. M. Singa, S. Shepperd, and H. R. Rubin.2004. ‘‘Comprehensive Discharge Planning with Postdischarge Supportfor Older Patients with Congestive Heart Failure: A Meta-Analysis.’’ Journal ofthe American Medical Association 291 (11): 1358–67.
Popejoy, L. L., K. Moylan, and C. Galambos. 2009. ‘‘A Review of Discharge PlanningResearch of Older Adults 1990–2008.’’ Western Journal of Nursing Research 31 (7):923–47.
Reiley, P., L. I. Iezzoni, R. Phillips, R. B. Davis, L. I. Tuchin, and D. Calkins. 1996.‘‘Discharge Planning: Comparison of Patients and Nurses’ Perceptions of PatientsFollowing Hospital Discharge.’’ Journal of Nursing Scholarship 28 (2): 143–7.
Rogers, A., H. Wei-Ting, L. Scott, L. Aiken, and D. Dinges. 2004. ‘‘The Working Hoursof Hospital Staff Nurses and Patient Safety.’’ Health Affairs 23 (4): 202–1.
Ryan, M., K. Aloe, and J. Mason-Johnson. 2009. ‘‘Improving Self-Management andReducing Hospital Readmission in Heart Failure Patients.’’ Clinical NurseSpecialist 23 (4): 216–21.
Seago, J. A., A. Williamson, and C. Atwood. 2006. ‘‘Longitudinal Analyses of NurseStaffing and Patient Outcomes: More about Failure to Rescue.’’ Journal of NursingAdministration 36 (1): 13–21.
Stata Corporation. 2009. Stata (release 11) statistical software. College Station, TX: StataCorporation.
Quality and Cost Analysis of Nurse Staffing 21

Strunin, L., M. Stone, and B. Jack. 2007. ‘‘Understanding Rehospitalization: Can Hos-pital Discharge Be Modified to Reduce Recurrent Hospitalization?’’ Journal ofHospital Medicine 2 (5): 297–304.
Titler, M., J. Dochterman, T. Kim, M. Kanak, M. Shever, D. M. Picone, L. Everett, andG. Budreau. (2007). ‘‘Cost of Care for Seniors Hospitalized for Hip Fracture andRelated Procedures.’’ Nursing Outlook 55 (1): 5–14.
Titler, M., J. D. M. Picone, L. Everett, X.-J. Xie, M. Kanak, and Q. Fei. 2005. ‘‘Cost ofHospital Care for Elderly at Risk of Falling.’’ Nursing Economics 23 (6): 290–306.
United States Department of Labor. Bureau of Labor Statistics. 2009 ‘‘Employer CostFor Employee Compensation’’ [accessed on February 4, 2010]. Available athttp://www.Bls.Gov/Data/#Wages
Van den Heede, K., W. Sermeus, L. Diya, S. P. Clarke, E. Lesaffre, A. Vleugels, andL. H. Aiken. 2009. ‘‘Nurse Staffing and Patient Outcomes in Belgian AcuteHospitals: Cross-sectional Analysis of Administrative Data.’’ International Journalof Nursing Studies 46 (7): 928–39.
Van Walraven, C., I. A. Dhalla, C. Bell, E. Etchells, I. G. Stiell, K. Zarnke, P. C. Austin,and A. J. Forster. 2010. ‘‘Derivation and Validation of an Index to Predict EarlyDeath or Unplanned Readmission after Discharge from Hospital to the Com-munity.’’ Canadian Medical Association Journal 182 (6): 551–7.
Weiss, M. E., and L. B. Piacentine. 2006. ‘‘Psychometric Properties of the ReadinessFor Hospital Discharge Scale.’’ Journal of Nursing Measurement 14 (3): 163–80.
Weiss, M. E., L. B. Piacentine, L. Lokken, J. Ancona, J. Archer, S. Gresser, S. B.Holmes, S. Toman, A. Toy, and T. Vega-Stromberg. 2007. ‘‘Predictors andOutcomes of Readiness for Hospital Discharge in Acute Medical–SurgicalPatients.’’ Clinical Nurse Specialist 21 (1): 31–42.
SUPPORTING INFORMATION
Additional supporting information may be found in the online version of thisarticle:
Appendix SA1: Author Matrix.Appendix SA2: Simultaneous Equation Model for Regressions of Re-
admission and ED Utilization on Nurse Staffing, Quality of Discharge Teach-ing, and Readiness for Hospital Discharge.
Please note: Wiley-Blackwell is not responsible for the content or func-tionality of any supporting materials supplied by the authors. Any queries(other than missing material) should be directed to the corresponding authorfor the article.
22 HSR: Health Services Research xx:xx