Does hillslope trenching enhance groundwater recharge and ...
Upload
fauziah-ahmadCategory
view
213download
0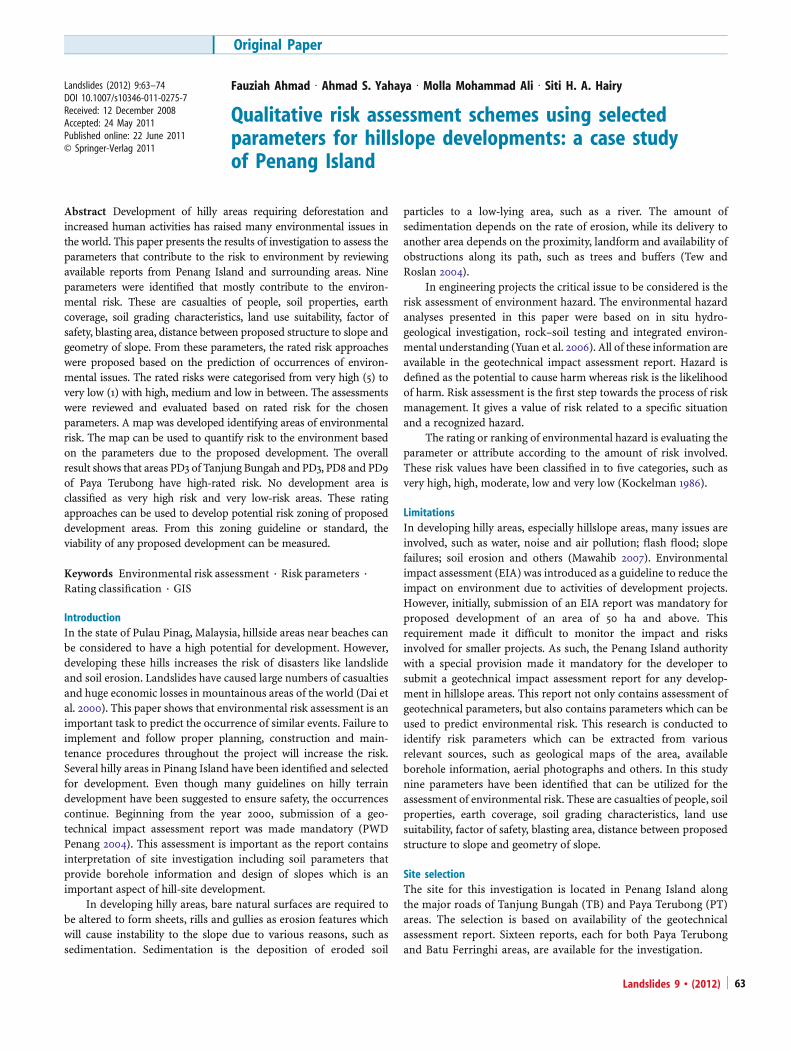
Landslides (2012) 9:63–74DOI 10.1007/s10346-011-0275-7Received: 12 December 2008Accepted: 24 May 2011Published online: 22 June 2011© Springer-Verlag 2011
Fauziah Ahmad I Ahmad S. Yahaya I Molla Mohammad Ali I Siti H. A. Hairy
Qualitative risk assessment schemes using selectedparameters for hillslope developments: a case studyof Penang Island
Abstract Development of hilly areas requiring deforestation andincreased human activities has raised many environmental issues inthe world. This paper presents the results of investigation to assess theparameters that contribute to the risk to environment by reviewingavailable reports from Penang Island and surrounding areas. Nineparameters were identified that mostly contribute to the environ-mental risk. These are casualties of people, soil properties, earthcoverage, soil grading characteristics, land use suitability, factor ofsafety, blasting area, distance between proposed structure to slope andgeometry of slope. From these parameters, the rated risk approacheswere proposed based on the prediction of occurrences of environ-mental issues. The rated risks were categorised from very high (5) tovery low (1) with high, medium and low in between. The assessmentswere reviewed and evaluated based on rated risk for the chosenparameters. A map was developed identifying areas of environmentalrisk. The map can be used to quantify risk to the environment basedon the parameters due to the proposed development. The overallresult shows that areas PD3 of Tanjung Bungah and PD3, PD8 and PD9of Paya Terubong have high-rated risk. No development area isclassified as very high risk and very low-risk areas. These ratingapproaches can be used to develop potential risk zoning of proposeddevelopment areas. From this zoning guideline or standard, theviability of any proposed development can be measured.
Keywords Environmental risk assessment . Risk parameters .
Rating classification . GIS
IntroductionIn the state of Pulau Pinag, Malaysia, hillside areas near beaches canbe considered to have a high potential for development. However,developing these hills increases the risk of disasters like landslideand soil erosion. Landslides have caused large numbers of casualtiesand huge economic losses in mountainous areas of the world (Dai etal. 2000). This paper shows that environmental risk assessment is animportant task to predict the occurrence of similar events. Failure toimplement and follow proper planning, construction and main-tenance procedures throughout the project will increase the risk.Several hilly areas in Pinang Island have been identified and selectedfor development. Even though many guidelines on hilly terraindevelopment have been suggested to ensure safety, the occurrencescontinue. Beginning from the year 2000, submission of a geo-technical impact assessment report was made mandatory (PWDPenang 2004). This assessment is important as the report containsinterpretation of site investigation including soil parameters thatprovide borehole information and design of slopes which is animportant aspect of hill-site development.
In developing hilly areas, bare natural surfaces are required tobe altered to form sheets, rills and gullies as erosion features whichwill cause instability to the slope due to various reasons, such assedimentation. Sedimentation is the deposition of eroded soil
particles to a low-lying area, such as a river. The amount ofsedimentation depends on the rate of erosion, while its delivery toanother area depends on the proximity, landform and availability ofobstructions along its path, such as trees and buffers (Tew andRoslan 2004).
In engineering projects the critical issue to be considered is therisk assessment of environment hazard. The environmental hazardanalyses presented in this paper were based on in situ hydro-geological investigation, rock–soil testing and integrated environ-mental understanding (Yuan et al. 2006). All of these information areavailable in the geotechnical impact assessment report. Hazard isdefined as the potential to cause harm whereas risk is the likelihoodof harm. Risk assessment is the first step towards the process of riskmanagement. It gives a value of risk related to a specific situationand a recognized hazard.
The rating or ranking of environmental hazard is evaluating theparameter or attribute according to the amount of risk involved.These risk values have been classified in to five categories, such asvery high, high, moderate, low and very low (Kockelman 1986).
LimitationsIn developing hilly areas, especially hillslope areas, many issues areinvolved, such as water, noise and air pollution; flash flood; slopefailures; soil erosion and others (Mawahib 2007). Environmentalimpact assessment (EIA) was introduced as a guideline to reduce theimpact on environment due to activities of development projects.However, initially, submission of an EIA report was mandatory forproposed development of an area of 50 ha and above. Thisrequirement made it difficult to monitor the impact and risksinvolved for smaller projects. As such, the Penang Island authoritywith a special provision made it mandatory for the developer tosubmit a geotechnical impact assessment report for any develop-ment in hillslope areas. This report not only contains assessment ofgeotechnical parameters, but also contains parameters which can beused to predict environmental risk. This research is conducted toidentify risk parameters which can be extracted from variousrelevant sources, such as geological maps of the area, availableborehole information, aerial photographs and others. In this studynine parameters have been identified that can be utilized for theassessment of environmental risk. These are casualties of people, soilproperties, earth coverage, soil grading characteristics, land usesuitability, factor of safety, blasting area, distance between proposedstructure to slope and geometry of slope.
Site selectionThe site for this investigation is located in Penang Island alongthe major roads of Tanjung Bungah (TB) and Paya Terubong (PT)areas. The selection is based on availability of the geotechnicalassessment report. Sixteen reports, each for both Paya Terubongand Batu Ferringhi areas, are available for the investigation.
Landslides 9 & (2012) 63
Original Paper
The TB area is located in the latitudes 50°27′ to 50°28′ Nand longitudes 100°14′ to 100°18′ E. The PT area is located atlatitudes 50°20′ to 50°23′ N and longitudes 100°15′ to 100°17′ E(Fig. 1).
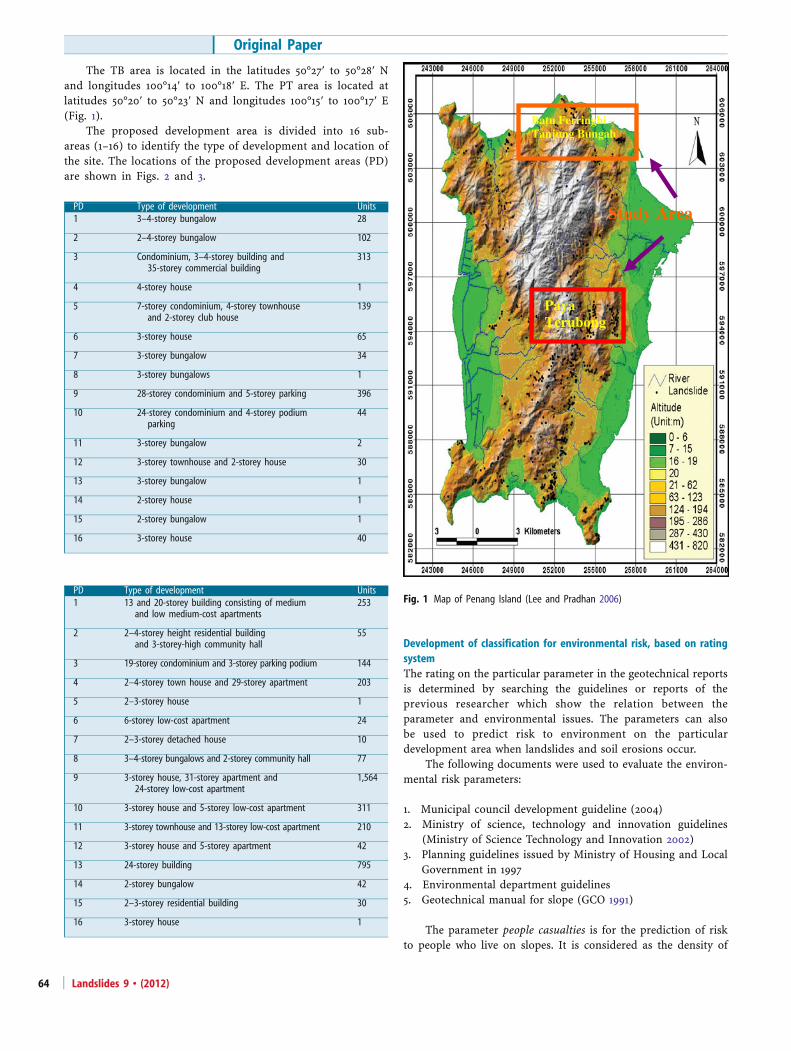
The proposed development area is divided into 16 sub-areas (1–16) to identify the type of development and location ofthe site. The locations of the proposed development areas (PD)are shown in Figs. 2 and 3.
Development of classification for environmental risk, based on ratingsystemThe rating on the particular parameter in the geotechnical reportsis determined by searching the guidelines or reports of theprevious researcher which show the relation between theparameter and environmental issues. The parameters can alsobe used to predict risk to environment on the particulardevelopment area when landslides and soil erosions occur.
The following documents were used to evaluate the environ-mental risk parameters:
1. Municipal council development guideline (2004)2. Ministry of science, technology and innovation guidelines
(Ministry of Science Technology and Innovation 2002)3. Planning guidelines issued by Ministry of Housing and Local
Government in 19974. Environmental department guidelines5. Geotechnical manual for slope (GCO 1991)
The parameter people casualties is for the prediction of riskto people who live on slopes. It is considered as the density of
PD Type of development Units1 3–4-storey bungalow 28
2 2–4-storey bungalow 102
3 Condominium, 3–4-storey building and35-storey commercial building
313
4 4-storey house 1
5 7-storey condominium, 4-storey townhouseand 2-storey club house
139
6 3-storey house 65
7 3-storey bungalow 34
8 3-storey bungalows 1
9 28-storey condominium and 5-storey parking 396
10 24-storey condominium and 4-storey podiumparking
44
11 3-storey bungalow 2
12 3-storey townhouse and 2-storey house 30
13 3-storey bungalow 1
14 2-storey house 1
15 2-storey bungalow 1
16 3-storey house 40
PD Type of development Units1 13 and 20-storey building consisting of medium
and low medium-cost apartments253
2 2–4-storey height residential buildingand 3-storey-high community hall
55
3 19-storey condominium and 3-storey parking podium 144
4 2–4-storey town house and 29-storey apartment 203
5 2–3-storey house 1
6 6-storey low-cost apartment 24
7 2–3-storey detached house 10
8 3–4-storey bungalows and 2-storey community hall 77
9 3-storey house, 31-storey apartment and24-storey low-cost apartment
1,564
10 3-storey house and 5-storey low-cost apartment 311
11 3-storey townhouse and 13-storey low-cost apartment 210
12 3-storey house and 5-storey apartment 42
13 24-storey building 795
14 2-storey bungalow 42
15 2–3-storey residential building 30
16 3-storey house 1
Batu Ferringhi – Tanjung Bungah
Paya Terubong
Study Area
Fig. 1 Map of Penang Island (Lee and Pradhan 2006)
Original Paper
Landslides 9 & (2012)64
people who have one house on the particular development area. Itis also assumed that an average of five people live in one unit. Theparameter depends on the type of development, mixed develop-ment or residential building. Table 1 shows the rating for peoplecasualties.
The parameter of soil properties is to measure the soilstrength and predict the environmental risk involved. Thisincludes dry unit weight, friction angle and SPT N value of soildeposit as obtained from the bore log. The SPT values are takenas average over the soil strata and are shown in Table 2. Soil whichhas low strength will give high capability to fail than the soil withhigher strength (Gue and Tan 2002). The rating of soil propertieswhich is modified from Table 2 is shown in Table 3. The averagevalue of N is taken from the bore log in the geotechnicalassessment report while the dry unit weight and friction angleare obtained from the particular parameters used in slope stabilityanalysis.
The parameter land use suitability consists of two geo-technical aspects, which are class of slope hill development andslope gradient. This parameter is used to predict the impact ofland use of the development to the people and environment.From the value of slope gradient, the risk on environment can be
predicted from the number of occurrences of slope failures withthe assumption that steeper slopes have higher risk (Gue and Tan2002). The land use suitability is obtained from the overallpercentage of class or assessed from the land use suitability map.The slope gradient is extracted from the terrain classificationmaps which assess the location of building or structure either onthe steep or gentle slope. Table 4 shows the rating for suitability ofland use which is modified from the guideline of hill developmentof Ministry of Science, Technology and Environment (2002).
The safety factor parameter is to predict the probable slopefailure. The lower value of this factor may indicate that the slopeis not stable and the impact on the environment may beincreased. The parameter of safety factor is used for the overallfactor of safety in the geotechnical report. The rating of safetyfactor is obtained from GCO (1991) and shown in Table 5.
The parameter of earth coverage includes areas covered byforest, secondary forest, bushes, agricultural land, or thickvegetation cover, and existing rock outcrops or boulders. Thetypes of coverage and the location of boulders, either on top of
Fig. 2 Proposed development areas of Batu Ferringhi–Tanjung Bungah
Fig. 3 Proposed development areas of Paya Terubong
Landslides 9 & (2012) 65
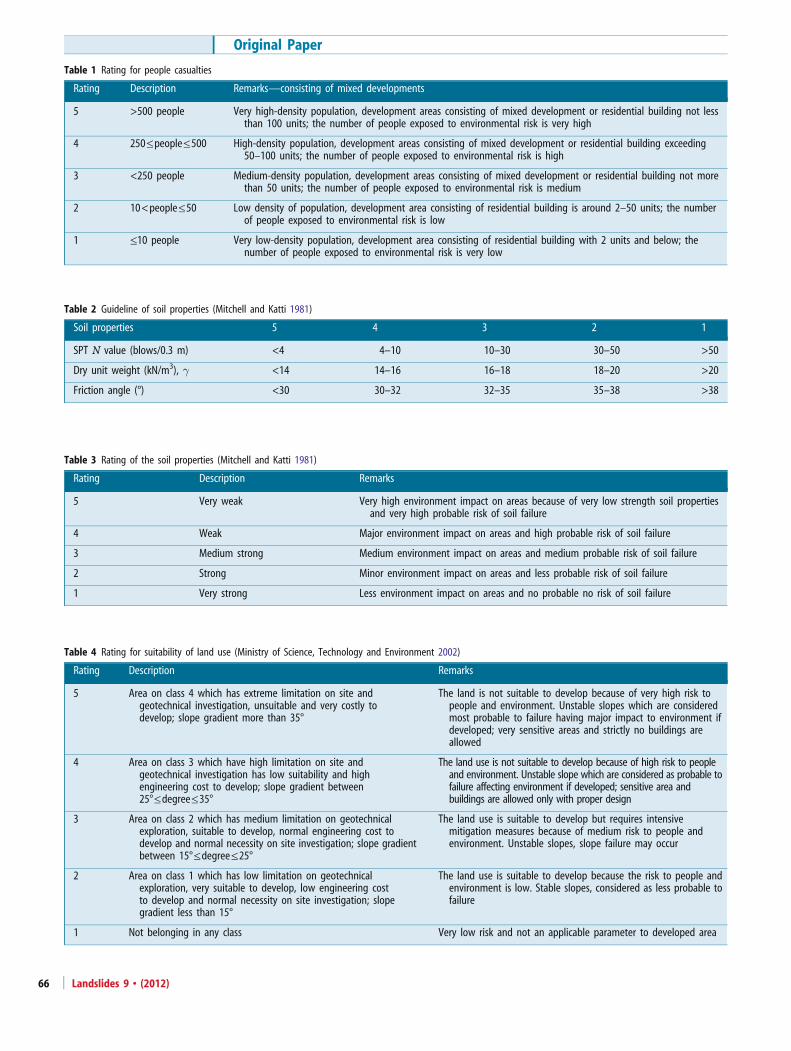
Table 1 Rating for people casualties
Rating Description Remarks—consisting of mixed developments
5 >500 people Very high-density population, development areas consisting of mixed development or residential building not lessthan 100 units; the number of people exposed to environmental risk is very high
4 250≤people≤500 High-density population, development areas consisting of mixed development or residential building exceeding50–100 units; the number of people exposed to environmental risk is high
3 <250 people Medium-density population, development areas consisting of mixed development or residential building not morethan 50 units; the number of people exposed to environmental risk is medium
2 10<people≤50 Low density of population, development area consisting of residential building is around 2–50 units; the numberof people exposed to environmental risk is low
1 ≤10 people Very low-density population, development area consisting of residential building with 2 units and below; thenumber of people exposed to environmental risk is very low
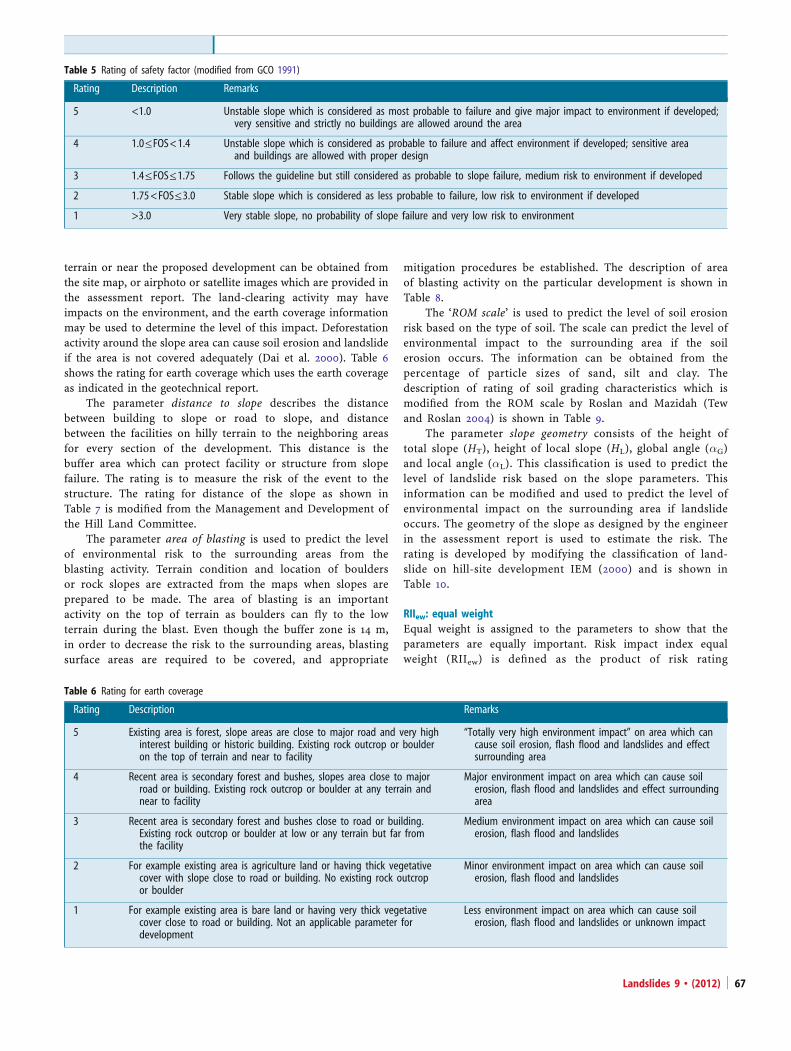
Table 2 Guideline of soil properties (Mitchell and Katti 1981)
Soil properties 5 4 3 2 1
SPT N value (blows/0.3 m) <4 4–10 10–30 30–50 >50
Dry unit weight (kN/m3), γ <14 14–16 16–18 18–20 >20
Friction angle (°) <30 30–32 32–35 35–38 >38
Table 3 Rating of the soil properties (Mitchell and Katti 1981)
Rating Description Remarks
5 Very weak Very high environment impact on areas because of very low strength soil propertiesand very high probable risk of soil failure
4 Weak Major environment impact on areas and high probable risk of soil failure
3 Medium strong Medium environment impact on areas and medium probable risk of soil failure
2 Strong Minor environment impact on areas and less probable risk of soil failure
1 Very strong Less environment impact on areas and no probable no risk of soil failure
Table 4 Rating for suitability of land use (Ministry of Science, Technology and Environment 2002)
Rating Description Remarks
5 Area on class 4 which has extreme limitation on site andgeotechnical investigation, unsuitable and very costly todevelop; slope gradient more than 35°
The land is not suitable to develop because of very high risk topeople and environment. Unstable slopes which are consideredmost probable to failure having major impact to environment ifdeveloped; very sensitive areas and strictly no buildings areallowed
4 Area on class 3 which have high limitation on site andgeotechnical investigation has low suitability and highengineering cost to develop; slope gradient between25°≤degree≤35°
The land use is not suitable to develop because of high risk to peopleand environment. Unstable slope which are considered as probable tofailure affecting environment if developed; sensitive area andbuildings are allowed only with proper design
3 Area on class 2 which has medium limitation on geotechnicalexploration, suitable to develop, normal engineering cost todevelop and normal necessity on site investigation; slope gradientbetween 15°≤degree≤25°
The land use is suitable to develop but requires intensivemitigation measures because of medium risk to people andenvironment. Unstable slopes, slope failure may occur
2 Area on class 1 which has low limitation on geotechnicalexploration, very suitable to develop, low engineering costto develop and normal necessity on site investigation; slopegradient less than 15°
The land use is suitable to develop because the risk to people andenvironment is low. Stable slopes, considered as less probable tofailure
1 Not belonging in any class Very low risk and not an applicable parameter to developed area
Original Paper
Landslides 9 & (2012)66
terrain or near the proposed development can be obtained fromthe site map, or airphoto or satellite images which are provided inthe assessment report. The land-clearing activity may haveimpacts on the environment, and the earth coverage informationmay be used to determine the level of this impact. Deforestationactivity around the slope area can cause soil erosion and landslideif the area is not covered adequately (Dai et al. 2000). Table 6shows the rating for earth coverage which uses the earth coverageas indicated in the geotechnical report.
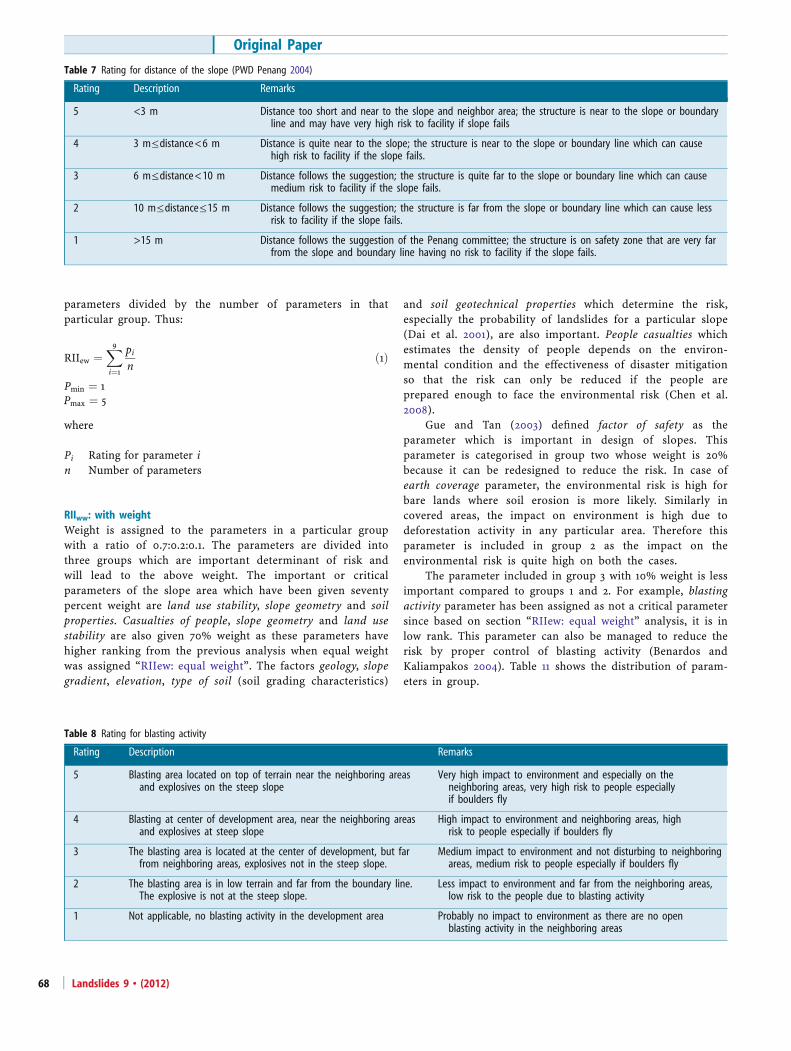
The parameter distance to slope describes the distancebetween building to slope or road to slope, and distancebetween the facilities on hilly terrain to the neighboring areasfor every section of the development. This distance is thebuffer area which can protect facility or structure from slopefailure. The rating is to measure the risk of the event to thestructure. The rating for distance of the slope as shown inTable 7 is modified from the Management and Development ofthe Hill Land Committee.
The parameter area of blasting is used to predict the levelof environmental risk to the surrounding areas from theblasting activity. Terrain condition and location of bouldersor rock slopes are extracted from the maps when slopes areprepared to be made. The area of blasting is an importantactivity on the top of terrain as boulders can fly to the lowterrain during the blast. Even though the buffer zone is 14 m,in order to decrease the risk to the surrounding areas, blastingsurface areas are required to be covered, and appropriate
mitigation procedures be established. The description of areaof blasting activity on the particular development is shown inTable 8.
The ‘ROM scale’ is used to predict the level of soil erosionrisk based on the type of soil. The scale can predict the level ofenvironmental impact to the surrounding area if the soilerosion occurs. The information can be obtained from thepercentage of particle sizes of sand, silt and clay. Thedescription of rating of soil grading characteristics which ismodified from the ROM scale by Roslan and Mazidah (Tewand Roslan 2004) is shown in Table 9.
The parameter slope geometry consists of the height oftotal slope (HT), height of local slope (HL), global angle (αG)and local angle (αL). This classification is used to predict thelevel of landslide risk based on the slope parameters. Thisinformation can be modified and used to predict the level ofenvironmental impact on the surrounding area if landslideoccurs. The geometry of the slope as designed by the engineerin the assessment report is used to estimate the risk. Therating is developed by modifying the classification of land-slide on hill-site development IEM (2000) and is shown inTable 10.
RIIew: equal weightEqual weight is assigned to the parameters to show that theparameters are equally important. Risk impact index equalweight (RIIew) is defined as the product of risk rating
Table 5 Rating of safety factor (modified from GCO 1991)
Rating Description Remarks
5 <1.0 Unstable slope which is considered as most probable to failure and give major impact to environment if developed;very sensitive and strictly no buildings are allowed around the area
4 1.0≤FOS<1.4 Unstable slope which is considered as probable to failure and affect environment if developed; sensitive areaand buildings are allowed with proper design
3 1.4≤FOS≤1.75 Follows the guideline but still considered as probable to slope failure, medium risk to environment if developed
2 1.75<FOS≤3.0 Stable slope which is considered as less probable to failure, low risk to environment if developed
1 >3.0 Very stable slope, no probability of slope failure and very low risk to environment
Table 6 Rating for earth coverage
Rating Description Remarks
5 Existing area is forest, slope areas are close to major road and very highinterest building or historic building. Existing rock outcrop or boulderon the top of terrain and near to facility
“Totally very high environment impact” on area which cancause soil erosion, flash flood and landslides and effectsurrounding area
4 Recent area is secondary forest and bushes, slopes area close to majorroad or building. Existing rock outcrop or boulder at any terrain andnear to facility
Major environment impact on area which can cause soilerosion, flash flood and landslides and effect surroundingarea
3 Recent area is secondary forest and bushes close to road or building.Existing rock outcrop or boulder at low or any terrain but far fromthe facility
Medium environment impact on area which can cause soilerosion, flash flood and landslides
2 For example existing area is agriculture land or having thick vegetativecover with slope close to road or building. No existing rock outcropor boulder
Minor environment impact on area which can cause soilerosion, flash flood and landslides
1 For example existing area is bare land or having very thick vegetativecover close to road or building. Not an applicable parameter fordevelopment
Less environment impact on area which can cause soilerosion, flash flood and landslides or unknown impact
Landslides 9 & (2012) 67
parameters divided by the number of parameters in thatparticular group. Thus:
RIIew ¼X9
i¼1
pin
ð1Þ
Pmin ¼ 1Pmax ¼ 5
where
Pi Rating for parameter in Number of parameters
RIIww: with weightWeight is assigned to the parameters in a particular groupwith a ratio of 0.7:0.2:0.1. The parameters are divided intothree groups which are important determinant of risk andwill lead to the above weight. The important or criticalparameters of the slope area which have been given seventypercent weight are land use stability, slope geometry and soilproperties. Casualties of people, slope geometry and land usestability are also given 70% weight as these parameters havehigher ranking from the previous analysis when equal weightwas assigned “RIIew: equal weight”. The factors geology, slopegradient, elevation, type of soil (soil grading characteristics)
and soil geotechnical properties which determine the risk,especially the probability of landslides for a particular slope(Dai et al. 2001), are also important. People casualties whichestimates the density of people depends on the environ-mental condition and the effectiveness of disaster mitigationso that the risk can only be reduced if the people areprepared enough to face the environmental risk (Chen et al.2008).
Gue and Tan (2003) defined factor of safety as theparameter which is important in design of slopes. Thisparameter is categorised in group two whose weight is 20%because it can be redesigned to reduce the risk. In case ofearth coverage parameter, the environmental risk is high forbare lands where soil erosion is more likely. Similarly incovered areas, the impact on environment is high due todeforestation activity in any particular area. Therefore thisparameter is included in group 2 as the impact on theenvironmental risk is quite high on both the cases.
The parameter included in group 3 with 10% weight is lessimportant compared to groups 1 and 2. For example, blastingactivity parameter has been assigned as not a critical parametersince based on section “RIIew: equal weight” analysis, it is inlow rank. This parameter can also be managed to reduce therisk by proper control of blasting activity (Benardos andKaliampakos 2004). Table 11 shows the distribution of param-eters in group.
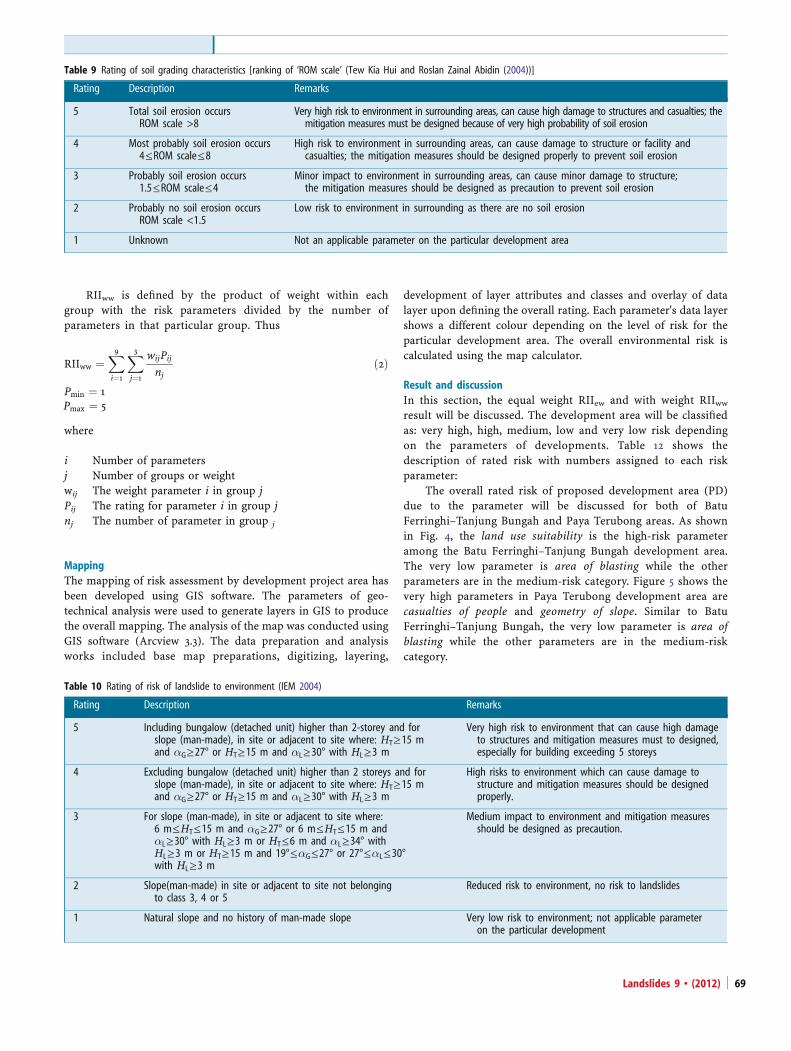
Table 7 Rating for distance of the slope (PWD Penang 2004)
Rating Description Remarks
5 <3 m Distance too short and near to the slope and neighbor area; the structure is near to the slope or boundaryline and may have very high risk to facility if slope fails
4 3 m≤distance<6 m Distance is quite near to the slope; the structure is near to the slope or boundary line which can causehigh risk to facility if the slope fails.
3 6 m≤distance<10 m Distance follows the suggestion; the structure is quite far to the slope or boundary line which can causemedium risk to facility if the slope fails.
2 10 m≤distance≤15 m Distance follows the suggestion; the structure is far from the slope or boundary line which can cause lessrisk to facility if the slope fails.
1 >15 m Distance follows the suggestion of the Penang committee; the structure is on safety zone that are very farfrom the slope and boundary line having no risk to facility if the slope fails.
Table 8 Rating for blasting activity
Rating Description Remarks
5 Blasting area located on top of terrain near the neighboring areasand explosives on the steep slope
Very high impact to environment and especially on theneighboring areas, very high risk to people especiallyif boulders fly
4 Blasting at center of development area, near the neighboring areasand explosives at steep slope
High impact to environment and neighboring areas, highrisk to people especially if boulders fly
3 The blasting area is located at the center of development, but farfrom neighboring areas, explosives not in the steep slope.
Medium impact to environment and not disturbing to neighboringareas, medium risk to people especially if boulders fly
2 The blasting area is in low terrain and far from the boundary line.The explosive is not at the steep slope.
Less impact to environment and far from the neighboring areas,low risk to the people due to blasting activity
1 Not applicable, no blasting activity in the development area Probably no impact to environment as there are no openblasting activity in the neighboring areas
Original Paper
Landslides 9 & (2012)68
RIIww is defined by the product of weight within eachgroup with the risk parameters divided by the number ofparameters in that particular group. Thus
RIIww ¼X9
i¼1
X3
j¼1
wijPijnj
ð2Þ
Pmin ¼ 1Pmax ¼ 5
where
i Number of parametersj Number of groups or weightwij The weight parameter i in group jPij The rating for parameter i in group jnj The number of parameter in group j
MappingThe mapping of risk assessment by development project area hasbeen developed using GIS software. The parameters of geo-technical analysis were used to generate layers in GIS to producethe overall mapping. The analysis of the map was conducted usingGIS software (Arcview 3.3). The data preparation and analysisworks included base map preparations, digitizing, layering,
development of layer attributes and classes and overlay of datalayer upon defining the overall rating. Each parameter's data layershows a different colour depending on the level of risk for theparticular development area. The overall environmental risk iscalculated using the map calculator.
Result and discussionIn this section, the equal weight RIIew and with weight RIIwwresult will be discussed. The development area will be classifiedas: very high, high, medium, low and very low risk dependingon the parameters of developments. Table 12 shows thedescription of rated risk with numbers assigned to each riskparameter:
The overall rated risk of proposed development area (PD)due to the parameter will be discussed for both of BatuFerringhi–Tanjung Bungah and Paya Terubong areas. As shownin Fig. 4, the land use suitability is the high-risk parameteramong the Batu Ferringhi–Tanjung Bungah development area.The very low parameter is area of blasting while the otherparameters are in the medium-risk category. Figure 5 shows thevery high parameters in Paya Terubong development area arecasualties of people and geometry of slope. Similar to BatuFerringhi–Tanjung Bungah, the very low parameter is area ofblasting while the other parameters are in the medium-riskcategory.
Table 10 Rating of risk of landslide to environment (IEM 2004)
Rating Description Remarks
5 Including bungalow (detached unit) higher than 2-storey and forslope (man-made), in site or adjacent to site where: HT≥15 mand αG≥27° or HT≥15 m and αL≥30° with HL≥3 m
Very high risk to environment that can cause high damageto structures and mitigation measures must to designed,especially for building exceeding 5 storeys
4 Excluding bungalow (detached unit) higher than 2 storeys and forslope (man-made), in site or adjacent to site where: HT≥15 mand αG≥27° or HT≥15 m and αL≥30° with HL≥3 m
High risks to environment which can cause damage tostructure and mitigation measures should be designedproperly.
3 For slope (man-made), in site or adjacent to site where:6 m≤HT≤15 m and αG≥27° or 6 m≤HT≤15 m andαL≥30° with HL≥3 m or HT≤6 m and αL≥34° withHL≥3 m or HT≥15 m and 19°≤αG≤27° or 27°≤αL≤30°with HL≥3 m
Medium impact to environment and mitigation measuresshould be designed as precaution.
2 Slope(man-made) in site or adjacent to site not belongingto class 3, 4 or 5
Reduced risk to environment, no risk to landslides
1 Natural slope and no history of man-made slope Very low risk to environment; not applicable parameteron the particular development
Table 9 Rating of soil grading characteristics [ranking of ‘ROM scale’ (Tew Kia Hui and Roslan Zainal Abidin (2004))]
Rating Description Remarks
5 Total soil erosion occursROM scale >8
Very high risk to environment in surrounding areas, can cause high damage to structures and casualties; themitigation measures must be designed because of very high probability of soil erosion
4 Most probably soil erosion occurs4≤ROM scale≤8
High risk to environment in surrounding areas, can cause damage to structure or facility andcasualties; the mitigation measures should be designed properly to prevent soil erosion
3 Probably soil erosion occurs1.5≤ROM scale≤4
Minor impact to environment in surrounding areas, can cause minor damage to structure;the mitigation measures should be designed as precaution to prevent soil erosion
2 Probably no soil erosion occursROM scale <1.5
Low risk to environment in surrounding as there are no soil erosion
1 Unknown Not an applicable parameter on the particular development area
Landslides 9 & (2012) 69

The overall rating for Tanjung Bungah Development area isshown in Fig. 6. The PD4 is predicted to be high risk compared withthe other development area. The development areas of medium riskwith the average parameter around 3 are PD1, PD2, PD4, PD5, PD6,PD7, PD9, PD10, PD11, PD12, PD13 and PD16. The lowest rated riskareas are: PD8, PD14 and PD15, while there are no development areasrating very high and very low. This shows that the Batu Ferringhi–Tanjung Bungah proposed development area is not given a very highimpact to environment, but risks are still influenced by certainparameters.
The overall rating for Paya Terubong development area isshown in Fig. 7. The development areas PD3, PD8 and PD9 arepredicted high risk compared with the other development areas. Thedevelopment areas on the medium risk with average parameteraround 3 are PD1, PD2, PD4, PD5, PD7, PD12, PD13, PD14 and PD16.The lowest rated risk is development areas PD6, PD10, PD11 andPD15 while there are no development areas rating very high risk andvery low risk. This shows that the Paya Terubong proposeddevelopment area is not given a very high impact to environmentbut risks are still influenced by certain parameters.
The parameter result or rating is filled in the particular attributefield data in the Arcview software. The map was generated based onthe rating of the parameter. The map showed different coloursdepending on the level of risk due to the parameter. The mapcalculator was used to evaluate each parameter. Table 13 shows thedifferent colour that was used to show the level of risk. Figure 8shows the overall rated riskmap for Batu Ferringhi–Tanjung Bungahdevelopment area, and Fig. 9 shows the overall rated risk map forPaya Terubong development area.
A comparison between equal weight (ew) and with weight (ww)for Batu Ferringhi–Tanjung Bungah development area is shown in
Fig. 10, while Fig. 11 shows the risk map which indicates thecomparison between equal and with weight for Batu Ferringhi–Tanjung Bungah. The high-risk parameters in Batu Ferringhi–Tanjung Bungah development area are obtained by the mean fromoverall development area, land use suitability is included in firstgroup that means this parameter is the risk trigger on hillslopedevelopment. As mentioned before, PD3 is a high-risk areacompared to other proposed development in Batu Ferringhi–Tanjung Bungah but the result in different weight shows that PD2is also in the high-risk category. From the weight there is also aproposed development area which has changed from low riskto medium risk. This is PD14. This shows that with thedifferent weight, the proposed development risk increases.
Comparison between equal and with weight for PayaTerubong development area is shown in Fig. 12 while Fig. 13shows the risk map which indicates the comparison betweenequal mean and different weight for Paya Terubong. The high-risk parameters in Paya Terubong development areas obtainedby the mean from the overall development area, casualties ofpeople and geometry of slope are included in the first groupthat means this parameter is the risk trigger on hillslopedevelopment. As mentioned before, PD3, PD8 and PD9 are
0
1
2
3
4
5
1 2 3 4 5 6 7 8 9
Rat
ing
Ris
k
1 Casualties of people
3 Soil Properties
2 Earth Coverage
4 Soil Grading Characteristic
5 Land Use
6 Factor of Safety
7 Buffer Zone
8 Blasting Activities
9 Geometry of Slope
Fig. 4 Overall rating of parameters showing high value for land use
0
1
2
3
4
5
1 2 3 4 5 6 7 8 9
Rat
ing
Ris
k
1 Casualties of people
3 Soil Properties
2 Earth Coverage
4 Soil Grading Characteristic
5 Land Use
6 Factor of Safety
7 Buffer Zone
8 Blasting Activities
9 Geometry of Slope
Fig. 5 Overall rating showing high values for casualties of people and geometryof slopes
Table 12 Rated risk
Rated risk Description
5 Very high risk
4 High risk
3 Medium risk
2 Low risk
1 Very low risk
Table 11 Group of weight
j wi Pij
1 0.7 P11=land use suitability
P21=geometry of slope
P31=soil properties
P41=soil grading characteristics
P51=people casualties
2 0.2 P12=factor of safety
P22=earth coverage
3 0.1 P13=distance
P23=blasting activity
Original Paper
Landslides 9 & (2012)70

high-risk areas compared to other proposed development inPaya Terubong but the result in different weight shows thatonly PD3 and PD9 is in the high-risk category while PD8decreases to medium risk. There are also some proposeddevelopment areas which have changed from low risk tomedium risk which are PD6, PD10 and PD11. This shows thatthe group of weight influences the result of risk on theproposed development area. The reason for assessing the riskdue to the environmental impact on the proposed hillslopedevelopment is to measure the negative impact on environ-mental aspects due to parameters in geotechnical assessmentreport.
A similar study was undertaken by Lee and Pradhan(2006) to establish the risk map on Penang Island by using GISsoftware, Arcview. Some of the parameters are related to theinstability of slope that contributes to the environmental issuessuch as slope steepness, vegetation cover, land use and humanactivity. However, this study differed because they used thepresent land use compared to this research which used the
proposed development area or future land use to predict therisk to the environmental issues.
Based on the results from the rating and mapping, thedevelopment areas which are obtained for the particular ratingcan be concluded as given in Table 14. Table 15 shows the resultfor Batu Ferringhi–Tanjung Bungah and Paya Terubong ofproposed development area in both equal (RIIew) and differentweight (RIIww).
Development area PD3 is considered as high risk for theBatu Ferringhi–Tanjung Bungah site, while for the PayaTerubong proposed development area PD3, PD8 and PD9 areat high risk. This overall rating depends on an average rating
Table 13 Description of colour using on rated risk
Rating Description Colour (C)
1 Very Low Risk
2 Low Risk
3 Medium Risk
4 High Risk
5 Very High Risk
Fig. 8 Overall risk class for study area Tanjung Bungah using the RIIew schemeusing equal weight
0
1
2
3
4
5
Rat
ing
Ris
k
1 2 3 4 5 6 7 8 9 10 11 12 13 14 15 16
Development Area
Fig. 7 Overall rating of Paya Terubong showing PD3, PD8 and PD9 as high risk
0
1
2
3
4
5R
atin
gR
isk
1 2 3 4 5 6 7 8 9 10 11 12 13 14 15 16
Development Area
Fig. 6 Overall rating of Tanjung Bungah showing PD4 as high-risk area
Landslides 9 & (2012) 71
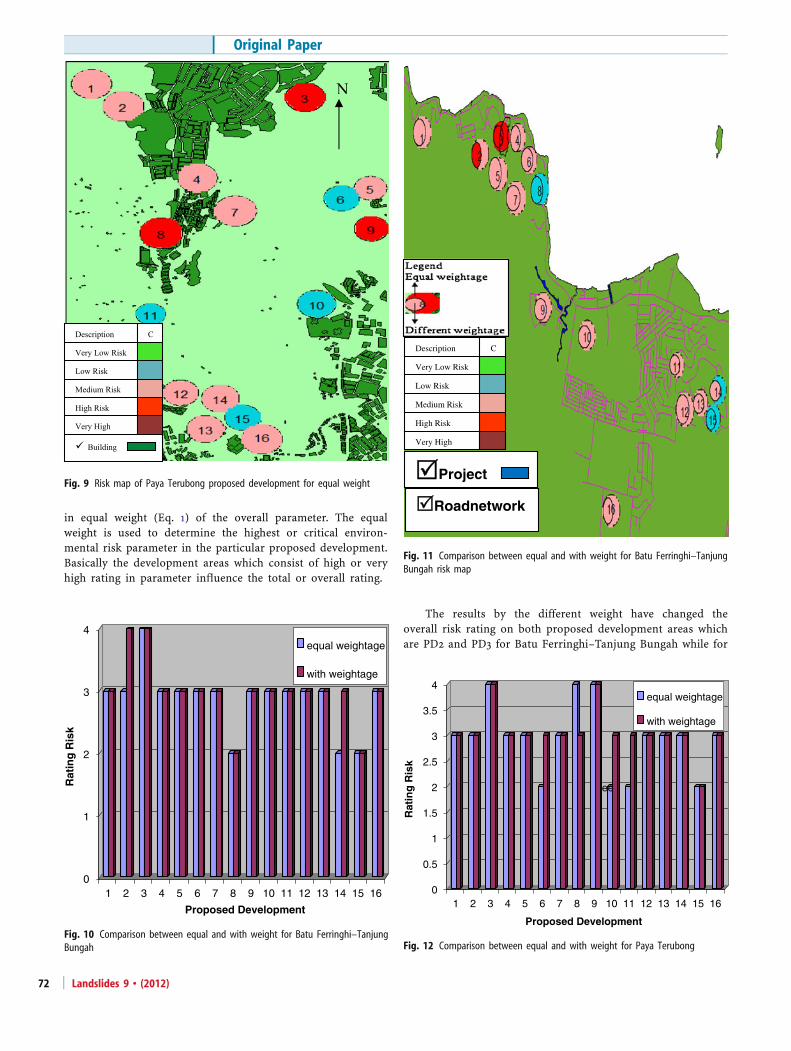
in equal weight (Eq. 1) of the overall parameter. The equalweight is used to determine the highest or critical environ-mental risk parameter in the particular proposed development.Basically the development areas which consist of high or veryhigh rating in parameter influence the total or overall rating.
The results by the different weight have changed theoverall risk rating on both proposed development areas whichare PD2 and PD3 for Batu Ferringhi–Tanjung Bungah while for
Description
Very Low Risk
C
Low Risk
Medium Risk
High Risk
Very High
Roadnetwork
Project
Fig. 11 Comparison between equal and with weight for Batu Ferringhi–TanjungBungah risk map
0
0.5
1
1.5
2
2.5
3
3.5
4
Rat
ing
Ris
k
1 2 3 4 5 6 7 8 9 10 11 12 13 14 15 16
Proposed Development
equal weightage
with weightage
ee
Fig. 12 Comparison between equal and with weight for Paya Terubong
0
1
2
3
4
Rat
ing
Ris
k
1 2 3 4 5 6 7 8 9 10 11 12 13 14 15 16
Proposed Development
equal weightage
with weightage
Fig. 10 Comparison between equal and with weight for Batu Ferringhi–TanjungBungah
Fig. 9 Risk map of Paya Terubong proposed development for equal weight
Original Paper
Landslides 9 & (2012)72
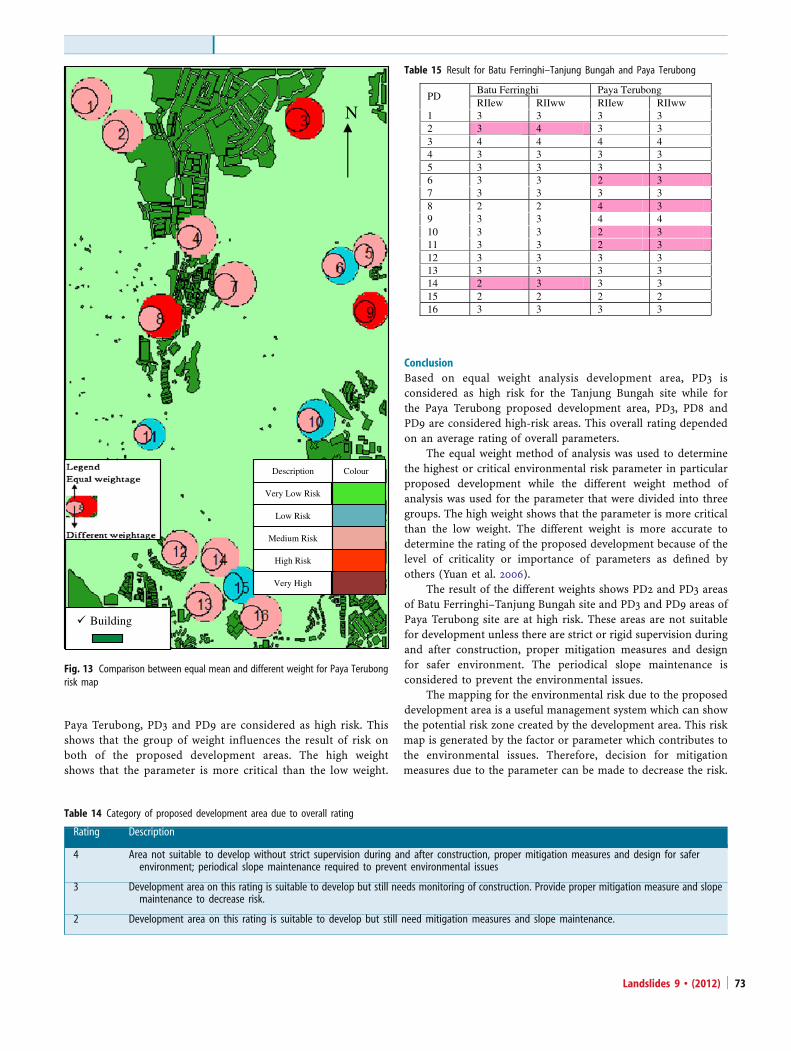
Paya Terubong, PD3 and PD9 are considered as high risk. Thisshows that the group of weight influences the result of risk onboth of the proposed development areas. The high weightshows that the parameter is more critical than the low weight.
ConclusionBased on equal weight analysis development area, PD3 isconsidered as high risk for the Tanjung Bungah site while forthe Paya Terubong proposed development area, PD3, PD8 andPD9 are considered high-risk areas. This overall rating dependedon an average rating of overall parameters.
The equal weight method of analysis was used to determinethe highest or critical environmental risk parameter in particularproposed development while the different weight method ofanalysis was used for the parameter that were divided into threegroups. The high weight shows that the parameter is more criticalthan the low weight. The different weight is more accurate todetermine the rating of the proposed development because of thelevel of criticality or importance of parameters as defined byothers (Yuan et al. 2006).
The result of the different weights shows PD2 and PD3 areasof Batu Ferringhi–Tanjung Bungah site and PD3 and PD9 areas ofPaya Terubong site are at high risk. These areas are not suitablefor development unless there are strict or rigid supervision duringand after construction, proper mitigation measures and designfor safer environment. The periodical slope maintenance isconsidered to prevent the environmental issues.
The mapping for the environmental risk due to the proposeddevelopment area is a useful management system which can showthe potential risk zone created by the development area. This riskmap is generated by the factor or parameter which contributes tothe environmental issues. Therefore, decision for mitigationmeasures due to the parameter can be made to decrease the risk.
Table 14 Category of proposed development area due to overall rating
Rating Description
4 Area not suitable to develop without strict supervision during and after construction, proper mitigation measures and design for saferenvironment; periodical slope maintenance required to prevent environmental issues
3 Development area on this rating is suitable to develop but still needs monitoring of construction. Provide proper mitigation measure and slopemaintenance to decrease risk.
2 Development area on this rating is suitable to develop but still need mitigation measures and slope maintenance.
Table 15 Result for Batu Ferringhi–Tanjung Bungah and Paya Terubong
PDBatu Ferringhi Paya TerubongRIIew RIIww RIIew RIIww
1 3 3 3 32 3 4 3 33 4 4 4 44 3 3 3 35 3 3 3 36 3 3 2 37 3 3 3 38 2 2 4 39 3 3 4 410 3 3 2 311 3 3 2 312 3 3 3 313 3 3 3 314 2 3 3 315 2 2 2 216 3 3 3 3
N
Building
Description
Very Low Risk
Colour
Low Risk
Medium Risk
High Risk
Very High
Fig. 13 Comparison between equal mean and different weight for Paya Terubongrisk map
Landslides 9 & (2012) 73

The assessment of environmental risks for the proposeddevelopment area can be carried out by determination ofparameters and developing the rating approach. The ratingapproach can be used to establish the potential risk zoning ofthe proposed development area. From the zoning guideline orstandard, the viability of any proposed development can bedetermined. The mitigation or rejection that is found to be mostsatisfactory would assist authority for approval.
References
Bernados AG, Kaliampakos DC (2004) A methodology for assessing geotechnical hazardsfor TBM tunneling-illustrated by the Athens Metro, Greece. Int J Rock Mech Min Sci41(6):987–999
Chen SC, Ferng JW, Wang YT et al (2008) Assessment of disaster resilience capacity ofhillslope communities with high risk for geological hazards. Eng Geol 98(3–4):86–101
Dai JJ, Rocke DM (2000) A GIS-based approach to spatial allocation of area sourcesolvent emissions. Environmental Modelling and Software 15:293–302
Dai JJ, Rocke DM (2001) A Knowledge Base for Watershed Assessment for Sediment(WAS). Technical Report, CIPIC, University of California, Davis, CA
GCO (1991) Geotechnical manual for slope, 2nd edn. Geotechnical Engineering Office,Hong Kong, p 301
Gue SS, Tan YY (2002) Mitigating the risk of landslide on hill site development inMalaysia. In: Second IKRAM International Geotechnical Conference, Kuala Lumpur,28/29 October 2002. Ikram R&D center, Kajang, pp 139–157
Gue SS, Tan YY (2003) Residual soils engineering, 1st edition: guidelines fordevelopment on hill-sites. A.A. Balkema Publishers, London, pp 121–129
Institute of Engineers Malaysia (IEM) (2000) Position paper for mitigating the riskof landslide on hill-site development. Paper presented at the technical meeting
on The Engineering Aspects of Hill-Side Development, May 2009, Penang,Malaysia
Kockelman WJ (1986) Some technique for reducing landslide hazards. Bull Assoc EngGeol 23:29–52
Lee S, Pradhan B (2006) Probabilistic landslides hazards and risk mapping on PenangIsland, Malaysia. J Earth Syst Sci 115(6):661–672
Mawahib S (2007) Adakah Pembangunan Sosio-Ekonomi Kini Lestari?Ministry of Science Technology and Innovation (2002) Garis panduan pembangunan di
kawasan tanah tinggi. Ministry of Science Technology and Environment, Malaysia,Putrajaya
Mitchell JK, Katti RK (1981) Soil improvement state-of-the-art report. Proceedings of the10th ICSMFE, Stockholm, Sweden, 261–317
PWD Penang (2004) Cadangan Pengeluasan Kawasan Kajian/Skop dalam LaporanGeoteknik yang dikemukakan oleh Perunding untuk Kelulusan JawatankuasaPengurusan dan Pembangunan Tanah Bukit, Jabatan Kerja Raya Pulau Pinang
Tew KH, Roslan ZA (2004) Soil erosion and sedimentation assessment, control andmanagement plan for the tropical region. Tropical Residual Soils Engineering, Editedby Gue See Sew, Faisal Haji Ali, and Bujang BK Huat, Taylor & Francis, pp 193–211
Yuan R, Yang YS, Qiu X, Ma FS (2006) Environmental hazard analysis and effectiveremediation of highway seepage. J Hazard Mater 142:381–388
F. Ahmad : A. S. Yahaya : S. H. A. HairySchool of Civil Engineering,University of Science Malaysia,14300, Nibong Tebal, P. Pinang, Malaysia
M. M. Ali ())Department of Civil Engineering,Jubail University College,Jubail Industrial City, 31961, Saudi Arabiae-mail: [email protected]
Original Paper
Landslides 9 & (2012)74