Qualification of the Lasentec M600P Particle
58
PacificNorthwest National Laboratory Operated by Battelle for the U.S. Department of Energy January 27,2000 Mr. Thomas H. May ASTD Project Manager CH2M Hill MSIN: R2-11, 2750E/A215/200E Richland, WA 99352 RE: REISSUAL OF THE REPORT ‘QUALIFIACTION OF THE LASENTEC M600P PARTICLE SIZE ANALYZER AND THE RED VALVE MODEL 1151 PRESSURE SENSOR” Dear Ml. May: Attached is the PNNL report entitled “Qualification of the Lasentec M600P Particle Size Analyzer and the Red Valve Model 1151 Pressure Sensor”. The report is being reissued atkr the earlier version has been recakl due to numerous printing errors, which were realized after mailing. If you have any questions, please do not hesitate to contact me. Sincerely Project Manager encl: 902 BattelleBoulevard● l?O. Box 999 c Richland,WA 99352 Telephone (509) 3737240 ■ Email [email protected] ■ Fax (509) 3763108 --.-,. .---y +;= “r----- 7 ~ , ..”,=, ., ..... ,--.~<--7 -—. ,, .-, >........ ,.J.P” ,. ,.,, - ..--y~T,T,- .- ..-. —. .. —— . . . %7 .
Transcript of Qualification of the Lasentec M600P Particle

PacificNorthwestNational Laboratory
Operated by Battelle for theU.S. Department of Energy
January 27,2000
Mr. Thomas H. MayASTD Project ManagerCH2M HillMSIN: R2-11, 2750E/A215/200ERichland, WA 99352
RE: REISSUAL OF THE REPORT ‘QUALIFIACTION OF THE LASENTEC M600PPARTICLE SIZE ANALYZER AND THE RED VALVE MODEL 1151 PRESSURESENSOR”
Dear Ml. May:
Attached is the PNNL report entitled “Qualification of the Lasentec M600P ParticleSize Analyzer and the Red Valve Model 1151 Pressure Sensor”. The report is being reissuedatkr the earlier version has been recakl due to numerous printing errors, which were realizedafter mailing.
If you have any questions, please do not hesitate to contact me.
Sincerely
Project Manager
encl:
902 BattelleBoulevard● l?O. Box999 c Richland,WA 99352
Telephone (509) 3737240 ■ Email [email protected] ■ Fax (509) 3763108
--.-,. .---y +;= “r----- 7 ~ , ..”,=,., ........,--.~<--7 -—. ,,.-, >.........,.J.P”,. ,.,,- ..--y~T,T,- .- ..-. —. .. —— . . .
%7 .

.
PacificNorthwestNationalLaboratory
Operated by Battelle for theU.S. Department of Energy
PNNL-13064
Qualification of the Lasentee M600PParticle Size Analyzer and the RedValve Model 1151Pressure Sensor
Pacific Northwest National Laboratory, Richland, WashingtonJ. R BonthaN.*G. ColtonE. A. Daymo
Oak Ridge National Laboratory, Oak Ridge, TemiesseeT. D. HykonC. K. Bayne ,.
~DCH2M ~ Richland, WashingtonT. H. May
&&(X\~ “
~h( 3 \2WJ ~$J)fjg \
January 2000
,
..
DISCLAIMER
This reportwaspreparedas anaccountofworksponsoredbyanagencyoftheUnitedStatesGovernment.Neitherthe UnitedStatesGovernmentnor anyagencythereofinor BattelleMemorialInstituteYnoranyoftheiremployees,makesanywarranty,expressedor implied,or assumesany legal liability or responsibilityfor “theaccuracy,completeness,orusefulnessof any information,apparatus,product,or process disclosed, or representsthat its use would not infringe privately owned rights. Referencehereinto any specificcommercialproduc~process,or serviceby trade name, trademark”manufacturer,orotherwisedoesnot necessarilyconstituteor implyits endorsemen~recommendation,orfavoringby the UnitedStatesGovernmentor any agencythereo~or BattelleMemorialInstitute.The views and opinions of authors expressed herein do not necessarily state orreflect those of the United States Government or any agency thereof.
PACIFIC NORTHWEST NATIONAL LABORATORYoperated by
BATTELLE MEMORIAL INSTITUTEforthe
UNITED STATES DEPARTMENT OF ENERGYunder Contract DE-AC06-76RL0 1830
Printed-in the United Statesof keri’a
Available[o DOE andDOE contractorsfrom theOfiice of Scientificand TechnicalInformation ?.0. Box 62, Oak Ridg~ TN 3783~
prims availablefrom (615)576-8401. .
,,.
Available[o the public from the NarionalTechnicalInformation ServicqU.S.Departmentof Commerce,5285PortRoyalRd., Springfield, VA 22161
—— .-

DISCLAIMER
Portions of this document may be illegiblein electronic image products. Images areproduced from the best available originaldocument.
PNNL-13064
.-— ...— —.- ,.. ---- . . . -., .,-.m. . ——.-—... . ...—,,,
Qualification of the Lasentec M600P ParticleSize Analyzer and the Red Valve Model 1151Pressure Sensor
Pacific Northwest National Laboratory, Richland, WashingtonJ. R BonthaN. G. ~konE. A. DaYmo
Oak Ridge National Laboratory, Oak Ridge, Temessee
T.D. HjltonC. K. Bayne
CH2M Hill, Richland, WashingtonT. ~ May
January2000
Prepared for the U.S. Department of Energyunder Contract DE-A~6-76RL0 1830
Pacific Northwest National LaboratoryRichland, Washington 99352

.———e
Abstract
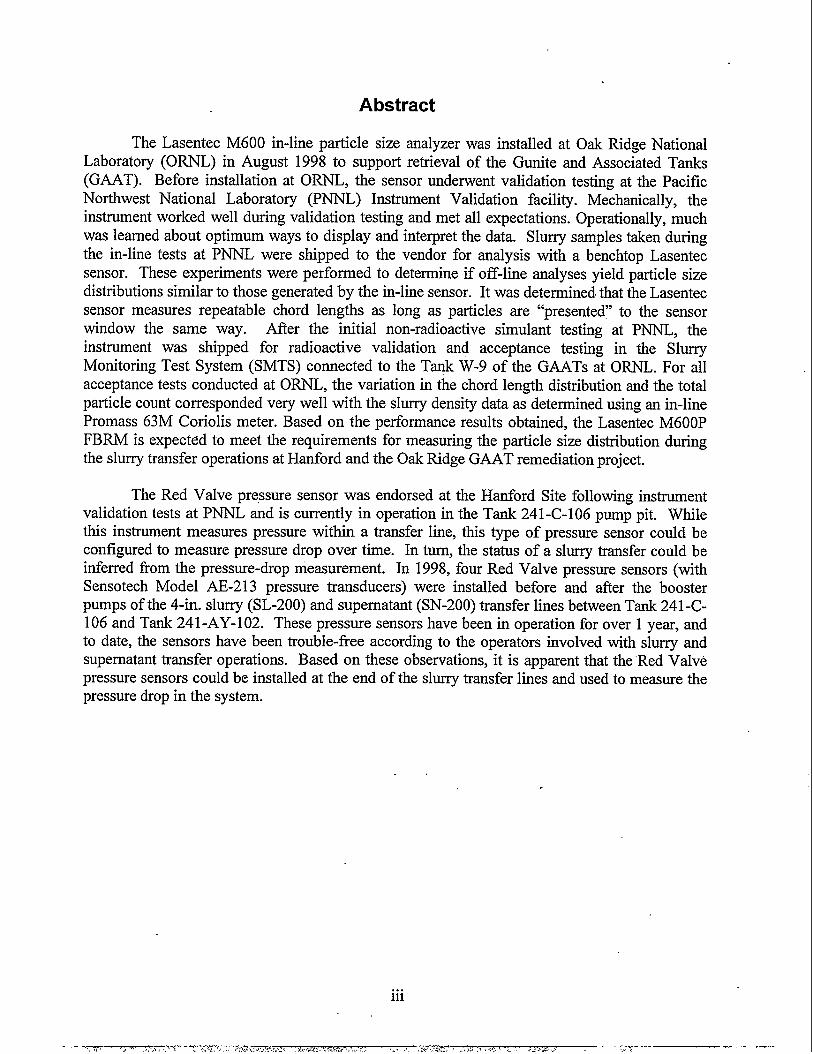
The Lasentec M600 in-line particle size analyzer was installed at Oak Ridge NationalLaboratory (ORNL) in August 1998 to support retrieval of the Gunite and Associated Tanks(GAAT). Before installation at OWL, thesensor undement validation testing attie PacificNorthwest National Laboratory (PNNL) Instrument Validation facility. Mechanically, theinstrument worked well during validation testing and met all expectations. Operationally, muchwas learned about optimum ways to display and interpret the data. Slurry samples taken duringthe in-line tests at PNNL were shipped to the vendor for analysis with a benchtop Lasentecsensor. These experiments were performed to determine if off-line analyses yield particle sizedistributions similar to those generated by the in-line sensor. It was determined. that the Lasentecsensor measures repeatable chord lengths as long as particles are “presenter’ to the sensorwindow the same way. After the initial non-radioactive simulant testing at PNNL, theinstrument was shipped for radioactive validation and acceptance testing in the SlurryMonitoring Test System (SMTS) connected to the Tagk W-9 of the G&4Ts at ORNL. For allacceptance tests conducted at ORNL, the variation in the chord length distribution and the totalparticle count corresponded very well with the slurry density data as determined using an in-linePromass 63M Coriolis meter. Based on the petiormance results obtained, the Lasentec M600PFBRM is expected to meet the requirements for measuring the particle size distribution duringthe slurry transfer operations at Hdord and the Oak Ridge GAAT remediation project.
The Red Valve pressure sensor was endorsed at the Hanford Site following instrumentvalidation tests at PNNL and is currently in operation in the Tank 241-C-106 pump pit. Whilethis instrument measures pressure within a transfer line, this type of pressure sensor could beconilgured to measure pressure drop over time. In turn, the status of a slurry transfer could beinferred from the pressure-drop measurement. In 1998, four Red Valve pressure sensors (withSensotech Model AE-213 pressure transducers) were installed before and after the boosterpumps of the 4-in. slurry (SL-200) and supematant (SN-200) transfer lines between Tank 241-C-106 and Tank 241-AY-1 02. These pressure sensors have been in operation for over 1 year, andto date, the sensors have been trouble-flee according to the operators involved with slurry andsupematant transfer operations. Based on these observations, it is apparent that the “Red Valvepressure sensors could be installed at the end of the slurry transfer lines and used to measure thepressure drop in the system.
. . .111
-7.. - - --------

. -._-._.._,. ----- ._ _- . -- —.—-—..-. —
iv
ASTD
CERCLA
DOE
TDI
HTI
FBRM
GAAT
IVF
tiST
ORNL
PNNL
SMTS
Nomenclature
Accelerated Site Technology Deployment project
Comprehensive Environmental Response, Compensation, and Liability Act
U.S. Department of Energy
Technology Deployment Initiative
Hanford Tanks Initiative
Focused Beam Reflectance Measurement
Gunite and Associated Tanks
Instrumentation Validation Facility
Melton Valley Storage Tanks
Oak Ridge National Laboratory
Pacific Northwest National Laboratory
Slurry Monitoring Test System
v
---- -r. - ---- : ,----.—. —-- .- —..

—
vi
1.0 Introduction ............................................................................................................................l.l
2.0 Technical Summary and Recommendations .........................................................................2.12.1 Lasentec Particle-Size Analyzer ..................................................................................... 2.12.2 Red Valve Pressure Sensor ............................................................................................. 2.22.3 Recommendations .......................................................................................................... 2.3
3.0 Lasentec M600P Particle Size Analyzer ................................................................................3.13.1 Instrument Description and Specifications ..................................................................... 3.13.2 Installation and Validation Testing at PNNL ................................................................. 3.5
3.2.1 Effect of Air Bubbles ..................~............................................................................ 3.53.2.2 Effect of Solids Coating ........................................................................................... 3.83.2.3 Effect of Simukmt Color .......................................................................................... 3.93.2.4 Effect of Change in the Simulant Flow Rate ........................................................... 3.93.2.5 Effect of Changes in Solids Concentration ............................................................ 3.123.2.6 Effect of Scan Time ............................................................................................... 3.143.2.7 Comparison of In Line Lasentec Data to Off Line Sieve Analysis ....................... 3.153.2.8 Comparison of In Line Lasentec Data to Bench-top (off-line) Lasentec
Analyzer ................................................................................................................. 3.163.3 Acceptance Testing at O~L ....................................................................................... 3.16
4.0
5.0
3.3.1 Slurry Test 1............................................................................................................ 3.203.3.2 Slurry Test 2 ........................................................................................................... 3.243.3.3 Slurry Test 3 ........................................................................................................... 3.243.3.4 Slurry Test 4 ........................................................................................................... 3.253.3.5 Slurry Test 5 ........................................................................................................... 3.253.3.6 Slurry Test 6 ........................................................................................................... 3.253.3.7 Statistical Analysis of the Lasentec Performance .................................................. 3.263.3.8 Suspended Solids ................................................................................................... 3.28
Red Valve Pressure Sensor ....................................................................................................4.1
References ..............................................................................................................................5.1
Appendix A: Background Information .........................................................................................A.1
vii
~- ,,, ., .-y, ,.,, 3.. ,! !>, ,. .. . . ! ., s .!, ., ’- ....?, ,. >-.-, ,,, .:. ., ., - w-, _, ,, :,, -., . G“?& . . , > V,*:.* -—-T —--7------ -...—.
.___. _——_ .—— —
Figures
Figure 3.1. Schematic of the FBRM Probe TipO; Copyright 1999, Laser SensorTechnology, Inc., Reprinted with Pemission .......................................................... 3.1
Figure 3.2. FBRM Approach for Measuring the Chord Length Using Lasentec ParticleSize AnalyzerQ; Copyright 1999, Laser Sensor Technology, Inc., Reprintedwith Permission ........................................................................................................ 3.2
Figure 3.3. Typical Chord Length Distribution from an in-line Lasentec FBRM MonitorObtained at PNNL Using a 30 VOIYOGibbsite/Graphite Slurry at a SlurryVelocity of 1.8 m/s (Daymo et al. 1996 and 1998) .................................................. 3.3
Figure 3.4. Schematic of the Test Loop at the Instrument Validation Facility at PNNL(Reynolds et al. 1996) .............................................................................................. 3.6
Figure 3.5. Density in Down-Leg vs. Density in the Up-Leg Section of the Pipe Loop asDetermined by the Density Cup Measurements (Daymo et al.1996) ...................... 3.7
Figure 3.6. Lasentec Mean Particle Size Distribution Obtained Using Graphite Slurrywith and Without Air Bubbles Introduced into the Pipeline (Daymo et al.1996) ........................................................................................................................ 3.7
Figure 3.7. Lasentec Mean Particle Size Distribution for a Bentonite Slurry with andWithout the Addition of Coloring Agent (Daymo et al. 1996) .............................. 3.10
Figure 3.8. Effect of Slurry Velocity on the Lasentec Particle Size Distribution for a 3.5-wtYoKaolin and 1.5-wt% Silica Slurry (Daymo et al. 1996) ................................. 3.11
Figure 3.9. Effect of Slurry Velocity on the Lasentec Particle Size Distribution for a 3.5-wt% Kaolin and 1.5-wt% Silica Slurry (Daymo et al 1996) .................................. 3.11
Figure 3.10. Effect of Change in Solids Concentration on the Lasentec (chord lengthcubed) Particle Size Distribution as Observed Before and After the Additionof Silica to a 5-wt% Kaolin Slurry (Daymo et al. 1996) ........................................ 3.13
Figure 3.11. Effect of Change in Solids Concentration on the Lasentec (chord lengthcubed) Particle Size Distribution as Observed Before and after the Additionof Kaolin to a 2.5-wt’XOSilica Slurry (Dymo et al. 1996) ...................................... 3.13
Figure 3.12. Effect of the Scan Time on the Lasentec Mean Chord Length Cubed ParticleSize Distribution for a 7-wt% Kaolin and 3-wt% Silica Slurry (Daymo et al.1996) ...................................................................................................................... 3.14
Figure 3.13. Comparison of the Sieve Analysis and the Lasentec (length cubed) MeanParticle Size Distribution Obtained Using a 10-wt% Silica Slurry (Daymo etal. 1996 and 1998) .................................................................................................. 3.15
Figure 3.14. Comparison of the Particle Size Distribution (length cubed) as Determinedby an in line (M500PF) and Bench Top (M500LF; duplicate) LasentecMonitor for a 5.0-wt% Kaolin Slurry (Daymo et al. 1996) .................................. 3.17
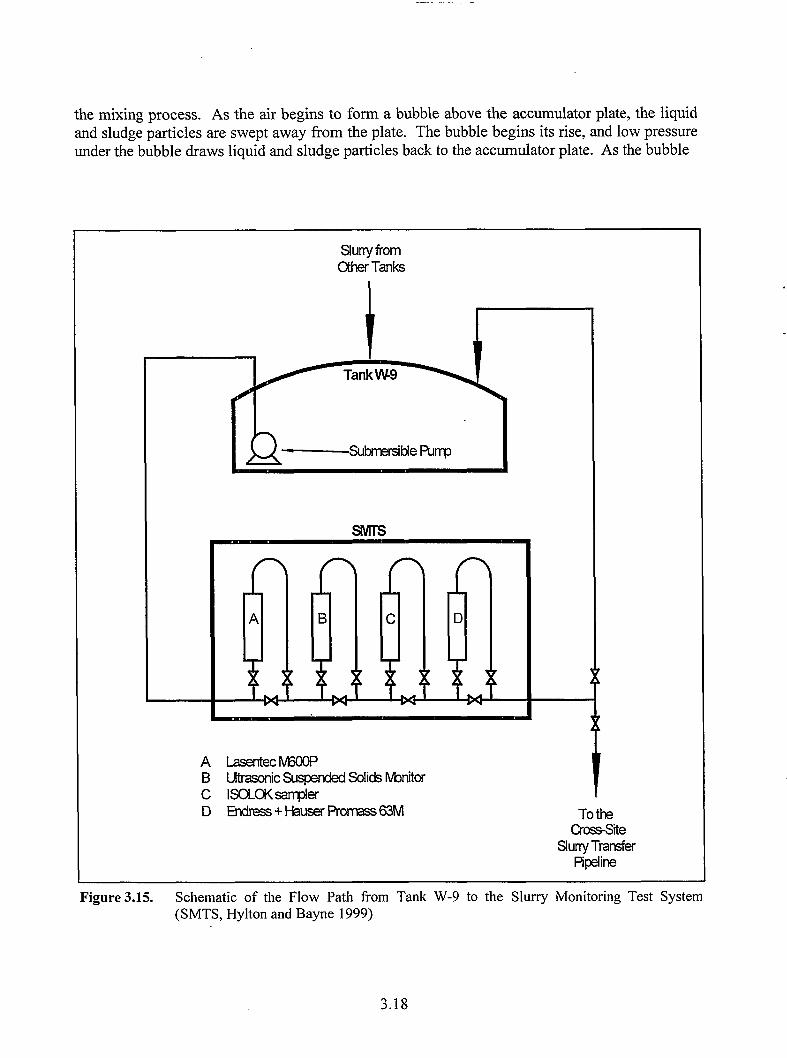
Figure 3.15. Schematic of the Flow Path from Tank W-9 to the Slurry Monitoring TestSystem (SMTS, Hylton and Bayne 1999) .............................................................. 3.18
. . .VIII

Figure 3.16. The Lasentec M600P Monitor (indicated by the arrow) Installed in theSlurry Monitoring Test System (SMTS) at ORNL (Hylton and Bayne 1999) ......3.19
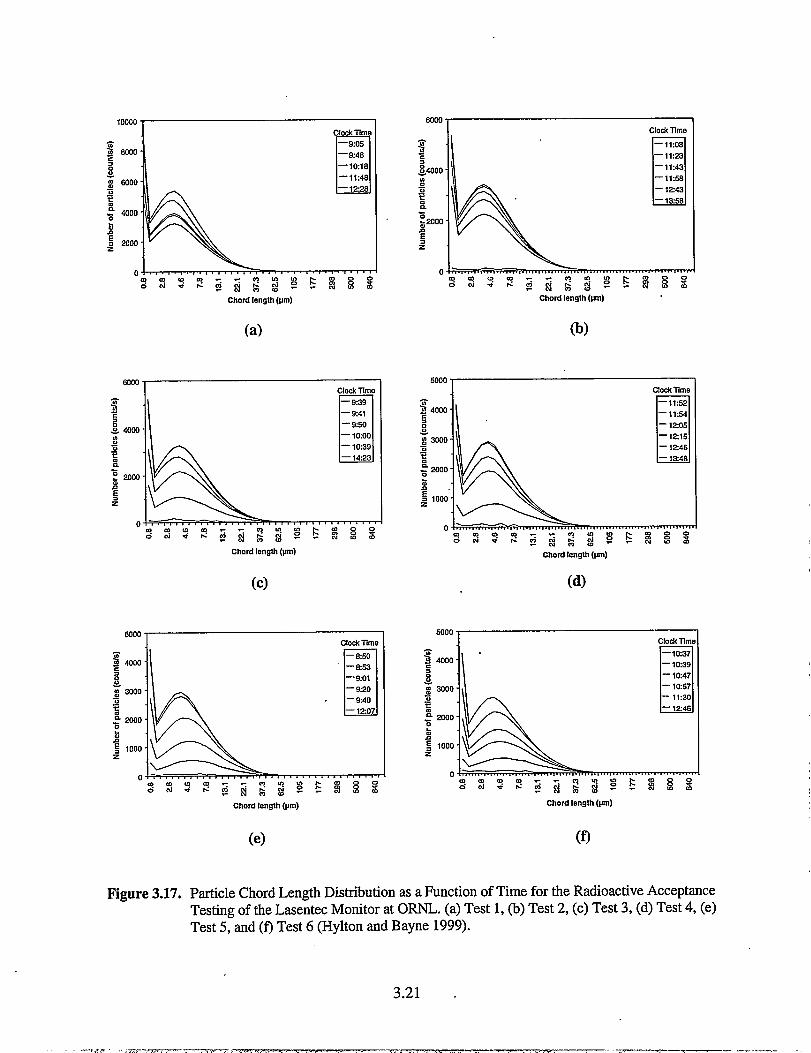
Figure 3.17. Particle Chord Length Distribution as a Furiction of Time for the RadioactiveAcceptance Testing of the Lasentec Monitor at ORNL. (a) Test 1, (b) Test 2,
(c) Test 3, (d) Test 4, (e) Test 5, and (f) Test 6 (Hylton and Bayne 1999). ...........3.21
Figure 3.18. Total Particle Count as a Function of Time for the Radioactive AcceptanceTesting of the Lasentec Monitor at ORNL. (a) Test 1, (b) Test 2, (c) Test 3,(d) Test 4, (e) Test 5, and (f) Test 6 (Hylton and Bayne 1999) ............................. 3.22
Figure 3.19.
Figure 3.20,
Figure 3.21,
Figure 4.1.
Figure 4.2.
Figure 4.3.
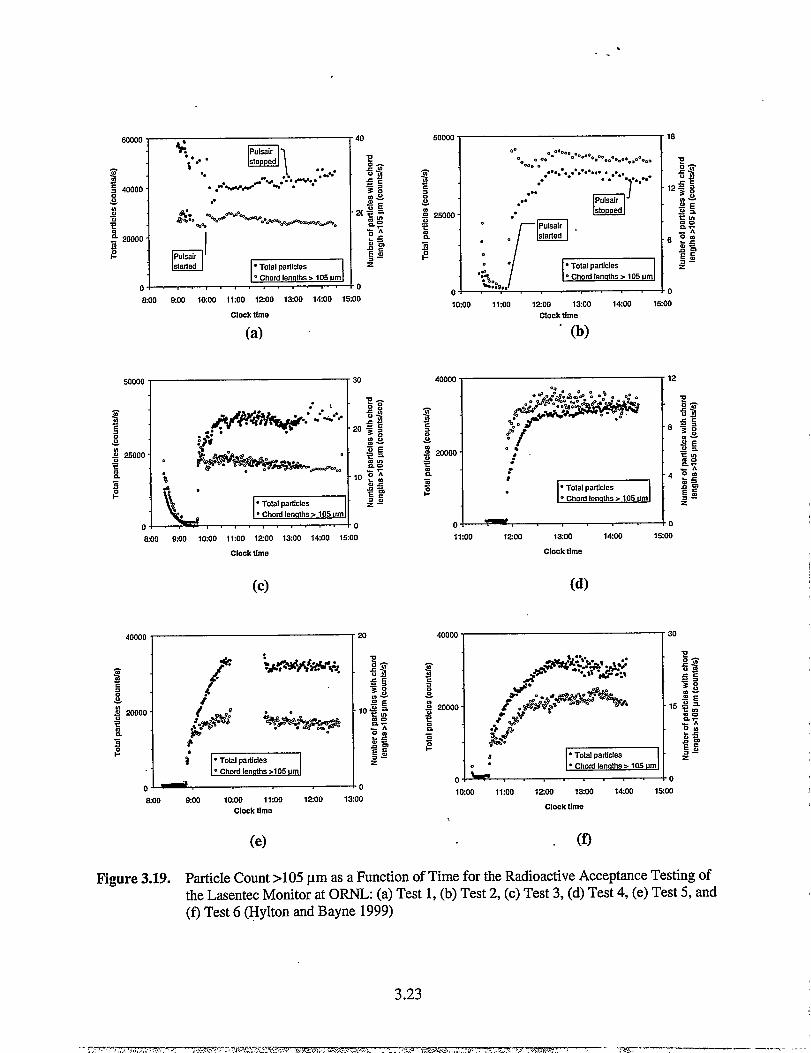
Particle Count >105 pm as a Function of Time for the RadioactiveAcceptance Testing of the Lasentec Monitor at ORNL: (a) Test 1, (b) Test 2,(c) Test 3, (d) Test 4, (e) Test 5, and (f) Test 6 (Hylton and Bayne 1999) ........... 3.23
Overall Frequency Distribution of Particle Size Chord Lengths for the SixTests at OWL (Hylton and Bayne 1999) ............................................................. 3.27
Line Fitted to the Lasentec’s total particle count versus suspended solidsconcentration data with a 95% conildence interval (Hylton and Bayne 1999) ....3.28
Comparison of the Pressure Measured by the Red Valve Pressure Sensor tothat Measured by the Direct Tap Rosemount Pressure Sensor (Reynolds et al.1996) . ....................................................................................................................... 4.2
Pressure Measurement Data Obtained on September 24, 1999 from the RedValve Pressure Sensor Installed in the 4-in. Discharge Line of the BoosterPump in SL-200 Slurry Transfer Line ..................................................................... 4.3
Pressure Measurement Data Obtained on September 26, 1999 from the RedValve Pressure Sensor Installed in the 4-in. Discharge Line of the BoosterPump in SL-200 Slurry Transfer Line ..................................................................... 4.3
Tables
Table 3.1. Matrix of Simulant Slurries Used to Validate the Instruments at the HanfordSite .............................................................................................................................. 3.8
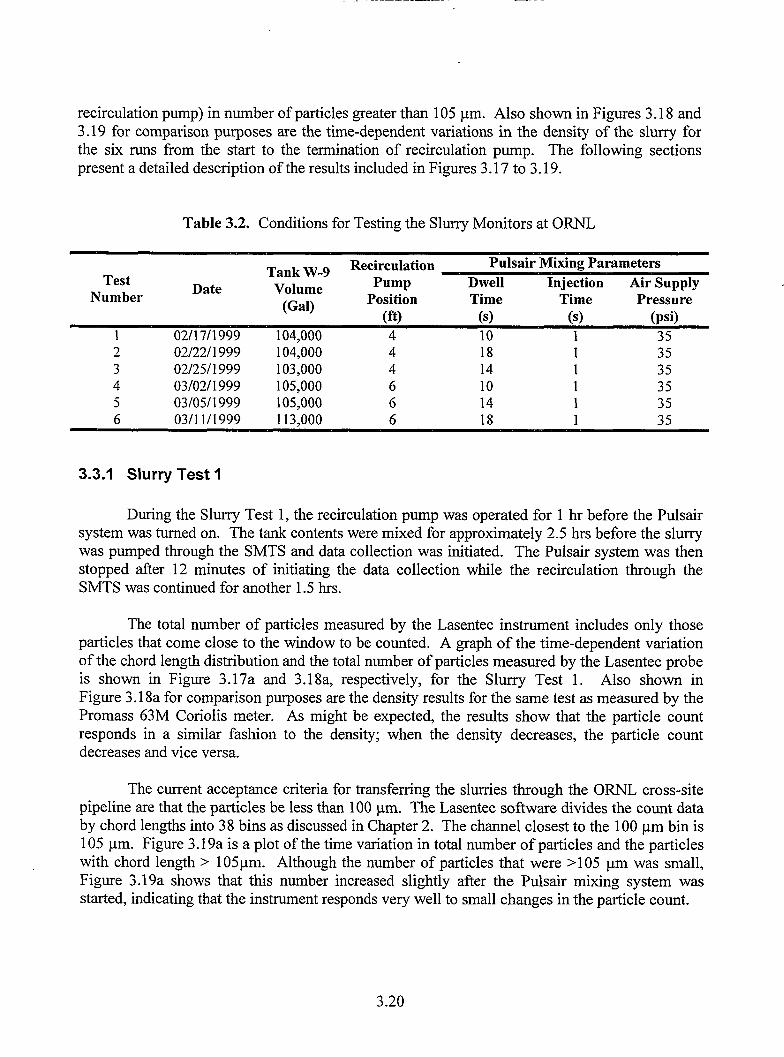
Table 3.2. Conditions for Testing the Slurry Monitors at ORNL .............................................. 3.20
Table 3.3. Lasentec M600P Particle Distribution Averages and Standard Deviations(in parentheses) of Cord Lengths .............................................................................. 3.26
ix
—. ... . .. ... ,.., - .-— _m.. . ..— ,.. .. . .. -:: — -— ..–- —.-.

1.0 Introduction
Remediation plans for most of the tank wastes stored at both the Hanford and Oak RidgeNational Laboratory (ORNL) sites include retrieval operations to remove the wastes from storagetanks and transport operations to transfer the wastes to treatment facilities. Retrieval operationswill involve mixing solid and liquid wastes to create slurries that can be transported via pipelinesto specified locations. Sedimentation of solids and precipitation or gelation reactions duringslurry transport could result in blocked pipelines. The economic penalties for pipeline blockagesare steep; for example, the U.S. Department of Energy (DOE) maybe required to pay as much as$2 million for each day that tank waste cannot be delivered to the privately owned vitrificationfacility at the Hanford Site. Additional information regarding waste issues is provided inAppendix A.
To reduce the likelihood of pipeline blockage during waste-transfer operations, theAccelerated Site Technology Deployment (ASTD) project,(a) with finding from Project W-320(Waste Retieval Sluicing System) and Hanford Tanks Initiative (HTI), is evaluating three onlineslurry monitoring devices for use at the Hanford and ORNL sites. These include: (1) theLasentec M600P Particle Size Analyzer developed by Laser Sensor Technology, Inc., Redmond,WA/b) (2) the Red Valve Pressure sensor manufactured by Red Valve Company, Inc.,Pittsburgh, PA, and (3) a densimeter developed at the Pacific Northwest National Laboratory(PNNL). There are three phases of instrument evaluation: qualification, implementation, anddeployment. Instruments are procured a.dor fabricated, calibrated, and installed in their targetsystem during the qualification phase. Additionally, at the end of this phase, the instrumentsundergo acceptance testing and are made available to operations. Instrument performance isdocumented and shared with all complex-wide slurry-transfer projects during the deploymentphase. In the final implementation phase, the slur@ monitors are intended to monitor wasteslurries during tank waste retrieval operations.
This report documents the qualification phase for the Lasentec Particle Size Analyzer andthe Red Valve Pressure Sensor while the scope of the ASTD Slurry Monitoring project includesqualifying the densimeter. Because testing is in progress, qualification of the densimeter will bedocumented in a separate report during FY 2000. A technical summary of the Lasentec particlesize analyzer and Red Valve pressure-sensor qualification tests, along with recommendations, ispresented in Section 2. Technical details are presented for the Lasentec in Section 3 and for theRed Valve Pressure Sensor in Section 4.
‘a)Further information about the Slurry Monitoring ASTD project can be found in the SlurryMonitoring TDI Deployment Plan (Fluor Daniel Hdord 1997) and the report entitled SlurryMonitoring ASTD Project Supplemental Information (Fluor Daniel Hanford 1998).
‘b)The Lasentec M600P is an in-line analyzer for measuring chord-length distribution ofsuspended solid particles. Chord length and particle size are not exactly equivalent terms, butthere is a direct correlation between the two. For the purposes of the testing performed, theLasentec M600P was used to evaluate the particle size distribution of the suspended solidparticles in the slurries. As such, the instrument will be referred to as a pa@icle size analyzerelsewhere in this report.

-. -.. —..—.-..--—- ..—..—
1.2

2.0 Technical Summary and Recommendations
This section summarizes the technical”achievements of the Lasentec particle size analyzerand the Red Valve pressure sensor based on validation and acceptance test results and offersrecommendations for using these instruments.
2.1 Lasentec Particle-Size Analyzer
The Lasentec M600 in-line particle size analyzer was installed at ORNL in August 1998to support sludge retrieval from the Gunite and Associated Tanks (GMT). Before installation atORNL, the sensor underwent validation testing with waste slurry simulants (non-radioactive,non-hazardous analogs of nuclear tank waste). These tests were pefiormed at the PNNLInstrument Validation Facility (IVF). Eight simulants were chosen to test the Lasentec: fourdifferent silicdkaolin weight ratios at two total solids concentrations, 5-wt% and 10-wt% solids.Kaolin particles were around 1 pm in size, whereas the silica particles were around 100 to 1000pm in size. The fill range of the Lasentec sensor (0.8 to 1000 pm) was validated by using silicaand kaolin.
Mechanically, the instrument worked well during validation testing and met allexpectations. Operationally, much was learned about optimum ways to display and interpret thedata. Scan time, the amount of time that particles are measured and co~ted by the Lasentecsensor, was found to be important. “Ifthe scan time is less than one minute, the data, particularlyfor larger particles, were too noisy and inconsistent to be of much use. At one minute or greaterscan times, noise in the data was dramatically reduced. The Lasentec calculated severalstatistical particle size averages by manipulating collected data unweighed or number average,length-weighted average, length-squared weighted average, and length-cubed weighted averageparticle size. Only the length-cubed weighted particle size ‘average showed any significantvariation during the eight test cases. The other average values calculated by the Lasentecsoftware remained fairly constant despite changes in the silica/kaolin weight ratio. This resultwas unexpected because an increase in the amount of silica, i.e., large particles, should increasethe average particle size. Even though only one statistic appears to be particularly relevant whentracking process changes, the histograms can be very valuable. For example, a sieve analysis onthe silica added to the pipe loop was almost petiectly matched by the Lasentec sensor.
Slurry samples taken during the in-line tests at PNNL were shipped to the vendor foranalysis with a benchtop Lasentec sensor. These experiments were performed to determine ifoff-line analyses yield particle size distributions similar to those generated by the in-line sensor.Although the in-line Lasentec data did not match those produced by the benchtop model, severaldifferent benchtop units and in-line units (operating in a static mode) measured the same chord-length weighted histograms for the same sample. These- results suggest that the Lasentec sensormeasures repeatable chord lengths as long as particles are “presented” to the sensor window thesame way. The laboratory and in-line measured length-weighted mean particle sizes did notmatch. This may have been caused by potential deficiencies in mixing the samples during thebenchtop tests (e.g., the fast-settling silica particles are difficult to keep homogeneous in thesample bottle) and sampling slurries from the pipe loop, or perhaps by strati&ing solids within
2.1
. . —.. .—--.:. -7--- --.-T.?------- -.” -,- —. —-. -.. -.. — —

the test-loop pipe near the in-line sensor.comparing Lasentec in-line data to benchtop
This finding should be used as a caveat whendata in the future. If comparisons between in-line
and laboratory sensors are desired, it is important to compare Lasentec in-line data to a Lasentecbench-top sensor. Note that the solids must be homogeneous, both in the pipe and the benchtopbeaker, for results from both sensors to match.
After the initial non-radioactive simulant testing at PNNL, the instrument was shipped forradioactive validation and acceptance testing in the Slurry Monitoring Test System (SMTS)connected to the Tank W-9 of the GAATs at ORNL. The Lasentec equipment validation runs atORNL were conducted at three different dwell times for the Pulsair system and two recirculationpump positions. For all acceptance tests conducted at ORNL, the variation in the chord lengthdistribution and the total particle count corresponded very well with the slurry density data asdetermined using an in-line Promass 63M Coriolis meter. Similarly, the results also show that> 99.9°/0 of the particles have chord lengths < 105 pm and that the instrument was extremelysensitive to small variations in the particle size distribution. Based on the performance resultsobtained, the Lasentec Focused Beam Reflectance Measurement (FBRM) is expected to meet therequirements of the GAAT Remediation Project for measuring the particle size distributionduring the slurry-transfer operations at ORNL.
2.2 Red Valve Pressure Sensor
The Red Valve pressure sensor was endorsed at the Hanford Site following instrumentvalidation tests at PNNL and is currently in operation in the Tank 241-C-106 pump pit. Whilethis instrument measures pressure within a transfer line, this type of pressure sensor could beconilgured to measure pressure drop over time. In turn, the status of a slurry transfer could beinferred from the pressure-drop measurement. The Red Valve pressure sensor is certified to ~1% of full scale or 1.0 psig on a 1-to-100 psig scale. Pressure measurement data validated thesensor in the 40 psig to 100 psig range. The pressure measured by the Red Valve pressure sensorin validation tests is within 10/0 of the actual direct pressure tap readings obtained by theRosemount Model 3051 CG sensor.
The principle behind the Red Valve pressure sensor operation suggests that the transducerplugging and fouling issues can be eliminated. In 1998, four Red Valve pressure sensors (withSensotech Model AE-213 pressure transducers) were installed before and after the boosterpumps of the 4-in. slurry (SL-200) and supematant (SN-200) transfer lines between Tank 241-C-106 and Tank 241-AY-1 02. The sensor responds rapidly to changes in the booster pumpdischarge pressure and appears to be extremely sensitive to variations in the discharge pressure.The pressure sensor components in the SL-200 and SN-200 transfer lines are exposed to a totalradiation dosage on the order of 300 R/yr. These pressure sensors have been in operation forover 1 year, and to date, the sensors have been trouble-free according to the operators involvedwith slurry and supematant transfer operations. Based on these observations, it is apparent thatthe Red Valve pressure sensors could be installed at the end of the slurry transfer lines and usedto measure the pressure drop in the system.
2.2

2.3 Recommendations
Based on the performance results obtained, the Lasentec M600P FBRM and the Red Valvepressure sensors are expected to meet the slurry monitoring requirements for measuring theparticle size distribution and pressure drop during the feed delivery, storage, and disposalmissions at Har&ord and the Oak Ridge GAAT remediation project.
2.3
-—z-’-. ,---- m-,--?-m7.7.. ,. ,,,.. .,.-.,W,,,.... +,.. .. ..:.-. .Fn-,.,,<,........ .. ., -1.,+.!. . . . . .

3.0 Lasentec M600P Particle Size Analyzer
This section documents the qualification phase for the Lasentec Particle Size Analyzer.The qualification phase included speci~ing and procuring the instrument, installing andvalidating the instrument using simulated waste streams at PNNL, and installing and acceptancetesting the instrument in the GAAT retrieval system at ORNL.
3.1 Instrument Description and Specifications
The Lasentec M600P is an in-line analyzer that was developed by Laser SensorTechnology, Inc., Redmond, Washington, for measuring chord-length distribution of suspendedsolid particles. Although the chord length and particle size are not exactly equivalent terms, butthere is a direct correlation between the two. For the purposes of the testing pefiormed, theLasentec M600P was used to evaluate the particle size distribution of the suspended solidparticles in the slurries. As such, the instrument will be referred to as a particle size analyzerelsewhere in this report. This instrument uses a technique known as FBRM to providecontinuous in-process and real-time measurement of the rate and degree of change of the particledimension and particle count. A schematic of the FBRM probe tip consisting of a laser beamsource, rotating optics, and “asapphire glass window is shown in Figure 3.1.
/- .—. — ———— —___ ___ -\
km Splitti2r \
k turbulent wdl-mixed flow. A’•. ./
——— ——— ——_ ___ ___ /
Figure 3.1. Schematic of the FBRM Probe Tip@; Copyright 1999, Laser SensorTechnology, Inc., Reprinted with Permission
The most intense part of the focused beam (or beam waist) is approximately 2 pm indimension and 10 pm in depth. The light intensity is distributed across the cross section of thebeam spot in Gaussian fashion with the center being more intense than the edges. The focalpoint, which is just outside the probe window, is rotated around the window at a linear velocityof 2 rds. When the focal point intersects the edge of a particle, the particle begins to backscatterlight as shown in Figure 3.2. The particle continues to backscatter light until the focused beam
3.1
–— -.—r ,- _> --- .-— . . . . .
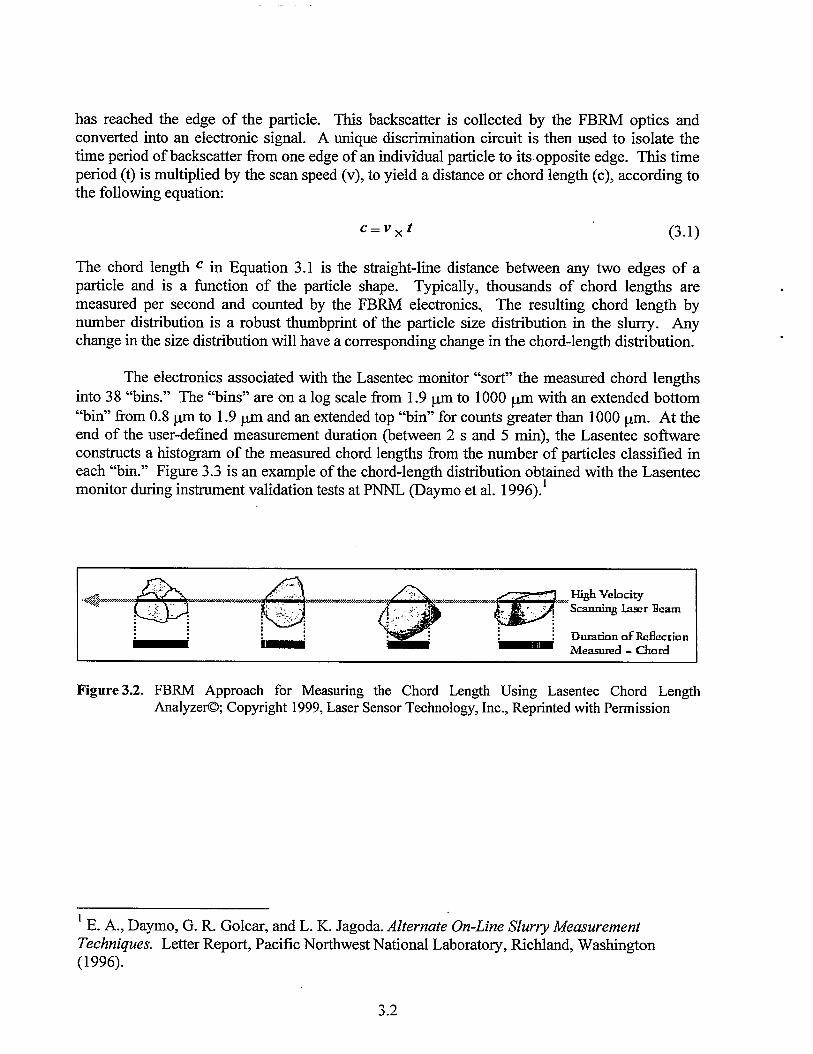
has reached the edge of the particle. This backscatteris collectedly the FBRM optics andconverted into an electronic signal. A unique discrimination circuit is then used to isolate thetime period of backscatter flom one edge of an individual particle to its.opposite edge. This timeperiod (t) is multiplied by the scan speed (v), to yield a distance or chord length (c), according tothe following equation:
C=vxt (3.1)
The chord length c in Equation 3.1 is the straight-line distance between any two edges of aparticle and is a function of the particle shape. Typically, thousands of chord lengths aremeasured per second and counted by the FBRM electronics, The resulting chord length bynumber distribution is a robust thumbprint of the particle size distribution in the slurry. Anychange in the size distribution will have a corresponding change in the chord-length distribution.
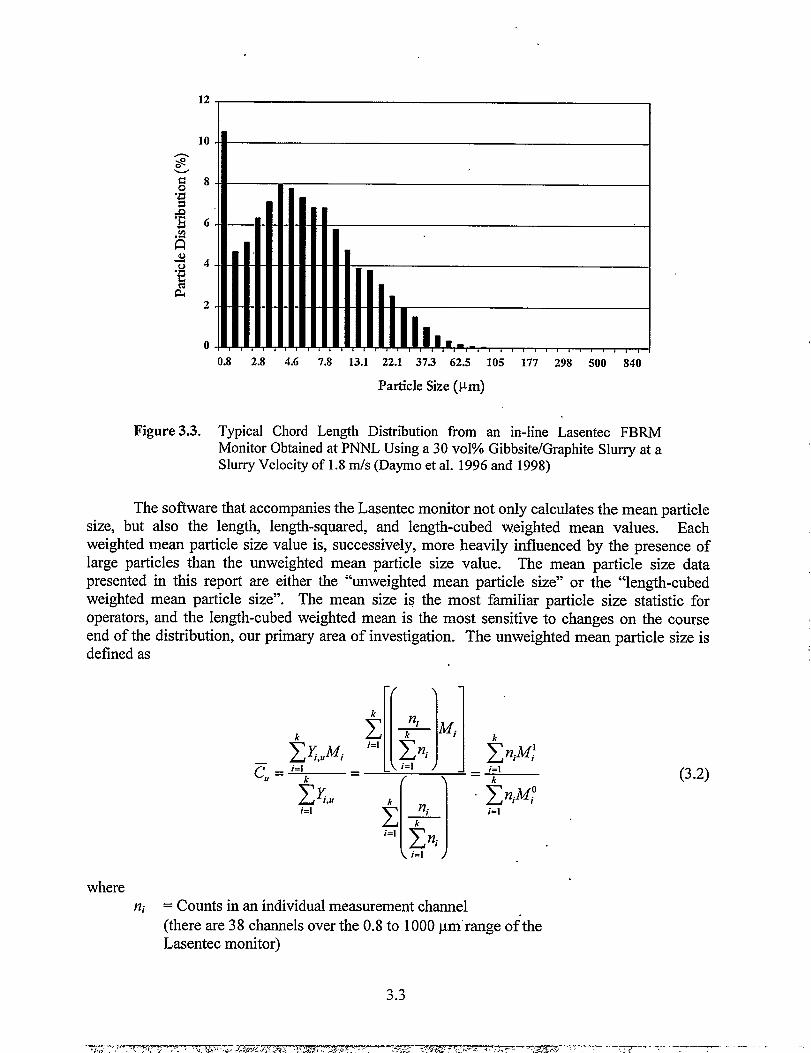
The electronics associated with the Lasentec monitor “sort” the measured chord lengthsinto 38 “bins.” The “bins” are on a log scale from 1.9 pm to 1000 pm with an extended bottom“bin” from 0.8 pm to 1.9 pm and an extended top “bin” for counts greater than 1000 pm. At theend of the user-defined measurement duration (between 2 s and 5 rein), the Lasentec softwareconstructs a histogram of the measured chord lengths from the number of particles classified ineach “bin.” Figure 3.3 is an example of the chord-length distribution obtained with the Lasentecmonitor during-instrument validation tests at PNNL @-aymo et al. 1996).1
HighVelociqScam@ La92rBc3.m
- mDuration of ReflectionLMea..sured - t30rd
Figure 3.2. FBRM Approach for Measuring the Chord Length Using Lasentec Chord LengthAnalyze@, Copyright 1999, Laser Sensor Technology, Inc., Reprinted with Permission
.
.
1E. A., Daymo, G. R. Golcar, and L. K. Jagoda. Alternate On-Line Slurry MeasurementTechniques. Letter Report, Pacific Northwest National Laboratory, Richland, Washington(1996).
3.2
-r, Ily,.,-hi,,,,,,,,,,,,,0.8 2.8 4.6 7.8 13.1 22.1 37.3 62.5 105 177 298 500 840
Particle Size (Pm)
Figure 3.3. Typical Chord Length Distribution from an in-line Lasentec FBRMMonitor Obtained at PNNL Using a 30 VOI%Gibbsite/Graphite Slurry at aSlurry Velocity of 1.8 m/s (Daymo et al. 1996 and 1998)
The software that accompanies the Lasentec monitor not only calculates the mean particlesize, but also the length, length-squared, and length-cubed weighted mean values. Eachweighted mean particle size value is, successively, more heavily influenced by the presence oflarge particles than the unweighed mean particle size value. The mean particle size datapresented in this report are either the “unweighed mean particle size” or the “length-cubedweighted mean particle size”. The mean size is the most familiar particle size statistic foroperators, and the length-cubed weighted mean is the most sensitive to changes on the courseend of the distribution, our primary area of investigation. The unweighed mean particle size isdefined as
~’i,u
i=l
1“~Mik
znii=l
( )“
(3.2)
whereni = Counts in an individual measurement channel
(there are 38 channels over the 0.8 to 1000 pm”range of theLasentec monitor)

Mi = Midpoint size of an individual channel~ = Percentage (%) of counts per channel
~,, = Unweighed mean particle size
k = Upper channel # (2 < k < 38)u = Unweighed value.
Similarly, the length-cubed weighted mean is defined as
(3.3)
where
cc = length-cubed weighted mean particle size
c = length-cubed value.
The Lasentec monitor does not directly account for the velocity of particles as they passthe monitor. To offset this effect, the focal point is scanned at 2 m/s. In addition, themanufacturer recommends that the probe be installed in a vertical up-flow section of pipe withthe probe window positioned at a 45° angle to the flow. The 2 m/s scan compensates forfluctuations in the slurry velocity (at average slurry velocities of 1.8 m/s or slower), whereas theangle of the probe slows the particles in the measurement zone. The slurry flow should also beturbulent because turbulence mixes the particles in the pipe and ensures that “uniformly random”material is presented to the probe window.
According to the manufacturer, in a process with a slurry velocity greater than 1.8 m/s,the flow speed should be held constant so there is a linear offset to the measured data. That is, ifthe slurry velocity is greater than 1.8 rids, there is less time for the Lasentec monitor to reflectlight off a given particle than if the slurry were traveling at a velocity less than 1.8 m/S. TO the
Lasentec monitor, if light is reflected off the surface for a shorter period of time, the particleappears smaller. Likewise, the measured particle size would be greater if the velocity isdecreased to a new velocity that is still greater than 1.8 mk. If the flow speed is greater than1.8 m/s and fluctuates with time, an external flow speed measurement should be provided to theLasentec FBRM electronics for a real-time correction to the shift in measured particle size.
.
.
3.4

3.2 Installation and Validation Testing at PNNL
In 1996 and 1998, the Lasentec particle size and M300 and M600P population monitorswere cold tested at PNNL’s Instrument Validation Facility (IVF) that houses a 3 in. Schedule 40inner-diameter pipe loop, a 250-gal feed tank, and a 225-gpm centrifugal pump. A schematic ofthe test loop is provided in Figure 3.4. For validation tests, the slurry was passed through theW-21 1 loop. More detailed drawings of the IVF are presented in Reynolds et al. 1996.
According to the Lasentec manual and marketing literature, the monitor should not beinstalled in the down-flow configuration because fluid may not completely fill the pipe in thisconfiguration. Lasentec also argues that the solids in the pipe will distribute differently in theup-flow configuration as opposed to the down-flow conilguration. However, installation of theLasentec analyzer in the down-flow leg of the pipe loop did not significantly tiect test resultsfor the following two reasons:
1. There is no evidence that the fluid does not fill the pipe in the down-flow leg of the testloop. If the flow were discontinuous as Lasentec argues, then the instrument readingswould fluctuate with time. No such fluctuations in the total particle counts wereobserved.
2. There is no evidence that solids stratified differently in the up-flow and the down-flowcotilgurations. This is evidenced by similar density cup measurements of the samplestaken from the up- and down-leg sample ports, which indicates there is probably littledifference in the solids concentration in the two legs. Refer to Figure 3.5.
Validation tests in 1998 were pefiormed using the simulant test matrix shown inTable 3.1. In addition to varying the particle size distribution, other parameters that wereinvestigated during the Lasentec acceptance testing at PNNL include the effect of(1) air bubblesin the system, (2) solids that could coat the probe window, (3) simulant color, (4) flow rate, and(5) scan time. Additionally, grab samples of the slurry also were collected and analyzed off-lineto determine the correlation between the in-line and off-line mezi.surements. The results fromthese investigations are described in the following paragraphs.
3.2.1 Effect of Air Bubbles
Because retrieval of tank waste may entrain bubbles into the slurry line, every selectedinstrument must be able to yield relatively stable, useful readings in the presence of air bubbles.To study the effect of air bubbles in the system, the average particle size of a 2-vo1% graphiteslurry was compared before and after air was injected at 1 cti into the flow loop. The resultsfrom this test are illustrated in Figure 3.6. This figure shows that although bubbles increased thenoise in the Lasentec monitor’s measurement, the measured mean particle size changed by lessthan 1YOfrom the value before bubbles were introduced.

EEK1l’ n n n n r-l
Pressure Tap Nametre
*To I/4 Scale
Tank
Sample (S-3 J
Red Valve Laser Diode Nametre
. Clear Section Micromotion F&P Magmeter
F-5n
u
Yokawva Magmeter
Calibration Vessel
7
Throttle Valve
“’” ‘ayva’ve~
Variable Speed Pum
1
El
I-E3
Schematic of the Test Loop at(Reynolds et al. 1996)
r Feed Tank
nDminvdve
ksmple (s-4)
~Sample (S-1)
II!
—Sample (S-2)
I Nottoscdeorexactpositio” I
the Instrument Validation Facility
3.6

I y= 0.9835x+ 0.0167
R*= 0.9967
s,- 1a 1.03-,-(/)s
f? 1.02-
1.02 1.025 1.03 1.035 ‘1.04 1.045 1.05
Density in Up-leg (g/cm3)
Figure 3.5. Density in Down-Leg vs. Density in thePipe Loop as Determined by the Density Cupal.1996)
1.055 1.06 1.065
Up-Leg Section of theMeasurements (Daymo et
12
11.8: -
11.6-- No Air Bubbles With Air Bubbles
11.4--
11.2--
10.8--
10.6--
10-1 I
Figure 3.6. Lasentec Mean Particle Size Distribution Obtained Using Graphite Slurrywith and Without Air Bubbles Introduced into the Pipeline (Daymo et al.1996)
3.7

Table 3.1. Matrix of Simulant Slurries Used to Validate the Instruments at the Hanford Site
Solids Concentration Lasentec MonitorSolids Material(s) (Wt%) Tested
Graphite 6 M300
(mean size: 4 pm) 1115
Gibbsite 11 M300
(mean size: 7.5 pm) 4553
Graphite and Gibbsite M3009% Graphite, 13% Gibbsite11YOGraphite, 16% Gibbsite6?40Graphite, 25% Gibbsite
Bentonite 3 M300
(mean size: 0.8 pm) 611
Bentonite and Mica flakes 10% Bentonite, 4% Mica M300(Mica mean size: 6 pm)Silica 12 M300
(mean size: 3.5 pm) 3454
Plastic Beads 5 M300
(mean size: 18 pm) 2035
Kaolin 5 M600P(Kaolin mean size: 100.8 pm)Kaolin and Silica 4.2% Kaolin, 0.8% Silica M600P(Silica mean size: 3.5V0 Kaolin, 1.5% Silica410 pm) 2.8% Kaolin, 2.2% Silica
8.5% Kaolin, 1.5% Silica7.0% Kaolin, 3.0% Silica5.5% Kaolin, 4.5% Silica
3.2.2 Effect of Solids Coating
.
The Lasentec monitor optics are protected by a sapphire window that is chemicallycompatible with the caustic and highly radioactive tank waste. One concern was whether solidscould coat the window and hinder accurate particle size measurements. To address this concern,the M300 monitor was tested with graphite slurries that coated the entire pipeline. As a result ofthe coating nature of the graphite slurries, two magnetic flow meters installed in the pipe loophad to be removed and cleaned on two separate occasions. Because the Lasentec probe is
3.8

inserted into the flow direction at a 45° ~gle, the sapphire window is self-cleaning. No residuewas found on the probe window when the monitor was removed from the pipe loop after flowtests with graphite were completed.
3.2.3 Effect of Simulant Color
The color of tank waste could vary slightly during waste-retrieval operations, and someconcern exists about whether color changes would affect the monitor’s capability to adequatelymeasure particle size. During one simulant test (4 VOIYObentonite), a total of 0.76 L (0.2 gal) ofred and orange food coloring were added to the feed tank containing 795 L (21 O gal) of slurry tochange the color of the simulant. As a result of the food coloring, the bentonite slurry changedcolor from olive-green to peach. The results of the mean particle size distribution obtainedbefore and after the addition of the coloring agent to the simu&t are shown in Figure 3.7. Thisfigure shows that the Lasentec showed no significant change in the average particledistribution after the food coloring was added to the slurry.
3.2.4 Effect of Change in the Simulant Flow Rate
For most of the Lasentec monitor validation tests, a nominal flow rate of 9 L/s
size
wasselected, corresponding to an average velocity of about 1.8 nds (6 flis) in the 3-in. inner-diameterpipe. This slurry velocity was selected because it is the target velocity for the pipeline in theGAATs at ORNL. There is some concern as to the effect that the flow rate change would haveon the sensitivity of the instrument, as flow rates tend to fluctuate during normal operation of theslurry transfer lines. Also, another concern was that the Lasentec monitor does not directlyaccount for the velocity of particles as they pass the monitor. To offset the effect of flow ratefluctuations, the focal point of the monitor is scanned at 2 mh, and it is recommended that theprobe be installed in a vertical up-flow section of pipe with the probe window positioned at a 45°angle to the flow. The 2 mh scan compensates for fluctuations in the slurry velocity (at averageslurry velocities of 1.8 rds or slower), whereas the angle of the probe slows the particles in themeasurement zone.
According to the manufacturer, in a process with a slurry velocity greater than 1.8 rids,the flow speed should be held constant so there is a linear offset to the measured data. That is, ifthe slurry velocity is greater than 1.8 m/s, there is less time for the Lasentec monitor to reflectlight off a given particle than if the slurry were traveling at a vel’ocity less than 1.8 m/s. To theLasentec monitor, if light is reflected off the surface for a shorter period of time, the particleappears smaller. Likewise, the measured particle size would be greater if the velocity isdecreased to a new velocity that is still greater than 1.8 m/s. If the flow speed is greater than1.8 n-ds and fluctuates with time, an external flow-speed measurement should be provided to theLasentec FBRM electronics for a real-time correction to the shill in measured particle size.
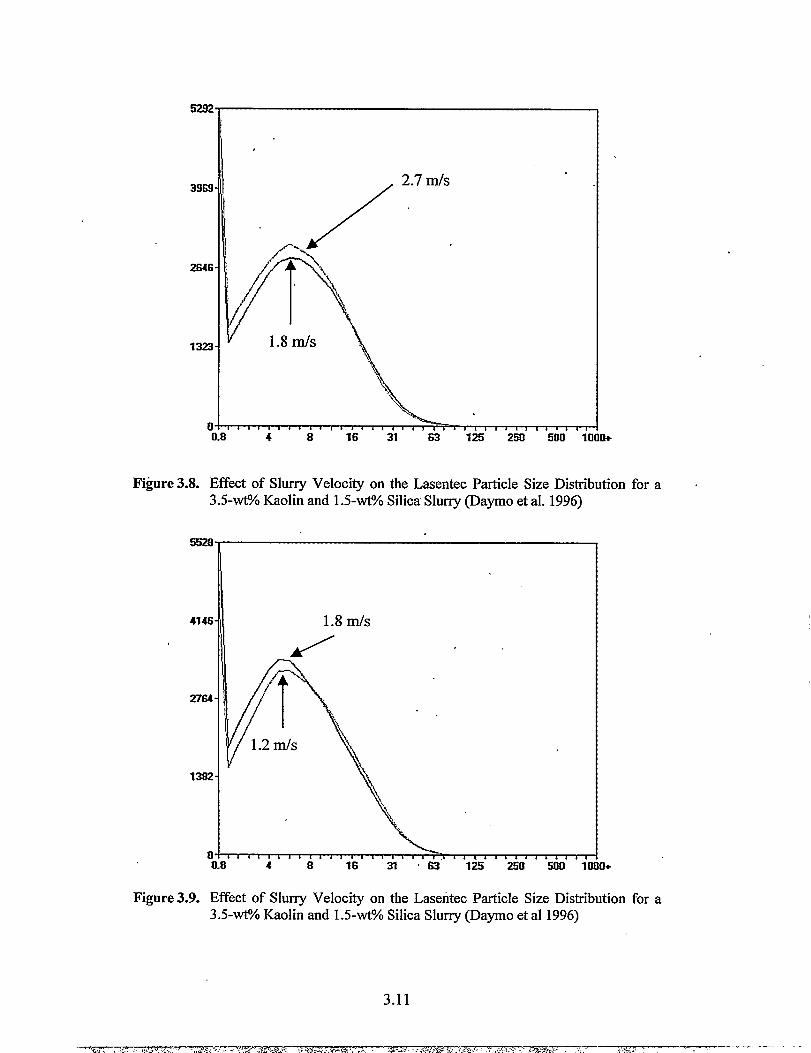
To investigate the effect of the flow rate on the measured particle size distribution in twotests, the flow rate was changed to 2.7 m/s (13 L/s) and 1.3 mls (6.3 L/s), respectively. Theseresults are compared to the nominal flow rate of 1.8 nds (9 L/s) and are shown in Figures 3.8 and
3.9
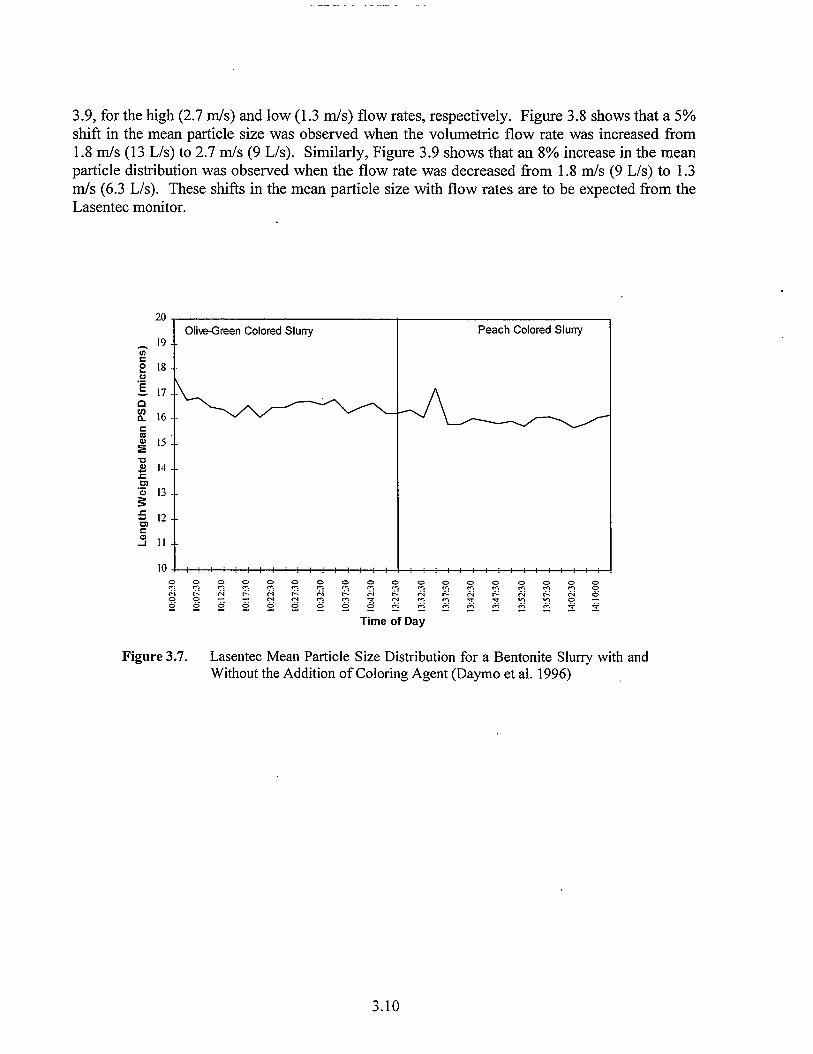
3.9, for the high (2.7 m/s) and low (1.3 m/s) flow rates, respectively. Figure 3.8 shows that a 5%shift in the mean particle size was observed when the volumetric flow rate was increased from1.8 m/s (13 L/s) to 2.7 n-ds (9 L/s). Similarly, Figure 3.9 shows that an 8% increase in the meanparticle distribution was observed when the flow rate was decreased from 1.8 mh (9 L/s) to 1.3m/s (6.3 L/s). These shifts in the mean particle size with flow rates are to be expected from theLasentec monitor.
. I
Oliw-Green Colored slurry Peach Colored Sluny
1-
10
Time of Day
Figure 3.7. Lasentec Mean Particle Size Distribution for a Bentonite Slurry with andwithout the Addition of Coloring Agent (Daymo et al. 1996)
3.10
5292
,
3wl-
t“
1323-
\,,,,,~,,,,c,,,,,,,+r\\O,)* ,,I 1 , ~0.8 4 8 16 31 S3 125 250 50D 11
Effect of Slurry Velocity on the Lasentec Particle Size Distribution for a3.5-wt% Kaolin and 1.5-W?4JSilica Slurry (Daymo et al. 1996)
--7-..,. .., ,,‘4,., .” ., .,.,? .> ----- . .. .<fl~m..q. :: .r.w:...n=~~~~ -.s(:-—--- ----- . .
+
414s
2764
1382
Figure 3.9.
1.8 111/S
-1 s , , , * , , t , ‘ , &I
1 , , , , t , * 1 s , , , I , b , , , ,4 8 163’ I .63125250 500 Ill 10+
Effect of Slurry Velociiy on the Lasentec Particle Size Distribution for a3.5-wt% Kaolin and 1.5-wt% Silica Slurry (Daymo et al 1996)
3.11
. .._
Light reflected for a shorter time causes the decrease in the mean particle size distributionwith an increase in the flow rate. According to Equation 1, the chord lengths would be smaller.Similarly, at lower flow rates, the mean particle size would be larger. Also, the observed 5 to 8’XOshift in mean particle size with flow rate is acceptable for slurry transport applications at bothHanford and ORNL.
3.2.5 Effect of Changes in Solids Concentration
During the May 1998 acceptance testing of the Lasentec M600P monitor, the solidsconcentration was varied in two ways. First, the ratio of silica (41 O pm mean size, as measuredby sieve analysis) to kaolin was increased from 0:1 to 1:5.6, 1:2.33, and 1:1.22. Second, the totalsolids concentration was increased from 5-wtO/0 solids to 10-WtO/Osolids.
A representative result of the effect of adding silica to 5-wt% kaolin is shown inFigure 3.10. Similarly, the effect of adding kaolin to silica slurry (2.5 -wt’%0)is shown inFigure 3.11. For all the silica/kaolin shirries studied, the average particle size was found toincrease as the silica/kaolin ratio was increased because more large particles are present in theslurry. Also, the effect of an increased proportion of silica on average particle size was found tobecome less significant with each incremental increase of silica as the average measured particlesize approached that of the silica. At both 5-wtO/0 and 10-WtO/Osolids concentrations, the totalnumber of counts per second decreased by around 13°/0when the silicrdkaolin ratio was changedfrom 0:1 to 1:1.22. This decrease in the total number of counts per second was expected, asthere were fewer particles in the system, and the larger particles had a smaller surface-to-volumeratio.
At 5-wt% solids, the length-cubed weighted mean particle size increased from around53 pm to 150 pm when the silicdkaolin ratio increased from 0:1 to 1:5.6. A similar increase inparticle size was observed at 10-wt% solids for the same change in silicdkaolin ratios (45 pm ata ratio of 0:1 to 156 pm at a ratio of 1:5.6). As expected, when the proportion of silica wasfurther increased, the length-cubed weighted mean particle size did not increase as significantlysince the length-cubed weighted mean of the kaolin/silica system was approaching the length-cubed weighted mean of the silica on its own (e.g., the measured length-cubed weighted meanparticle size values at 10-wt% solids were 204 pm at a silicalkaolin ratio of 1:2.33, and 214 pmat a silicakaolin ratio of 1: 1.22). Note that the length-cubed weighted mean (which has a similareffect of a volume weight) heavily weights the change to course particles at the expense ofresolution on the fine-particle side of the distribution.
For the cases where the solids concentration increased with the ratio of silica to kaolinbeing constant, the average length-cubed weighted mean particle sizes at 5-wt’% and 10-wt%solids were nearly the same at each case tested. The total number of particles counted increasedby around 20% when the solids’ concentration was increased fi-om 5-wt% to 10-wt% solids.
3.12

12%
9X
62
n
()%-l & , I t & , t ,IL8 4 8 16 31 63 125 250 500 1[ 1+
Figure 3.10. Effect of Change in Solids Concentration on the Lasentec (chord lengthcubed) Particle Size Distribution as Observed Before and After theAddition of Silica to a 5-wt?? Kaolin Slurry (Daymo et al. 1996)
15%
10%
5%
Be oreL
0%a ,0.8 4 .8 16 31 63 125 250 500 1[ 1+
Figure 3.11. Effect of Change in Solids Concentration on the Lasentec (chord lengthcubed) Particle Size Distribution as Observed Before and after theAddition of Kaolin to a 2.5-wWOSilica Slurry (Dymo et al. 1996)
3.13
--- --- -r7-c”.-T- . . ,— -- —. . . . ~+..-.a.. . . . . . .

3.2.6 Effect of Scan Time
High scan time increases the number of counts that contribute to the particle sizemeasurement data. Increasing the number of particles counted results in smoother and moreaccurate data. However, a large scan time also decreases the fi-equency at which new data setscan be collected. In a similar manner, low scan rates enable a larger collection of data samplesets at the sacrifice of the quality of the data. The effect of the sampling time on the meanparticle size is shown in Figure 3.12. The data in this figure were collected at three samplingintervals of 30 s, 60 s, and 300 s. The 30-s sample time produces the most fluctuation in the datawhile the 300 s sampling time provides a very uniform mean particle size measurement. Also, atthe 60-s scan rate, although some variation in the mean particle size exists, the data are closer tothose observed with the 300-s scan time. Therefore, for the Lasentec particle analyzer, the scantime should be 60s or greater and preferably (if possible) 300s.
30 Sec. Scan Time 5 min. scan time 30 sec.scan time30 sec.scan time
with values averaged over
4 scans
700s(l)- -~u)Cm528- -- ------------------ .----------------- .-------5(Q-p+0 ~355- -~ ----------------- .----------------- .-------cQ-0c%
v
tW-Q183- - ----- ----- ----- ---- --
5’s A 127-
10+003 Time of Day +1:06
1 min. scan time 1 min. scan time
Figure 3.12. Effect of the Scan Time on the Lasentec Mean Chord Length Cubed Particle Size
I
Distribution for a 7-w% Kaolin and 3-wI% Silica Slurry (Daymo et al. 1996)
3.14

3.2.7 Comparison of In Line Lasentec Data to Off Line Sieve Analysis
As described above, the Lasentec FBRM monitor yields particle size histograms bymeasuring the length of time that laser light backscatters off of particles that pass by the probewindow. One important aspect of the Lasentec “acceptance tests’? was to show that particle sizedata from the Lasentec monitor could be compared to another (independent) particle sizemeasurement of the same material.
Figure 3.13 is a comparison between a. sieve analysis pedormed on dry samples of silicaand a particle size histogram for the silica slurry measured with the in-line Lasentec monitor(length-cubed weighted particle size data). When the Lasentec collected these da~ the flow ratewas 9 L/s (an average velocity of 6 ft/s in a 3 in. pipe). The Lasentec measured histogram andthe sieve analysis match well, suggesting that the length-cubed weighted particle size data maybe roughly correlated with a sieve analysis on materials of this type. Depending on the shape ofthe particles, though, a sieve analysis may not always compare with the particle size distributionmeasured by a Lasentec FBRM monitor.
If a certain volume of spherical particles is held constant but the aspect ratio increased(i.e., the particles become cigar-like), a sieve analysis would indicate mat the cigar-like particlesare generally smaller than the spheres. If the same system were measured with an FBRMmonitor, the unweighed mean particle size would decrease as the spheres become cigar-likebecause the unweighed mean is strongly dependent on the number of short chords across thewidth of these cigar-like particles. At the same time, the length-cubed weighted mean particlesize would increase because of the large chords measured across the longest dimension of thecigar-like particle. Although such tests were not performed for this repo~ the Lasentec FBRMsensor can be used to monitor relative changes in the shapes of particles.
Sieve50- LasentecAnalysis
40.a
3
~ 30.
‘5~
20-
10-
0.44 W-125 125.2s0 250.500 W3.1000 >1003
Particle Size (microns)
Figure 3.13. Comparison of the Sieve Analysis and the Lasentec (length cubed) MeanParticle Size Distribution Obtained Using a 10-wt?? Silica Slurry (Daymoet al. 1996 and 1998)

3.2.8 Comparison of In Line Lasentec Data to Bench-top (off-line) LasentecAnalyzer
The Lasentec monitor may reduce operational costs if in-line particle size measurementscould reduce (or eliminate) the number of laboratory particle size analyses that need to beperformed on radioactive grab samples taken before and/or afler slurry-transfer operations.Ideally, particle size distributions measured by the in-line Lasentec monitor should correlate wellwith particle size distributions of grab samples measured off-line by laboratory (i.e., bench-top)monitors.
Samples of kaolin and silica/kaolin slurries collected during “acceptance testing” of theLasentec M600P monitor were sent to the vendor for analysis with a Lasentec M500LF(a laboratory version of the M600P monitor). To make accurate comparisons between in-lineand bench-top FBRM monitors, it is crucial that both probes are exposed to identicaldistributions of particles.
One-liter samples of each slurry type were sent to Lasentec, and aliquots from each 1-Lslurry sample container were taken and analyzed with the bench top monitor. Obtainingrepresentative aliquots was difficult for silica/kaolin slurries because the large silica particlessettle quickly. In general, the narrower the particle size distribution, the higher the solidsconcentration, and the smaller the particles, the easier it is to correctly collect slurry samples.
While the presence of fast-settling silica made it impossible to compare results betweenthe bench-top Lasentec M500LF monitor and the in-line M600P instrument for slurriescontaining silic~ the vendor measured the particle size distribution of the silicdkaolin slurryaliquots using several different (independent) M500LF monitors. The company reported that theindependent M500LF monitors measured essentially the same particle size histogram when thesame silicdkaolin slurry aliquots were presented to each of the monitors. This result suggeststhat the FBRM method is highly repeatable.
The in-line Lasentec. M600P and the laboratory Lasentec M500LF monitors reportedsimilar length-cubed (weighted) mean particle size for the kaolin slurries. A representativecomparison result for a 5-wtO/0kaolin slurry is shown in Figure 3.14. For the 5-wtO/0kaolinslurry, the in-line length-cubed weighted mean particle size is 53 pm, whereas the laboratorymonitor measured 57 pm. Similarly, at 10-wt’XOkaolin slurry, the in-line monitor measured thelength-cubed weighted mean particle size to be 45 ~m, while the laboratory monitor measured56 pm. This difference between the in-line and laboratory monitors is considered to beacceptable for tank waste retrieval applications.
3.3 Acceptance Testing at ORNL
After the initial non-radioactive simulant testing at PNNL, the instrument was shipped forradioactive validation in the SMTS connected to the Tank W-9 of the GAATs at ORNL. Thediscussion and results presented in this section are taken from the report prepared by Hylton andBayne (1999) on the testing of in-line slurry monitoring devices at ORNL. A schematic of the
3.16
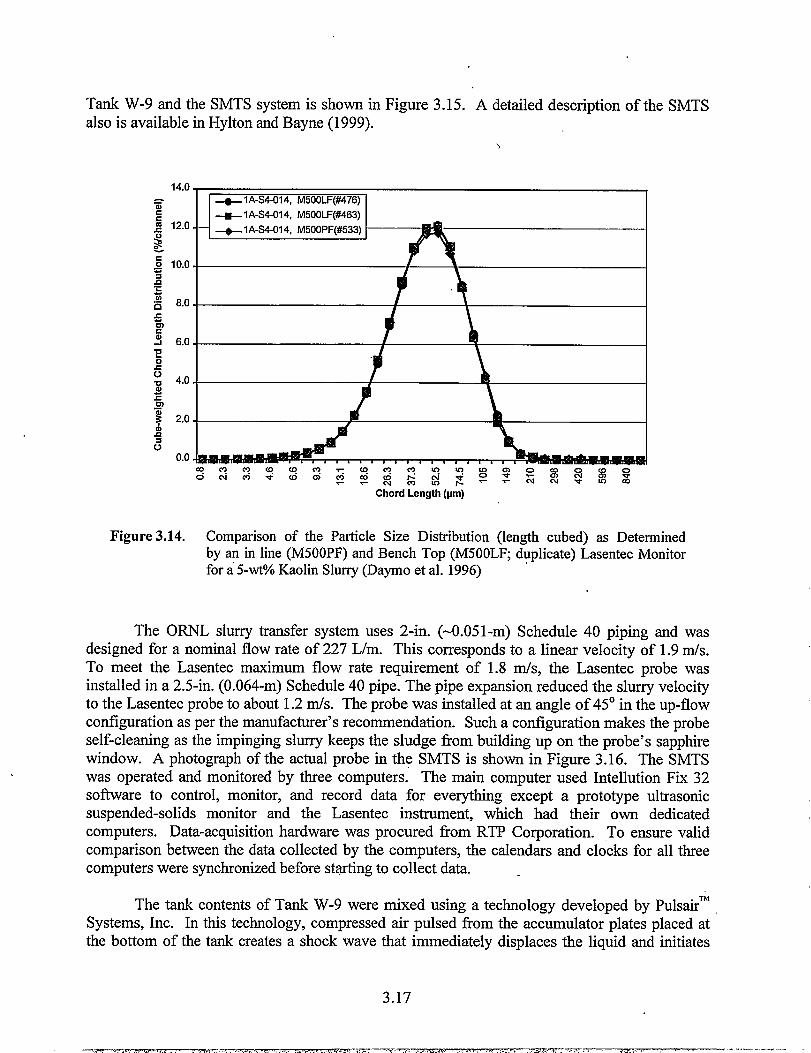
Tank W-9 and the SMTS system is shown inalso is available in Hylton and Bayne (1999).
14.0
Figure 3.15. A detailed description of the SMTS
\
~ + IA-S4-014, M500LF(#476)c + IA-S4-014, M500LF(W63)g 12.0.0 – ~lA-S4-014, M500PF(#533)3
g 1o.o- -
zz
~ 8,0. D \
Figure 3.14. Comparison of the Particle Size Distribution (length cubed) as Determinedby an in line (M500PF) and Bench Top (M500LF; duplicate) Lasentec Monitorfor a 5-wt% Kaolin Slurry (Daymo et al. 1996) “
The ORNL slurry transfer system uses 2-in. (-O.051-m) Schedule 40 piping and wasdesigned for a nominal flow rate of 227 L/m. This corresponds to a linear velocity of 1.9 mk.To meet the Lasentec maximum flow rate requirement of 1.8 m/s, the Lasentec probe wasinstalled in a 2.5-in. (0.064-m) Schedule 40 pipe. The pipe expansion reduced the slurry velocityto the Lasentec probe to about 1.2 m/s. The probe was installed at an angle of 45° in the up-flowconfiguration as per the manufacturer’s recommendation. Such a configuration makes the probeself-cleaning as the impinging slurry keeps the sludge from building up on the probe’s sapphirewindow. A photograph of the actual probe in the SMTS is shown in Figure 3.16. The SMTSwas operated and monitored by three computers. The main computer used Intellution Fix 32software to control, monitor, and record data for everything except a prototype ultrasonicsuspended-solids monitor and the Lasentec instrument, which had their own dedicatedcomputers. Data-acquisition hardware was procured from RTP Corporation. To ensure validcomparison between the data collected by the computers, the calendars and clocks for all threecomputers were synchronized before stqrting to collect data. -
The tank contents of Tank W-9 were mixed using a technology developed by PulsairTh’Systems, Inc. In this technology, compressed air pulsed from the accumulator plates placed atthe bottom of the tank creates a shock wave that immediately displaces the liquid and initiates
3.17
-—>-. —.. -7, ,, . . . . . . ., . . . . . . . . . . . . . . . . . . . . . . ,. . . . ,. . . . . . . .. fi- ---- . , ,. ,, . .- .--—. . . . . . .
.... ——
the mixing process. As the air begins to form a bubble above the accumulator plate, the liquid-.and sludge particles are swept away from the plate. The bubble begins its rise, and low pressureunder the bubble draws liquid and sludge particles back to the accumulator plate. As the bubble
SlunyffomOtherTanks
I
—SubnwsMe Fump
A LasenteclvHIOPB UltrasonicSwpendd Solids fvbnitorc lsoLCKsarn@er
D MI=S+*W~~~M To theCross-Siie
SlurryTransferF@eline
I?igure 3.15. Schematic of the Flow Path fi-om Tank W-9 to the Slurry Monitoring Test System
(SMTS, Hylton and Bayne 1999)
3.18

, Lasentec FBRM
Figure 3.16. The Lasentec M600P Monitor (indicated by the arrow)Installed in the Slurry Monitoring Test System (SMTS) at 0~(Hylton and Bayne 1999)
rises, the liquid above the bubble is forced up and away and liquid and sludge particles are pulledfrom the bottom and mixed with the lighter liquid. The bubble breaks on the liquid surface, andthe mixing changes flom vertical to horizontal. A stiace mixing force moves the liquid to thetank wall, where it travels down the wall to the tank bottom to complete the mixing cycle. The ‘operating parameters that were variable for the Pulsair mixing system were (1) dwell time, i.e.,time between air injections, (2) injection time, i.e., the amount of time that air was injected, and(3) the air supply pressure. Of these parameters, the dwell time was considered to have the mostinfluence on the mixing performance. Also, since a concentration gradient. would exist in thetank, the position of the recirculation pump could also influence “tie mixing of the tank contents.Therefore, the instrument validation runs were conducted at three different dwell times and tworecirculation pump positions as shown in Table 3.2.
The results of the six acceptance tests at ORNL are shown in Figy.ues 3.17 to 3.18. Theresults in Figure 3.17 (a-e) represent the complete chord-length distributions from the start to thetermination of the Pulsair system. The results in Figure 3.18 (a-e) represent the total particlecount as a fi.mction of time from the start to the terrniqation of the recirculation. The results inFigures 3.19 (a-e) represent the time dependent variation (fi-om the start to the termination of the
3.19
-—~,r .,. ,.,.q.-r~m , ,,< ,<.;.%.f ; . ~ ,.~. - -.~,~ -. -- .---, -.> .<., ,.. ,,, ., .,-, ., <. .,, ...-,,.-. . .?Z3V... .,w - ,7. --— —.—— . ..—
recirculation pump) in number of particles greater than 105 ~m. Also shown in Figures 3.18 and3.19 for comparison purposes are the time-dependent variations in the density of the slurry forthe six runs from the start to the termination of recirculation pump. The following sectionspresent a detailed description of the results included in Figures 3.17 to 3.19.
Table 3.2. Conditions for Testing the Slurry Monitors at ORNL
Tank W-9 Recirculation Pulsair Mixing ParametersTest
Date Volume Pump Dwell Injection Air SupplyNumber
(Gal) Position Time Time Pressure(ft) (s) (s) (psi)
1 02/17/1999 104,000 4 10 1 35~ 02/22/1999 104,000 4 18 1 353 02/25/1999 103,000 4 14 1 354 03/02/1999 105,000 6 10 1 355 03t0511999 105,000 6 14 1 356 03/1 1/1999 113,000 6 18 1 35
3.3.1 Slurry Test 1
During the Slurry Test 1, the recirculation pump was operated for 1 hr before the Pulsairsystem was turned on. The tank contents were mixed for approximately 2.5 hrs before the slurrywas pumped through the SMTS and data collection was initiated. The Pulsair system was thenstopped after 12 minutes of initiating the data collection while the recirculation through theSMTS was continued for another 1.5 hrs.
The total number of particles measured by the Lasentec instrument includes only thoseparticles that come close to the window to be counted. A graph of the time-dependent variationof the chord length distribution and the total number of particles measured by the Lasentec probeis shown in Figure 3.17a and 3.18a, respectively, for the Slurry Test 1. Also shown inFigure 3.18a for comparison purposes are the density results for the same test as measured by thePromass 63M Coriolis meter. As might be expected, the results show that the particle countresponds in a similar fashion to the density; when the density decreases, the particle countdecreases and vice versa.
The current acceptance criteria for transferring the slurries through the ORNL cross-sitepipeline are that the particles be less than 100 pm. The Lasentec software divides the count databy chord lengths into 38 bins as discussed in Chapter 2. The channel closest to the 100 pm bin is105 pm. Figure 3.19a is a plot of the time variation in total number of particles and the particleswith chord length > 105pm. Although the number of particles that were E105 pm was small,Figure 3.19a shows that this number increased slightly after the Pulsair mixing system wasstarted, indicating that the instrument responds very well to small changes in the particle count.
3.20
100001 1
(a)
Clock Time
I
\ n— 939
— 941
40W -— 9:50
— 1000
— 1039
— 1423
2000-
o.~.,,,,,~ ,,$,,,,,,,,,~,,,,’m: ~QJ :.
5522g~;gg
Chord Ienglh (pm)
(c)
I ClockTime
4000.
II— 850
— 3s3
—9:01
woo - — 9:20
— 940
2000-— 1207
1000 -
,,,,,,,,~,.,,,,,,’~
32~
zii~zg~%jg:
Chordlength(pm)
(e)
6000
o
Clock Ilme
m
Chomllenglh(pm)
Chordlenglh(pm)
(d)
Chord length (pm)
(0
Figure3.17. Particle Chord Length Distribution as aFunctionofTimefortheRadioactive AcceptanceTesting of the Lasentec Monitor at ORNL. (a) Test 1, (b) Test 2, (c) Test 3, (d) Test 4, (e)Test 51and (f) Test 6 (Hylton and Bayne 1999).
3.21 .

—-.——. .. .. . .---
i% . . .. ..%*-.+ ,“.”. . .. ..
. .-”%..%+ - ..
● Densiiv Io800 900 10:00 11:00 1200 1300 1400 1500
Clock time
(a)
i. . 1Gi .
~.
~-”iF ::1‘ +’J IziEl
0. T 1.01
000 900 1000 11:00 12:00 1300 1400 1500
Clock time
(c)
6!30 900 1000 11:00 1200 1300
Clock time
(e)
50000
=’”07-.+’.. .....
r 1.01
1000 11:00 1200 1300 1400 1500
C1.xk time
(b)
11:00 1200 1300 1400 t500
Clock time
(d)
J
2oor31)- m4s.
.%
012-_Jz=1000 11:00 1200 1300 1400 1500
Clock time
m
Figure 3.18. Total Particle Count as a Function of Time for the Radioactive Acceptance Testing of theLasentec Monitor at ORNL. (a) Test 1, (b) Test 2, (c) Test 3, (d) Test 4, (e) Test 5, and (0Test 6 (Hylton and Bayne 1999)
3.22
60000$ mlPulsak
“.. . . .8
S!O ed. . .
% . ..%~-w .“.”. #.%..*.
. .-”%.++& * ●
m’ l-mmy-Jo Chordlen ths> 105 m
0lkoo 900 1000 11:00 1200 1300 1400 1500
Clock time
8:00 900 1000 11:00 1200 1300 1400 1500
Clock time
(c)
400001 f 20
(e)
..-
50000-
,+ o“.” ““”.”... %O.OOOOOO..~Qoooo
“.OOO.O”O e
Gg
. . . . . . . . . . . . . . . . . .. . . “ ““. ●O. . . ..“
2..*
n
1~ . .
. Pulsalr
g 25000-S!O ed
.“.
T
;.[,.,.,,
n
Pul$eir .
z stsrted● 0
gg .
.*.-~%,$ w
o
1000 11:00 1200 13:00 1400 1504
Clock Ume
(b)
I
--- .-?71-.7S?5.5S ,. .,<, -,, ,, <’c..%.-, .. - .!xc?———— ——------ ., ---
o~o
11:00 1200 13:00 1400 1500
Clock IIme
(d)
(f)
Figure 3.19. Particle Count >105 pm as a Function of Time for the Radioactive Acceptance Testing ofthe Lasentec Monitor at ORNL: (a) Test 1, (b) Test 2, (c) Test 3, (d) Test 4, (e) Test 5, and(f) Test 6 (Hylton and Bayne 1999)
3.23

3.3.2 Slurry Test 2
During Slurry Test 2, to start the run with the recirculation pump immersed in thesupernatan~, the contents of the slurry were allowed to settle for approximately 118 hrs after thetermination of Slurry Test 1. The fluid was mixed for about 40 minutes after the fluidrecirculation was initiated through the SMTS and the Pulsair system was started. Also, in thiscase, the Pulsair system was stopped after approximately 3 hrs while recirculation continued, anddata were collected for another 45 minutes.
A graph of the time-dependent variation of the chord-length distribution and the totalnumber of particles measured by the Lasentec probe is shown in Figures 3. 17b and 3. 18b,respectively, for the Slurry Test 2. Also shown in Figure 3. 18b for comparison purposes are thedensity results for the same test as measured by the Promass 63M Coriolis meter. As observedwith the Slurry Test 1, the chord-length distribution and the total particle count respond similarlyto the density results. Since the Coriolis meter indicated that the density was low at thebeginning of the test as the pump was only circulating the supematant, one would expect that theLasentec instrument would show a low particle count at the beginning of the test. Figure 3. 18bshows that the particle count started out at the mid-range, but declined quickly. The mid-rangecount immediately at the start of the experiment was probably due to a dried film or particles thatsettled on the probe window from the previous testing. The particle count for the supematebefore the start of the Pulsair system was< 1000 counts/s.
Figure 3. 19b shows the total number of particles and the number of particles with chordlength s 105 pm. The Lasentec results show that >99.8’Yo of the particles have chord lengths<105 pm. The graph alSO shows that the number of particles with chord lengths E 105 pm
increased when the Pulsair system was started. This is another indication that the instrument isvery sensitive to small changes in the system.
3.3.3 Slurry Test 3
Before starting Slurry Test 3, the contents of Tank W-9 were allowed to settle forapproximately 67 hrs after the termination of the Slurry Test 2. The fluid was recirculatedthrough the SMTS for about 45 minutes before starting the Pulsair system, and mixing wascontinued until the recirculation pump was stopped (approximately 5.5 hrs after the start of thePulsair system).
.A graph of the time-dependent variation of the chord-length distribution and the total
number of particles measured by the Lasentec probe is shown in Figure 3. 17c and 3. 18c,respectively, for the Slurry Test 3. Also shown in Figure 3. 18b for comparison purposes are thedensity results for the same test as measured by the Promass 63M Coriolis meter. The data inthese graphs show that the change in the particle size distribution corresponds very well with thedensity data. Figure 3. 19C compares the total number of particles and the number of particles
with chord lengths E 105 pm. Similar to the findings of the previous tests, the results show that>99.9’% of the particles have chord lengths < 105pm.
3.24

3.3.4 Slurry Test 4
Before starting Slurry Test 4, the contents of Tank W-9 were allowed to settle forapproximately 117 hrs from the termination of Slurry Test 3. Afler approximately 30 minutesafter the recirculation pump was turned on, the Pulsair system was started, and the mixing wascontinued until the recirculation pump was stopped (approximately 2.5 hrs after the start of thePulsair system).
A graph of the time-dependent variation of the chord-length distribution and the totalnumber of particles measured by the Lasentec probe. is shown in Figure 3.11’d and 3.18d,respectively, for Slurry Test 4. Figure 3. 19d compares the total number of particles and the
number of particles with chord lengths E 105 pm. As with previous tests, the variation in thechord-length distribution and the total particle count correspond very well with the density data.
Similarly, the results also show that >99.9% of the particles have chord lengths< 105 pm.
3.3.5 Slurry Test 5
Before starting Slurry Test 5, the contents of Ta& W-9 were allowed to settle forapproximately 66 hrs from the termination of Slurry Test 4. After approximately 30 minutesafter the recirculation pump was turned on, the Pulsair system was started. Both the recirculationpump and the Pulsair system were temporarily stopped for approximately 50 min after about 1 hrof initiating the mixing process to facilitate other site operations of the GAAT project. Bothunits were then restarted, and the mixing continued for approximately another 1.5 hrs.
A graph of the time-dependent variation of the chord-length distribution and the totalnumber of particles measured by the Lasentec probe is shown in Figures 3. 17e and 3. 18e,respectively, for the Slurry Test 5. Figure 3. 19e compares the total number of particles and thenumber of particles with chord lengths E 105 pm. As with previous tests, the variation in thechord-length distribution and the total particle count correspond very well with the density data.Similarly, the results also show that >99.9Y0 of the particles have chord lengths< 105pm.
3.3.6 Slurry Test 6
Before starting Slurry Test 6, the contents of Tank W-9 .were allowed to settle forapproximately 6 days from the termination of Slurry Test 5. After approximately 30 minutesafter the recirculation pump was turned on, the Pulsair system was started, and the mixing wascontinued until the recirculation pump was stopped (approximately 3.5 hrs after the start of thePulsair system).
A graph of the time-dependent variation of the chord-length distribution and the totalnumber of particles measured by the Lasentec probe is shown in. Fig&es 3. 17f and 3. 18f,respectively, for Slurry Test 6. Figure 3. 19f compares the total number of particles and thenumber of particles with chord lengths > 105 pm. As with previous tests, the variation in the

——— -——... .—..—.. .—— ——.——
chord-length distribution and the total particle count correspond very well with the density data.
Similarly, the results also show that >99.9% of the particles have chord lengths< 105~.
3.3.7 Statistical Analysis of the Lasentec Performance
The software for the Lasentec M600P counts the number of particles that have chordlengths (measured in micrometers) in 38 intervals that range from (0.8, 1.9) to (1000, 4). Theprobability distribution of the chord lengths can be estimated by dividing the number of particlesin each interval by the total number of counts for all intervals. The average and variance of thechord lengths for each of the six tests can be estimated from these probability distributions by
and
Average = 2X -fjX J (3.4)j=l
Variance = ~ (% - Average>’ x $ (3.5)]=1
midpoint chord length of an intervalfrequency of the jti interval; j = 1,2,...,38.
The standard deviation is calculated as the square root of the variance. Table 3.3summarizes the estimated averages and standard deviations for the six tests. Averages andstandard deviations in Table 3.3 indicate no effects that are due to either the pump position or thedwell time. An overall average for all six tests is 6.41, with a standard deviation of 7.45.
Table 3.3. Lasentec M600P Particle Distribution Averages and Standard Deviations (inparentheses) of Cord Lengths
Recirculation(,) Particle Chord Length (mm) for Different Pulsair Dwell TimesPumn Position
4fl6.30 6.42 6.43
(7.49) (7.28) (7.48)
6ft6.39 6.56 6.42
(7.24) (7.13) (8.04)
(a)Pump position is the distance from the,bottom of the tank to the pump.
Figure 3.20 shows the frequency of the midpoint chord length for particles with chordlengths of 50 pm. The unusually large fi-equency at the beginning is due to the first interval (0.8,1.9) that contains a large number of counts. A possible improvement in the distribution may be
3.26

achieved if the first interval is partitioned into smaller intervals. The first interval contains fivechannels worth of data on a log scale; therefore, a spike occurs. Earlier versions of the FBRMwere not able to discriminate between a O.S-pm count and a 1.9-pm count. The manufacturernow reports that the latest version of the FBRM can discriminate between 0.5 and 1000 pm in0.25-pm increments. A theoretical statistical evaluation indicates the classical Fisher’sF-distribution can model the Lasentec M600P frequency distribution. ~
0.14
‘5
0.02
0.00 1 1 1 1 1 I t I I I ,-
0 5 10 15 20 25 30 35 40 45 50
Particle size chord length (pm)
Figure 3.20. Overall Frequency Distribution of Particle Size Chord Lengths forthe Six Tests at ORNL (Hylton and Bayne 1999)
3.27
. . ..__
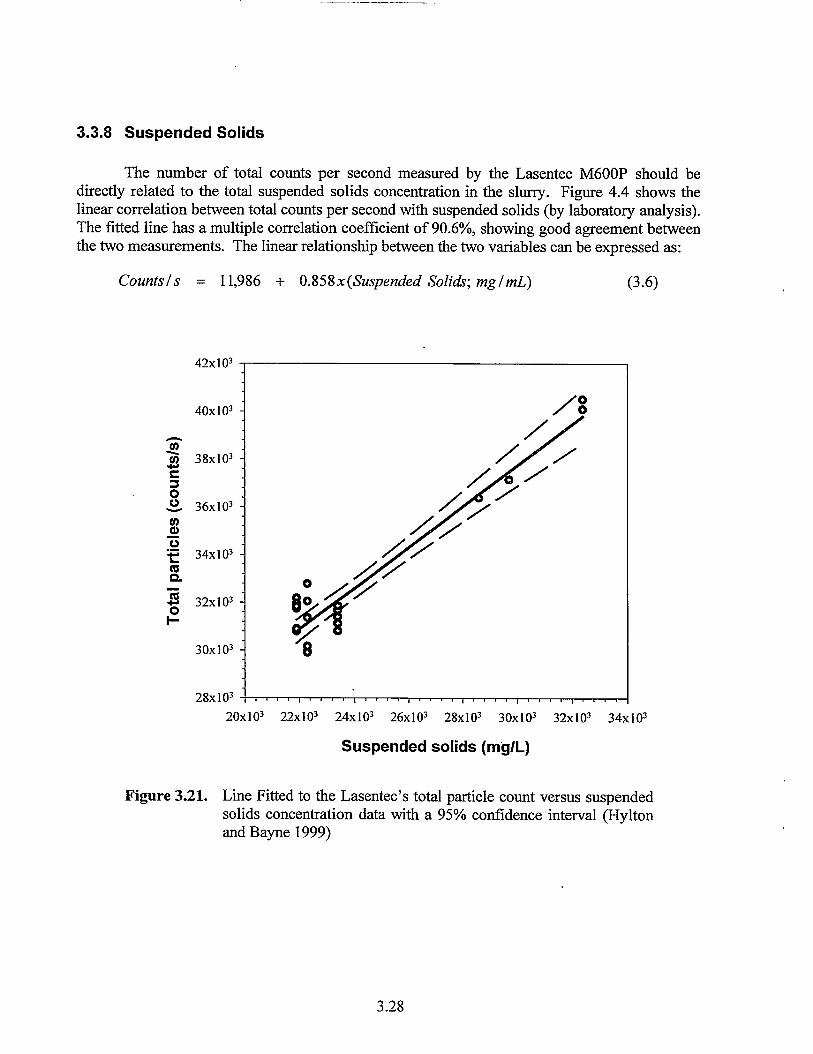
3.3.8 Suspended Solids
The number of total counts per second measured by the Lasentec M600P should bedkectly related totietoti smpended solids concentration intiesl~. Figure 4.4 shows thelinear correlation between total counts per second with suspended solids (by laboratory analysis).The fitted line has a multiple correlation coefficient of 90.6’Yo,showing good agreement betweenthe two measurements. The linear relationship between the two variables can be expressed as:
Counts/s = 11,986 + 0.858 x(Suspended Solids; mg/mL) (3.6)
42x103
40X 103
,103
,103
3OX1O3
28x103
/00
/
i 1 1 1 1 I
20x103 22x103 24x103 26x103 28x103 30x103 32x1OS 34x103
Suspended solids (mg/L)
Figure 3.21. Line Fitted to the Lasentec’s total particle count versus suspendedsolids concentration data with a 95°/0 confidence interval (Hyltonand Bayne 1999)
I
I
3.28

4.0 Red Valve Pressure Sensor
The Red Valve pressure transducer is widely used in the nuclear field. Unlikeconventional pressure sensors where the slurry travels through a l/4-inch Bourdon tube to actagainst the sensor’s diaphragm, in the Red Valve pressure sensor a silicone fluid acts as anintermediate transmitting fluid so that the slurry never contacts the sensor’s diaphragm. It shouldbe noted that the Red Valve sensor unit is a sealed system. These sensors must be properly filledwith the sensing fluid and sealed before any pressure is applied. If the sensor is dismantled orremoved afier installation, air could be introduced into the sensing fluid, which can causeinaccurate readings. Therefore great care must be taken to elirn~nate air in the system duringinstallation. Also, users should be aware that the sensing fluid could enter the process stream ifthe elastomer supporting the sensing fluid should happen to breach.
The principle behind the Red Valve pressure sensor operation suggests that the transducer “plugging and fouling issues can be eliminated. The instrument was endorsed at the Hanford Sitefollowing instrument validation tests at PNNL and is currently in operation in the Tank 241-C-106 pump pit. This type of pressure sensor could be configured to measure pressure drop overtime. Information about the status of a slurry transfer could be inferred from a measuredpressure drop. For example, as long as solids form a moving bed at the bottom of a pipe, it isunlikely that the onset of settling will be signaled by a pressure difference. However, if astationary bed starts to build in a pipe due to gel formation or to some other increase in slurryviscosity, a gradual increase in the pressure difference (at a constant flow rate) would beobserved.
The Red Valve Pressure Sensor, Model 1151, Smart Series 48, with Hypalon sleeve andsilicon oil sensor fluid (Red Valve Company, Inc., Pittsburgh, PA) was validated during FY 1996in the W-211 loop at the IVF (Reynolds et al. 1996). This instrument is certified to + 1’XOof fillscale or 1.0 psig on a 1-to-100 psig scale. Pressure-measurement data obtained during validationtesting are compared with the Rosemount Model 3051 CG (Rosemount Measurements, EdenPrairie, Minnesota) direct tap sensor in Figure 4.1. This figure shows that within the test rangeof 40 psi to 100 psi, the pressure measured by the Red Valve pressure sensor is within 10/0of theactual direct pressure-tap readings obtained by the Rosemount sensor.
In 1998, four Red Valve pressure sensors (with Sensotech Model AE-213 pressuretransducers) were installed before and after the booster pumps of the 4-in. slurry (SL-200) andsupernatant (SN-200) transfer lines between Tank 241-C-106 and Tank 241-AY-1 02.Figures 4.2 and 4.3 illustrate the pressure sensor readings from one of the sensors installed in thedischarge line of the booster pump in the SL-200 slurry transfer line. The data in these figureswere obtained during two recent 12-hr operations of the slurry transfer line. These figures showthat the sensor responds rapidly to changes in the booster pump discharge pressure. Thesefigures also show that the Red Valve pressure sensor is extremely sensitive to variations in thedischarge pressure. Note that the pressure fluctuations in these figures are most probably due tochanges in the slurry flow to the booster pump and fi-om nitrogen entering the line from thepump pit.
4.1
-------m----- . ,. /. ..,. . . -. *,. -L?rF-w7rr7-T,i=.-T. , .. r. > .,,-. *>,, ---J-=--TV. ....> . .,& A.... . . 7,1 ,,,-------- ___ I

.———- .-— .—— —.—.—_ —. —— .. .
The pressure sensor components in the SL-200 ad SN-200 transfer lines are exposed to atotal radiation dosage on the order of 300 R/yr. These pressure sensors have been in operationfor over 1 year, and to date, the sensors have been trouble-free according to the operatorsinvolved with slurry and supernatant transfer operations. Based on these observations, it isapparent that the Red Valve pressure sensors could be installed at the end of the slurry transferlines and used to measure the pressure drop in the system.
y = 1.0076x-1.1083R2= 0.9991
90-
.=
& 80-
2s
g 70 -
z=~ 60 -0s
s50
407
40
Figure 4.1.
50 60 70 80 90 100
Red Valve Pressure (psi)
Comparison of the Pressure Measured by the Red Valve Pressure Sensor tothat Measured by the Direct Tap Rosemount Pressure Sensor (Reynolds etal. 1996).
4.2

90
80-
.70- - Ii
●. . J :
60- “. .
g.. ;
a) 50-.
L ..
s .
: 40~ .
n 30- -~
. .. .*.
20- !* . &;
10 :.
i:
0- ),
0 2 4 6 8 10 12
Time (Hrs)
Figure 4.2. Pressure Measurement Data Obtained on September 24, 1999 from theRed Valve Pressure Sensor Installed in the 4-in. Discharge Line of theBooster Pump in SL-200 Slurry Transfer Line
90
80
70
20
10
0
.—- .—-. .
.. .. ..
. :
. . . .
1...-.
1
o 2 4 6 8 10 12 14 16
Time (Hrs)
Figure 4.3. Pressure Measurement Data Obtained on September 26, 1999 fi-om theRed Valve Pressure Sensor Installed in the 4-in. Discharge Line of theBooster Pump in SL-200 Slurry Transfer Line
4.3

5.0 References
Daymo, E. A., T. D. Hylton, and T. H. May. 1998. “Acceptance testing of the Lasentec FocusedBeam Reflectance Measurement (FBRM) monitor for slurry transfer applications at Hanford andOak Ridge.” In: SPIE Conference on Nuclear Waste Instrumentation Engineering, Vol. 3536,pp. 82-92.
Hylton, T. D., and C. K. Bayne. 1999. Testing of In-Line Slurry Monitors and Pulsair Mixerswith Radioactive Slurries, ORNL/TM-l 999/1 11, Oak Ridge National Laboratory, Oak Ridge,Tennessee.
Reynolds, B. A., E. A. Daymo, J. G. H. Geeting, and J. Zhang. 1996. Instrument ValidationFacility, PNNL-1 1221, Pacific Northwest National Laboratory, Richland, Washington.
5.1
.--, .,,7 .,, ., . ,.>,T--4*- -rm.- ,------ .. ... .... ...

Appendix ABackground Information
Appendix ABackground Information
Under the current multi-year plan, the waste vitrification process will take place at aprivately owned facility. The U.S. Department of Energy (DOE) will be responsible for the safetransfer of the waste from underground waste tanks to feed tanks for the private vitrificationplant. To reduce costs and worker exposure to radiation, the sludge, salt calm, and liquid will beslurried and transferred via buried pipeline to the processing and vitrification facilities. Theextreme complexity of the wastes stored in the underground storage tanks presents significantconcern to the transfer operations. The following sections present a brief description of theissues associated with the slurry transfer operations at Hanllord and Oak Ridge NationalLaboratory (ORNL).
Hanford’s Cross-Site Slurry Transfer History
Cross-site transfer lines between the 200 East and 200 West Areas of the Hanford Sitehave existed for about 40 years.l A total of six lines have been built, and today four of the linesare permanently plugged. Because past plugging events were generally not thoroughlyinvestigated, very little quantitative information is available to explain why the plugging eventsoccurred. Portions of two remaining unplugged lines are to be restored, upgraded, and used totransfer waste only within the 200 East Area. A new cross-site transfer line is being designedunder the Hanford Site Project W-058, Replacement of the Cross-Site Transfer System (RCTS).
During the first cross-site transfer operations conducted in the late 1950s and early 1960s,plugging was thought to occur because of insufficient heating of the waste during transfer(McKay et al. 1994). As the slurry cooled, it was believed that solids precipitated out of solutionand began to accumulate on the pipe walls. Eventually, the solids would block the pipe. In somecases, lines were unplugged by back flushing with high-pressure warm water. .
Adequate dilution of the waste was thought to be nearly as important as maintaining ahigh temperature during cross-site transfer? It was found that the most convenient location toadd dilution water was at the pump suction. At that time, the standard operating procedurerequired that all material be diluted 25°/0 before cross-site transfer (e.g., 75 gallons of retrievedslurry diluted with 25 gallons of water; see Rockwell Hadord Operations 1978).
The most complete investigation of a line-plugging event occurred in 1978(Washenfelder 1978). After 12 hours of normal waste transfer, a decrease in flow and acorresponding increase in pump discharge pressure was observed.. The flow stabilized for6 hours, then continued to decrease, indicating that the transfer line was plugging. Hot waterdilution was started, and the flow rate stabilized mid later increased. Later, on the same day,
1Internal Letter Report by R. L. McKay, “TWRS Retrieval Technology Project, Slurry Transpo@Plugging Investigation,” Pacific Northwest National Laboratory, Richland, Washington (1993).2 Internal Letter No. 60120-78 -045-J by T. A. Lane, “Cross-country Transfer of 103/107-SMaterial;’ Rockwell Hanford Operations, Richland, Washington (1978).
—.... . .—. —-.----=.= ..,.-. ..Tr-a J.., .. . -- .:,,.. .,, , ,,! . . m. ,ZnT-Fr- . . . ,,,?!, ..- ! , ..hxm:.-—--- = 7.— :.,-~, . - --—- ——. -. ._ .,$
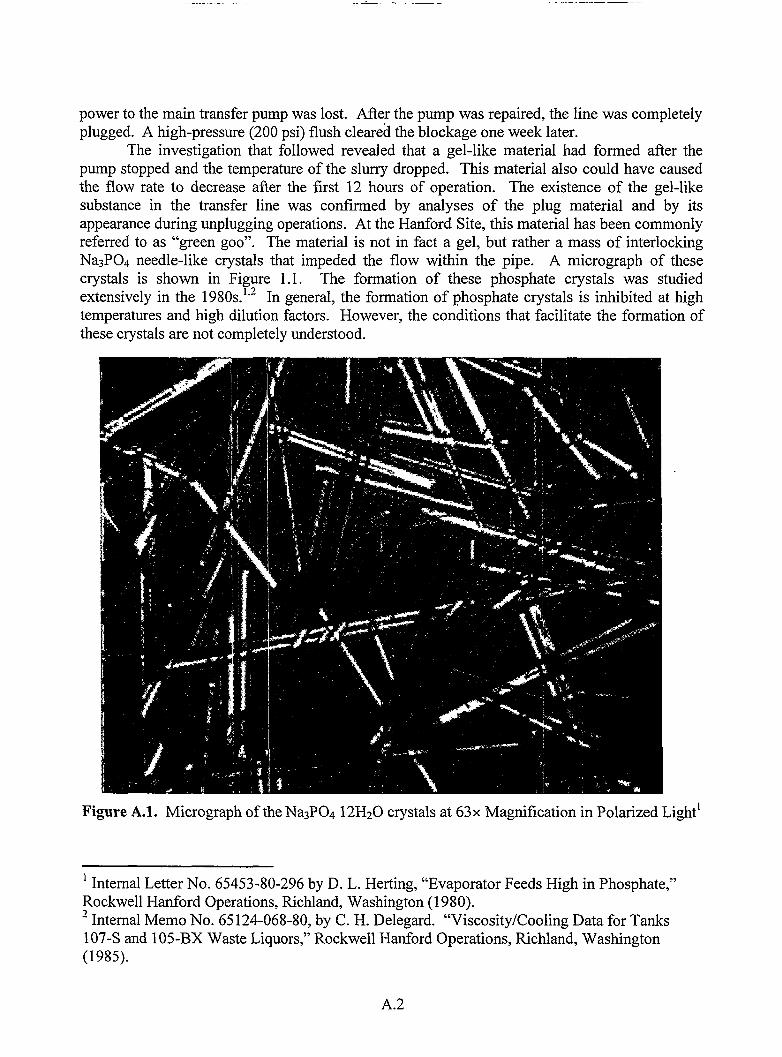
.. & ———. — ._._—.... .—— ——
power to the main transfer pump was lost. After the pump was repaired, the line was completelyplugged. A high-pressure (200 psi) flush cleared the blockage one week later.
The investigation that followed revealed that a gel-like material had formed after thepump stopped and the temperature of the slurry dropped. This material also could have causedthe flow rate to decrease after the first 12 hours of operation. The existence of the gel-likesubstance in the transfer line was confkrned by analyses of the plug material and by itsappearance during unplugging operations. At the Hanford Site, this material has been commonlyreferred to as “green goon. The material is not in fact a gel, but rather a mass of interlockingNa3P04 needle-like crystals that impeded the flow within the pipe. A micrograph of thesecrystals is shown in Figure 1.1. The formation of these phosphate crystals was studiedextensively in the 1980s. 1-2 In general, the formation of phosphate crystals is inhibited at hightemperatures and high dilution factors. However, the conditions that facilitate the formation ofthese crystals are not completely understood.
Figure Al. Micrograph of the Na3POg 12H20 crystals at 63x Magnification in Polarized Lighti
1 Internal Letter No. 65453-80-296 by D. L. Herting, “Evaporator Feeds High in Phosphate,”Rockwell Hanford Operations, Richland, Washington (1980).z Internal Memo No. 65124-068-80, by C. H. Delegard. “Viscosity/Cooling Data for Tanks107-S and 105-BX Waste Liquors;’ Rockwell Hanford Operations, Richland, Washington(1985).
A.2

In addition to phosphate crystals, the precipitation of aluminates “&o has the potential toplug slurry transfer systems at the Hanford Site. In the highly alkaline tank waste (pH 14+), thesoluble aluminum species are anionic. The dominant species thought to be present is A1(OH)4-,based on Raman spectroscopy and NMR evidence. Aluminates can precipitate by at least twomechanisms: the formation of amorphous or crystalline solid phases such as gibbsite( -A1(OH)S), and the formation of sodium aluminate (NaAIOz) ionic salts (McKay et al. 1994).
As pH is lowered, condensation reactions can result in the formation of amorphous orcrystalline (gibbsite) AI(OH)3-. Below pH 12, aluminate solqbility drops quickly. Furthermore,if tank waste containing A1(OH)4- is cooled but the pH is not lowered, amorphous solid phases orcrystalline gibbsite ( -AI(OH)3) precipitate. These precipitation reactions are kinetically slow,and the resulting solids are less likely to interfere with fluid flow.
In addition to condensation reactions that can occur below pH 12, counter-ion effects canreduce the volubility of aluminate at high sodium hydroxide concentrations. Although thedecrease in aluminate volubility at high sodium hydroxide concentrations is not as dramatic asthe decrease in aluminate volubility as the pH is reduced below pH 12, sodium aluminateprecipitates form small crystals that rapidly increase the viscosity of the slurry (Reynolds andHei-ting 1984). In general, the concentration of the counter ion, Na~ and the temperature dictatethe volubility of aluminate at high pH. It has been shown by Reynolds and Herting (1984) that in2 to 6 M NaOH solutions, the volubility of sodium al~inate decreases with increasing pH andNaOH concentration. Increasing temperature tends to increase the volubility of sodiumaluminate, but there is a region at low NaOH concentration where increasing temperatureactually decreases the volubility. The degree to which the solution is saturated in sodium nitrateand sodium nitrite also affects the volubility of sodium aluminate.
Thus, the chemistry of aluminates depends on the temperature, pH, concentration ofaluminates, and the concentration Na+. Lowering the pH or temperature increases the potentialfor generating insoluble aluminum hydroxides such as gibbsite. While at low pH the addition ofsodium hydroxide increases volubility, the addition of sodium hydroxide at high pH can result inthe precipitation of sodium aluminate.
Since the transfer lines at Hanford are designed to operate above the critical, ordeposition, velocity of the slurry (the minimum velocity required to keep solids in the pipelinesuspended; see Hudson [1996]), it is unlikely that the older slurry transfer pipelines werepermanently blocked by the sedimentation of solids at the bottom of the pipe. Tank wastechemistry has therefore been suspected as the cause of the slurry pipeline plugging incidents.l
Previous slumy-transport experience has influenced the design of new slurry-transportsystems at the Hanford Site. “To reduce the probability of line blockage fi-om the precipitation ofsolids due to cooling, slurry lines at the Hanllord Site are now insulated. It is predicted that nomore than a 20°F temperature drop will be experienced in the 6.5-mile pipeline at a flow rate of
1Internal Letter Report by R. L. McKay, “TWRS Retrieval Technology Project, Slurry TransportPlugging Investigation,” Pacific Northwest National Laboratory, Richland, Washington (1993).
‘A.3
4.5 fl/see, specific gravity of 1.5, and an initial temperature of 200°F (WHC 1993; WHC 1996).Even though Hanford slurry lines have always operated at or above the critical velocity, theminimum velocity for most slurry transfer systems has been increased to 6 ft/sec. This velocityis well above the minimum critical velocity for Hanford slurries, which is estimated at around2 ft/sec (Hudson 1996).
Furthermore, the waste will be diluted with hot water (up to 200°F) to decrease theprobability of precipitation or gel formation, and the pumps can provide greater pressure (up to1000 psi) to dislodge any blockage that may form in the pipe (WHC 1996). The dilution watercan be pH-controlled to theoretically prevent the precipitation of aluminates. However, aretrieved tank may not be homogeneous, so sampling may not provide accurate or adequateinformation about the concentration of aluminates and other relevant species. Moreover, certainaspects of aluminate chemistry are not filly understood (e.g., kinetics, morphology of theprecipitates, and the effect of other ionic species in the solution on the precipitation ofaluminates). Therefore, pH control may not prevent the blockage of the pipeline “with aluminateprecipitates.
If the cross-site transfer line were to plug, long-term delays could be experienced as thereplacement pipelines are designed, constructed, and tested. These delays would magni& thecost of pipeline replacement. For example, if slurry-transfer problems cause delays in theprocessing of Hanford tank waste by the private vendors, DOE would be subject to significantfinancial liabilities. DOE likely would be required to cover the costs of the private vendor on adaily basis if feed were not delivered as originally scheduled. Equally important is the loss ofpublic and political trust that could occur with such a failure of the slurry-transfer system.Therefore, additional enhancements that improve the reliability of the slurry-transfer systems aredesired.
Oak Ridge Gunite and Associated Tanks (GAAT)
ORNL was established in 1943 with the purpose to serve as a pilot facility for productionoperations at Hanford, Washington. Since then, six large underground concrete (Gunite) tanks,designated as tanks W-5 through W-1 O, were constructed to collect and store wastes that mightbe generated. These tanks have a volume capacity of 643,000 L (170,000 gal). They have aninside diameter of -15.2 m (50 ft), a side-wall height of -3.7 m (12 ft), and a dome height of-5.5 m(18 i?) at the center. Six smaller Gunite tanks and four stainless steel tanks constitute theremainder of the GAAT. These tanks eventually became an integral part of the ORNL wastesystem (ORNL 1995).
The radioactive, hazardous, and other chemical wastes that have been stored in the tankswere routinely treated with caustic to adjust the pH to 10 or greater. Compounds that wereinsoluble in high-pH solutions precipitated and settled in the tanks. When the Gunite tanks weretaken out of service in 1980, approximately 1.5 million L (400,000 gal). of sludge containingbetween 0.5 and 1 million curies had accumulated in the tanks (ORNL 1995).
A.4

A program to empty the six original tanks and dispose of the accumulated sludge beganin 1977. Process development, system design, and facility construction were completed byJune 1982. In approximately 18 months of operation, most of the sludge in five of the six tankswas removed. Approximately 90°/0 of the sludge was resuspended and transferred to the MeltonValley Storage Talcs (MVSTS) (ORNL 1995).
The goal of the GAAT Remediation Project is to remove the remaining sludge and topermanently close the tanks. Currently, this sludge and the accumulated liquids are beingremoved from each tank and consolidated in GAAT Tank W-9. The tanks will be cleaned to the.extent practical with existing technology, and the residual contamination will be characterized inpreparation for final site closure under the Comprehensive Environmental Response,Compensation, and Liability Act (CERCLA) as part of a site-wide action. The wasteconsolidated in Tank W-9 will be resuspended, conditioned, and prepared for pipeline transfer tothe MVSTS. When it is transferred to the MVSTS, the GAAT sludge will be consolidated withother transuranic sludges generated at ORNL. The sludges in the MVSTS will be mobilized,treated, and disposed of as part of a separate activity.
References
Hudson, J. D. 1996. Dejining Waste Acceptance Criteria for Hanford Replacement Cross-SiteTransfer System, PNNL-1 1146, Pacific Northwest National Laboratory, Richland, WashingJon.
McKay, R. L., F. F. Erian, C. J. Call, and E. A. Daymo. 1994. Slurry Transport of HanfordTank Wastes: Open Technical Issues and Recommended Actions, Letter Report DSTRTP-CY94-012, Pacific Northwest National Laboratory, Richland, Washington.
Oak Ridge National Laboratory (ORNL). 1995. Project Management Plan for the Gunite andAssociated Tanks Treatability Studies Project at Oak Ridge National Laboratory, ONRL/ER-254, Oak Ridge National Laboratory, Oak Ridge, Tennessee.
Reynolds, B. A., and D. L. Herting. 1984. Solubilities of Sodium Nitrate, Sodium Nitrite, andSodium Aluminate in Simulated Nuclear Waste, RHO-RE-ST-14P, Rockwell HanfordOperations, Richland, Washington.
Rockwell Hanford Operations. 1978. Standard Operating Procedure. March 31, 1978. SpecljicTransfer Procedure Transfer: TK-107-S (West Area) to TK-105-BX (Eas~, SOP No. 200.7.111,Rockwell Hanford Operations, Richland, Washington.e
Washenfelder, D. J. 1978. Occurrence Report: Plugged Cross-Country Transfer Line, OR-78-88, Rockwell Hanford Operations, Richland, Washington.
Westinghouse Hanford Company (WHC). 1993. Conceptual Design Report, Initial TankRetrieval Systems for Project W-211, WHC-SD- W211-CDR-001, Rev. O,Westinghouse Had30rdCompany, Richland, Washington.
A.5
— .—. ..—.——. —-..—
Westinghouse Hanford Company (WHC). 1996. Functions and Requirements Document for theReplacement of the Cross-Site Transfer System, Project W-058, WHC-SD- W058-FDC-001,Rev. 4, Westinghouse Hanford Company, Richland, Washington.
I
A.6
PNNL-13064
Distribution
No.of No. Of’
Copies Copies
OFFSITE ONSITE
2 DOE/Oflice of Scientific and Technical 5Information
Idaho National EnEineerinR aridEnvironmental Laboratory2525 Fremont AvenueP. O. BOX1625Idaho Falls, ID, 83415
1T. R. Thomas Mail Stop 3760
2 Oak Ridge National Laboratory 2P. 0 BOX2008Oak Ridge TN 37831-6330
T. D. Hylton 2C. K. Bayne
21
Distr. 1
Numatec Hanford CommrwA-M. F Choho R3-73R. R. Bafus R3-73J. W. Bailey R3-25G. T. Frater K9-46P. W. Gibbons K9-91T. J. Conrads R3-73
CH2M Hill .T. H. May R2-11
DOE/Richland Operations OffIceE. J. Cruz H6-60M. J. Glasper K8-50
Lockheed-Martin Hanford CommmvW. J. Stokes R2-89J. O. Honeyman . H6-62
Pacific Northwest National LaboratoryN. G. Colton K8-93E. A. Daymo K2-14p. A. Scott K9-46R. A. Brouns K9-02R. L. Gilchrist K9-91B.A. Carteret K9-91W. C. Weimer P7-27J. W. Brothers K9-20M. S. Greenwood K5-26J. A. Bamberger K7-15E. V. Morrey P7-28J. R. Bontha (5) K6-24
. Technical Report Files (5)