Quadratic Project Modeling Algebra Section 11009
10
Quadratic Project Modeling Algebra Section 11009
-
Upload
vaughan-buck -
Category
Documents
-
view
34 -
download
0
description
Quadratic Project Modeling Algebra Section 11009. Juvenile Violent Crime Arrests. Source: http://wps.prenhall.com/esm_lehmann1/51/13153/3367376.cw/-/3367383/index.html. Scatter Plot of Data. # of Juvenile Arrest. Years x=number of years after 1988. Why is this a Quadratic Function?. - PowerPoint PPT Presentation
Transcript of Quadratic Project Modeling Algebra Section 11009

Quadratic ProjectModeling Algebra Section
11009
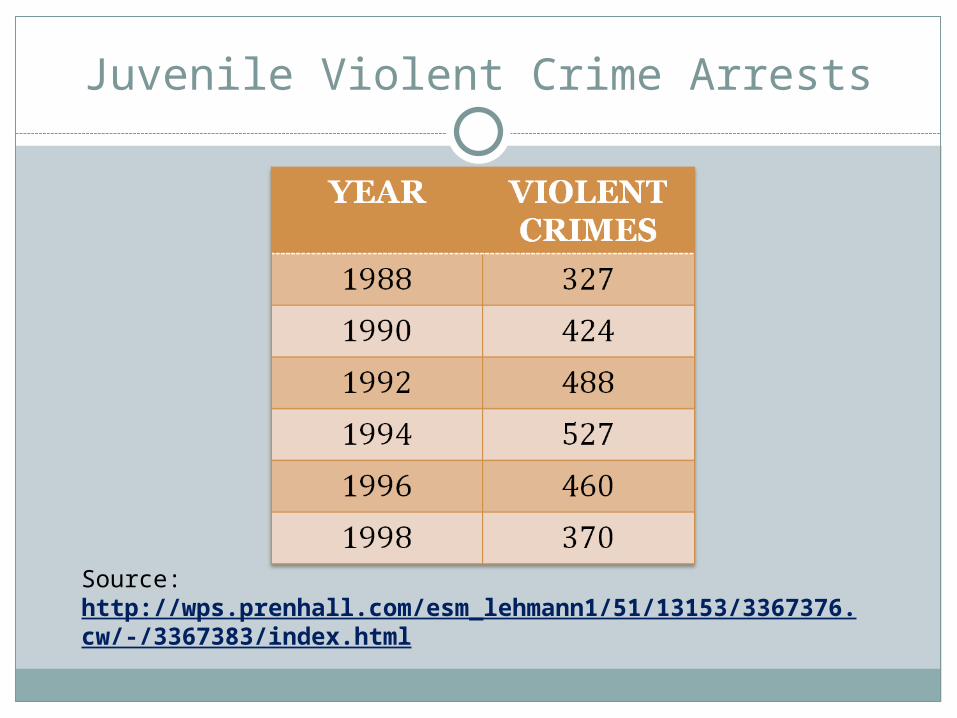
Juvenile Violent Crime Arrests
Source: http://wps.prenhall.com/esm_lehmann1/51/13153/3367376.cw/-/3367383/index.html

Scatter Plot of Data
Years x=number of years after 1988
# o
f Juve
nile
A
rrest

Why is this a Quadratic Function?
This data represents a quadratic function because the second differences of the “Juvenile Arrest” are very close to being equal which makes this a parabola
The Scatter Plot also forms almost a perfect parabola which makes the data quadratic
Y- VALUES FIRST DIFFERENCESECOND DIFFERENCE
327 97 33
424 64 25
488 39 28
527 -67 23
460 -90
370
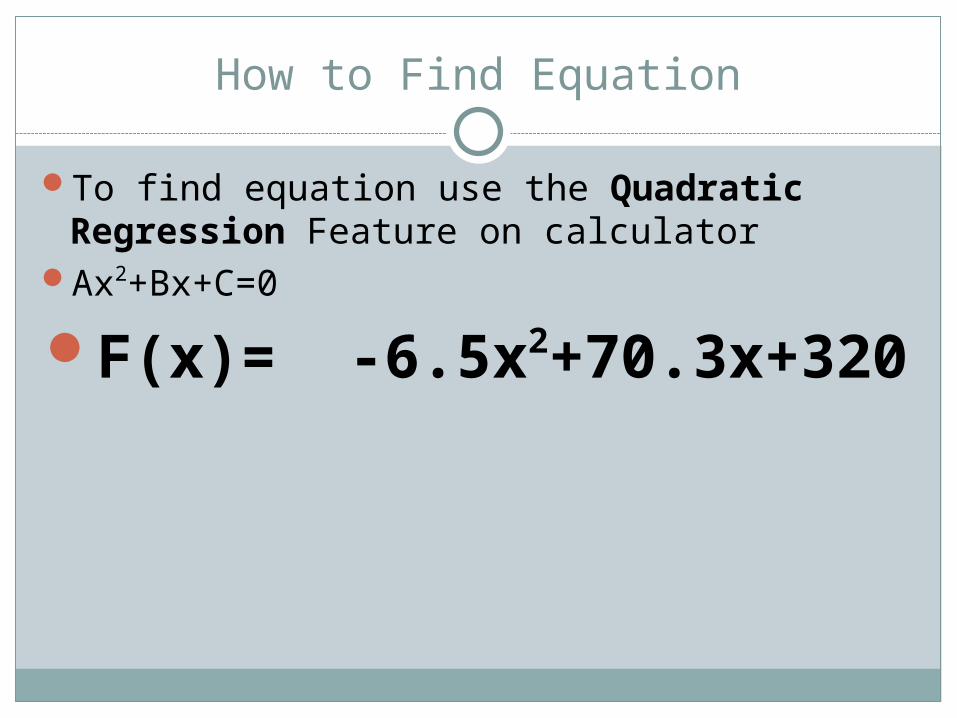
How to Find Equation
To find equation use the Quadratic Regression Feature on calculatorAx2+Bx+C=0F(x)= -6.5x2+70.3x+320

F(x)= -6.5x2+70.3x+320This equation is a maximum because the leading coefficient is negativeFinding the Vertex:
Use formula: -b/2a -70.3/2(-6.5)= -70.3/-13 X=5.41 Plug in X to the original equation to find Y F(5.41)=-6.5(5.41)2+70.3(5.41)+320= -190.24265+380.323+320= 510.1=Y VERTEX= (5.41, 510.1)
This means in the year 1993 (5.41+1988) there were 510.1 juvenile crime arrests
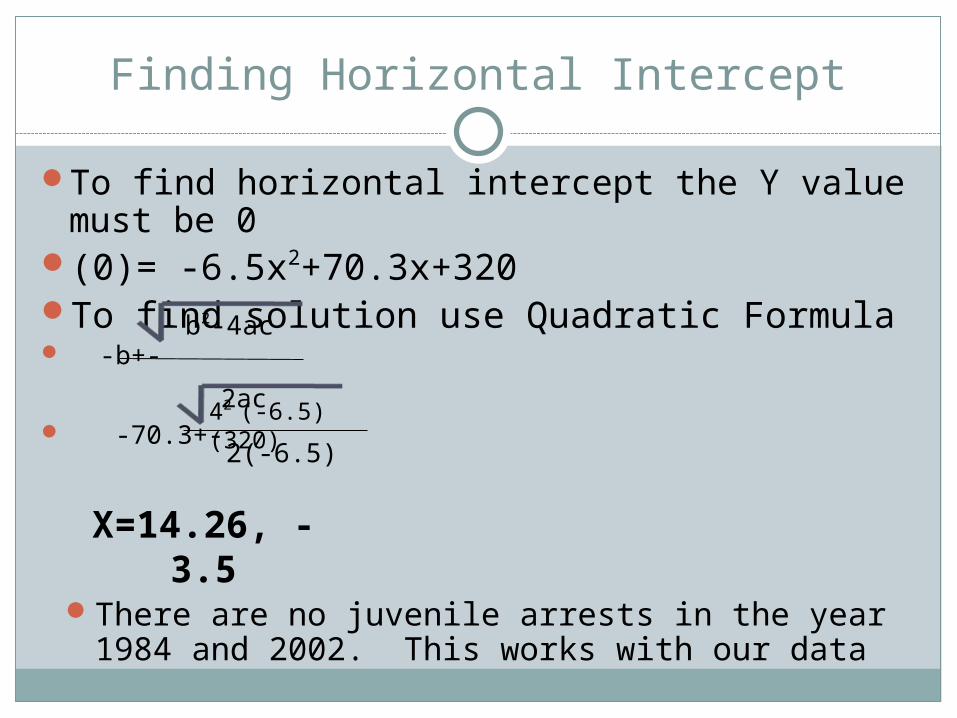
Finding Horizontal Intercept
To find horizontal intercept the Y value must be 0(0)= -6.5x2+70.3x+320To find solution use Quadratic Formula -b+- 2ac -70.3+-
There are no juvenile arrests in the year 1984 and 2002. This works with our data
2(-6.5)X=14.26, -3.5
b2-4ac
42 (-6.5)(320)
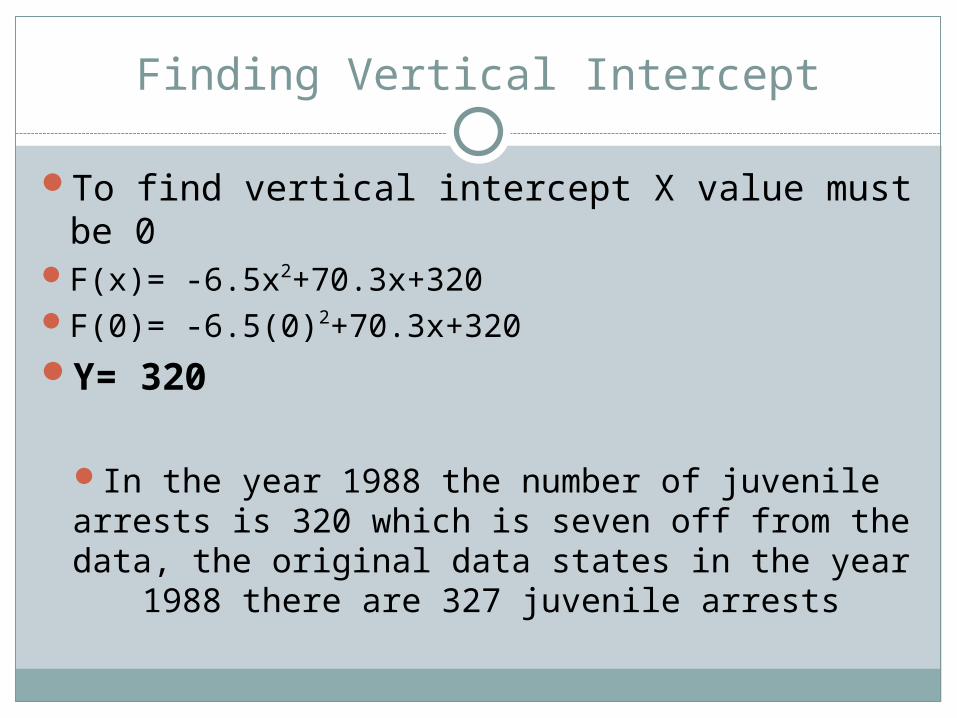
Finding Vertical Intercept
To find vertical intercept X value must be 0F(x)= -6.5x2+70.3x+320F(0)= -6.5(0)2+70.3x+320Y= 320In the year 1988 the number of juvenile arrests is 320 which is seven off from the data, the original data states in the year 1988 there are 327 juvenile arrests

Quadratic Parabola of Data
Years x=number of years after 1988
# o
f Juve
nile
A
rrest

Predictions Made with Equation
The model can be used to find the number of juvenile arrests when no data was collected Year 1991= F(3)= -6.5(3)2+70.3(3)+320= 227.6 arrests Year 2000= F(12)= -6.5(12)2+70.3(12)+320= 472.4 arrests


![Algebra 2 10.7 Solve Quadratic Systems · 10/08/2014 · Algebra 2 10.7 Solve Quadratic Systems Learning Target: I can solve quadratic systems of equations. [A.REI.7] We've learned](https://static.fdocuments.net/doc/165x107/5eb61f1c59c6e21a6925f9df/algebra-2-107-solve-quadratic-systems-10082014-algebra-2-107-solve-quadratic.jpg)