QSurveillance: Supporting Public Health Emergencies Julia Hippisley-Cox On behalf of QSurveillance...
23
QSurveillance: Supporting Public Health Emergencies Julia Hippisley-Cox On behalf of QSurveillance team EMIS NUG, Warwick, 2009
-
Upload
adela-ellis -
Category
Documents
-
view
213 -
download
0
Transcript of QSurveillance: Supporting Public Health Emergencies Julia Hippisley-Cox On behalf of QSurveillance...

QSurveillance:
Supporting Public Health Emergencies
Julia Hippisley-Cox
On behalf of QSurveillance team
EMIS NUG, Warwick, 2009

Outline for QSurveillance Presentation
Overview of
- Its role in various emergencies in last 5 years
- Critical data reporting for Swine Flu Pandemic
- CMO’s most recent national briefing
- Proposal for Vaccine Safety Study

September 2009
Acknowledgements
EMIS practices
David Stables
Andy Whitwam
Sean Riddell
Fiona Baker
Debbie Walton
INS (for help with disaster recovery July 09)
John Croasdale
HPA
Gillian Smith
Alex Elliott
Sally Harcourt
Sue Smith
Liam Donaldson (slides)
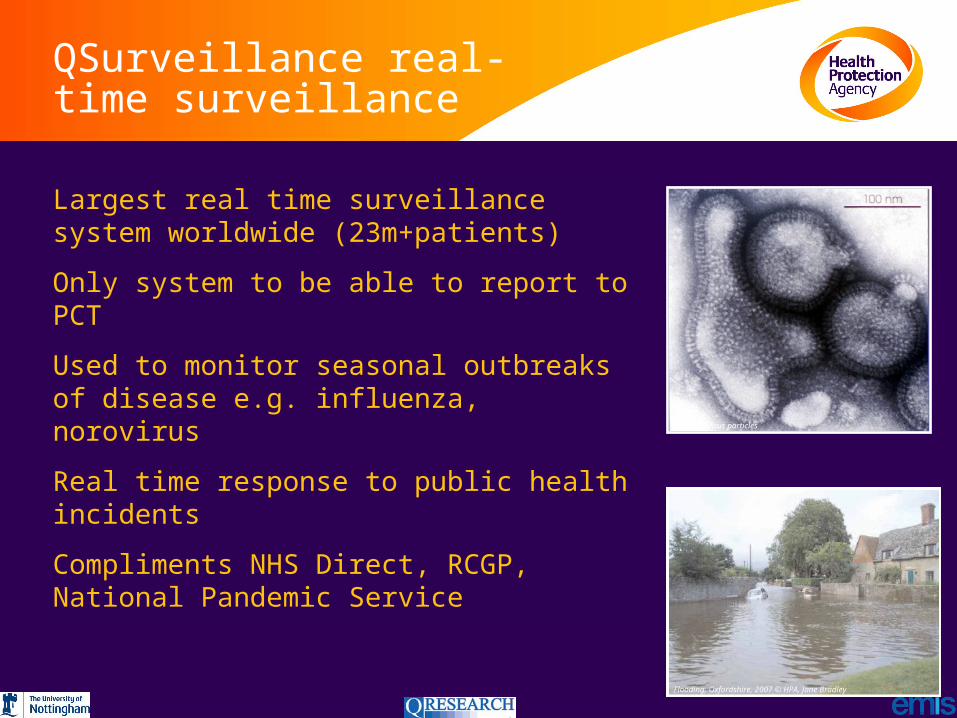
Largest real time surveillance system worldwide (23m+patients)
Only system to be able to report to PCT
Used to monitor seasonal outbreaks of disease e.g. influenza, norovirus
Real time response to public health incidents
Compliments NHS Direct, RCGP, National Pandemic Service
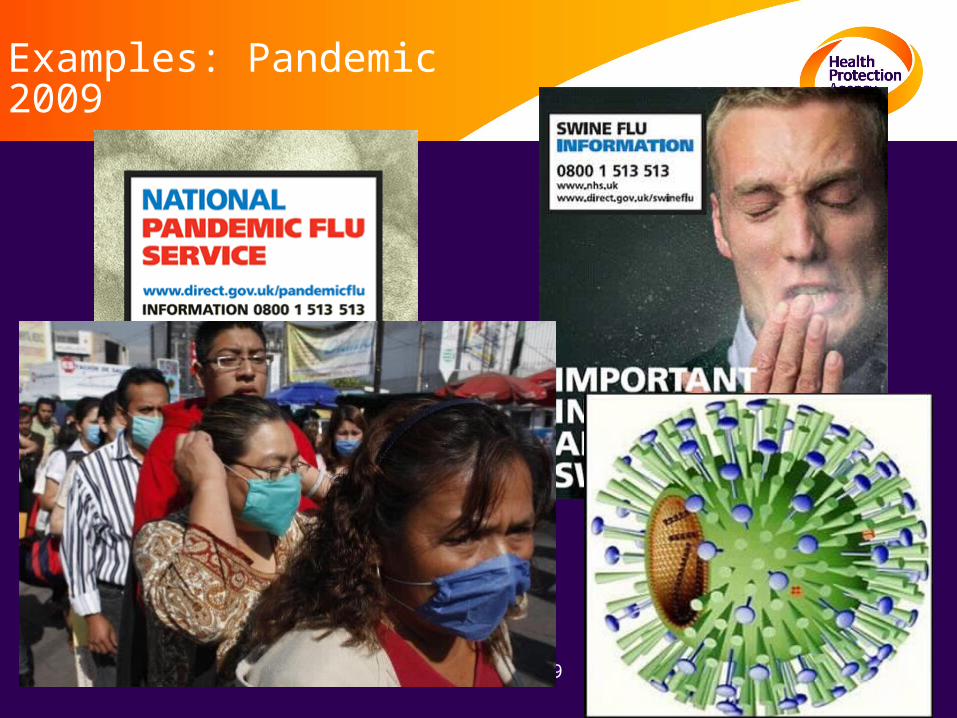
Influenza virus particles
Flooding, Oxfordshire, 2007 © HPA, Jane Bradley
QSurveillance real-time surveillance
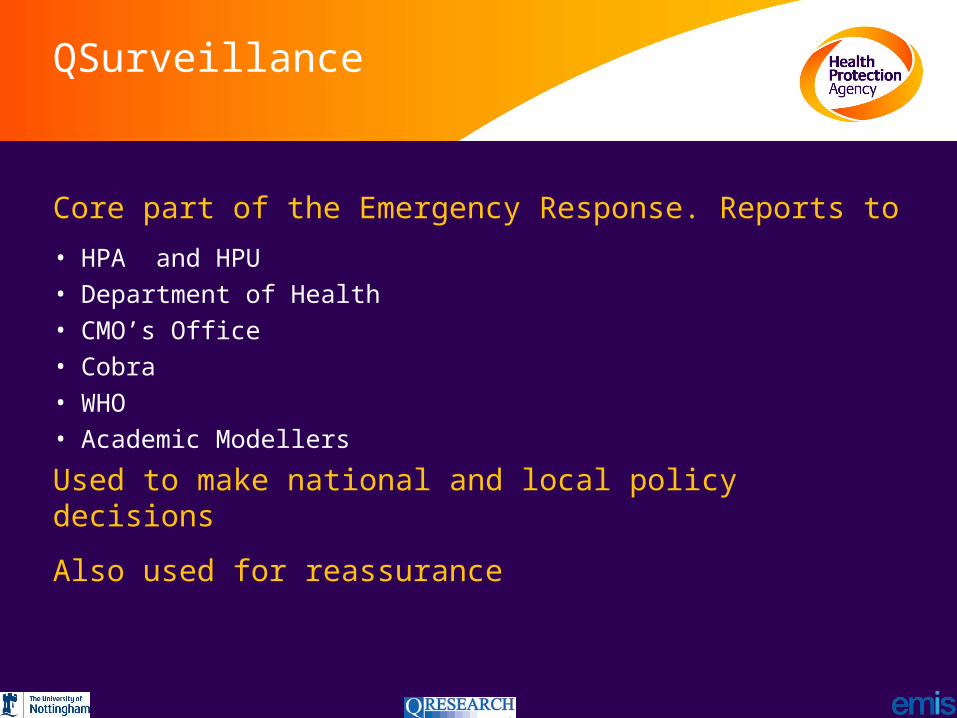
QSurveillance
Core part of the Emergency Response. Reports to
• HPA and HPU• Department of Health • CMO’s Office• Cobra• WHO• Academic Modellers
Used to make national and local policy decisions
Also used for reassurance

Examples: Ricin and London Bombings

Examples: Heatwaves

Examples: Buncefield

Examples: Avon Floods 2007
September 2009
Examples: Pandemic 2009
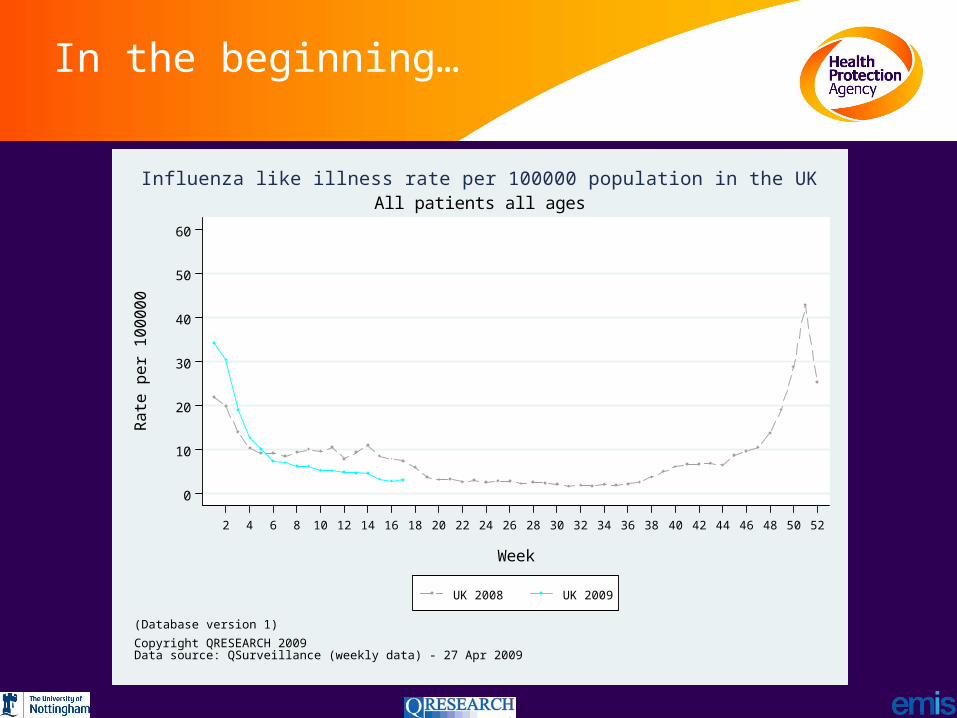
In the beginning…
0
10
20
30
40
50
60
Rat
e pe
r 10
0000
2 4 6 8 10 12 14 16 18 20 22 24 26 28 30 32 34 36 38 40 42 44 46 48 50 52
Week
UK 2008 UK 2009
(Database version 1)
Copyright QRESEARCH 2009Data source: QSurveillance (weekly data) - 27 Apr 2009
All patients all agesInfluenza like illness rate per 100000 population in the UK

Media ‘frenzy’?
0
10
20
30
40
50
60
Rat
e pe
r 10
0000
2 4 6 8 10 12 14 16 18 20 22 24 26 28 30 32 34 36 38 40 42 44 46 48 50 52
Week
UK 2008 UK 2009
(Database version 1)
Copyright QRESEARCH 2009Data source: QSurveillance (weekly data) - 1 Jun 2009
All patients all agesInfluenza like illness rate per 100000 population in the UK
September 2009
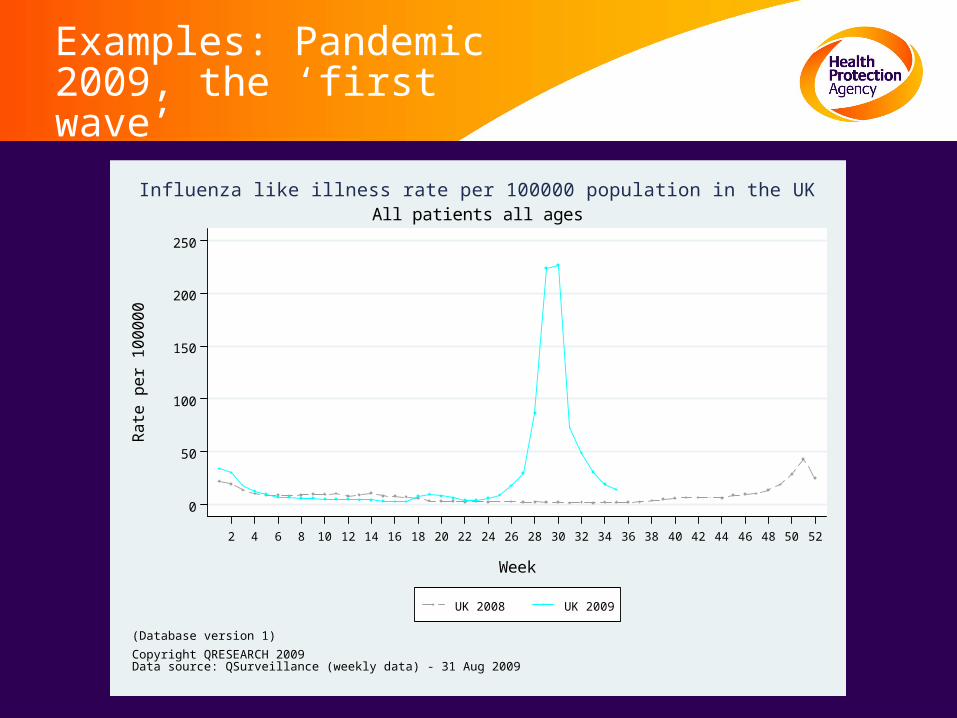
Examples: Pandemic 2009, the ‘first wave’
0
50
100
150
200
250
Rat
e pe
r 10
0000
2 4 6 8 10 12 14 16 18 20 22 24 26 28 30 32 34 36 38 40 42 44 46 48 50 52
Week
UK 2008 UK 2009
(Database version 1)
Copyright QRESEARCH 2009Data source: QSurveillance (weekly data) - 31 Aug 2009
All patients all agesInfluenza like illness rate per 100000 population in the UK
September 2009
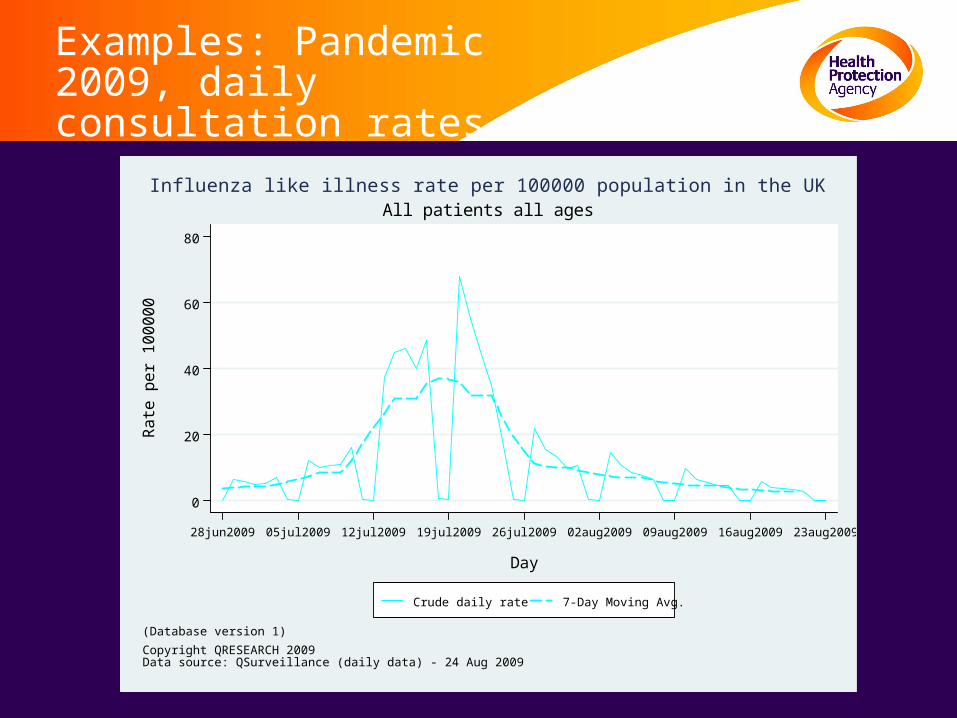
Examples: Pandemic 2009, daily consultation rates
0
20
40
60
80
Rat
e pe
r 10
0000
28jun2009 05jul2009 12jul2009 19jul2009 26jul2009 02aug2009 09aug2009 16aug2009 23aug2009
Day
Crude daily rate 7-Day Moving Avg.
(Database version 1)
Copyright QRESEARCH 2009Data source: QSurveillance (daily data) - 24 Aug 2009
All patients all agesInfluenza like illness rate per 100000 population in the UK

Age-specific ILI
0
200
400
600
Rat
e pe
r 10
0000
2 4 6 8 10 12 14 16 18 20 22 24 26 28 30 32 34 36 38 40 42 44 46 48 50 52
Week
under 1 year
1-4 years
5-14 years
15-24 years
25-44 years
45-64 years
65-74 years
75+ years
(Database version 1)
Copyright QRESEARCH 2009Data source: QSurveillance (weekly data) - 31 Aug 2009
by age bandInfluenza like illness rate per 100000 population in 2009 in the UK
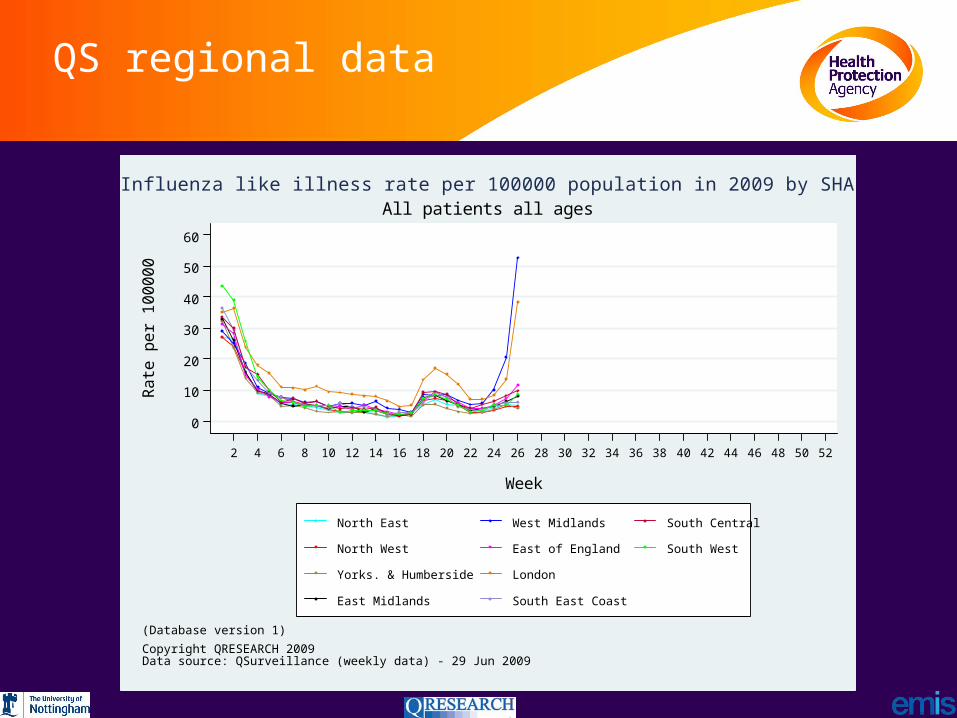
QS regional data
0
10
20
30
40
50
60
Rat
e pe
r 10
0000
2 4 6 8 10 12 14 16 18 20 22 24 26 28 30 32 34 36 38 40 42 44 46 48 50 52
Week
North East
North West
Yorks. & Humberside
East Midlands
West Midlands
East of England
London
South East Coast
South Central
South West
(Database version 1)
Copyright QRESEARCH 2009Data source: QSurveillance (weekly data) - 29 Jun 2009
All patients all agesInfluenza like illness rate per 100000 population in 2009 by SHA
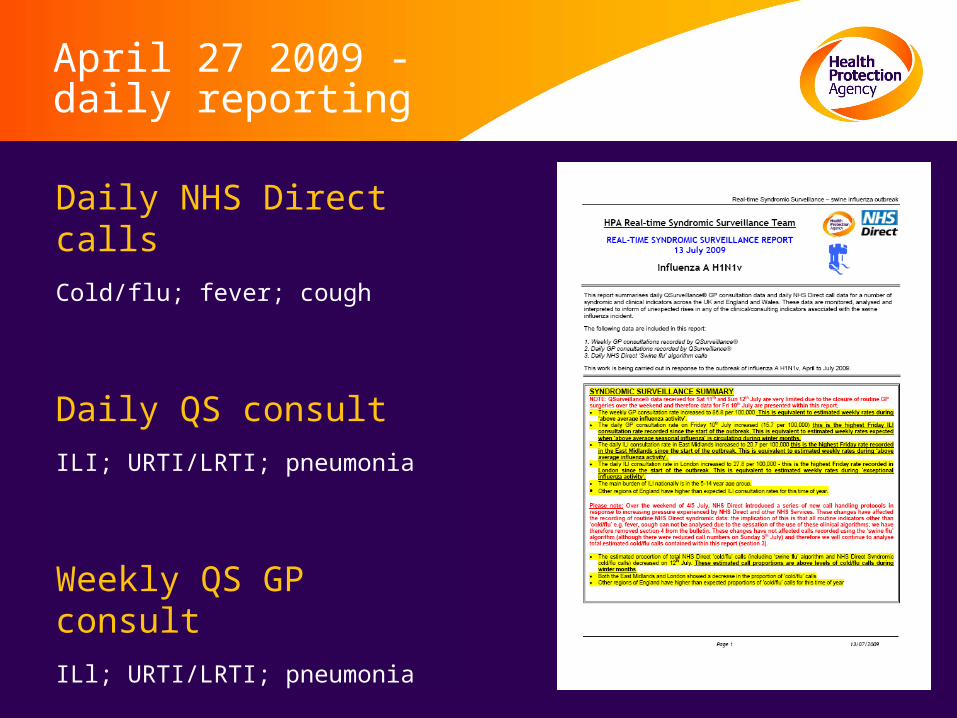
April 27 2009 - daily reporting
Daily NHS Direct calls
Cold/flu; fever; cough
Daily QS consult
ILI; URTI/LRTI; pneumonia
Weekly QS GP consult
ILl; URTI/LRTI; pneumonia

Examples: Pandemic 2009, England and Wales
Weekly consultations per 100,000 for ILI by PCT2009 week 27
No Data (5)over 130 (5)101 to 130 (3)
71 to 100 (9)51 to 70 (4)21 to 50 (28)
0 to 20 (97)
(C) Crown Copyright & Database Right 2009. Ordnance Survey Licence 100016969
QSurveillance (R) database version 1
Weekly consultations per 100,000 for ILI by PCT2009 week 28
No Data (4)over 130 (26)101 to 130 (14)
71 to 100 (22)51 to 70 (18)21 to 50 (49)
0 to 20 (18)
(C) Crown Copyright & Database Right 2009. Ordnance Survey Licence 100016969
QSurveillance (R) database version 1
Weekly consultations per 100,000 for ILI by PCT2009 week 29
No Data (6)over 130 (113)101 to 130 (14)
71 to 100 (11)51 to 70 (5)21 to 50 (1)
0 to 20 (1)
(C) Crown Copyright & Database Right 2009. Ordnance Survey Licence 100016969
QSurveillance (R) database version 1

Examples: Pandemic 2009, daily QSurveillance maps West Midlands
Wolverhampton City
Coventry TeachingSolihull
Heart of Birmingham TeachingDudley
Birmingham East and North
Herefordshire
South Birmingham
Shropshire County
Walsall Teaching
Telford and Wrekin
Sandwell
North Staffordshire
Stoke on Trent
South Staffordshire
Worcestershire
Warwickshire
Weekly consultations per 100,000 for ILI by PCT2009 week 27
No Data (0)over 130 (3)101 to 130 (1)
71 to 100 (2)51 to 70 (0)21 to 50 (8)
0 to 20 (3)
(C) Crown Copyright & Database Right 2009. Ordnance Survey Licence 100016969.
QSurveillance (R) database version 1
Wolverhampton City
Coventry TeachingSolihull
Heart of Birmingham TeachingDudley
Birmingham East and North
Herefordshire
South Birmingham
Shropshire County
Walsall Teaching
Telford and Wrekin
Sandwell
North Staffordshire
Stoke on Trent
South Staffordshire
Worcestershire
Warwickshire
Weekly consultations per 100,000 for ILI by PCT2009 week 28
No Data (0)over 130 (6)101 to 130 (3)
71 to 100 (4)51 to 70 (1)21 to 50 (3)
0 to 20 (0)
(C) Crown Copyright & Database Right 2009. Ordnance Survey Licence 100016969.
QSurveillance (R) database version 1
Wolverhampton City
Coventry TeachingSolihull
Heart of Birmingham TeachingDudley
Birmingham East and North
Herefordshire
South Birmingham
Shropshire County
Walsall Teaching
Telford and Wrekin
Sandwell
North Staffordshire
Stoke on Trent
South Staffordshire
Worcestershire
Warwickshire
Weekly consultations per 100,000 for ILI by PCT2009 week 29
No Data (0)over 130 (16)101 to 130 (0)
71 to 100 (1)51 to 70 (0)21 to 50 (0)
0 to 20 (0)
(C) Crown Copyright & Database Right 2009. Ordnance Survey Licence 100016969.
QSurveillance (R) database version 1

Islington
Hammersmith and Fulham
Havering
KingstonBromley
Greenwich Teaching
Barnet
Hillingdon
Enfield
Barking and Dagenham
City and Hackney Teaching
Tower Hamlets
Newham
Haringey Teaching
Ealing
Hounslow
Brent Teaching
Harrow
Camden
Croydon
Kensington and ChelseaWestminster
LambethSouthwark
LewishamWandsworth
Richmond and Twickenham
Sutton and Merton
RedbridgeWaltham Forest
Bexley
Weekly consultations per 100,000 for ILI by PCT2009 week 27
No Data (1)over 130 (2)101 to 130 (2)
71 to 100 (7)51 to 70 (3)21 to 50 (12)
0 to 20 (4)
(C) Crown Copyright & Database Right 2009. Ordnance Survey Licence 100016969.
QSurveillance (R) database version 1
Islington
Hammersmith and Fulham
Havering
KingstonBromley
Greenwich Teaching
Barnet
Hillingdon
Enfield
Barking and Dagenham
City and Hackney Teaching
Tower Hamlets
Newham
Haringey Teaching
Ealing
Hounslow
Brent Teaching
Harrow
Camden
Croydon
Kensington and ChelseaWestminster
LambethSouthwark
LewishamWandsworth
Richmond and Twickenham
Sutton and Merton
RedbridgeWaltham Forest
Bexley
Weekly consultations per 100,000 for ILI by PCT2009 week 28
No Data (1)over 130 (16)101 to 130 (6)
71 to 100 (3)21 to 50 (4)
0 to 20 (1)
(C) Crown Copyright & Database Right 2009. Ordnance Survey Licence 100016969.
QSurveillance (R) database version 1
Islington
Hammersmith and Fulham
Havering
KingstonBromley
Greenwich Teaching
Barnet
Hillingdon
Enfield
Barking and Dagenham
City and Hackney Teaching
Tower Hamlets
Newham
Haringey Teaching
Ealing
Hounslow
Brent Teaching
Harrow
Camden
Croydon
Kensington and ChelseaWestminster
LambethSouthwark
LewishamWandsworth
Richmond and Twickenham
Sutton and Merton
RedbridgeWaltham Forest
Bexley
Weekly consultations per 100,000 for ILI by PCT2009 week 29
No Data (2)over 130 (26)101 to 130 (1)
71 to 100 (1)51 to 70 (1)21 to 50 (0)
0 to 20 (0)
(C) Crown Copyright & Database Right 2009. Ordnance Survey Licence 100016969.
QSurveillance (R) database version 1
Pandemic 2009QSurveillance maps London

Usefulness of data?
Following the change to ‘national mitigation’, focus turned to syndromic surveillance
At local level, syndromic data used to determine ‘hot spots’ and change policy
Syndromic data used to model case estimates
Daily data feed to HPA sitrep, DH, CMO
Swine Flu Vaccine Safety StudyReal time evaluation of vaccine safety
Examine at about 30 serious adverse events
- Anaphylaxis
- Steven Johnson syndrome
- Guillain Barre syndrome
Need very large sample to get results quickly enough
Planning to recruit EMISWeb practices
Volunteers for pilot welcome in due course

Qsurveillance portal
We had to set up emergency web portal for the HPA and CMO, modellers in July 09
Extending this so practices can use it
See their own data
Draw comparisons between areas – PCTs, SHAs etc
http://qsurveillance.qresearch.org