
QSAR modeling to design selective histone deacetylase 8 (HDAC8)...
14
RESEARCH ARTICLE QSAR modeling to design selective histone deacetylase 8 (HDAC8) inhibitors Guang Ping Cao 1 • Sundarapandian Thangapandian 1 • Minky Son 1 • Raj Kumar 1 • Yeung-Joon Choi 2 • Yongseong Kim 3 • Yong Jung Kwon 4 • Hyong-Ha Kim 5 • Jung-Keun Suh 6 • Keun Woo Lee 1 Received: 20 July 2015 / Accepted: 31 December 2015 Ó The Pharmaceutical Society of Korea 2016 Abstract HDAC8 inhibitors have become an attractive treatment for cancer. This study aimed to facilitate the identification of potential chemical scaffolds for the selective inhibition of histone deacetylase 8 (HDAC8) using in silico approaches. Non-linear QSAR classification and regression models of HDAC8 inhibitors were devel- oped with support vector machine. Mean impact value- based sequential forward feature selection and grid search strategy were used for molecular descriptor selection and parameter optimization, respectively. The generated QSAR models were validated by leave-one-out cross validation and an external test set. The best QSAR classification model yielded 84 % of accuracy on the external test pre- diction and Matthews correlation coefficient is 0.69. The best QSAR regression model showed low root-mean- square error (0.63) and high squared correlation coefficient (0.53) for the test set. The validated QSAR models together with various drug-like properties, molecular docking and molecular dynamics simulation were sequentially used as a multi-step query in chemical database virtual screening. Finally, two hit compounds were discovered as new structural scaffolds which can be used for further in vitro and in vivo activity analyses. The strategy used in this study could be a promising computational strategy which can be utilized for other target drug design. Keywords Histone deacetylases 8 QSAR Support vector machine Molecular docking Molecular dynamics simulation Virtual screening Introduction HDACs super family play critical roles in the regulation of cellular metabolism, and constitute promising drug targets for treatment of a broad range of human diseases such as cardiomyopathy, osteodystrophy, neurodegenerative dis- order, metabolic disorders, cardiovascular disease, aging cancer, etc. (Taylor et al. 2008). 18 HDACs enzymes have been identified and classified into four different classes based on sequence homology, function, DNA similarity, and phylogenetic analysis (Yang and Seto 2008; Lehrmann et al. 2002; Marks and Breslow 2007; Emiliani et al. 1998). Class I, Class II, and Class IV HDACs are zinc (Zn 2? ) dependent deacetylases, and Class III HDACs (Sirtuins) is mainly dependent on nicotinamide adenine dinucleotide (NAD ? ) for its deacetylation activity (Imai Electronic supplementary material The online version of this article (doi:10.1007/s12272-015-0705-5) contains supplementary material, which is available to authorized users. & Keun Woo Lee [email protected] 1 Department of Biochemistry, Division of Applied Life Science (BK21 Plus Program), Systems and Synthetic Agrobiotech Center (SSAC), Plant Molecular Biology and Biotechnology Research Center (PMBBRC), Research Institute of Natural Science (RINS), Gyeongsang National University, Jinju, Republic of Korea 2 Department of Seafood Science and Technology, The Institute of Marine Industry, Gyeongsang National University, Tongyeong 650-160, Republic of Korea 3 Department of Science Education, Kyungnam University, Masan 631-701, Republic of Korea 4 Department of Chemical Engineering, Kangwon National University, Chunchon 200-701, Republic of Korea 5 Division of Quality of Life, Korea Research Institute of Standards and Science, Daejeon 305-340, Republic of Korea 6 Bio Computing Major, Korean German Institute of Technology, Seoul 157-033, Republic of Korea 123 Arch. Pharm. Res. DOI 10.1007/s12272-015-0705-5
Transcript of QSAR modeling to design selective histone deacetylase 8 (HDAC8)...
RESEARCH ARTICLE
QSAR modeling to design selective histone deacetylase 8 (HDAC8)inhibitors
Guang Ping Cao1• Sundarapandian Thangapandian1
• Minky Son1•
Raj Kumar1• Yeung-Joon Choi2 • Yongseong Kim3
• Yong Jung Kwon4•
Hyong-Ha Kim5• Jung-Keun Suh6
• Keun Woo Lee1
Received: 20 July 2015 / Accepted: 31 December 2015
� The Pharmaceutical Society of Korea 2016
Abstract HDAC8 inhibitors have become an attractive
treatment for cancer. This study aimed to facilitate the
identification of potential chemical scaffolds for the
selective inhibition of histone deacetylase 8 (HDAC8)
using in silico approaches. Non-linear QSAR classification
and regression models of HDAC8 inhibitors were devel-
oped with support vector machine. Mean impact value-
based sequential forward feature selection and grid search
strategy were used for molecular descriptor selection and
parameter optimization, respectively. The generated QSAR
models were validated by leave-one-out cross validation
and an external test set. The best QSAR classification
model yielded 84 % of accuracy on the external test pre-
diction and Matthews correlation coefficient is 0.69. The
best QSAR regression model showed low root-mean-
square error (0.63) and high squared correlation coefficient
(0.53) for the test set. The validated QSAR models together
with various drug-like properties, molecular docking and
molecular dynamics simulation were sequentially used as a
multi-step query in chemical database virtual screening.
Finally, two hit compounds were discovered as new
structural scaffolds which can be used for further in vitro
and in vivo activity analyses. The strategy used in this
study could be a promising computational strategy which
can be utilized for other target drug design.
Keywords Histone deacetylases 8 � QSAR � Supportvector machine � Molecular docking � Molecular dynamics
simulation � Virtual screening
Introduction
HDACs super family play critical roles in the regulation of
cellular metabolism, and constitute promising drug targets
for treatment of a broad range of human diseases such as
cardiomyopathy, osteodystrophy, neurodegenerative dis-
order, metabolic disorders, cardiovascular disease, aging
cancer, etc. (Taylor et al. 2008). 18 HDACs enzymes have
been identified and classified into four different classes
based on sequence homology, function, DNA similarity,
and phylogenetic analysis (Yang and Seto 2008; Lehrmann
et al. 2002; Marks and Breslow 2007; Emiliani et al.
1998). Class I, Class II, and Class IV HDACs are zinc
(Zn2?) dependent deacetylases, and Class III HDACs
(Sirtuins) is mainly dependent on nicotinamide adenine
dinucleotide (NAD?) for its deacetylation activity (Imai
Electronic supplementary material The online version of thisarticle (doi:10.1007/s12272-015-0705-5) contains supplementarymaterial, which is available to authorized users.
& Keun Woo Lee
1 Department of Biochemistry, Division of Applied Life
Science (BK21 Plus Program), Systems and Synthetic
Agrobiotech Center (SSAC), Plant Molecular Biology and
Biotechnology Research Center (PMBBRC), Research
Institute of Natural Science (RINS), Gyeongsang National
University, Jinju, Republic of Korea
2 Department of Seafood Science and Technology, The
Institute of Marine Industry, Gyeongsang National
University, Tongyeong 650-160, Republic of Korea
3 Department of Science Education, Kyungnam University,
Masan 631-701, Republic of Korea
4 Department of Chemical Engineering, Kangwon National
University, Chunchon 200-701, Republic of Korea
5 Division of Quality of Life, Korea Research Institute of
Standards and Science, Daejeon 305-340, Republic of Korea
6 Bio Computing Major, Korean German Institute of
Technology, Seoul 157-033, Republic of Korea
123
Arch. Pharm. Res.
DOI 10.1007/s12272-015-0705-5
et al. 2000; Landry et al. 2000). The HDAC8 enzyme
belongs to the class I enzymes which are found primarily
in the nucleus (Valenzuela-Fernandez et al. 2008). Except
HDAC8, functional HDACs are found as multimeric
complexes of high molecular weight and most of them are
functionally inactive (Vannini et al. 2007; Bolden et al.
2006). Expression of HDAC8 notably correlates with
neuroblastoma, a highly malignant childhood cancer
derived from the sympathetic nervous system (Brodeur
2003; Oehme et al. 2009). Moreover, an RNA interference
study showed that HDAC8 is involved in the regulation of
proliferation, clonogenic growth and neuronal differentia-
tion of neuroblastoma cells. Inv1, an abnormal fusion
protein formed during acute myeloid leukemia binding
HDAC8, is also associated with aberrant, constitutive
genetic repression (Durst et al. 2003). These evidences
prove HDAC8 as a potential target for cancer treatment.
To date, a number of potential HDAC inhibitors are in
clinical trials (Thangapandian et al. 2011). Therefore,
HDAC8 is considered to be the best model among other
mammalian HDACs from a structural biology and drug
discovery perspective.
Drug discovery and development is a difficult, costly and
time-consuming work. In silico virtual screening (VS) is an
economical and rapid approach to retrieve potential lead in
drug discovery. Currently several VS methods have been
well established such as quantitative/qualitative structure–
activity relationships (QSAR)-based and molecular dock-
ing-based VS (Cao et al. 2015). Obviously, different VS
methods have their own advantages and disadvantages.
Each of these VS methods might not perform optimally
when used alone in terms of the speed and effectiveness of
VS, a combination of these methods is an alternative
approach. In past decades, Support vector machine (SVM)
is becoming more attractive tools to develop QSAR model
for VS in the drug discovery, as they reduce the complexity
of experiments, screen a vast chemical library rapidly (Wan
et al. 2012; Ma et al. 2010; Shi et al. 2012; Byvatov et al.
2003; Vasanthanathan et al. 2009; Han et al. 2007; Yap and
Chen 2004; Wang et al. 2012; Mahe et al. 2005; Liew et al.
2009; Zhang et al. 2012; Niu 2007). During SVM model
development, compounds are represented by multiple-di-
mensional molecular descriptors. It is unavoidable to select
a subset of relevant molecular descriptors from a large
amount of data, as it can bring potential benefits: facilitating
data visualization and data understanding, reducing the
measurement and storage requirements, reducing training
and utilization times, defying the curse of dimensionality to
improve prediction performance (Guyon 2003; Feature
Selection Using Sequential Forward Selection and IECON
2010). In this study, a hybrid method named mean impact
value-based sequential forward selection (MIV-based SFS)
was used to complete the task.
This study introduced a hybrid strategy of virtual
screening based on QSAR modeling and molecular dock-
ing to identify novel HDAC8 inhibitors. Two kinds of
QSAR models were developed with support vector classi-
fication (SVC) and regression (SVR) based on the known
HDAC8 inhibitors, which can correctly reflect the struc-
ture–activity relationship (SAR) of the existing HDAC8
inhibitors. Furthermore, the developed QSAR models were
used sequentially as a two-step query for searching large
databases to identify novel HDAC8 inhibitors. Molecular
docking and various scrupulous drug-like properties such
as Lipinski’s rule of five and ADMET (absorption, distri-
bution, metabolism, excretion, and toxicity) properties
were employed to reduce the probability of picking false
positives and nondruglike compounds, respectively.
HDAC8-hit complex stability was evaluated using molec-
ular dynamics (MD) simulation.
Materials and methods
Dataset preparation and selection of compounds
A total of 80 compounds with HDAC8 inhibitory activity
values predicted under same biological assay conditions
were collected from various literature resources including
patents (Durst et al. 2003; Gu and Nusinzon 2006; Wu et al.
2004; Jeffrey MB, Zuomei L, Daniel D, Claire B. Methods
for specifically inhibiting histone-7 and 8. US Patents 2004;
Eric 2007; Walter et al. 2007; Ze-Yi et al. 2008; Joseph and
Sriram 2010). This data set has included 40 inhibitors and 40
non-inhibitor compounds, which was done based on IC50
values of the compounds ranging from 0.008 to 35 lM. The
IC50 values ranging from0.008 to 0.3 lMwere considered as
inhibitors, the others were considered as non-inhibitors.
Selection of training set compounds is pivotal for QSAR
modeling which subsequently determines the quality of the
generated QSAR models. The constraint random sampling
(CRS) method was used to prepare training set. The training
set compounds were selected based on following constraint
criteria: (1) a minimum of 20 compounds were selected to
avoid any chance correlation; (2) the training set should be
balanced; (3) the compounds should be selected to provide
clear, concise information to avoid redundancy or bias in
terms of both structural features and activity range; (4) a part
of themost active compounds should be included to generate
reliable and rationalQSARmodel, and the others can be used
to validate the quality of the QSAR model; (5) all data set
compounds were randomly selected in combination with
above criteria, which would ensure that all the compounds
were selected with an equal probability. The dataset was
finally divided into training and test sets containing 30 and 50
compounds, respectively. The 30 training set compounds
G. P. Cao et al.
123
including 15 inhibitors and 15 non-inhibitors were used in
the development of classification and regression models
(Fig. 1). The test set (25 inhibitors and 25 non-inhibitors)
was used to validate the developed models. All the com-
pounds in the data set were sketched in 2D structures with
Accelrys Draw v4.1 (Accelrys Inc., San Diego, USA) and
subsequently converted into 3D structures with Accelrys
Discovery Studio v3.1 (DS) (Accelrys, San Diego, USA).
Then energy minimization using CHARMM force field
(Brooks et al. 1983), The Smart Minimizer option that per-
forms 1,000 steps of Steepest Descent with a RMS gradient
tolerance of 3, followed by Conjugate Gradient minimiza-
tion was used with a RMS gradient of 0.1 kcal/(mol 9 A).
Molecular descriptors calculation
Molecular descriptors are the final results of a logical and
mathematical procedure which transforms chemical infor-
mation encoded within a symbolic representation of a
molecule into a useful number or the result of some stan-
dardized experiment (Yap 2011; Todeschini and Consonni
2000). To date, though thousands of descriptors can be
calculated, it is only useful in medicinal chemistry per-
spective when they are reduced to a few set of molecular
descriptors that can effectively be applied in designing
novel and potent compounds. Thus the main goal of a
QSAR study is not to calculate thousands of descriptors but
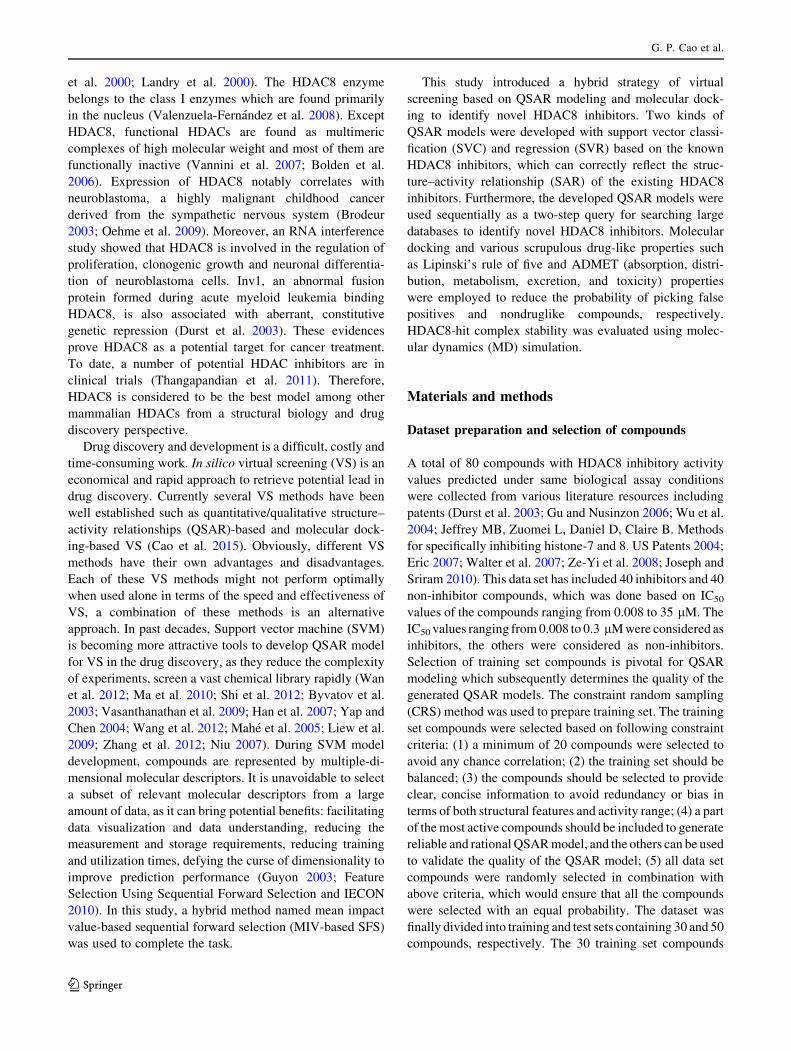
Fig. 1 Chemically diverse 30 compounds used as training set in SVM model generation
QSAR modeling to design selective histone deacetylase 8 (HDAC8) inhibitors
123
to identify a few molecular descriptors. In this study, the
collected inhibitor was represented by 20 molecular
descriptors which were calculated by using ADRIANA.-
Code program (Molecular Networks Inc.), including glo-
bal, shape and size-related descriptors (ADRIANA Code)
(Table 1). Furthermore, the data set were scaled from -1
to 1 by following:
yi ¼xij j � xminj jxmaxj j � xminj j ; i ¼ 1; 2; . . .; n
yi ¼ yi; xi � 0ð Þyi ¼ �yi; xi\0ð Þ
�; i ¼ 1; 2; . . .; n
where xi is a descriptor vector of the sample data, the yi is a
scaling data, which corresponds to xi, | xi | is the absolute
value of the xi, n is the number of compounds.
Development of qualitative structure–activity
relationship (Qualitative SAR) model
Qualitative SAR models are classification models used in
drug discovery, which relate the classifier variables to a
categorical value of the response variable. The Qualitative
SAR models were generated using support vector classifi-
cation (SVC) which was firstly proposed by V. Vapnik in
1995 (Cortes and Vapnik 2011). The whole process of SVC
can be summarized as a two-step procedure: First, the
sample data vectors (descriptors) are mapped to a very high-
dimensional feature space by kernel function. The dimen-
sion of this space is significantly larger than dimension of the
original data space. Second, the SVM classifier finds a
hyperplane with the largest margin in this high-dimensional
feature space with the largest margin separating classes of
data. Sometimes it is not possible to find the hyperlane in
high-dimensional feature space, so a tradeoff is introduced
between the size of the separating margin and penalties for
every vector within the margin (Byvatov et al. 2003).
Development of quantitative structure–activity
relationship (Quantitative SAR) model
Quantitative SAR models are regression models used in
drug discovery, which relate a set of ‘‘predictor’’ variables
to the potency of the response variable. Support vector
regression (SVR) was applied to develop Quantitative SAR
models with training set compounds. Support vector
machine regression is based on the structural risk mini-
mization principle from the statistical learning theory (Niu
2007). It can be used to predict continuous values like IC50
value of ligand by introducing an alternative loss function
and the results appear to be very encouraging. The SVM
(SVC and SVR) calculation was used and executed in the
LIBSVM 3.12 tool (Chang and Lin 2011).
Descriptor selection using MIV-based SFS method
Compound, in QSAR (Qualitative SAR and Quantitative
SAR) studies, is encoded by a variety of molecular descrip-
tors. It must be noted that usually only a subset of the cal-
culated descriptors carries necessary information for
developing a QASR model (Shahlaei 2013). Descriptor
selection is aimed at finding those useful calculated
descriptors for the model building. Here, a hybrid method
namedmean impact value-based sequential forward selection
(MIV-based SFS) was used to accomplish this task.
MIV is firstly used in neural network to measure the
influence of afferent neurons onefferentneurons. In this study,
MIV was used as a measure reflecting the input variable of
developed SVM models to prediction result (Li et al. 2012).
The absolute value represents how strongly the selected
molecular descriptors can affect the predictive ability of SVM
model. The detailed calculation process is described below:
after finishing SVM training, each of independent variable
features (molecular descriptors) from training data P was
increased (P1) and decreased (P2) by 10 % to get two new
training data. P1 and P2 were predicted using the developed
model to get two results A1 and A2. Impact value (IV) is
difference between A1 and A2. Different IVs were obtained
by changing the independent variables. Finally, mean of IVs
(MIV) was calculated for each descriptor.
Sequential forward selection (SFS) is a data-driven
model building approach which selects a most influential
subset of features from the original data set for constructing
a classifier that gives better performance (Guyon 2003;
Haindl et al. 2006). In this approach, one variable is added
to the model at a time. It involves following steps: (1)
Select a classifier and the leave-one-out (LOO) test for
recognition rate estimate; (2) select the first feature that has
the highest LOO recognition rate among all features; (3)
select the feature, among all unselected features, together
with the selected features that gives the highest recognition
rate; (4) repeat the previous process until you have selected
enough number of features or until the recognition rate is
good enough.
MIV-based SFS method selected MIV calculated using
SVM as recognition rate. It begins with a model including
the molecular descriptor with the greatest MIV (absolute
value), and continues adding molecular descriptor to the
model one at a time according to their MIV scores until the
predictions of the QSAR model continue to fall.
Leave-one-out cross validation (LOO CV)
CV is a model validation technique for assessing how the
results of a statistical analysis will generalize to an inde-
pendent data set (Kohavi 1995). LOO CV procedure was
applied to estimate the predictive capability of the
G. P. Cao et al.
123
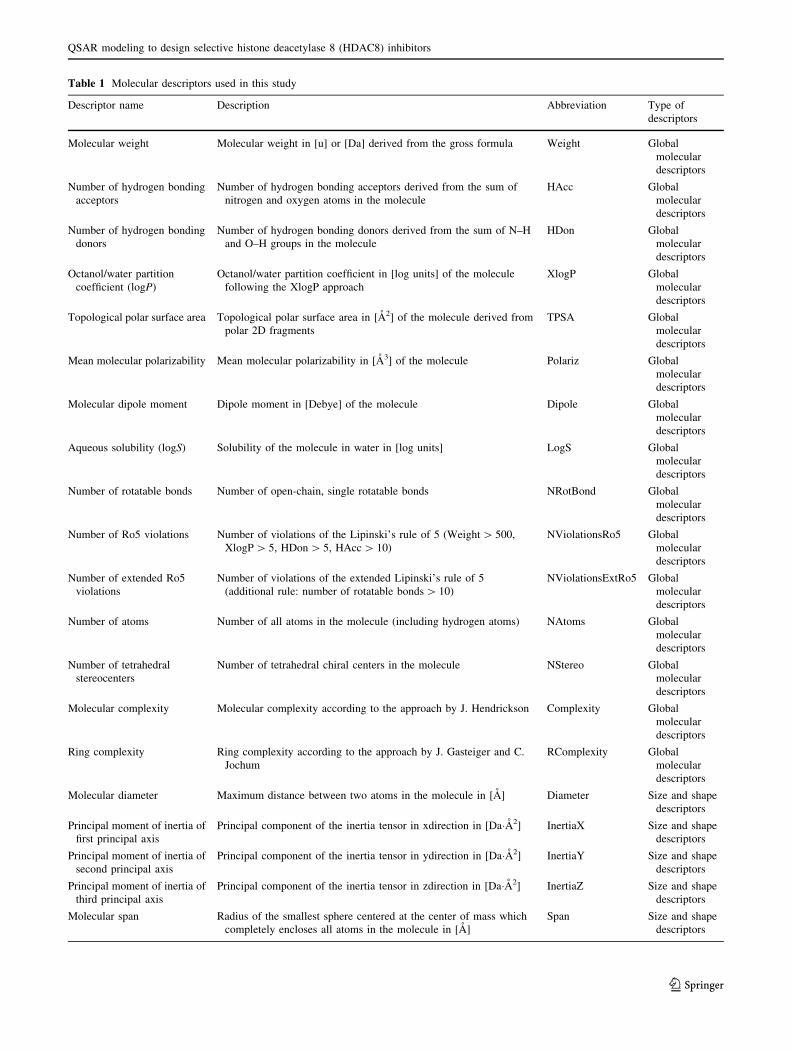
Table 1 Molecular descriptors used in this study
Descriptor name Description Abbreviation Type of
descriptors
Molecular weight Molecular weight in [u] or [Da] derived from the gross formula Weight Global
molecular
descriptors
Number of hydrogen bonding
acceptors
Number of hydrogen bonding acceptors derived from the sum of
nitrogen and oxygen atoms in the molecule
HAcc Global
molecular
descriptors
Number of hydrogen bonding
donors
Number of hydrogen bonding donors derived from the sum of N–H
and O–H groups in the molecule
HDon Global
molecular
descriptors
Octanol/water partition
coefficient (logP)
Octanol/water partition coefficient in [log units] of the molecule
following the XlogP approach
XlogP Global
molecular
descriptors
Topological polar surface area Topological polar surface area in [A2] of the molecule derived from
polar 2D fragments
TPSA Global
molecular
descriptors
Mean molecular polarizability Mean molecular polarizability in [A3] of the molecule Polariz Global
molecular
descriptors
Molecular dipole moment Dipole moment in [Debye] of the molecule Dipole Global
molecular
descriptors
Aqueous solubility (logS) Solubility of the molecule in water in [log units] LogS Global
molecular
descriptors
Number of rotatable bonds Number of open-chain, single rotatable bonds NRotBond Global
molecular
descriptors
Number of Ro5 violations Number of violations of the Lipinski’s rule of 5 (Weight[ 500,
XlogP[ 5, HDon[ 5, HAcc[ 10)
NViolationsRo5 Global
molecular
descriptors
Number of extended Ro5
violations
Number of violations of the extended Lipinski’s rule of 5
(additional rule: number of rotatable bonds[ 10)
NViolationsExtRo5 Global
molecular
descriptors
Number of atoms Number of all atoms in the molecule (including hydrogen atoms) NAtoms Global
molecular
descriptors
Number of tetrahedral
stereocenters
Number of tetrahedral chiral centers in the molecule NStereo Global
molecular
descriptors
Molecular complexity Molecular complexity according to the approach by J. Hendrickson Complexity Global
molecular
descriptors
Ring complexity Ring complexity according to the approach by J. Gasteiger and C.
Jochum
RComplexity Global
molecular
descriptors
Molecular diameter Maximum distance between two atoms in the molecule in [A] Diameter Size and shape
descriptors
Principal moment of inertia of
first principal axis
Principal component of the inertia tensor in xdirection in [Da�A2] InertiaX Size and shape
descriptors
Principal moment of inertia of
second principal axis
Principal component of the inertia tensor in ydirection in [Da�A2] InertiaY Size and shape
descriptors
Principal moment of inertia of
third principal axis
Principal component of the inertia tensor in zdirection in [Da�A2] InertiaZ Size and shape
descriptors
Molecular span Radius of the smallest sphere centered at the center of mass which
completely encloses all atoms in the molecule in [A]
Span Size and shape
descriptors
QSAR modeling to design selective histone deacetylase 8 (HDAC8) inhibitors
123
developed QSAR models. In LOO CV process, a single
compound from the data set was used as the test data, and
the remaining compounds as the training data. This was
repeated such that each sample in the data set is used once
as the test data. The results were averaged as output of
LOO CV.
Receiver operating characteristic (ROC) curve
A ROC curve is a metric which illustrates the performance
of a binary classifier system as its discrimination threshold
is varied. It is a comparison of two operating characteristics
(TPR and FPR) as the criterion changes (Fawcelt 2006).
For each class of a classifier, ROC applies threshold values
across the interval [0, 1] to outputs. For each threshold, two
values, TPR and FPR, are calculated. And the accuracy of
classifier is measured by the area under the ROC curve
(AUC). An area of 1 represents a perfect test; an area of 0.5
represents a worthless test. In this study, ROC curve was
used to validate the accuracy of SVC model.
Grid search (GS) method
During the development of SVM modeling, a difficult issue
is how to set good parameters of SVM. It is not known
beforehand which parameters are best. Thus, parameter
search must be done. In this stud, GS was utilized for
parameter optimization. GS is straight forward but pow-
erful method, which is exhaustive searching through a
subset of the parameter space of a learning algorithm to
solve problem of model selection and parameter opti-
mization. A grid search method must be guided by some
performance metric, typically measured by CV on the
training set, i.e., LOO CV used in this study.
Evaluation of prediction performance
The predictive abilities from SVC and SVR were evaluated
using following statistical measures. In following equations,
TP is the number of true positives, TN true negatives, FP
false positives, and FN false negatives, n is the number of the
samples in data set, f(xi) is the predicted biological activity,
and yi is the experimental biological activity. In this study,
HDAC8 inhibitors were considered as ‘positive set’ and the
non-inhibitors were considered ‘negative set’. The accuracy
(ACC) is the degree of closeness of measurements of a
quantity to that quantity’s actual (true) value. The Matthews
correlation coefficient (MCC) is a measure of quality of
binary classification, and it returns a value between -1 and
?1. A coefficient of ?1 stands for a perfect prediction, 0
represents a random prediction and -1 indicates total dis-
agreement between prediction and observation. The true
positive rate (TPR or Recall rate) is a metric of retrieved
instances that are relevant. The false positive rate (FPR)
measures the proportion of actual positives which are
incorrectly identified. Therefore TPR and FPR are based on
an understanding and measure of relevance. The root-mean-
square error (RMSE) is a frequently used measure of the
differences between values predicted by a model or an
estimator and the values actually observed. The squared
correlation coefficient (r2) is the predictive percent of
behavior in the output that can be explained by the input.
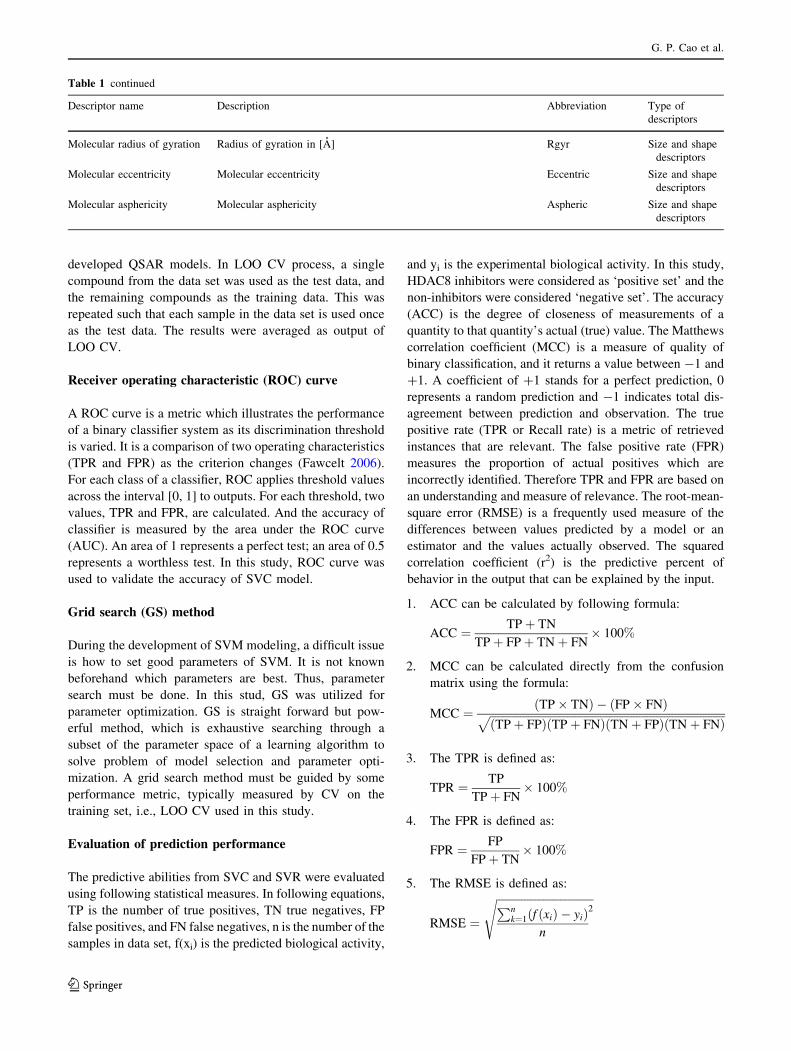
1. ACC can be calculated by following formula:
ACC ¼ TPþ TN
TPþ FPþ TNþ FN� 100%
2. MCC can be calculated directly from the confusion
matrix using the formula:
MCC ¼ TP� TNð Þ � ðFP� FNÞffiffiffiffiffiffiffiffiffiffiffiffiffiffiffiffiffiffiffiffiffiffiffiffiffiffiffiffiffiffiffiffiffiffiffiffiffiffiffiffiffiffiffiffiffiffiffiffiffiffiffiffiffiffiffiffiffiffiffiffiffiffiffiffiffiffiffiffiffiffiffiffiffiffiffiffiffiffiffiffiffiffiffiffiffiðTPþ FPÞðTPþ FNÞðTNþ FPÞðTNþ FNÞ
p
3. The TPR is defined as:
TPR ¼ TP
TPþ FN� 100%
4. The FPR is defined as:
FPR ¼ FP
FPþ TN� 100%
5. The RMSE is defined as:
RMSE ¼
ffiffiffiffiffiffiffiffiffiffiffiffiffiffiffiffiffiffiffiffiffiffiffiffiffiffiffiffiffiffiffiffiffiffiffiPnk¼1 f ðxiÞ � yið Þ
n
2
s
Table 1 continued
Descriptor name Description Abbreviation Type of
descriptors
Molecular radius of gyration Radius of gyration in [A] Rgyr Size and shape
descriptors
Molecular eccentricity Molecular eccentricity Eccentric Size and shape
descriptors
Molecular asphericity Molecular asphericity Aspheric Size and shape
descriptors
G. P. Cao et al.
123
6. The r2 is defined as:
r2 ¼nPn
k¼1 f xið Þyi �Pn
k¼1 f xið ÞPn
k¼1 yi� �2
nPn
k¼1 f xið Þ2�Pn
k¼1 f xið Þ2� �� �
nPn
k¼1 y2i �
Pnk¼1 yi
� �2� �
Drug-like chemical database preparation
and virtual screening
Virtual screening is a computational technique used in drug
discovery research to search large database in order to
identify novel small molecules which are most likely to bind
to a drug target. The developed models were used as a two-
step query to screen Maybridge database. Maybridge, a
commercial chemical database containing 59,652 com-
pounds, was employed in this study for structure-based
virtual screening procedure (Maybridge). However, this
database is found to have a number of non-drug-like com-
pounds. It is worthless to screen all the compounds of these
databases and then eliminate them in the later phase for their
non-drug-like properties. Therefore, compounds not satis-
fying drug-like properties were excluded from the databases
prior to SVM-based virtual screening. In order to accom-
plish this task, compounds in this database were subjected to
various scrupulous drug-like filters such as Lipinski’s rule of
five and ADMET (absorption, distribution, metabolism,
excretion, and toxicity) properties. ADMET was applied to
check whether the compounds are able to cross the blood–
brain barrier (BBB) and have good solubility, human
intestinal absorption (HIA), and low toxicity. Here, we
mainly focused on oral bioavailability, low or no hepato-
toxicity, and the capacity to penetrate the BBB, which is a
key decision filter for central nervous system drug discov-
ery. The compounds that satisfied the abovementioned
properties were selected for molecular docking studies.
Lipinski’s rule of 5 states that clogP B 5, molecular
weight B 500, and number of hydrogen bond accep-
tors B 10 and donors B 5. Compounds violating more than
one of these rules may have problems with bioavailability.
Therefore these parameters were calculated by Prepare
Ligands and ADMET Descriptors protocols as available in
DS v3.1 software to eliminate compounds that did not pass
the above criterias. After preparation of drug-like database,
the generated models were subjected to screening of this
drug-like database. The retrieved hit compounds were fur-
ther subjected to molecular docking process.
Structure-based molecular docking
Molecular docking is a potent method in drug discovery
process, which predicts the preferred orientation of one
molecule to a second when bound to each other to form a
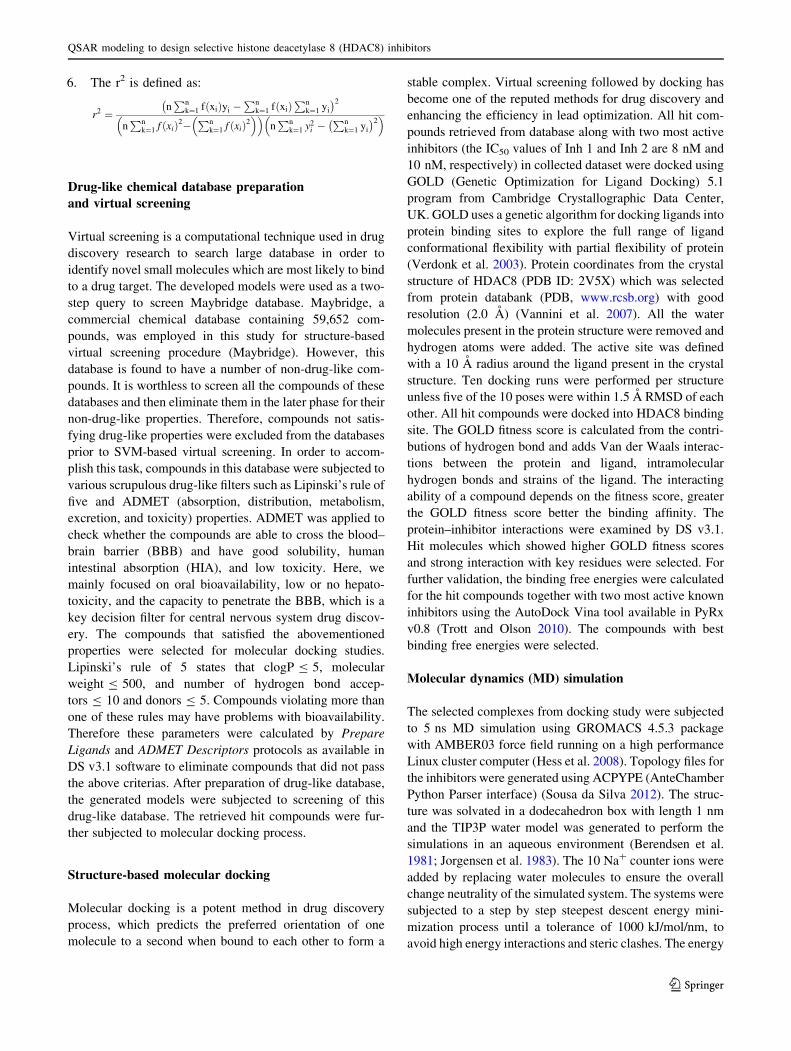
stable complex. Virtual screening followed by docking has
become one of the reputed methods for drug discovery and
enhancing the efficiency in lead optimization. All hit com-
pounds retrieved from database along with two most active
inhibitors (the IC50 values of Inh 1 and Inh 2 are 8 nM and
10 nM, respectively) in collected dataset were docked using
GOLD (Genetic Optimization for Ligand Docking) 5.1
program from Cambridge Crystallographic Data Center,
UK. GOLD uses a genetic algorithm for docking ligands into
protein binding sites to explore the full range of ligand
conformational flexibility with partial flexibility of protein
(Verdonk et al. 2003). Protein coordinates from the crystal
structure of HDAC8 (PDB ID: 2V5X) which was selected
from protein databank (PDB, www.rcsb.org) with good
resolution (2.0 A) (Vannini et al. 2007). All the water
molecules present in the protein structure were removed and
hydrogen atoms were added. The active site was defined
with a 10 A radius around the ligand present in the crystal
structure. Ten docking runs were performed per structure
unless five of the 10 poses were within 1.5 A RMSD of each
other. All hit compounds were docked into HDAC8 binding
site. The GOLD fitness score is calculated from the contri-
butions of hydrogen bond and adds Van der Waals interac-
tions between the protein and ligand, intramolecular
hydrogen bonds and strains of the ligand. The interacting
ability of a compound depends on the fitness score, greater
the GOLD fitness score better the binding affinity. The
protein–inhibitor interactions were examined by DS v3.1.
Hit molecules which showed higher GOLD fitness scores
and strong interaction with key residues were selected. For
further validation, the binding free energies were calculated
for the hit compounds together with two most active known
inhibitors using the AutoDock Vina tool available in PyRx
v0.8 (Trott and Olson 2010). The compounds with best
binding free energies were selected.
Molecular dynamics (MD) simulation
The selected complexes from docking study were subjected
to 5 ns MD simulation using GROMACS 4.5.3 package
with AMBER03 force field running on a high performance
Linux cluster computer (Hess et al. 2008). Topology files for
the inhibitors were generated using ACPYPE (AnteChamber
Python Parser interface) (Sousa da Silva 2012). The struc-
ture was solvated in a dodecahedron box with length 1 nm
and the TIP3P water model was generated to perform the
simulations in an aqueous environment (Berendsen et al.
1981; Jorgensen et al. 1983). The 10 Na? counter ions were
added by replacing water molecules to ensure the overall
change neutrality of the simulated system. The systems were
subjected to a step by step steepest descent energy mini-
mization process until a tolerance of 1000 kJ/mol/nm, to
avoid high energy interactions and steric clashes. The energy
QSAR modeling to design selective histone deacetylase 8 (HDAC8) inhibitors
123
minimized system was treated for 100 ps in an equilibration
run. A constant temperature and pressure of 300 K and 1 bar
were achieved with the V-rescale thermostat and Parrinello–
Rahman barostat (Bussi et al. 2007; Parrinello and Rahman
1981). The particle mesh Ewald (PME) method was applied
to accurately determine the long-range electrostatic inter-
actions (Essmann et al. 1995). Bonds between heavy metals
and corresponding hydrogen atoms were constrained to their
equilibrium bond lengths using the LINCS21 algorithm
(Hess et al. 1997). The time step for the simulations was set
to 2 fs and the coordinate data were written to the file every
10 ps. All the analyses of the MD simulations were carried
out by GROMACS and DS v3.1 software.
Results and discussion
Strategy for screening novel HDAC8 inhibitors
Virtual screening is a useful computational technique for
drug design as it is a cost-effective and time saving pro-
cess. Virtual screening methods can be divided into two
broad categories: structure-based and ligand-based meth-
ods. To date, the three-dimensional (3D) structure of
HDAC8 as a target receptor and its binding sites are
available. Molecular docking is a highly effective struc-
ture-based technique for screening HDAC8 inhibitors. A
set of active inhibitors are available, and it is possible to
compute their shared information. Keeping this in view, an
innovative hybrid strategy integrating structure-based and
ligand-based approaches to identify novel HDAC8 inhibi-
tors is presented in this study.
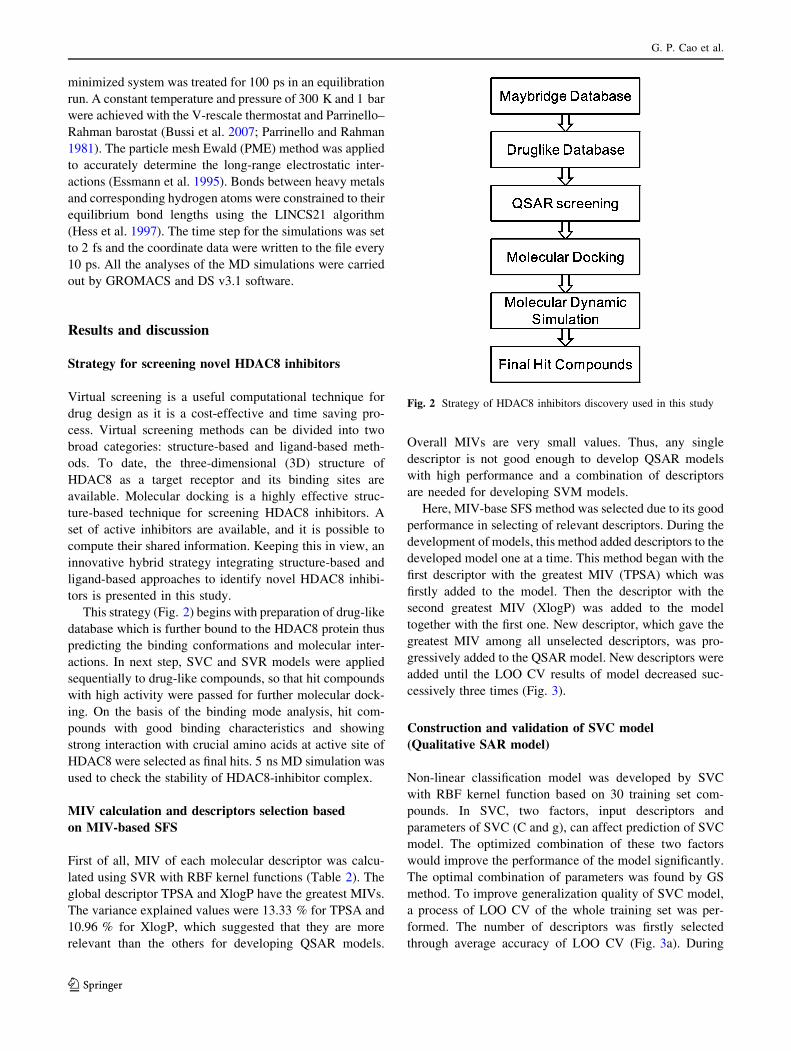
This strategy (Fig. 2) begins with preparation of drug-like
database which is further bound to the HDAC8 protein thus
predicting the binding conformations and molecular inter-
actions. In next step, SVC and SVR models were applied
sequentially to drug-like compounds, so that hit compounds
with high activity were passed for further molecular dock-
ing. On the basis of the binding mode analysis, hit com-
pounds with good binding characteristics and showing
strong interaction with crucial amino acids at active site of
HDAC8 were selected as final hits. 5 ns MD simulation was
used to check the stability of HDAC8-inhibitor complex.
MIV calculation and descriptors selection based
on MIV-based SFS
First of all, MIV of each molecular descriptor was calcu-
lated using SVR with RBF kernel functions (Table 2). The
global descriptor TPSA and XlogP have the greatest MIVs.
The variance explained values were 13.33 % for TPSA and
10.96 % for XlogP, which suggested that they are more
relevant than the others for developing QSAR models.
Overall MIVs are very small values. Thus, any single
descriptor is not good enough to develop QSAR models
with high performance and a combination of descriptors
are needed for developing SVM models.
Here, MIV-base SFS method was selected due to its good
performance in selecting of relevant descriptors. During the
development of models, this method added descriptors to the
developed model one at a time. This method began with the
first descriptor with the greatest MIV (TPSA) which was
firstly added to the model. Then the descriptor with the
second greatest MIV (XlogP) was added to the model
together with the first one. New descriptor, which gave the
greatest MIV among all unselected descriptors, was pro-
gressively added to the QSAR model. New descriptors were
added until the LOO CV results of model decreased suc-
cessively three times (Fig. 3).
Construction and validation of SVC model
(Qualitative SAR model)
Non-linear classification model was developed by SVC
with RBF kernel function based on 30 training set com-
pounds. In SVC, two factors, input descriptors and
parameters of SVC (C and g), can affect prediction of SVC
model. The optimized combination of these two factors
would improve the performance of the model significantly.
The optimal combination of parameters was found by GS
method. To improve generalization quality of SVC model,
a process of LOO CV of the whole training set was per-
formed. The number of descriptors was firstly selected
through average accuracy of LOO CV (Fig. 3a). During
Fig. 2 Strategy of HDAC8 inhibitors discovery used in this study
G. P. Cao et al.
123
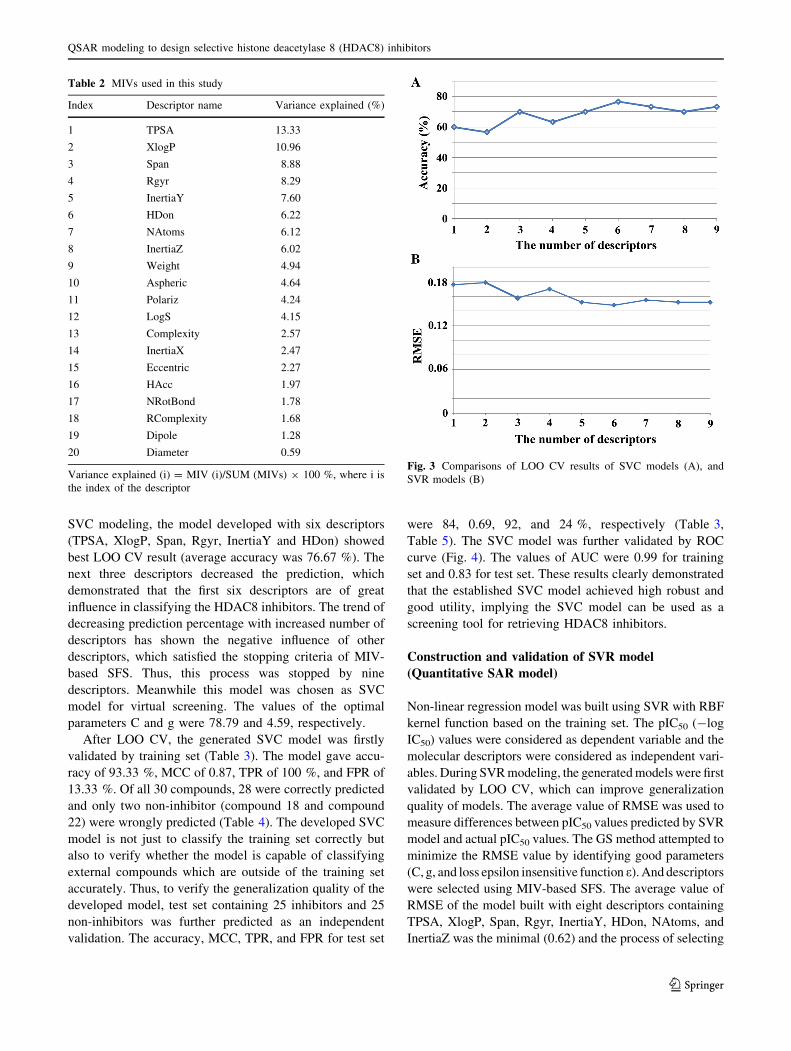
SVC modeling, the model developed with six descriptors
(TPSA, XlogP, Span, Rgyr, InertiaY and HDon) showed
best LOO CV result (average accuracy was 76.67 %). The
next three descriptors decreased the prediction, which
demonstrated that the first six descriptors are of great
influence in classifying the HDAC8 inhibitors. The trend of
decreasing prediction percentage with increased number of
descriptors has shown the negative influence of other
descriptors, which satisfied the stopping criteria of MIV-
based SFS. Thus, this process was stopped by nine
descriptors. Meanwhile this model was chosen as SVC
model for virtual screening. The values of the optimal
parameters C and g were 78.79 and 4.59, respectively.
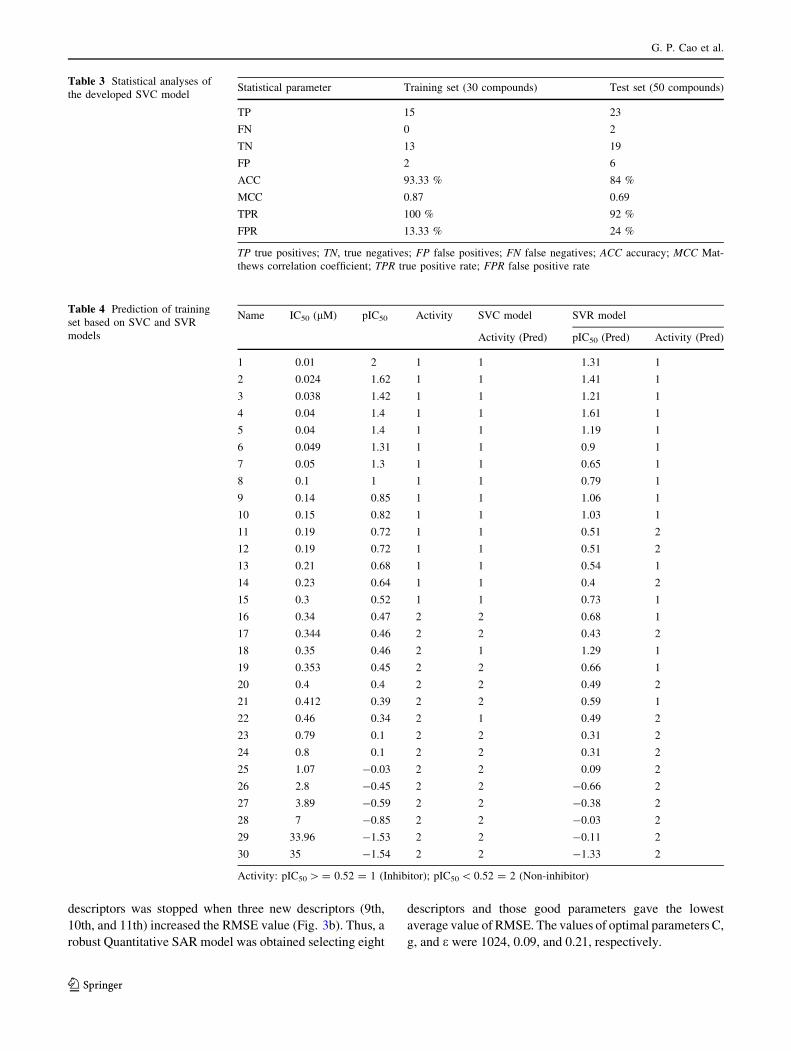
After LOO CV, the generated SVC model was firstly
validated by training set (Table 3). The model gave accu-
racy of 93.33 %, MCC of 0.87, TPR of 100 %, and FPR of
13.33 %. Of all 30 compounds, 28 were correctly predicted
and only two non-inhibitor (compound 18 and compound
22) were wrongly predicted (Table 4). The developed SVC
model is not just to classify the training set correctly but
also to verify whether the model is capable of classifying
external compounds which are outside of the training set
accurately. Thus, to verify the generalization quality of the
developed model, test set containing 25 inhibitors and 25
non-inhibitors was further predicted as an independent
validation. The accuracy, MCC, TPR, and FPR for test set
were 84, 0.69, 92, and 24 %, respectively (Table 3,
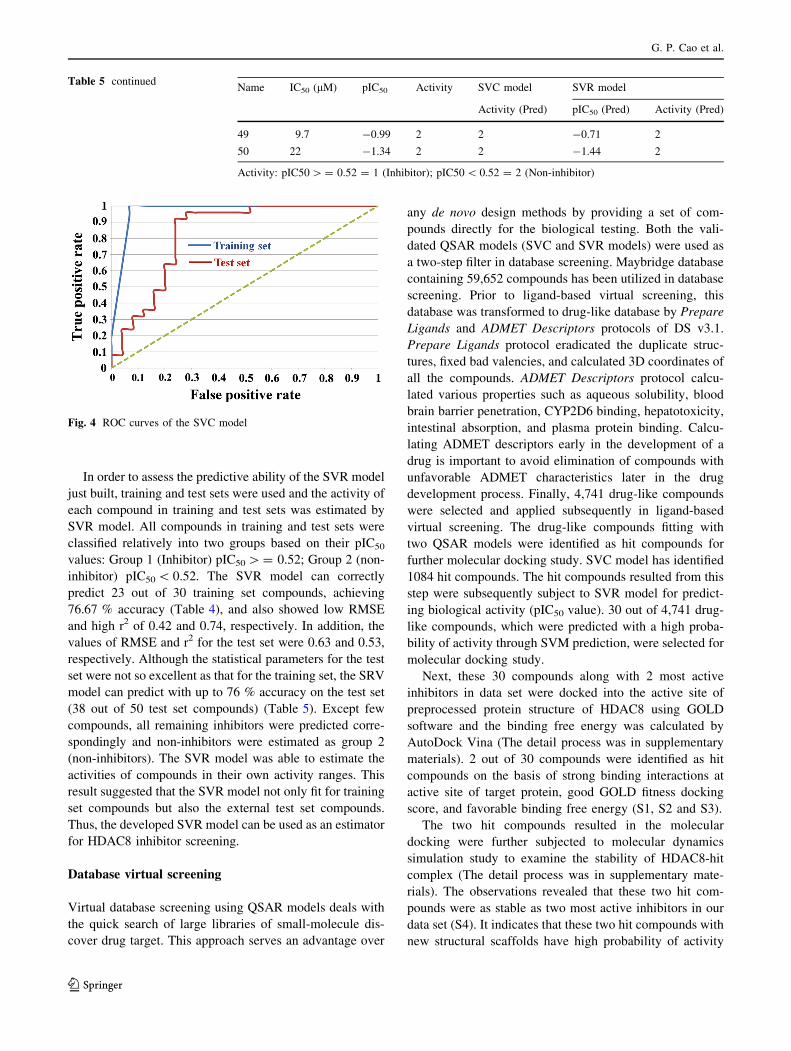
Table 5). The SVC model was further validated by ROC
curve (Fig. 4). The values of AUC were 0.99 for training
set and 0.83 for test set. These results clearly demonstrated
that the established SVC model achieved high robust and
good utility, implying the SVC model can be used as a
screening tool for retrieving HDAC8 inhibitors.
Construction and validation of SVR model
(Quantitative SAR model)
Non-linear regression model was built using SVR with RBF
kernel function based on the training set. The pIC50 (-log
IC50) values were considered as dependent variable and the
molecular descriptors were considered as independent vari-
ables. During SVRmodeling, the generatedmodels were first
validated by LOO CV, which can improve generalization
quality of models. The average value of RMSE was used to
measure differences between pIC50 values predicted by SVR
model and actual pIC50 values. The GS method attempted to
minimize the RMSE value by identifying good parameters
(C, g, and loss epsilon insensitive function e).And descriptorswere selected using MIV-based SFS. The average value of
RMSE of the model built with eight descriptors containing
TPSA, XlogP, Span, Rgyr, InertiaY, HDon, NAtoms, and
InertiaZ was the minimal (0.62) and the process of selecting
Table 2 MIVs used in this study
Index Descriptor name Variance explained (%)
1 TPSA 13.33
2 XlogP 10.96
3 Span 8.88
4 Rgyr 8.29
5 InertiaY 7.60
6 HDon 6.22
7 NAtoms 6.12
8 InertiaZ 6.02
9 Weight 4.94
10 Aspheric 4.64
11 Polariz 4.24
12 LogS 4.15
13 Complexity 2.57
14 InertiaX 2.47
15 Eccentric 2.27
16 HAcc 1.97
17 NRotBond 1.78
18 RComplexity 1.68
19 Dipole 1.28
20 Diameter 0.59
Variance explained (i) = MIV (i)/SUM (MIVs) 9 100 %, where i is
the index of the descriptor
Fig. 3 Comparisons of LOO CV results of SVC models (A), and
SVR models (B)
QSAR modeling to design selective histone deacetylase 8 (HDAC8) inhibitors
123
descriptors was stopped when three new descriptors (9th,
10th, and 11th) increased the RMSE value (Fig. 3b). Thus, a
robust Quantitative SAR model was obtained selecting eight
descriptors and those good parameters gave the lowest
average value of RMSE. The values of optimal parameters C,
g, and e were 1024, 0.09, and 0.21, respectively.
Table 3 Statistical analyses of
the developed SVC modelStatistical parameter Training set (30 compounds) Test set (50 compounds)
TP 15 23
FN 0 2
TN 13 19
FP 2 6
ACC 93.33 % 84 %
MCC 0.87 0.69
TPR 100 % 92 %
FPR 13.33 % 24 %
TP true positives; TN, true negatives; FP false positives; FN false negatives; ACC accuracy; MCC Mat-
thews correlation coefficient; TPR true positive rate; FPR false positive rate
Table 4 Prediction of training
set based on SVC and SVR
models
Name IC50 (lM) pIC50 Activity SVC model SVR model
Activity (Pred) pIC50 (Pred) Activity (Pred)
1 0.01 2 1 1 1.31 1
2 0.024 1.62 1 1 1.41 1
3 0.038 1.42 1 1 1.21 1
4 0.04 1.4 1 1 1.61 1
5 0.04 1.4 1 1 1.19 1
6 0.049 1.31 1 1 0.9 1
7 0.05 1.3 1 1 0.65 1
8 0.1 1 1 1 0.79 1
9 0.14 0.85 1 1 1.06 1
10 0.15 0.82 1 1 1.03 1
11 0.19 0.72 1 1 0.51 2
12 0.19 0.72 1 1 0.51 2
13 0.21 0.68 1 1 0.54 1
14 0.23 0.64 1 1 0.4 2
15 0.3 0.52 1 1 0.73 1
16 0.34 0.47 2 2 0.68 1
17 0.344 0.46 2 2 0.43 2
18 0.35 0.46 2 1 1.29 1
19 0.353 0.45 2 2 0.66 1
20 0.4 0.4 2 2 0.49 2
21 0.412 0.39 2 2 0.59 1
22 0.46 0.34 2 1 0.49 2
23 0.79 0.1 2 2 0.31 2
24 0.8 0.1 2 2 0.31 2
25 1.07 -0.03 2 2 0.09 2
26 2.8 -0.45 2 2 -0.66 2
27 3.89 -0.59 2 2 -0.38 2
28 7 -0.85 2 2 -0.03 2
29 33.96 -1.53 2 2 -0.11 2
30 35 -1.54 2 2 -1.33 2
Activity: pIC50[= 0.52 = 1 (Inhibitor); pIC50\ 0.52 = 2 (Non-inhibitor)
G. P. Cao et al.
123
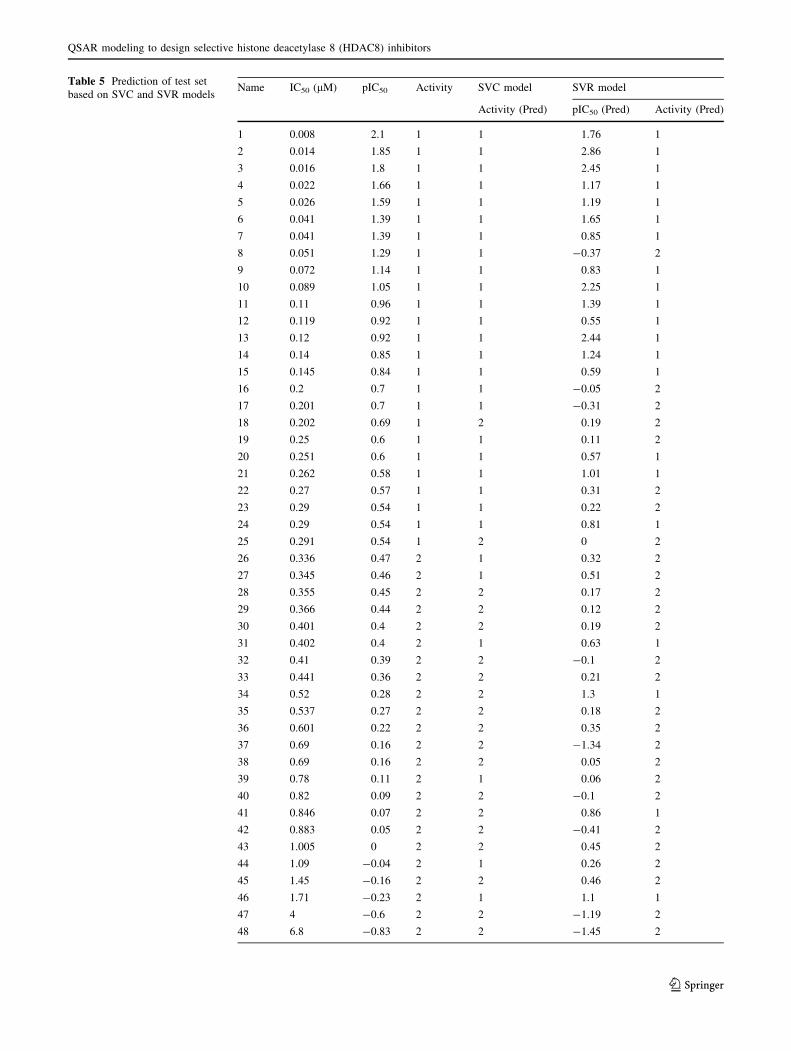
Table 5 Prediction of test set
based on SVC and SVR modelsName IC50 (lM) pIC50 Activity SVC model SVR model
Activity (Pred) pIC50 (Pred) Activity (Pred)
1 0.008 2.1 1 1 1.76 1
2 0.014 1.85 1 1 2.86 1
3 0.016 1.8 1 1 2.45 1
4 0.022 1.66 1 1 1.17 1
5 0.026 1.59 1 1 1.19 1
6 0.041 1.39 1 1 1.65 1
7 0.041 1.39 1 1 0.85 1
8 0.051 1.29 1 1 -0.37 2
9 0.072 1.14 1 1 0.83 1
10 0.089 1.05 1 1 2.25 1
11 0.11 0.96 1 1 1.39 1
12 0.119 0.92 1 1 0.55 1
13 0.12 0.92 1 1 2.44 1
14 0.14 0.85 1 1 1.24 1
15 0.145 0.84 1 1 0.59 1
16 0.2 0.7 1 1 -0.05 2
17 0.201 0.7 1 1 -0.31 2
18 0.202 0.69 1 2 0.19 2
19 0.25 0.6 1 1 0.11 2
20 0.251 0.6 1 1 0.57 1
21 0.262 0.58 1 1 1.01 1
22 0.27 0.57 1 1 0.31 2
23 0.29 0.54 1 1 0.22 2
24 0.29 0.54 1 1 0.81 1
25 0.291 0.54 1 2 0 2
26 0.336 0.47 2 1 0.32 2
27 0.345 0.46 2 1 0.51 2
28 0.355 0.45 2 2 0.17 2
29 0.366 0.44 2 2 0.12 2
30 0.401 0.4 2 2 0.19 2
31 0.402 0.4 2 1 0.63 1
32 0.41 0.39 2 2 -0.1 2
33 0.441 0.36 2 2 0.21 2
34 0.52 0.28 2 2 1.3 1
35 0.537 0.27 2 2 0.18 2
36 0.601 0.22 2 2 0.35 2
37 0.69 0.16 2 2 -1.34 2
38 0.69 0.16 2 2 0.05 2
39 0.78 0.11 2 1 0.06 2
40 0.82 0.09 2 2 -0.1 2
41 0.846 0.07 2 2 0.86 1
42 0.883 0.05 2 2 -0.41 2
43 1.005 0 2 2 0.45 2
44 1.09 -0.04 2 1 0.26 2
45 1.45 -0.16 2 2 0.46 2
46 1.71 -0.23 2 1 1.1 1
47 4 -0.6 2 2 -1.19 2
48 6.8 -0.83 2 2 -1.45 2
QSAR modeling to design selective histone deacetylase 8 (HDAC8) inhibitors
123
In order to assess the predictive ability of the SVR model
just built, training and test sets were used and the activity of
each compound in training and test sets was estimated by
SVR model. All compounds in training and test sets were
classified relatively into two groups based on their pIC50
values: Group 1 (Inhibitor) pIC50[= 0.52; Group 2 (non-
inhibitor) pIC50\ 0.52. The SVR model can correctly
predict 23 out of 30 training set compounds, achieving
76.67 % accuracy (Table 4), and also showed low RMSE
and high r2 of 0.42 and 0.74, respectively. In addition, the
values of RMSE and r2 for the test set were 0.63 and 0.53,
respectively. Although the statistical parameters for the test
set were not so excellent as that for the training set, the SRV
model can predict with up to 76 % accuracy on the test set
(38 out of 50 test set compounds) (Table 5). Except few
compounds, all remaining inhibitors were predicted corre-
spondingly and non-inhibitors were estimated as group 2
(non-inhibitors). The SVR model was able to estimate the
activities of compounds in their own activity ranges. This
result suggested that the SVR model not only fit for training
set compounds but also the external test set compounds.
Thus, the developed SVR model can be used as an estimator
for HDAC8 inhibitor screening.
Database virtual screening
Virtual database screening using QSAR models deals with
the quick search of large libraries of small-molecule dis-
cover drug target. This approach serves an advantage over
any de novo design methods by providing a set of com-
pounds directly for the biological testing. Both the vali-
dated QSAR models (SVC and SVR models) were used as
a two-step filter in database screening. Maybridge database
containing 59,652 compounds has been utilized in database
screening. Prior to ligand-based virtual screening, this
database was transformed to drug-like database by Prepare
Ligands and ADMET Descriptors protocols of DS v3.1.
Prepare Ligands protocol eradicated the duplicate struc-
tures, fixed bad valencies, and calculated 3D coordinates of
all the compounds. ADMET Descriptors protocol calcu-
lated various properties such as aqueous solubility, blood
brain barrier penetration, CYP2D6 binding, hepatotoxicity,
intestinal absorption, and plasma protein binding. Calcu-
lating ADMET descriptors early in the development of a
drug is important to avoid elimination of compounds with
unfavorable ADMET characteristics later in the drug
development process. Finally, 4,741 drug-like compounds
were selected and applied subsequently in ligand-based
virtual screening. The drug-like compounds fitting with
two QSAR models were identified as hit compounds for
further molecular docking study. SVC model has identified
1084 hit compounds. The hit compounds resulted from this
step were subsequently subject to SVR model for predict-
ing biological activity (pIC50 value). 30 out of 4,741 drug-
like compounds, which were predicted with a high proba-
bility of activity through SVM prediction, were selected for
molecular docking study.
Next, these 30 compounds along with 2 most active
inhibitors in data set were docked into the active site of
preprocessed protein structure of HDAC8 using GOLD
software and the binding free energy was calculated by
AutoDock Vina (The detail process was in supplementary
materials). 2 out of 30 compounds were identified as hit
compounds on the basis of strong binding interactions at
active site of target protein, good GOLD fitness docking
score, and favorable binding free energy (S1, S2 and S3).
The two hit compounds resulted in the molecular
docking were further subjected to molecular dynamics
simulation study to examine the stability of HDAC8-hit
complex (The detail process was in supplementary mate-
rials). The observations revealed that these two hit com-
pounds were as stable as two most active inhibitors in our
data set (S4). It indicates that these two hit compounds with
new structural scaffolds have high probability of activity
Fig. 4 ROC curves of the SVC model
Table 5 continuedName IC50 (lM) pIC50 Activity SVC model SVR model
Activity (Pred) pIC50 (Pred) Activity (Pred)
49 9.7 -0.99 2 2 -0.71 2
50 22 -1.34 2 2 -1.44 2
Activity: pIC50[= 0.52 = 1 (Inhibitor); pIC50\ 0.52 = 2 (Non-inhibitor)
G. P. Cao et al.
123
and can be reasonably used for further in vitro and in vivo
biological activity analyses.
In this day and age, the discovery of novel chemical
entities is becoming increasingly difficult, costly and time-
consuming, medicinal chemists have always struggled with
the difficult problem of identifying the compounds with a
high probability of activity from thousands or millions of
possible molecules. Virtual screening allows chemists to
reduce a huge virtual library to a more manageable size. In
this study, we discussed and reported the SVM-based
QSAR modeling approach in combination with molecular
docking and molecular dynamics simulation, which would
facilitate discovery of new structural scaffolds of HDAC8.
This study showed that SVM is a very powerful QSAR
modeling technique to ligand-based virtual screening.
Besides that, the two hit compounds were identified in this
study as new structural scaffolds for HDAC8 inhibitors,
and can be reasonably selected for testing biological
activity by in vitro and in vivo analyses. Even if these two
new structural scaffolds are not HDAC8 inhibitors until
validate their actual biological activity, they are still
interesting and useful for the further HDAC8-based drug
design and the chemists who devoted themselves to dis-
covery of HDAC8 inhibitors.
Conclusion
In this study, a hybrid protocol of virtual screening method
based on two QSAR models and molecular docking was
utilized to discover potential HDAC8 inhibitors. As the
first step, a druglike database based on Maybridge was
prepared. From results of QSAR-based virtual screening, 2
final hits were selected according to their binding charac-
teristics and interactions with crucial amino acids. Subse-
quently, 5 ns MD simulation was used to check their
complex stability.
This study further suggested that combination of SVC
and SVR has the capacity to rapidly discover potential
HDAC8 inhibitors and MIV-based SFS method is a useful
descriptor selection routine for developing SVM model. On
the whole, two final hits can be used as potential HDAC8
inhibitors for further in vivo studies. The developed models
could be a fast and effective tool to assist discovery of
novel HDAC8 inhibitors. The strategy used in this study
could be a promising computational approach and may be
generally applicable to other target drug designs.
Acknowledgments This research was supported by a grant from
Marine Biotechnology Program (PJT200671) Funded by Ministry of
Oceans and Fisheries, Korea. And this work was also supported by the
Next-Generation BioGreen 21 Program (PJ01106202) from Rural
Development Administration (RDA) of Republic of Korea.
Compliance with ethical standards
Conflict of interest The authors confirm that this article content has
no conflicts of interest.
References
ADRIANA.Code (2004) Molecular Networks Inc. Available from:
www.molecular-networks.com
Berendsen HJC, Postma JPM, Van Gunsteren WF, Hermans J (1981)
Interaction models for water in relation to protein hydration.
Intermol forces 11:331–342
Bolden JE, Peart MJ, Johnstone RW (2006) Anticancer activities of
histone deacetylase inhibitors. Nat Rev Drug Discov 5:769–784
Brodeur GM (2003) Neuroblastoma: biological insights into a clinical
enigma. Nat Rev Cancer 3:203–216
Brooks BR, Bruccoleri RE, Olafson BD, States DJ, Swaminathan S,
Karplus M (1983) CHARMM: a program for macromolecular
energy, minimization, and dynamics calculations. J Comput
Chem 4:187–217
Bussi G, Donadio D, Parrinello M (2007) Canonical sampling through
velocity rescaling. J Chem Phys 126:014101
Byvatov E, Fechner U, Sadowski J, Schneider G (2003) Comparison
of support vector and artificial neural network system for drug/
nondrug classification. J Chem Inf Comput Sci 43:1882–1889
Cao GP, Arooj M, Thangapandian S, Park C, Arulalapperumal V,
Kim Y, Kwon YJ, Kim HH, Suh JK, Lee KW (2015) A lazy
learning-based QSAR classification study for screening potential
histone deacetylase 8 (HDAC8) inhibitors. SAR QSAR Environ
Res 26:397–420
Chang CC, Lin CJ (2011) LIBSVM: a library for support vector
machines. ACM Trans Intell Syst Technol 2:1–27
Cortes C, Vapnik V (2011) Support-vector networks. Mach Learn
20:273–297
Durst KL, Lutterbach B, Kummalue T, Friedman AD, Hiebert SW
(2003) The inv(16) fusion protein associates with corepressors
via a smooth muscle myosin heavy-chain domain. Mol Cell Biol
23:607–619
Emiliani S, Fischle W, Van Lint C, Al-Abed Y, Verdin E (1998)
Characterization of a human RPD3 ortholog, HDAC3. Proc Natl
Acad Sci 95:2795–2800
Dizhong C, Weiping D, Kand S, Hong YS, Eric, TS, Niefang Y, Yong
Z (2007) Benzimidazole derivatives: preparation and pharma-
ceutical applications. US Patents 2007/0043043 A1, 22 Feb 2007
Essmann U, Perera L, Berkowitz ML, Darden T, Lee H, Pedersen LG
(1995) A smooth particle mesh Ewald method. J Chem Phys
103:8577–8593
Fawcelt T (2006) An Introduction to ROC Analysis. Pattern Recogn
Lett 27:861–874
Gu W, Nusinzon I (2006) Smith RDJr, Horvath CM, Silverman, RB.
Carbonyl-sulfurcontaining analogs of suberoylanilide hydroxam-
ic acid: potent inhibition of histone deacetylases. Bioorg Med
Chem 14:3320–3329
Guyon I (2003) An introduction to variable and feature selection.
J Mach Learn Res 3:1157–1182
Haindl M, Somol P, Ververidis D, Kotropoulos C (2006) Feature
selection based on mutual correlation. Progress in pattern
recognition, image analysis and applications. Springer, Berlin,
pp 569–577
Han LY, Zheng CJ, Xie B, Jia J, Ma XH, Zhu F, Lin HH, Chen X,
Chen YZ (2007) Support vector machines approach for predict-
ing druggable proteins: recent progress in its exploration and
investigation of its usefulness. Drug Discovery Today 12:7–8
QSAR modeling to design selective histone deacetylase 8 (HDAC8) inhibitors
123
Hess B, Bekker H, Berendsen HJC, Fraaije JGEM (1997) LINCS: a
linear constraint solver for molecular simulations. J Comput
Chem 18:1463–1472
Hess B, Kutzner C, van der Spoel D (2008) GROMACS 4: algorithms
for Highly Efficient, Load-Balanced, and Scalable Molecular
Simulation. J Chem Theory Comput 4:435–447
Imai S, Armstrong CM, Kaeberlein M, Guarente L (2000) Transcrip-
tional silencing and longevity protein Sir2 is an NAD-dependent
histone deacetylase. Nature 403:795–800
Jeffrey MB, Zuomei L, Daniel D, Claire B (2004) Methods for
specifically inhibiting histone-7 and 8. US Patents 2004/0072770
A1, 15 April 2004
Jorgensen WL, Chandrasekhar J, Madura JD, Impey RW, Klein ML
(1983) Comparison of simple potential functions for simulating
liquid water. J Chem Phys 79:926
Joseph, JB, Sriram B (2010) Uses of selective inhibitors of HDAC8
for treatment of T-cell proliferative disorders. US Patents
7,820,711, 26 Oct 2010
Kohavi R (1995) A study of cross-validation and bootstrap for
accuracy estimation and model selection. Proceedings of the
fourteenth international joint conference on artificial intelligence
1995; 1995 August 20–25; Quebec Canada. California: Morgan
Kaufmann
Landry J, Slama J, Sternglanz R (2000) Role of NAD? in the
deacetylase activity of the SIR2-like proteins. Biochem Bioph
Res Co 278:685–690
Lehrmann H, Pritchard LL, Harel-Bellan A (2002) Histone acetyl-
transferases and deacetylases in the control of cell proliferation
and differentiation. Adv Cancer Res 86:41–65
Li HZ, Tao W, Gao T, Li H, Lu YH, Su ZM (2012) Improving the
accuracy of DFT calculation for homolysis bond dissociation
energies of Y—NO Bond via back propagation neural network
based on mean impact value. Chem J Chinese U 33:346–352
Liew CY, Ma XH, Liu X, Yap CW (2009) SVM model for virtual
screening of Lck inhibitors. J Chem Inf Model 49:877–885
Ma XH, Wang R, Tan CY, Jiang YY, Lu T (2010) Virtual screening
of selective multitarget kinase inhibitors by combinatorial
support vector machines. Mol Pharm 7:1545–1560
Mahe P, Ueda N, Akutsu T, Perret JL, Vert JP (2005) Graph kernels
for molecular structure-activity relationship analysis with sup-
port vector machines. J Chem Inf Model 45:939–951
Marcano-Cedeno A (2010) Feature selection using sequential forward
selection and classification applying artificial metaplasticity
neural network. IECON 2010—36th annual conference on IEEE
industrial electronics society, 2845–2850
Marks PA, Breslow R (2007) Dimethyl sulfoxide to vorinostat:
development of this histone deacetylase inhibitor as an anti-
cancer drug. Nat Biotechnol 25:84–90
Niu B, Lu WC, Yang SS, Cai YD, Li GZ (2007) Support vector
machine for SAR/QSAR of phenethy-amines. Acta Pharmacol
Sin 28:1075–1086
Oehme I, Deubzer HE, Wegener D, Pickert D, Linke JP, Hero B,
Kopp-Schneider A, Westermann F, Ulrich SM, von Deimling A,
Fischer M, Witt O (2009) Histone deacetylase 8 in neuroblas-
toma tumorigenesis. Clin Cancer Res 15:91–99
Parrinello M, Rahman A (1981) Polymorphic transitions in single
crystals: a new molecular dynamics method. J Appl Phys
52:7182
Shahlaei M (2013) Descriptor selection methods in quantitative
structure-activity relationship studies: a review study. Chem Rev
113:8093–8103
Shi Z, Ma XH, Qin C, Jia J, Jiang YY (2012) Combinatorial support
vector machines approach for virtual screening of selective
multi-target serotonin reuptake inhibitors from large compound
libraries. J Mol Graph Model 32:49–66
Sousa da Silva AW (2012) Vranken WF. ACPYPE - AnteChamber
PYthon Parser interfacE. BMC Res Notes 5:1–8
Taylor D, Maxwell M, Luthi-Carter R, Kazantsev A (2008) Biolog-
ical and potential therapeutic roles of sirtuin deacetylases. Cell
Mol Life Sci 65:4000–4018
Thangapandian S, John S, Lee Y, Kim S, Lee KW (2011) Dynamic
structure-based pharmacophore model development: a new and
effective addition in the histone deacetylase 8 (HDAC8)
inhibitor discovery. Int J Mol Sci 12:9440–9462
Todeschini R, Consonni V (2000) Handbook of molecular descrip-
tors. Wiley-VCH, Weinheim, p 9
Trott O, Olson AJ (2010) AutoDock Vina: improving the speed and
accuracy of docking with a new scoring function, efficient
optimization and multithreading. J Comput Chem 31:455–461
Valenzuela-Fernandez A, Cabrero JR, Serrador JM, Sanchez-Madrid
F (2008) HDAC6: a key regulator of cytoskeleton, cell migration
and cell-cell interactions error. Trends Cell Biol 18:291–297
Vannini A, Volpari C, Gallinari P, Jones P, Mattu M, Carfı A, De
Francesco R, Steinkuhler C, Di Marco S (2007) Substrate
binding to histone deacetylases as shown by the crystal structure
of the HDAC8–substrate complex. EMBO Rep 8:879–884
Vasanthanathan P, Taboureau O, Oostenbrink C, Vermeulen NP,
Olsen L, Jørgensen FS (2009) Classification of cytochrome P450
1A2 inhibitors and noninhibitors by machine learning tech-
niques. Drug Metab Dispos 37:658–664
Verdonk ML, Cole JC, Hartshorn MJ, Murray CW, Taylor RD (2003)
Improved protein-ligand docking using GOLD. Proteins
52:609–623
Walter S, Haishan W, Zheng Y (2007) Biaryl linked hydroxamates:
preparation and pharmaceutical applications. US Patents
2007/0167499 A1, 2007 Jul 19
Wan HL, Wang ZR, Li LL, Cheng C, Ji P, Liu JJ, Zhang H, Zou J,
Yang SY (2012) Discovery of novel Bruton’s tyrosine kinase
inhibitors using a hybrid protocol of virtual screening approaches
based on SVM model, pharmacophore and molecular docking.
Chem Biol Drug Des 80:366–373
Wang M, Wang K, Yan A, Yu C (2012) Classification of HCV NS5B
polymerase inhibitors using support vector machine. Int J Mol
Sci 13:4033–4047
Wu TY, Hassig C, Wu Y, Ding S, Schultz PG (2004) Design,
synthesis, and activity of HDAC inhibitors with a N-formyl
hydroxyl-amine head group. Bioorg Med Chem Lett 14:449–453
Maybridge; Maybridge Chemical Co., Cornwall, UK. Available from:
www.maybridge.com
Yang XY, Seto E (2008) The Rpd3/Hda1 family of lysine deacety-
lases: from bacteria and yeast to mice and men. Nat Rev Mol
Cell Biol 9:206–218
Yap CW (2011) PaDEL-descriptor: an open source software to
calculate molecular descriptors and fingerprints. J Comput Chem
32:1466–1477
Yap CW, Chen YZ (2004) Prediction of cytochrome P450 3A4, 2D6,
and 2C9 inhibitors and substrates by using support vector
machines. J Chem Inf Model 45:982–992
Ze-Yi L, Haishan W, Yan Z (2008) Aclyurea connected and sul-
fonamide connected hydroxamates. US Patents 2008/0070954
A1.48, 20 March 2008
Zhang J, Han B, Wei X, Tan C, Chen Y, Jiang Y (2012) A two-step
target binding and selectivity support vector machines approach
for virtual screening of dopamine receptor subtype-selective
ligands. PLoS ONE 7:e39076
G. P. Cao et al.
123

![Histone Lysine-to-Methionine Mutations Reduce Histone Methylation · PDF fileHistone Lysine-to-Methionine Mutations Reduce Histone Methylation and Cause Developmental Pleiotropy1[OPEN]](https://static.fdocuments.net/doc/165x107/5aad2cf97f8b9a2e088de0be/histone-lysine-to-methionine-mutations-reduce-histone-methylation-lysine-to-methionine.jpg)


![Co-Regulation of Histone-Modifying Enzymes in Cancer · Co-Regulation of Histone-Modifying Enzymes in Cancer ... specific HMT EZH2 [4,7,8,9,10]. ... Co-Regulation of Histone-Modifying](https://static.fdocuments.net/doc/165x107/5acc7b777f8b9a875a8ca304/co-regulation-of-histone-modifying-enzymes-in-cancer-of-histone-modifying-enzymes.jpg)
![Histone Modification - fnkprddata.blob.core.windows.net · $ GTX117336 I H istone H 1 t a ntibody [N1C3] @ GTX21938 I Histone H1 antibody Acetylation $ GTX88006 I Histone H1 K25ac](https://static.fdocuments.net/doc/165x107/5c66fbdf09d3f2e33b8ce2a6/histone-modification-gtx117336-i-h-istone-h-1-t-a-ntibody-n1c3-gtx21938.jpg)
