QPR-Dec-2010
43
Banking Surveillance Department State Bank of Pakistan December 2010 Quarterly Performance Review of the banking system
-
Upload
mariam-munir -
Category
Documents
-
view
218 -
download
0
Transcript of QPR-Dec-2010

8/3/2019 QPR-Dec-2010
http://slidepdf.com/reader/full/qpr-dec-2010 1/43
Banking Surveillance Department
State Bank of Pakistan
December 2010
Quarterly Performance Reviewof the banking system

8/3/2019 QPR-Dec-2010
http://slidepdf.com/reader/full/qpr-dec-2010 2/43
QPR Team
Team Leader
Nizamuddin [email protected]
Team Members Muhammad Ather Elahi
Muhammad Shamil [email protected]
Ghulam [email protected]
Farrukh [email protected]

8/3/2019 QPR-Dec-2010
http://slidepdf.com/reader/full/qpr-dec-2010 3/43
Acknowledgments
The QPR team is greatly indebted to Shahid Hafiz Kardar, Governor, State Bank of Pakistan for hisinvaluable feedback and continuous guidance in the preparation of this report. We are also grateful to
members of Publications Review Committee (Dr. Mushtaq A. Khan, Mr. Riaz Riazuddin, Mr. InayatHussain, Mr. Asad Qureshi, Mr. Muhammad Ashraf Khan and Ms. Sahar Z. Baber) for their valuablecomments on an earlier draft of the QPR. We also appreciate the help provided by members of theprevious QPR team and all divisional heads of the Banking Surveillance Department.
The team bears the responsibility of all errors and omissions. The analysis and commentary in the reportare entirely those of the team and do not necessarily represent the views of the SBP management.

8/3/2019 QPR-Dec-2010
http://slidepdf.com/reader/full/qpr-dec-2010 4/43
Contents
Overview & Outlook ..................................................................................................................................... 1Chapter 1: Assessment of Financial Intermediation ................................................................................ 4
Chapter 2: Risk Analysis ............................................................................................................................. 10
Chapter 3: Soundness and Resilience of the Banking System ............................................................... 18
Note: This is the last quarterly performance review (QPR) of the banking system. Going forward,QPR will be replaced by bi-annual Financial Stability Reports (FSR). However, to accommodatethe data needs of various stakeholders, we would continue to post quarterly banking statistics(including Financial Soundness Indicators) on SBP website.

8/3/2019 QPR-Dec-2010
http://slidepdf.com/reader/full/qpr-dec-2010 5/43
Overview & Outlook The last quarter of CY10 presents a mixed picture for banks in Pakistan. Banks’ profits have increased by 23.1 percent during 2010, though continue to remain concentrated among the big five banks. Liquidity in
the system has improved and solvency has strengthened further. While Non-Performing Loans (NPLs)continue to accumulate, the rate has slowed down (YoY basis) with the bulk of incremental NPLsconfined to a few banks.
There has been growing evidence of banks’ flight towards quality as investments, mainly in governmentsecurities1, now constitute around 30.4 percent of banks’ assets compared with 19.3 percent in Dec-08.Share of advances has witnessed a concomitant drop, from 60.8 to 52.0 percent during the past twoyears. Unsurprisingly, return on government paper now accounts for 34.5 percent of banks’ gross mark -up/interest income, compared to 28.8 percent in Dec-08. This suggests that growth in governmentborrowings, in a rising interest rate scenario, has shored up banks’ earnings. Banks’ disturbingly diminishing role as financial intermediaries is becoming evident from their Advances-to-Deposits ratio, which has dropped from 76.0 percent in Sep-08 to 61.4 percent by Dec-10.
The shift in asset mix, from advances to investments in government papers, has important implications.In the short run, it has reduced banks’ eagerness for extending private sector credit. The lure of risk-freeinvestments in government paper, coupled with high NPLs, has doused their risk appetite. Additionally,they have been able to extend commodity finance well-above the risk-free rate; during Q4-2010, bankscharged a premium of 2.75 percentage points above KIBOR on these loans.2 Under these circumstances,the private sector might find bank credit discernibly expensive, thus keeping its borrowings largely confined to immediate working capital needs.3 Credit demand from the private sector has been subduedalso on account of severe energy shortages, the difficult law and order situation, and an uncertainbusiness environment. On the supply side, banks have shown a preference for maintaining liquidity rather than increasing exposure to the private sector.
If continues unabated, this trend of banks’ rising exposure to government borrowings is likely to restrainthe performance of the private sector. Further, the growing share of government paper in the asset mixmight weaken banks’ capacity to effectively manage the risks of private sector borrowers, particularly once the reversal in the asset mix eventually takes place. Admittedly, this is not going to happen soon,given the government’s strong demand for funds to finance its budgetary and other needs, andchallenging business conditions for the private sector. However, as our domestic experience of creditcycles and the US episode of subprime lending suggests, banks, once awash with liquidity and in pursuitof higher yields, might struggle to effectively manage the risks of another surge in private credit.
On the flip side, this shift in asset mix has improved the liquidity profile of banks and is also likely tohelp stem the rate of infection in their asset portfolio. Hopefully, this will also encourage privatebusinesses to raise funds from the capital market, assuming that: (i) they find bank credit expensive, (ii)
have the brand and credibility to attract investors, (iii) can bear the cost and comply with cumbersomelisting regulations, and (iv) are unfettered by concerns over dilution in family ownerships. Indeed, some
1 During Q4-CY10, 90.9 percent of incremental investments were in government papers.2 This is significant, given the dual comfort of government guarantee and presence of collateral (like stock of wheat etc). However,even an interest rate of 16.27 percent (3 month KIBOR + spread of 2.75 percentage points) makes the real interest rate barely positive when compared with the 15.5 percent of inflation rate for Dec-10.3 This has been the case during Q4-CY10, as higher input prices propelled seasonal demand for private sector credit, largely for
working capital needs.

8/3/2019 QPR-Dec-2010
http://slidepdf.com/reader/full/qpr-dec-2010 6/43
2
Table 1: Highlights of the quarter ended December 2010
CY07 CY08 CY09 Sep-10
Growth Rates YoY YoY YoY QoQ QoQ YoY
Asset 18.8 8.8 15.8 (2.3) 7.7 9.3
Loans (Net) 10.7 18.0 2.1 (2.0) 5.7 3.1
Deposit 18.4 9.4 13.5 (2.1) 8.5 13.9
Investments (Net) 53.1 (14.8) 59.9 (1.0) 14.3 22.2
Equity 35.3 3.4 17.3 (1.9) 6.3 5.4
KEY FSIs:
Capital Adequacy Ratio 12.3 12.2 14.0 13.8
Capital to Total Assets 10.5 10.0 10.1 9.9
NPLs to Loans (Gross) 7.6 10.5 12.6 14.0
Net NPLs to Net Loans 1.1 3.4 4.1 4.5
ROA (Before Tax) 2.2 1.2 1.3 1.6
ROE^ (Before Tax) 22.6 11.4 13.2 16.2
Liquid Assets/ Total Deposits 45.1 37.7 44.5 44.4
Advances to Deposit Ratio 69.7 75.2 67.7 63.1^ Based on Average Equity plus S urplus on Revaluation
Note: Growth rates for Dec-10 are based on quarterly basis
(in percent)
5.4
1.7
16.7
45.9
61.4
Dec-10
14.0
9.8
14.7
private firms have been able to raise money directly from the public through TFCs, and at rates lowerthan those being charged for government borrowings for commodity finance. Most firms, however,continue to rely on bank credit, which not only keeps their borrowing costs high but also deprivesindividual and institutional savers of alternative investment opportunities.
During the quarter under review (Q4-CY10), assets of
the banking system grew by 7.7 percent to reach Rs.7.1 trillion. This growth in total assets, while in line with the established seasonal pattern of the fourthquarter, is particularly strong given the comparatively weak performance in the first three quarters of CY10.4 Total assets have grown primarily because of investments in government papers and seasonal creditrequirements of the private sector, thanks to soaring input prices. On banks’ liabilities side, depositsincreased by 8.5 percent, registering the highest QoQgrowth during the last three years, on the back of improvements in the external current account and
strong inflows of workers’ remittances.
A look at the break-up of total assets reveals that netinvestments, with an increase of 14.3 percent during the quarter, have markedly outpaced the subduedgrowth of 5.7 percent in net advances. It appears that the bulk of incremental deposits have been placedby banks in government papers, another indication of ineffective financial intermediation. Within privatesector credit, lending to textile and sugar industries has grown by 19.6 percent and 28.2 percentrespectively, accounting for two thirds of the credit off- take of Rs. 196 billion during Q4.
In terms of banks’ risk profiles, credit risk remains the most significant, and for obvious reasons. First, itaccounts for around 80 percent of banks’ risk-weighted assets, and is thus markedly more significant
than market and operational risks combined.5 Second, the challenge of reversing the rising trend in NPLsis still not over; in this quarter alone, banks accumulated new NPLs of Rs. 53.7 billion, pushing infectionratio (NPLs to loans-NPLR) from 14 percent to 14.7 percent. On a positive note, 77.6 percent of incremental NPLs during Q4 were confined to a handful of banks, with some banks even enjoying a YoY decline.
Other key risks of the banking system remained subdued during the quarter, in particular liquidity risk.Banks have maintained excess liquidity which prompted SBP to even step in for net mop up on someoccasions. On the interest rate side, the spike in the policy rate shifted and steepened the yield curve.Understandably, as in a rising interest rate scenario, banks’ bidding patterns during Q4 reflected theirgreater preference for short term securities. In case of long term securities, banks’ bids were partially accepted by the government.
4Contraction in assets and liabilities of the banking system during Sep-10 was largely in line with the established pattern of the thirdquarter, as exhibited by Figure 1.1 below. For detailed discussion, see QPR of Sep-10 available on SBP website.5For commercial banks, it is obvious that the bulk of their assets consist of loans and not the trading portfolios, which keeps marketrisk subdued. In case of operational risk, its relatively lower share in risk-weighted assets is primarily due to the methodology used inmeasuring operational risk charge.

8/3/2019 QPR-Dec-2010
http://slidepdf.com/reader/full/qpr-dec-2010 7/43
3
Banks’ profits have increased by 23.1 percent during CY10 to reach Rs. 111.2 billion. Similar to previousyears, these profits continue to remain concentrated in the big five banks, which held 95 percent of totalpre-tax profits, with only a 51 percent share in total assets. Banks’ profitability has been the outcome of growing interest income and lower provisions on account of FSV benefits (due to SBP’s relaxation inprovisioning requirements since November 2009).
Healthy profits, accumulation of reserves, enhanced minimum capital requirements, and moderategrowth in risk-weighted assets help explain the increase in banks’ capital adequacy ratio (CAR) from 13.8to 14 percent during the quarter. The capital structure of some of the smaller banks has observedconsiderable improvement, primarily on account of three mergers and the formation of Sindh Bank.However, around half of the banks are confronted with the challenge of meeting the recently enhancedMCR of Rs. 7 billion. But if viewed in terms of CAR (a risk-sensitive measure of capital adequacy), banks with around 94 percent market share have maintained the required CAR of 10 percent. This suggeststhat in overall terms, the banking industry is well capitalized.
Going forward, the historical trend of slowdown in the March-quarter is likely to prevail, followed by revival in credit disbursement as well as in deposit mobilization during the June-quarter. Credit infectionis expected to decelerate on the back of some let-up in non-performing loans and banks’ shift of asset
mix towards risk-free investments. However, reversal in asset mix does not appear likely in the short run,given the borrowing needs of the government and the challenging market conditions for privatebusinesses. Finally, the results of the stress tests indicate that the banking system is resilient to shocksemanating from a challenging macroeconomic and business environment.

8/3/2019 QPR-Dec-2010
http://slidepdf.com/reader/full/qpr-dec-2010 8/43
4
Chapter 1: Assessment of Financial Intermediation During the quarter under review, total assets of the banking system have grown primarily because of
investment in government papers and seasonal credit requirements by private sector on the back of soaring
input prices. Credit to public sector showed a decline due to retirement of advances availed for wheat
procurement and repayments by energy sector. Deposit growth was helped by improvements in external
sector. Overall asset mix of banks moved further from advances to investments because of relentless
government borrowings and banks’ risk -averse behavior. This trend, however, highlights the receding role
of banks in financial intermediation.
Growth in total assets surpass seasonal trend…
Incessant government borrowings and seasonal
demand for private credit on the back of rising
input prices helped banking assets grow by 7.7
percent during the quarter (Q4-CY10). Growth in
total assets during fourth quarter, though in line
with historical trends, is particularly strong given the
comparatively weak performance in the earlier three
quarters of CY10 ( Figure 1.1 ).
…mainly as investment in govt. papers surged
A major portion of growth in assets can be ascribed
to soaring investments in government securities.
Total investment (net of provisions) grew by Rs.
269 billion, posting growth of 14.3 percent during the quarter ( Table 1.1 ). On YoY basis, investments
registered strong growth of 22.2 percent with the
predominant share (72.9 percent) in government
papers including T-bills and PIBs. Apart from
traditional interest-bearing government securities,
the quarter under review also witnessed 96 percent
growth in investments by Islamic banking
institutions, due to their investment of Rs 89 billion
in two tranches of Government of Pakistan Ijarah
Sukuk 6.
6 For details, see Islamic Banking Bulletin, December 2010.
Dec-07 Dec-08 Dec-09 Sep-10 Dec-10
Cash & Balances 617 654 708 672 745
Lending to FIs 191 188 238 281 219
Investments (net) 1,276 1,080 1,737 1,873 2,142
Advances (net) 2,688 3,183 3,240 3,167 3,349
Other Assets 401 521 593 632 683
Total Assets 5,172 5,627 6,516 6,626 7,138
Table 1.1: Composition of Total Assets by Type
billion Rupees
-3
0
3
6
9
12
Q1 Q2 Q3 Q4
CY07 CY08 CY09
CY10 Average
Figure 1.1: Quarterly Growth Rates of Total Assets
%

8/3/2019 QPR-Dec-2010
http://slidepdf.com/reader/full/qpr-dec-2010 9/43
5
Over the last two years, power supply shortages,
weak law and order situation and lackluster
economic performance with the consequent rise in
credit risk have been the main reasons for banks’
flight to quality. Simultaneously , government’s
reliance on borrowings from commercial bankshave surged owing to a) delays in imposition of tax
reforms, b) failure to generate sufficient external
financing, c) persistent growth in current
expenditures directed toward flood relief activities
and d) pressures to limit budgetary borrowings from
SBP. The burgeoning government borrowings
provided banks a continuous stream of lucrative
risk-free securities. Unsurprisingly, the amount of
investments (net of provisions) doubled from Rs
1.08 trillion in CY08 to Rs 2.14 trillion in Q4-CY10. The share of net investments in total assets also
increased from 19 percent in Dec-08 to 30 percent
by Dec-10 ( Figure 1.2 ). Consequently, net advances
as a percentage of total assets dropped from 56.7
percent in CY08 to 46.9 percent in Q4-CY10.
Higher input prices propelled seasonal demand
for private sector credit
Despite shift in asset mix, bank credit increased by
Rs. 196 billion during the quarter, registering 5.6
percent growth (QoQ). The rise in credit off-take
was influenced by inventory buildup and pickup in
economic activities, thanks to seasonal requirements
of the manufacturing sector on the back of soaring
input prices. In particular, prices of key industrial
inputs7 (i.e. cotton, sugarcane and oil) witnessed a
sharp rise in international markets – increasing the
borrowing need of manufacturing sector for
working capital. Resultantly, private sector
commodity finance, corporate sector credit and
SME finance registered 63.5 percent, 9.3 percentand 9.1 percent QoQ growth respectively 8.
7 It is estimated that around 80 percent of the increase in value of exports was due to higher price effect (Monetary Policy Statementof the SBP – Jan 2011).8 This covers banks’ domestic operations only.
0
5
10
15
20
2530
35
-
500
1,000
1,500
Jun-08 Dec-08 Jun-09 Dec-09 Jun-10 Dec-10
MTBs PIBs
Others Inv to TA (rhs)
Fed Sec. to Total Assets (rhs)
Figure 1.2: Banks' Investments
%bill ion Rupees

8/3/2019 QPR-Dec-2010
http://slidepdf.com/reader/full/qpr-dec-2010 10/43
6
Despite higher lending rates and declining growth
of large-scale manufacturing sector, lending to
textile and sugar sectors grew by 19.6 percent and
28.2 percent respectively, accounting for two third
of the credit off take during the quarter ( Figure
1.3 ). Other significant increase in creditdisbursements was in electronics and in the energy
sector. On the other hand, chemical and
pharmaceutical sector that had increased its
borrowings over the last several quarters, retired 5.1
percent of its bank credit during the quarter under
review.
Disaggregated analysis of the credit to private sector
reveals that advances to all segments have grown
except for consumer financing. Lending to SME
sector also bounced back during the quarter as the
sector borrowed Rs. 28 billion against a
continuously declining credit in the first three
quarters of CY10 ( Table 1.2 ).
…while lending to public sector & FIs drop ped
Domestic lending to public sector mainly caters the
budgetary needs of the governments, lending to
Public Sector Enterprises and for commodity
finance operations. During the quarter, retirement
against commodity finance and by PSEs including oil refinery and a state-owned oil marketing
company lead to a 6.2 percent decline in public
sector loans (Rs. 36 billion). In particular, the credit
to PSEs declined by Rs. 19.3 billion and for
commodity financing by another Rs. 16.3 billion
( Table 1.3 ).
Further, lending to financial institutions dropped by
22 percent to Rs. 219.1 billion during the quarter.
This was due to banks’ greater participation inauctions of government securities that squeezed
funds for lending in the money market.
Sep-10 Dec-10 ChangeCorporate Sector 1,845.8 2,017.4 171.6
Fixed Investment 713.8 734.0 20.3
Working Capital 630.8 736.8 106.1 Trade Finance 501.3 546.6 45.3
SMEs 308.1 336.2 28.2 Working Capital 232.9 262.9 30.0
Agriculture 167.8 168.5 0.7 Consumer Finance 242.2 237.6 (4.6) Commodity Financing 57.2 93.6 36.4 Staff Loans 76.7 77.2 0.6 Others 7.9 11.4 3.5
Table 1.2: Domestic Lending to Private Sectorbillion Rupees
Table 1.3: Credit to Public Sector and Financial Institutions
Amount Growth Amount Growth Amount Growth
Dec-08 202.1 8.1 137.6 20.0 187.1 0.9
Dec-09 244.9 5.5 320.0 -1.4 240.1 33.3
Sep-10 203.0 10.2 379.9 -6.5 280.9 -3.8
Dec-10 183.7 -9.5 363.6 -4.3 219.1 -22.0
Domest ic Operat ions Amount in bill ion R upees, grow th in percentP SE s Commodi ty Fi nanc e Fi nan ci al I nsti tut ion s

8/3/2019 QPR-Dec-2010
http://slidepdf.com/reader/full/qpr-dec-2010 11/43
7
ADR continued to fall, with receding financial
intermediation
Over the last two years, deteriorating asset quality
has made banks cautious of lending to private sector
except for higher quality borrowers or for seasonal
credit. With government’s increasing reliance on
borrowings from commercial banks, banks’ risk
appetite for private credit has slacked further. This
has translated into growing investment in
government papers with a concomitant
deterioration in ADR, from around 76 percent in
Sep-08 to 61.4 percent in Dec-10 ( Figure 1.4 ).
Declining ADR highlights the fact that banks were
not constrained by the availability of funds; rather it
was growing level of NPLs that made banks wary of
lending to the private sector. Borrowing needs of the government and consequent supply of risk-free
securities at attractive rates further dampened the
banks’ risk -appetite. These factors collectively
encouraged banks’ shift from advances to
investments, with consequent fall in ADR. If this
trend continues unabated, it would reduce the
effectiveness of banks’ role as financial
intermediaries.
Foreign banks more into investment than
lending
Unlike other banks, foreign banks have 15.6 percent
of their assets in lending to financial institutions and
only 28.1 percent into net advances. Foreign banks
remain confined to selective lending and are
generally more risk-averse than other banks This is
in stark contrast with other commercial banks,
particularly top five banks, where these ratios are 2.2
percent and 48.1 percent respectively ( Table 1.4 ).
It appears that the size and outreach have significantbearing on banks’ asset-liability management
strategies. Large size banks have wider outreach and
enjoy stronger brand recognition due to their long
presence in the market. They are able to mobilize
higher amount of relatively cheaper and less rate-
60
64
68
72
76
-6
-3
0
3
6
9
Dec-07 Sep-08 Jun-09 Mar-10 Dec-10Deposits Growth Loans Growth ADR (LHS)
Figure 1.4: Growthin Advances & Deposits
%%
Dec-10
Top 5
banks
6-10
banks
11 - 20
banks
Rest of
banks
Market Share 51.0 22.6 16.8 4.4
Cash & Bank 10.9 9.2 9.1 11.6
Lending to FIs 2.2 3.4 2.3 6.2
Investments 29.5 30.8 33.1 26.6
Advances 48.1 46.2 46.3 44.7
Other Assets 9.3 10.4 9.2 10.9
Total Assets 100 100 100 100Local
banks
Foreign
banks
Specialized
banks All banks
Market Share 94.7 3.3 2.0 100.0Cash & Bank 10.2 15.8 12.2 10.4
Lending to FIs 2.7 15.6 0.0 3.1
Investments 30.3 34.2 10.2 30.0
Advances 47.2 28.1 65.5 46.9
Other Assets 9.6 6.4 12.1 9.6
Total Assets 100 100 100 100
Table 1.4: Assets Composition by Size of Banks
billion Rupees

8/3/2019 QPR-Dec-2010
http://slidepdf.com/reader/full/qpr-dec-2010 12/43
8
sensitive deposits. The stable deposit-base of large
banks allows them to take longer positions without
significant risk of asset-liability mismatch. Share of
top-5 banks in total bank lending has been above 50
percent of the industry and has further inched up
( Table 1.5 ). On the other hand, small-sized banks(and especially foreign banks) have to rely on urban
clientele and money market activities because of
their narrow deposit-base which in turn restrict their
ability to diversify their credit portfolio.
Three Mergers and establishment of a new
bank shifts assets to local banks
Market share of smaller banks slightly increased
during Q4-CY10 on account of establishment of
Sindh Bank (public sector commercial bank) and
merger of Royal Bank of Scotland into Faysal Bank
(a local private bank). Similarly, AlBaraka Islamic
bank, a foreign bank, became locally incorporated
after its merger with Emirates Global Islamic bank.
This resulted into contraction of foreign banks’
assets by around Rs. 23 billion9 ( Table 1.6 ).
Deposits register decent growth…
During the quarter, total deposits of the banking
system increased by 8.5 percent, compared to 6.8percent growth during same quarter last year
(Figure 1.5 ). The growth in total deposits has been
dominated by non-remunerative current accounts,
which grew by 9.7 percent in the same quarter.
Savings and non-remunerative current account have
witnessed higher growth in line with increase in
seasonal credit disbursement, as part of the
disbursed loan return to the banking system. On the
other hand, fixed deposits that are largely influenced
by depositors’ disposable income and preferencesfor savings, have registered an 8.1 percent growth in
Dec-10 compared to 6.6 percent in Dec-09.
9 During the quarter, another merger between two local banks, Arif Habib and Atlas Bank, resulted into Summit Bank. However, thisdoes not affect the overall share of local private banks.
-4
0
4
8
12
16
Dec- 08 M ar -0 9 J un- 09 Sep- 09 Dec- 09 Mar -1 0 J un- 10 Sep- 10 Dec- 10
Figuere 1.5: Growth in Customer Deposits
Fixed Deposits Saving DepositsCurrent accounts Total Deposits
%
Top 5 banks Top 10 banks Top 20 banks
Dec-07 48.8 72.6 94.1
Dec-08 52.9 74.2 93.6
Dec-09 53.7 74.7 93.2Sep-10 51.8 73.8 92.3
Dec-10 52.3 74.5 92.8
(in percent of total industry)
Table 1.5: Concentration of Lending in the Banking System
CY07 CY08 CY09 Sep-10 Dec-10
PSCBs 1,036 1,042 1,230 1,236 1,358
LPBs 3,836 4,220 4,905 4,998 5,404
FBs 173 234 241 257 234
CBs 5,044 5,496 6,376 6,491 6,995
SBs 127 130 140 135 142
All Banks 5,171 5,627 6,516 6,626 7,138
Table 1.6: Total Assets by Type of Bank
billion Rupees

8/3/2019 QPR-Dec-2010
http://slidepdf.com/reader/full/qpr-dec-2010 13/43
9
Part of growth in deposits came from
improvements in external sector on the back of
continued high workers’ remittances amounting to
$2.6 billion during the quarter. Cumulative amount
of remittances during CY10 was $965 million higher
than that of remittances during CY09 ( Figure 1.6 ).
Due to growth in deposits and comfortable liquidity
profiles, banks’ reliance on borrowings from the
money market remained low during the quarter. The
share of borrowings from financial institutions in
total assets declined from 10.1 percent in Dec-09 to
7.7 percent in Dec-10.
Top five banks were able to mobilize Rs. 261 billion
in new deposits of which Rs. 136 billion were in
savings and non-remunerative current account.
Consequently, the share of fixed deposits continued
to remain far lower in top five banks (26 percent)
than in smaller banks (43 percent) or even
compared with industry average (31 percent) ( Table
1.7 ). Since most of the advances are made by large
banks, bulk of their credit disbursements remain
within these banks in term of current accounts of
businesses and saving accounts of private
individuals. Further, large banks have also been
successful in raising low-cost and relatively rate-
insensitive deposits.
0
1
2
34
5
6
7
8
9
10
Jan Feb Mar Apr May Jun Jul Aug Sep Oct Nov Dec
Figure 1.6: Annual Workers' Remittances
CY09 CY10
bill ion USD
Dec-10
Top 5
banks
6-10
banks
11 - 20
banks
Rest of
banksMarket Share in Deposits 53.3 23.6 15.7 4.1
Customers 96.2 95.9 96.4 97.7
Fixed Deposits 26.0 30.8 42.6 43.0 Saving Deposits 37.5 34.8 31.2 32.4 Current accounts - R emunerative 4.5 2.3 0.0 1.3 Current accounts - Non-remun. 27.9 26.8 21.6 19.9 Others 0.4 1.2 1.1 1.1
Financial Institutions 3.8 4.1 3.6 2.3 Remunerative Deposits 1.7 4.0 3.5 2.2
Non-remunerative Deposits 2.1 0.1 0.1 0.1 Total Deposits 100 100 100 100
Local
banks
Foreign
banks
Specialized
banks All banksMarket Share in Deposits 96.8 2.9 0.3 100 Customers 96.3 97.6 95.8 96.3
Fixed Deposits 30.6 51.3 18.9 31.1 Saving Deposits 35.6 25.3 39.1 35.3 Current accounts - R emunerative 3.1 0.4 0.9 3.0 Current accounts - Non-remun. 26.3 20.3 35.3 26.1 Others 0.7 0.3 1.7 0.7
Financial Institutions 3.7 2.4 4.2 3.7 Remunerative Deposits 2.5 1.5 4.2 2.5
Non-remunerative Deposits 1.2 0.9 0.1 1.2 Total Deposits 100 100 100 100
Table 1.7: Deposits by Size of Bank
(in percent)
8/3/2019 QPR-Dec-2010
http://slidepdf.com/reader/full/qpr-dec-2010 14/43
10
Chapter 2: Risk Analysis
Risk profile of the banking system offers a mixed picture. Banks liquidity positions have strengthened
during the quarter, offering better cushion against liquidity shocks. However, NPLs continue to accumulate,
albeit at a slower pace and with incremental NPLs heavily concentrated in a few banks. Growing infectionhas tempered banks’ appetite for private sector credit, shifting their portfolios towards investments in
government papers. Market risk has remained subdued during the quarter, despite shift and steepening of
the yield curve and a bullish equity market.
2.1: Credit Risk
Despite some let up, NPLs continue to
accumulate…
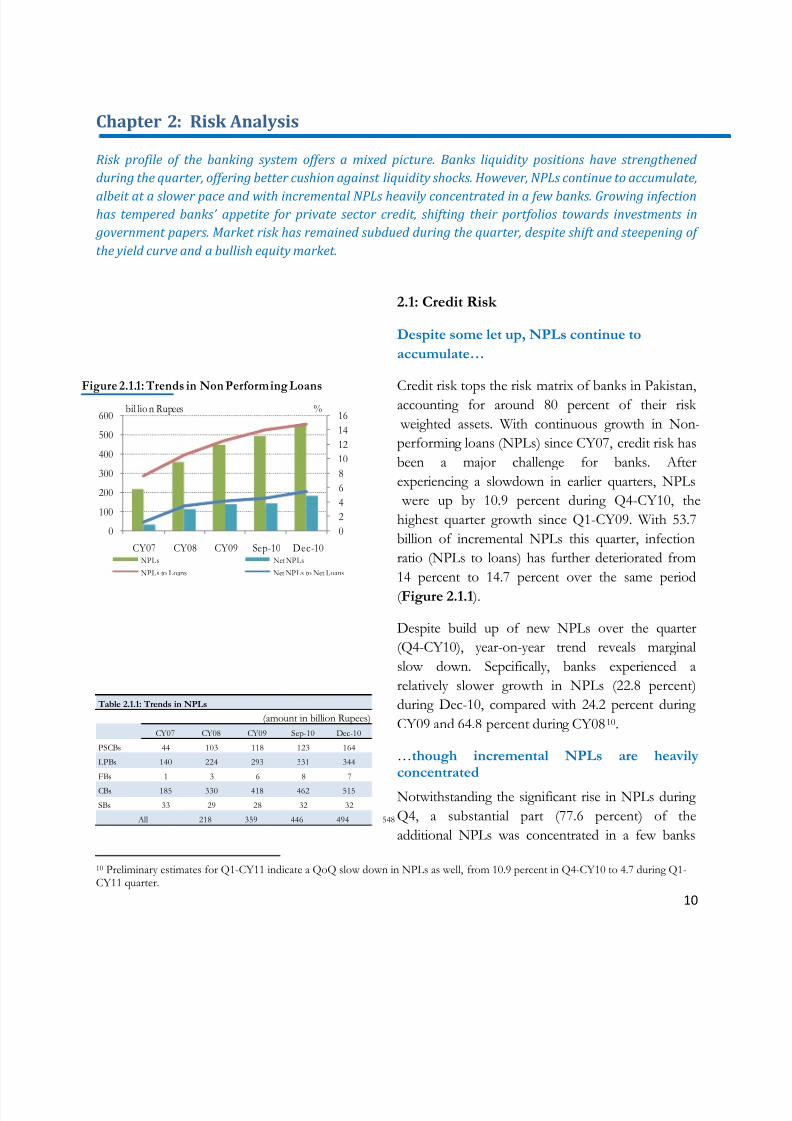
Credit risk tops the risk matrix of banks in Pakistan,accounting for around 80 percent of their risk
weighted assets. With continuous growth in Non-
performing loans (NPLs) since CY07, credit risk has
been a major challenge for banks. After
experiencing a slowdown in earlier quarters, NPLs
were up by 10.9 percent during Q4-CY10, the
highest quarter growth since Q1-CY09. With 53.7
billion of incremental NPLs this quarter, infection
ratio (NPLs to loans) has further deteriorated from
14 percent to 14.7 percent over the same period
( Figure 2.1.1 ).
Despite build up of new NPLs over the quarter
(Q4-CY10), year-on-year trend reveals marginal
slow down. Sepcifically, banks experienced a
relatively slower growth in NPLs (22.8 percent)
during Dec-10, compared with 24.2 percent during
CY09 and 64.8 percent during CY0810.
…though incremental NPLs are heavilyconcentrated
Notwithstanding the significant rise in NPLs during
Q4, a substantial part (77.6 percent) of the
additional NPLs was concentrated in a few banks
10 Preliminary estimates for Q1-CY11 indicate a QoQ slow down in NPLs as well, from 10.9 percent in Q4-CY10 to 4.7 during Q1-CY11 quarter.
0
2
4
6
8
10
12
14
16
0
100
200
300
400
500
600
CY07 CY08 CY09 Sep-10 Dec-10NPLs Net NPLs
NPLs to Loans Net NPLs to Net Loans
bil lio n RupeesFigure 2.1.1: Trends in Non Performing Loans
%
Table 2.1.1: Trends in NPLs
CY07 CY08 CY09 Sep-10 Dec-10
PSCBs 44 103 118 123 164
LPBs 140 224 293 331 344
FBs 1 3 6 8 7
CBs 185 330 418 462 515
SBs 33 29 28 32 32
All 218 359 446 494 548
(amount in billion Rupees)

8/3/2019 QPR-Dec-2010
http://slidepdf.com/reader/full/qpr-dec-2010 15/43
11
( Table 2.1.1 ). In case of local private banks, there
has been a mixed trend as some banks were able to
reduce NPLs while others observed expansion
during the quarter. Though foreign banks observed
contraction in NPLs, it was primarily on account of
merger of EGIBL and Albaraka Islamic bank.
…and so does the sharp rise in Loss category
By classification categories, NPLs have contracted
by 12 percent during Q4-CY10 in the first three
categories i.e. OEAM, substandard and doubtful
( Figure 2.1.2 ). However, Loss category of NPLs
witnessed significant increase of Rs. 72.2 billion,
experiencing 21.3 percent QoQ growth. This has
been due to downgrading of initial categories as well
as inflow of fresh NPLs directly into loss category. As in the case of incremental NPLs, bulk (81.6
percent) of NPLs under loss category have been
booked by a few banks.
Smaller banks bear the brunt of credit risk
While growing NPLs has generally been a drag on
banks profits and solvency profiles, larger banks
appear more resilient, given their stronger capital
buffers, greater outreach and diversification in
lending and deposits base. Despite a noticeableincrease in lending portfolios of top 5 banks, their
NPLs and infection ratios remained relatively low,
reflecting their ability to attract less risky borrowers.
In fact, as much as 73 percent of banks’ lending to
public sector resides in the top 5 banks.
Conversely, relatively smaller banks, with limited
outreach and low diversification in their asset base,
have to bear the brunt of the increased credit risk.
In particular, banks ranked 11-20 in terms of share
in banks total assets appear considerably more
vulnerable as reflected in their unusually higher
infection ratio and significantly lower provisioning
coverage ( Table 2.1.2 ). For instance, infection ratio
0% 20% 40% 60% 80% 100%
CY08
CY09
Sep-10
Dec-10
OAEM Sub-standard Doubtful Loss
Figure 2.1.2: Category-wise Breakup of NPLs
Table 2.1.2: Asset Quality Indicators
Dec-10
Infection
Ratio
Net
Infection
Ratio
Provision
Coverage
Net
NPLs to
Capital
Top 5 banks 12.4 3.2 76.7 14.3
Top 6-10 banks 10.5 2.8 74.9 16.9
Top 11-20 banks 24.7 14.3 49.3 86.2
Top 21-29 17.4 9.4 50.7 24.3
FBs 9.8 1.4 86.5 2.7
SBs 28.4 12.5 64.2 335.5
Banks excluding SBs 14.3 5.2 66.9 24.6
All banks 14.7 5.4 66.7 26.1
(In percent)

8/3/2019 QPR-Dec-2010
http://slidepdf.com/reader/full/qpr-dec-2010 16/43
12
which averaged 12.4 percent for top-5 banks was as
high as 24.7 percent for banks ranked 11-20.
Despite rise in provisions, coverage ratio
dropped
With additional provisions of Rs. 14.1 billion,
provisions increased by 4 percent during the
quarter. This rise in provisions was however slower
than 4.3 percent growth in the previous quarter
(Q3-CY10). Consequently, NPLs coverage ratio
(provisions to NPLs) deteriorated from 71.1 percent
to 66.7 percent during Q4-CY10 ( Figure 2.1.3 ).
This also led to a rise in capital impairment ratio
(net NPLs to capital) of the system from 21.8
percent to 26.1 percent. The drop in coverage ratio
and surge in capital impairment has been onaccount of strong growth of NPLs during the
quarter coupled with lower provisions due to FSV
benefit11.
Banks’ risk -aversion on rise
With challenging economic conditions and growing
NPLs, banks were shy of venturing into risky
lending opportunities. In such testing times,
relentless borrowings by the government have been
a blessing for commercial banks, providing aconvenient option to place bulk of their funds in
risk-free securities. Accordingly, there has been
noticeable flight to quality in banks’ lending
portfolios. For instance, investment in government
papers has posted a strong growth of 18.3 percent,
compared with 9.6 percent growth in lending to
private sector. Accordingly, share of investments in
total assets has consistently grown since CY08 with
concomitant fall in share of advances ( Figure
2.1.4 ). While public sector lending has droppedduring the quarter on account of retirement of
commodity finance, banks have preferred to
11 BSD Circular No. 10 of 2009 allows banks to take FSV benefit on pledged stocks and mortgages held as collateral against NPLs forthree years from the date of classification for calculating provisioning requirement w.e.f. 30-09-2009. Further, lower provisions couldalso be partly explained by additional relaxations given by SBP in case of debt guaranteed by the government.
5
15
25
35
45
55
65
75
8595
0
50
100
150
200
250
300
350400
2007 2008 2009 Sep-10 Dec-10Provisions held Provisions to NPLs Ratio
Net NPLs to capital
Figure 2.1.3: Provisions againstNPLs
billionRupees %
19
61
27
54
30
52
Gross Investments Gross Loans
Dec-10
Dec-09
Figure 2.1.4: Investments & Loans
Dec-08
%age of Total Assets

8/3/2019 QPR-Dec-2010
http://slidepdf.com/reader/full/qpr-dec-2010 17/43
13
maintain excess liquidity than venturing into
relatively risky lending.
Within private sector, lending to corporate sector
posted stable growth. The sector enjoyed relatively
lower infection ratio because of its greater capacity to withstand untoward shocks like power shortages
and macroeconomic stresses. As of Dec-10, 63
percent of banks’ loan portfolio was taken by
corporate sector with significantly lower infection
ratio (15.4 percent) compared with SMEs (28
percent). However, as the magnitude of lending to
corporate sector is substantially higher, even
moderate deterioration in asset quality has serious
implications for banks profits.
In terms of sectoral distribution of loans and NPLsfor Q4 ( Table 2.1.3 ), textile sector continued to
remain the largest user of bank credit, on account of
working capital requirements fuelled by soaring
input prices. In line with its borrowing magnitude,
banks’ 31.3 percent of NPLs were also in the textile
sector. Credit supply to energy sector also remained
high during the quarter on account of rising fuel
prices. Further, share of agribusiness loans
improved from 4.7 percent to 5.9 percent (YoY), on
the back of less than expected impact of floods andseasonal financing needs at times of high input
prices.
Lending to SMEs and consumers remain cautious
Lending to SMEs surged by Rs. 29 billion during
Q4 after contracting by Rs. 41 billion in earlier three
quarters of CY10 ( Figure 2.1.5 ). The recent hike in
the lending to SME has been on account of
different revival schemes in post-flood scenario in
which the SME and agricultural related smallindustries were provided credit guarantee schemes.
Further, banks were given relaxations in
provisioning requirements on restructured
and rescheduled loans to affected SMEs.
0
5
10
15
20
25
30
35
(50)
50
150
250
350
450
Dec-07 Dec-08 Dec-09 Sep-10 Dec-10
Figure 2.1.5: Trends in SME Finance
NPLs Loans
NPLR Share in Total Loans
bil li on Rupees%
Table: 2.1.3: Sectoral Distribution of Loans and NPLs
Amount % Share Amount % Share
Agribusiness 220.9 5.9 14.5 2.6
Automobile/Transportation 47.7 1.3 11.0 2.0
Cement 95.0 2.6 17.6 3.2
Chemical & Pharmaceuticals 143.4 3.9 11.4 2.1
Electronics 61.6 1.7 23.7 4.3
Financial 41.5 1.1 7.9 1.4
Individuals 446.1 12.0 71.8 13.1
Insurance 1.5 0.0 0.0 0.0
Others 1504.6 40.5 188.0 34.3
Production/Transmission of Energy 350.4 9.4 13.3 2.4
Shoes & Leather garments 22.9 0.6 2.9 0.5
Sugar 73.6 2.0 14.2 2.6
Textile 705.2 19.0 171.5 31.3
(amount in billion Rupees)Item
Loans NPL

8/3/2019 QPR-Dec-2010
http://slidepdf.com/reader/full/qpr-dec-2010 18/43
14
However, over the past few years, lending to SMEs
has consistently declined along with its share in
banks’ total loan portfolio, mainly due to rising
interest cost and crippling power shortages. Banks’
declining interest in this segment has primarily been
on account of higher infection rate (NPLR) forSMEs which reached 28 percent by Dec-10 against
9.2 percent in Dec-07. However, part of the rise in
NPLR is simply because of declining amount of
loans extended to SMEs.
Likewise, consumer finance has also been on a
consistent decline as NPLs have been on a rise.
Infection ratio has deteriorated from 4.4 percent in
Dec-07 to 16.9 percent by Dec-10, dampening
banks’ appetite for consumer credit ( Figure 2.1.6 ).
2.2: Market and Liquidity Risk
Patterns in T-Bill auctions signal banks’
interest in short tenor securities
To curb inflationary pressures, fuelled by relentless
government borrowing from State Bank, policy rate
was increased by 100bps during the quarter,
staggered in two stages of 50 bps each12. This
shifted the yield curve upwards, with higher increasein longer term maturities (Figure 2.2.1).
Specifically, PKRV rates of 3 months, 1 year and 10
year maturities increased by around 78, 103 and
85bps points respectively during the quarter.
In view of a rising interest rate scenario, banks
appeared more inclined to lock their funds in short
term maturities. Expectations of higher inflation
and interest rates were evident from the bidding
patterns of T-Bill auctions as bids for 12-months T-
bills significantly dropped while those of 3-months
T-bills surged ( Figure 2.2.2 ). In case of long term
securities (PIBs), while banks were bidding,
government partially accepted these bids during Q4.
0
102030405060708090100
1 1 - F e b - 1 0
1 1 - M a r - 1 0
8 - A p r - 1 0
6 - M a y - 1 0
3 - J u n - 1 0
1 5 - J u l - 1 0
1 2 - A u g - 1 0
9 - S e p - 1 0
7 - O c t - 1 0
4 - N o v - 1 0
2 - D e c - 1 0
3 0 - D e c - 1 0
3M 6M 12M
Figure 2.2.2: Tenor -wise Offers in T-bill
%
0246810
12141618
050
100150200250
300350400450
Dec-07 Dec-08 Dec-09 Sep-10 Dec-10
Figure 2.1.6: Trends in Consumer Finance
NPLs Loans
NPLR Share in Total Loans
bil lio n Rupees %
12
13
14
15
3m 6m 1y 3y 5y 10y 15y 20y
Sep-10 Dec-10
Figure2.2.1: Shift in Yield Curve
%

8/3/2019 QPR-Dec-2010
http://slidepdf.com/reader/full/qpr-dec-2010 19/43
15
The yield spread between the indicative long term
rate of 10-year and short term rate of 3-months,
while still positive, exhibited a declining trend
during the quarter ( Figure 2.2.3 ). This squeeze in
spread offered lower incentive for market players to
take long term positions and explain banks’ greaterappetite for short term securities.
Reporting conventions make gap for short
maturities appear negative…
Out of short term maturities, gap (between risk
sensitive assets and liabilities) for less-than-a-month
band followed an established pattern of remaining
strongly negative ( Figure 2.2.4 ). As a matter of
common practice, banks’ place high percentage of
their non-contractual deposits (current and saving)in short term bucket which substantially increases
liabilities in these bands, resulting in a negative
maturity gap. This phenomenon is evident from
three month maturity gap of PSCBs which is
significantly large owning to higher amount of
placement of their non-contractual deposits in
short-time bucket, whereas, for the longer-term
maturities, the gap generally stayed positive. In
order to address this issue and improve reporting of
maturity gaps, SBP has issued new guidelinesrequiring banks to report their non-contractual
maturities as per expected maturities based on
objective and systemic behavioral study 13.
Recovery in current account helps exchange
rate improve
During Q4-CY10, current account turned surplus
(US$ 613 million) for the first time since Q3-CY05.
Impressive recovery in current account was driven
primarily by a robust growth in exports and strong inflows of remittances. This took pressure off the
exchange rate, as PKR/USD rate during the quarter
gradually appreciated by 57 paisas to come down to
12 SBP increased its policy rates by 50 bps w.e.f September 29 and then again by 50 bps w.e.f November 30, 2010.13 See BSD Circular No 03 of 2011.
-15% -10% -5% 0% 5% 10% 15% 20%
> 1m
1m > 3m
3m > 6m
6m > 1y
1y > 5y
> 5y
All CBs FBs LPBs PSCBs
Figure 2.2.4: Risk Sensitive GAP Analysis
% of total assets
81.582.082.583.083.584.084.585.085.586.086.587.0
0.000
0.001
0.002
0.003
0.004
0.005
S e p - 0 9
N o v - 0 9
J a n - 1 0
M a r - 1 0
M a y - 1 0
J u l - 1 0
S e p - 1 0
N o v - 1 0
J a n - 1 1
Coefficient of Variance Rs/$ Exchange Rate (rhs)
Figure 2.2.5: Exchange Rate Trends & VolatilityRupees
10
11
1213
14
15
16
17
2 - J a n - 0 9
2 - M a r - 0 9
2 - M a y - 0 9
2 - J u l - 0 9
2 - S e p - 0 9
2 - N o v - 0 9
2 - J a n - 1 0
2 - M a r - 1 0
2 - M a y - 1 0
2 - J u l - 1 0
2 - S e p - 1 0
2 - N o v - 1 0
2 - J a n - 1 1
10-Year PKRV 3-months
Figure 2.2.3: Yield Spread between 3m & 10y PKRV Rates
%

8/3/2019 QPR-Dec-2010
http://slidepdf.com/reader/full/qpr-dec-2010 20/43
16
Rs. 85.7, compared to a depreciation of 82 paisas in
the previous quarter ( Figure 2.2.5 ).
Healthy inflows helped banking system keep an
overall long position, contrary to a predominantly
short position in Sep-10 quarter. Further, in thebackdrop of increasing commodity prices in
international markets, particularly of crude oil,
banks also expected future demand for dollars for
payments against oil imports14 ( Figure 2.2.6 ). This
trend to generally hold long position in FX
continued in the first two months of CY11 as well.
Equity market turned bullish…
The equity market benefited significantly from the
sustained foreign inflows in the stock market
coupled with announcements of better corporate
earnings. Furthermore, the expected launch of the
much-awaited leverage product (Margin Trading
System) also boosted the benchmark KSE-100
index by 20.1 percent in Q4-CY10 ( Figure 2.2.7 ).
With the prevailing bullish run in Q4, the banks
booked net surplus of Rs 5.4 billion on revaluation
of their equity portfolio against Rs 19.3 million
booked in Sep-10 quarter.
… with banks’ exposure slightly up
Anticipating a higher return in stocks, the banks’
investments in the equity market also jumped up by
12.9 percent, with their share as percent of bank
capital increasing from 11.8 percent in Q3 to 12.5
percent in Q4. In monetary terms, the increase in
investments has been more pronounced in the
medium and small sized banks (asset-wise ranked
11-29) while, the share of specialized and top 10
banks observed a reduction in its equity investment
to bank capital ratio ( Table 2.2.1 ).
14 In recent years, oil imports have typically accounted for around 28% of total import bills.
8.08.59.09.510.010.511.011.512.012.5
1 - O
c t - 0 9
1 - N o v - 0 9
1 - D e c - 0 9
1 - J a
n - 1 0
1 - F e
b - 1 0
1 - M a r - 1 0
1 - A p r - 1 0
1 - M a y - 1 0
1 - J u
n - 1 0
1 - J
u l - 1 0
1 - A u
g - 1 0
1 - S e p - 1 0
1 - O
c t - 1 0
1 - N o v - 1 0
1 - D e c - 1 0
Figure 2.2.7: KSE-100 Index Trends
thousands
(150)
(100)
(50)
-
50
100
150
200
2 - J u l - 1 0
1 6 - J u l - 1 0
3 0 - J u l - 1 0
1 3 - A u g - 1 0
2 7 - A u g - 1 0
1 0 - S e p - 1 0
2 4 - S e p - 1 0
8 - O c t - 1 0
2 2 - O c t - 1 0
5 - N o v - 1 0
1 9 - N o v - 1 0
3 - D e c - 1 0
1 7 - D e c - 1 0
3 1 - D e c - 1 0
1 4 - J a n - 1 1
2 8 - J a n - 1 1
1 1 - F e b - 1 1
2 5 - F e b - 1 1
Figure 2.2.6: Average Daily NOP of all Banks
mill ion USD
Table 2.2.1: Investments in Shares by the Banking System
Amount % of Capital Amount
% of
Capital
Top 5 42.2 11.2 45.9 11.7
Banks 6-10 10.4 9.2 9.3 7.9
Banks 11-20 21.1 23.5 27.2 27.3
Banks 21-29 1.8 4.8 2.9 6.0
All Local Banks 75.62 12.23 85.3 12.9
Foreign Banks 0.1 0.2 0.1 0.2
All Commercial Banks 75.68 11.55 85.4 12.3
ALL Banks 77.2 11.8 87.1 12.5
Dec-10
(billion Rupees)
Sep-10

8/3/2019 QPR-Dec-2010
http://slidepdf.com/reader/full/qpr-dec-2010 21/43
17
Higher investments bolster liquidityindicators...
Banks’ liquidity position over the quarter remained
quite comfortable, as banks continued to build
excess liquid reserves. In particular, liquid assets
registered a growth of 12.2 percent during thequarter (YoY growth of 18.4 percent).
Due to ongoing tight monetary policy stance and
soaring government borrowings, coupled with
heightened credit risk, bulk of banks funds went
into shorter term risk-free govt. securities. This
prompted share of government securities in overall
investments to rise from 70.4 percent in Sep-10 to
72.9 percent in Dec-10, further pushing up the share
of liquid assets in total assets ( Figure 2.2.8 ).
Consequently, excess liquidity (required minus held
by banks) continued to rise ( Figure 2.2.9 ). Another
indicator of sufficient liquidity in the market was
consistently declining trend in net injections. In fact,
SBP resorted to net mop-up of Rs. 286 billion
during the quarter to keep money supply in line with
its overall policy objectives, in marked contrast with
net injections of Rs. 420 billion in Q3-CY10.
30
35
40
0.0
0.5
1.0
1.5
2.0
2.5
3.0
Sep-09 Dec-09 Mar-10 Jun-10 Sep-10 Dec-10
Liquid Assets Liquid assets to toal assets (LHS)
Figure 2.2.8: Growth in Liquid Assets
% trillion Rupees
20.5
21.0
21.5
22.0
22.5
23.0
23.5
24.0
2 4 - S e p - 1 0
1 - O c t - 1 0
8 - O c t - 1 0
1 5 - O c t - 1 0
2 2 - O c t - 1 0
2 9 - O c t - 1 0
5 - N o v - 1 0
1 2 - N o v - 1 0
1 6 - N o v - 1 0
2 6 - N o v - 1 0
1 2 - M a r - 1 0
1 2 - O c t - 1 0
1 5 - D e c - 1 0
2 4 - D e c - 1 0
3 1 - D e c - 1 0
7 - J a n - 1 1
Excess L iquidity as %age of applicable TDL
Figure 2.2.9: Excess Liquidity (held-required)%

8/3/2019 QPR-Dec-2010
http://slidepdf.com/reader/full/qpr-dec-2010 22/43
18
Chapter 3: Soundness and Resilience of the Banking System
Banks profits increased by 23.1 percent during 2010, though continued to remain concentrated in big five
banks. Profits were driven by higher interest income, particularly from government papers, and lower
provisions on account of FSV benefits. Solvency profiles, specifically of some smaller banks, improved too.
While banks were mostly compliant with CAR, enhanced MCR of Rs. 7 billion remained a challenge. Resultsof stress tests indicate that banking system in general is resilient against shocks emanating from business
and economic environment.
3.1: Profitability
Banks’ profits rise above CY07 level
The banking system witnessed a healthy growth of
23.1 percent (YoY) in profits despite the threats
emanating from the deteriorating quality of its assets
( Figure 3.1.1 ). Profits were driven by significantgrowth in the interest income as well as by
relaxation in the FSV for provisioning which eased
the banks’ expenses, helping banks to post profits in
excess of Rs. 111.2 billion.
Besides the conventional measure of profitability
(pre-tax profits), an alternative set of indicators (P1
and P2) that take into account the relative
performance with respect to the size of assets
highlights a mix trend of bank s’ earnings15. The
ratio, P1 deteriorated marginally in Q4-CY10 onaccount of a much proportional increase in interest
expenses whereas P2 showed improvement due to
lower provisioning because of FSV benefit. In terms
of soundness indicators, both the pre-tax Return on
Assets (ROA) and Return on Equity (ROE) of the
banking sector inched up to reach its highest level
since Dec-08, though still significantly lower than
CY-07 level ( Figure 3.1.2).
15 Alternative measures of profitability include:
P1=((interest earned + other income – interest expense – other expense)/ average assets)*100P2=((interest earned + other income – interest expense – other expense
– provisions)/ average assets)*100
0.0
0.5
1.0
1.5
2.0
2.5
3.0
0
5
10
15
20
25
Dec-07 Dec-08 Dec-09 Sep-10 Dec-10
ROE ROA
Figure 3.1.2: Profitability Indicators (Pre-Tax)
%ROA%ROE
-
20
40
60
80
100
120
2.0
2.5
3.0
3.5
4.0
4.5
5.0
Dec-07 Dec-08 Dec-09 Dec-10
Profits (Pre-Tax) P1 (LHS) P2 (LHS)
Figure 3.1.1: Banking Sector Profitability
% billi on Rupees

8/3/2019 QPR-Dec-2010
http://slidepdf.com/reader/full/qpr-dec-2010 23/43
19
…and continue to remain highly concentrated in
Top 5 banks
The Top 5 banks, with 51 percent share in total
asset of the banking system, contributed towards 95
percent of the total pre-tax profits of the industry 16
.Of the remaining 35 banks, 17 booked net losses
and remaining 18 banks contributed only 5 percent
in the total earnings. In terms of the key profitability
indicators, the top 5 banks exhibited the highest
ROA and ROE ratios followed by the next tier of
banks i.e. top 6-10 banks ( Table 3.1.1 ).
Profits rise with higher returns from
government securities
The significant growth in the banking profits hasmainly originated from the net interest income (NII)
which constituted 91 percent of net income for
Q417. The net interest income, despite rising level of
delinquencies and low return on advances, still
managed its upward trend mainly due to rising
proportion of interest earned from government
securities. Return on government papers
contributed as much as 34.5 percent of banks’ gross
interest income earned during CY10, compared to
30.5 and 28.8 percent for CY09 and CY08
respectively ( Figure 3.1.3 ). Further, government
borrowings from the banking sector, particularly for
commodity financing, provided banks the return
which was well above the risk free rate.
On the other hand, non-interest income has
remained virtually stagnant, hovering around Rs. 95
to 99 billion since CY08 ( Figure 3.1.5 ). Major part
of non-interest income was contributed by fee
based income from banking services, which has
been fairly stagnant as E-banking solutions havereduced banks’ margins.
16 The share of top 5 banks in pre-tax profits of the banking system was 102 percent in CY09 and 96 percent in CY08.17 Net income = net interest income + non-interest income.
0
20
40
60
80
100
120
Dec-07 Dec-08 Dec-09 Sep-10 Dec-10
Other Deal ing FX Dividend Income Commissions and Fees
Figure 3.1.5: Non Interest incomebillion Rupees
050
100
150
200
250
300
350
400
450
Dec-07 Dec-08 Dec-09 Sep-10 Dec-10
Non interest Income Net Interest Income
Figure 3.1.3: Income Components
billi on Rupees
2526272829303132333435
0102030405060708090100
Dec-08 Dec-09 Dec-10
Placements Investments
Advances Govt. interest (LHS)
Figure: 3.1.4: Shares in Interest Income earned
%%
Table 3.1.1: Concentration of Earings and Pr ofitablity
Dec-10
(In percent)
ROA
(Before Tax)
ROE
(Before Tax)
ROA
(After Tax)
ROE
(After Tax)
Top 5 banks 3.1 28.6 1.9 17.5
Top 5 to 10 banks 0.9 12.0 0.6 8.0
Top 11 to 20 banks (0.7) (7.2) (0.6) (6.0)
21-30 banks (2.0) (10.9) (1.7) (9.7) All 30 banks 1.7 16.5 1.0 9.7
FBs 0.3 2.7 0.1 1.5
SBs 2.4 0.0 1.5 0.0
All Banks 1.7 16.7 1.0 9.8

8/3/2019 QPR-Dec-2010
http://slidepdf.com/reader/full/qpr-dec-2010 24/43
20
….and lower provisions thanks to FSV benefit
Rising credit risk over the last few years has been
eating up much of the profits of the banking system.
However, introduction of FSV benefit since 2009
has eased the effect of provisions on bank expenses,as share of provisions in net interest income has
dropped significantly ( Figure 3.1.6 ). On the
downside, lower provisions due to FSV benefits
have reduced coverage ratio from 71.1 percent in
CY09 to 66.7 percent by Dec-10 (see Figure 2.1.3).
Banks’ administrative expenses respond to
inflationary trend
With an increase in administrative expenses by 10
percent (YoY), the cost to income ratio of thebanking system has marginally deteriorated from
51.8 percent in CY09 to 53 percent during Q4-
CY10 ( Figure 3.1.7 ). The increase in administrative
expenses has been on account of rise in salaries and
overhead expenses, fuelled by inflationary pressures.
Further, interest expenses in form of return on
deposits made a major contribution in total
expenses. Consequently, total expenses increased
during the quarter, causing a marginal decline in NII
to gross income ratio.
3.2: Solvency
Banks solvency profile improved, particularly
of smaller banks
Healthy growth in banking profits in the quarter
under consideration, coupled with accumulation of
the reserves, improved the solvency profile of the
banking sector. The baseline Capital Adequacy Ratio
(CAR) strengthened from 13.8 percent in Sep-10 to14.0 percent in Dec-10 ( Figure 3.2.1 ). This
improvement was on account of enhanced MCR
0
5
10
15
20
25
30
35
Dec-07 Dec-08 Dec-09 Dec-10
Pr ovi si ons to NII Pr ovi si ons to Gross Income
Figure 3.1.6: FSV Benefits%
40
45
50
55
60
65
70
75
80
CY07 CY08 CY09 Dec-10
NII / GI Cost / Income
Figure 3.1.7: Earning Ratios
%
11.0
11.5
12.0
12.5
13.0
13.5
14.0
14.5
CY07 CY08 CY-09 Jun-10 Sep-10 Dec-10
Figure 3.2.1: Capital Adequacy of Banks%

8/3/2019 QPR-Dec-2010
http://slidepdf.com/reader/full/qpr-dec-2010 25/43
21
requirements of Rs. 7 billion set by SBP18 as well as
banks’ lower risk appetite.
There has been considerable improvement in the
capital structure of smaller banks (21-29 in terms of
share in total assets) ( Table 3.2.1 ). This has beendue to establishment of (and thus capital injection
in) a state-owned bank by the government and three
merger activities19. Further, with the reduction in
number of foreign banks, while their level of capital
and RWA fell during the quarter, their CAR
marginally improved from 23.9 percent to 24.6
percent.
However, despite an increase in the capital base of
top 20 banks, their CAR and Tier-1 ratios
deteriorated as increase in risk weighted assets of these banks was more pronounced during Dec-10
quarter.
Quality of bank capital further strengthened….
Apart from 6.9 percent increase in the capital base
of banking system during Q4, the quality of capital
also improved. With addition of Rs. 39 billion to
Tier-1 capital, its share in total capital inched up
from 83.4 to 84.2 percent ( Figure 3.2.2 ). Much of
the improvement in Tier-1 capital of the banking system was due to an increase in the buildup of un-
appropriated profits and accumulation in the stock
of the general and statutory reserves in the wake of
enhanced MCR requirements set by SBP.
Segment-wise, the public sector banks witnessed
deterioration in their Tier-1 capital level on account
of higher provisioning and accumulated losses. In
case of foreign banks, their capital position
deteriorated (by Rs. 2.3 billion) due to merger of
Albaraka Bank with EGIBL. On the other hand,
large private banks witnessed an improvement in
18 BSD Circular 7 of 2009 has laid out instructions and timeframe to enhance MCR requirements for Banks/DFIs19 The RBS merged into Faysal Bank, and Atlas Bank into Summit Bank and Albaraka Islamic Bank into EGIBL (later named as
Albaraka Bank Pakistan).
Table 3.2.1: Category-Wise Solvency Ratios
Capital to Assets
Sep-10 Dec-10 Sep-10 Dec-10 Sep-10 Dec-10
Top 5 16.3 16.1 13.4 13.4 11.3 10.3
6 to 10 8.8 8.9 6.2 6.7 7.4 5.0
11 to 20 13.4 12.1 12.1 11.2 9.1 8.5
21 to 29 14.4 24.1 14.7 23.8 11.7 13.2
All 29 14.0 16.0 11.7 14.7 10.0 9.7
FBs 23.9 24.6 23.5 24.3 14.4 14.8
SBs 2.2 4.6 (3.4) (0.9) 0.3 3.9
Industry 13.8 14.0 11.6 11.8 9.9 9.7
Capital to RWA Tier 1 to RWA
0
100
200
300
400
500
600
700
Dec-07 Dec-08 Dec-09 Jun-10 Sep-10 Dec-10
Tier 1 Capital Total Capital
Figure 3.2.2: Risk based Capital of Banksbilli on Rupees

8/3/2019 QPR-Dec-2010
http://slidepdf.com/reader/full/qpr-dec-2010 26/43
22
their Tier-1 capital by 5.4 percent on account of
higher un-appropriated profits ( Figure 3.2.3 ).
…but banks are wary of taking risk despite higher
capital
The December quarter witnessed a reasonable
growth in the banks’ advances (5.7 percent QoQ),
increasing the risk weighted assets (RWA) of the
banking system by 5.9 percent. Despite relatively
stronger growth in capital (6.9 percent), the banks
were cautious to venture into risky lending.
Burgeoning borrowing needs of the government
with consequent supply of risk-free securities at
attractive rates provided additional excuse for
banks’ lack of risk -appetite. Consequently, share of
banks’ RWAs in total assets remained significantly lower than CY07 level ( Figure 3.2.4 ).
The credit risk weighted assets (CRWA), with 79.5
percent share, were the leading component of
aggregate RWA. The banks’ interest in equity and
interest exposures marginally enhanced their overall
market risk exposure which witnessed a growth in
its share to 6.1 percent during the quarter ( Table
3.2.2 ). Further, share of operational risk weighted
assets (ORWA) slightly inched up during Q4 on
account of rise in banking profits20.
Many banks struggle to meet growing MCR
Because of deterioration in asset quality since 2008,
coupled with the lack of interest by foreign
shareholders, a number of banks have been unable
to meet regulatory minimum capital requirement
(MCR). Data for paid-up capital of the banks (free
of losses) reveals that 15 banks were falling short of
MCR of Rs. 6 billion during the quarter. With MCR
of Rs. 7 billion from 31st December, 2010, 19 banks
fell short of enhanced MCR ( Figure 3.2.5 ). On the
20 The operational risk weighted assets are calculated under the Basic Indicator Approach of Basel II Framework that requires thebanks to set ORWA equal to an average of three years of annual gross income. So rising gross income would result in higher capitalcharge for operational risk.
58
60
62
64
66
68
70
72
74
76
Dec-07 Dec-08 Dec-09 Sep-10 Dec-10
Figure 3.2.4: RWA to Assets of Commercial Banks
%
Table 3.2.2: Risk Weighted Assets
Amount Share Amount Share Amount Share
CRWA 3,443 81.5 3,437 80.0 3,621 79.5
MRWA 192 4.6 254 5.9 277 6.1
ORWA 588 13.9 607 14.1 655 14.4
Total (RWA) 4,224 100 4,298 100 4,553 100
(amount in billion Rupees, share in percent)
Dec-09 Sep-10 Dec-10
-30
-20
-10
0
10
20
30
Tier -1 Growth Provi sions UN-Prof its Reserves Pa id-up
PSCB LPB FB ALL
Figure 3.2.3: Improvements in Tier-1 Capital%

8/3/2019 QPR-Dec-2010
http://slidepdf.com/reader/full/qpr-dec-2010 27/43
23
other hand, six banks were MCR non-compliant, as
they failed to meet CAR requirement of 10 percent
( Table 3.2.3 ). However, these non-compliant banks
are already in the process of restructuring.
Collectively, 32 banks with market share of around
94 percent had their CARs exceeding 10 percent,reflecting an overall healthy and resilient banking
system.
3.3: Resilience of the Banking System
Strong capital base provides sufficient resilience
against major shocks
The sensitivity based stress test results on aggregate
banking portfolio for Q4-CY10 highlight a strong
solvency profile sufficient to withstand majorshocks in the credit, market and liquidity risk
factors. Similarly, in case of macroeconomic stress
testing, the average forecasts of NPL to loan ratios
(NPLR) under different stress conditions does not
significantly affect the provision requirements and
hence profitability & capital adequacy of the
banking system.
The credit shocks under sensitivity analysis included
different hypothetical scenarios covering down-
gradation of loan classifications and sector-wiseconcentration etc. Critical infection ratio (C-6),
which is stressed NPLR resulting in complete
erosion of capital of the banking system, came out
around 31.9 percent as against the present level of
actual NPLR at 14.7 percent. It suggests that
deterioration in credit portfolio needs to be almost
twice as bad as its present level to wipe out the
equity of banking system. Second major impact
came from the shock (C5) of 20 percent of
performing loans moving to substandard, 50percent of substandard to doubtful and 50 percent
Table 3.2.3: Distribution of Banks by CAR
(In percent)
Total less than 10 10 to 15 Over 15
Dec-08 40 9 10 21
Dec-09 40 6 15 19
Sep-10 40 6 14 20
Dec-10 38 6 12 20
1 1
3
8
4
6 6
2 2
1 1
0
1
2
3
45
6
7
8
9
-28 -1 1 3 5 < 7 9 11 13 15 17 19 21 … 39
Figure 3.2.5: Distribution of Bank Capital
billi on Rupees
Banks
1
2
-1
4
9
14C1
C2
C3
C4
C5
C6
Figure 3.2.6: Credit Risk Shocks
CAR before Shock CAR after Shock Benchmark

8/3/2019 QPR-Dec-2010
http://slidepdf.com/reader/full/qpr-dec-2010 28/43
24
of doubtful to loss as industry CAR deteriorated by
0.9 percent ( Figure 3.2.621 ).
In case of the market risk that accounts for only 6.1
percent of banking sector RWA, the sensitivity
analysis applied on the presumed adversemovements in the interest rates and the exchange
rates did not significantly deteriorated the CAR of
the banks ( Figure 3.2.7 ). The market risk shocks
included steepening and flattening of the yield curve
by at least 300bps increase in interest rates,
depreciation and appreciation of USD/PKR rate
and a rather extreme fall by 50 percent in the equity
market (KSE).
Similarly the liquidity stress tests on individual bank
portfolio reveal a healthy picture of the banking system as nearly all the banks remained liquid in the
stress tests despite the assumption of significant
withdrawals of bank deposits by 5 percent
continuously for five consecutive days. However, in
case of combined scenarios, (credit, market and
liquid) the high severity of shocks identified 11
banks unable to meet CAR requirements.
The macroeconomic stress test, using the explicit
relationship between the banking sector NPLR and
macroeconomic aggregates highlight the worsening
of asset quality in response to worsening of
projected macroeconomic performance22.
In line with the macroeconomic projections
produced by the CPV model, the forecasted NPLR
for Q1-CY11 is 15.31 percent ( Table 3.2.4 ).
However, in case of extreme macroeconomic
projections, the interest rate (LR) shock can further
erode the asset quality to 21.09 percent with 0.5
percent probability.
21 In the graph, blue line indicates before shock CAR of the industry, while red line indicates aftershock CAR for each scenario. Thecloser the red line is to the point of origin, the severe the impact of a given scenario.22 The macroeconomic stress testing has been conducted by using the Credit Portfolio View (CPV) Model. For details, see QPR of September 2009.
Baseline LR LSM CPI All
Average 15.31 16.94 15.57 15.75 18.7
75 P* 16.42 18.03 16.67 16.86 19.72
90 P 17.41 19.02 17.67 17.88 20.65
95 P 18.03 19.59 18.22 18.49 21.19
99 P 19.1 20.69 19.29 19.59 22.26
99.5P 19.5 21.09 19.65 19.97 22.61
P* represents percentile
Table 3.2.4: Simulated NPL Ratios (percent)
-1
4
9
14
IR 1
IR 2
ER 1
ER 2
EQ 1
EQ 2
Figure 3.2.7: Market Risk Shocks
CAR be fore Shock CAR afte r Shock Be nchmark

8/3/2019 QPR-Dec-2010
http://slidepdf.com/reader/full/qpr-dec-2010 29/43
25
Similarly, simulations derived from the CPV model
indicate a major shift in NPLR from the baseline
(no shock scenario) to adverse movement in
macroeconomic aggregates projected for Q1-CY11
( Figure 3.2.8 ) indicating the vulnerability of NPLR
to sluggish macroeconomic performance.
0
100
200
300
400
500
600
700
8 11 14 17 20 23
Baseline LR LSM CPI ER ALL
Figure 3.2.8: Simulated NPL Ratios
simulations
NPLR

8/3/2019 QPR-Dec-2010
http://slidepdf.com/reader/full/qpr-dec-2010 30/43
26
Annexes

8/3/2019 QPR-Dec-2010
http://slidepdf.com/reader/full/qpr-dec-2010 31/43
27
Annex-I
Group-wise Balance Sheet and Income Statement of Banks
December 31, 2010(Amount in million Rupees )
Financial Position PSCB LPB FB CB SB All Banks
ASSETS
Cash & Balances With Treasury Banks 101,098 421,804 32,795 555,697 3,768 559,465
Balances With Other Banks 45,540 122,023 4,079 171,642 13,565 185,207
Lending To Financial Institutions 33,460 149,207 36,480 219,146 - 219,146
Investments - Net 350,702 1,696,712 79,863 2,127,277 14,553 2,141,831
Advances - Net 627,726 2,562,263 65,627 3,255,617 93,174 3,348,791
Operating Fixed Assets 31,668 185,426 2,208 219,302 4,925 224,227
Deferred Tax Assets 17,784 48,268 5,878 71,930 618 72,548
Other Assets 149,992 217,902 6,893 374,787 11,653 386,440
TOTAL ASSETS 1,357,970 5,403,606 233,823 6,995,399 142,256 7,137,654
LIABILITIES
Bills Payable 7,108 60,179 5,555 72,841 376 73,218
Borrowings From Financial Institution 35,509 416,729 15,475 467,712 82,852 550,565
Deposits And Other Accounts 1,087,745 4,188,197 156,331 5,432,273 17,693 5,449,966
Sub-ordinated Loans - 51,091 - 51,091 3,405 54,497
Liabilities Against Assets Subject To Finance Lease 121 22 - 142 22 165
Deferred Tax Liabilities 3,334 7,849 166 11,349 269 11,618
Other Liabilities 73,019 171,684 21,598 266,302 34,177 300,478
TOTAL LIABILITIES 1,206,836 4,895,750 199,125 6,301,711 138,795 6,440,506
NET ASSETS 151,134 507,855 34,698 693,687 3,461 697,148
NET ASSETS REPRESENTED BY:
Share Capital 34,030 295,257 33,847 363,134 15,507 378,641
Reserves 38,046 118,836 93 156,974 7,314 164,288
Unappropriated Profit 57,259 51,887 1,054 110,200 (23,312) 86,888
Share Holders' Equity 129,335 465,979 34,994 630,308 (491) 629,817
Surplus/Deficit On Revaluation Of Assets 21,799 41,876 (296) 63,380 3,952 67,331
TOTAL 151,134 507,855 34,698 693,687 3,461 697,148
PROFIT AND LOSS STATEMENT
Mark-Up/ Return/Interest Earned 112,118 489,764 20,576 622,458 10,364 632,822
Mark-Up/ Return/Interest Expenses 68,798 260,724 10,435 339,958 4,592 344,550
Net Mark-Up / Interest Income 43,320 229,040 10,140 282,500 5,772 288,272
Provisions & Bad Debts Written Off Direct ly/(Reversals) 10,749 55,012 2,608 68,369 1,422 69,791
Net Mark-Up / Interest Income After Provision 32,570 174,028 7,533 214,130 4,351 218,481
Fees, Commission & Brokerage Income 10,392 32,666 1,841 44,899 66 44,966
Dividend Income 1,634 5,026 1 6,661 106 6,766
Income From Dealing In Foreign Currencies 2,287 13,895 3,818 20,000 0 20,000
Other Income 6,438 15,636 (1,166) 20,909 5,142 26,051
Total Non - Markup / Interest Income 20,752 67,223 4,494 92,469 5,314 97,783
53,322 241,251 12,026 306,599 9,665 316,264
Administrative Expenses 30,540 155,007 9,272 194,818 6,541 201,360
Other Expenses 260 2,839 72 3,171 11 3,182
Total Non-Markup/Interest Expenses 30,800 157,846 9,343 197,989 6,553 204,542
Profit before Tax and Extra ordinary Items 22,522 83,405 2,683 108,610 3,112 111,722
Extra ordinary/unusual Items - Gain/(Loss) - - 449 449 12.67 461.65
PROFIT/ (LOSS) BEFORE TAXATION 22,522 83,405 2,234 108,161 3,099 111,261
Taxation 10,503 33,227 882 44,612 1,224 45,835
PROFIT/ (LOSS) AFTER TAX 12,019 50,179 1,352 63,550 1,876 65,425

8/3/2019 QPR-Dec-2010
http://slidepdf.com/reader/full/qpr-dec-2010 32/43
28
Annex-II
Financial Soundness Indicators
(In percent)
2007 2008 2009 Mar-10 Jun-10 Sep-10 Dec-10
Risk Weighted CAR
Public Sector Commercial Banks 16.1 13.4 15.1 13.7 13.9 12.5 12.8
Local Private Banks 11.8 11.9 13.9 13.8 14.0 14.1 14.2
Foreign Banks 14.6 21.8 23.0 22.4 22.7 23.9 24.6
Commercial Banks 12.8 12.6 14.5 14.1 14.3 14.2 14.2
Specialized Banks (6.2) (4.9) (1.5) (0.5) (1.5) 2.2 4.7
All Banks 12.3 12.2 14.0 13.7 13.9 13.8 14.0
Tier 1 Capital to RWA -
Public Sector Commercial Banks 12.2 10.9 12.6 11.6 11.9 10.4 10.7
Local Private Banks 9.9 10.0 11.4 11.4 11.7 11.8 12.0
Foreign Banks 14.0 21.3 22.5 22.0 22.3 23.6 24.3
Commercial Banks 10.5 10.6 12.0 11.8 12.1 12.0 12.1
Specialized Banks (12.5) (10.1) (5.8) (5.3) (5.6) (3.4) (0.9)
All Banks 10.0 10.1 11.6 11.4 11.7 11.6 11.8
Capital to Total Assets
Public Sector Commercial Banks 13.7 10.7 11.3 11.1 10.0 11.0 11.1Local Private Banks 10.2 10.0 9.9 10.2 9.9 9.6 9.4
Foreign Banks 11.2 14.5 14.8 14.0 14.6 14.4 14.8
Commercial Banks 10.9 10.3 10.4 10.5 10.1 10.1 9.9
Specialized Banks (5.4) (3.2) (1.7) (0.9) (1.3) 0.3 2.4
All Banks 10.5 10.0 10.1 10.3 9.9 9.9 9.8
NPLs to Total Loans
Public Sector Commercial Banks 8.4 16.3 16.9 17.6 16.5 17.6 22.9
Local Private Banks 6.5 8.7 11.1 11.6 11.6 12.6 12.2
Foreign Banks 1.6 2.9 6.7 7.3 8.6 9.2 9.8
Commercial Banks 6.7 9.9 12.1 12.7 12.5 13.6 14.3
Specialized Banks 34.3 28.8 25.5 24.2 24.9 27.9 28.4
All Banks 7.6 10.5 12.6 13.1 12.9 14.0 14.7
Provision to NPLs
Public Sector Commercial Banks 89.0 66.9 67.8 68.0 72.3 69.3 54.1
Local Private Banks 88.5 70.2 71.0 72.1 74.1 72.2 72.6
Foreign Banks 157.0 81.9 75.2 78.1 78.7 80.5 86.5 Commercial Banks 89.1 69.3 70.1 71.0 73.7 71.5 66.9
Specialized Banks 68.6 72.4 65.7 68.1 66.5 65.1 64.2
All Banks 86.1 69.6 69.9 70.9 73.2 71.1 66.7
Net NPLs to Net Loans
Public Sector Commercial Banks 1.0 6.1 6.1 6.4 5.2 6.2 12.0
Local Private Banks 0.8 2.7 3.5 3.5 3.3 3.9 3.7
Foreign Banks (0.9) 0.5 1.8 1.7 2.0 1.9 1.4
Commercial Banks 0.8 3.3 4.0 4.0 3.6 4.3 5.2
Specialized Banks 14.0 10.0 10.5 9.3 10.0 11.9 12.5
All Banks 1.1 3.4 4.1 4.2 3.8 4.5 5.4
Net NPLs to Capital
Public Sector Commercial Banks 3.4 30.3 27.4 28.8 24.3 27.6 49.9
Local Private Banks 4.1 15.9 17.4 17.2 15.9 19.1 18.6
Foreign Banks (4.1) 1.6 4.4 4.1 4.5 4.4 4.4
Commercial Banks 3.7 17.9 18.8 18.8 17.0 20.1 24.6
Specialized Banks - - - - - - -
All Banks 5.6 19.4 20.4 20.2 18.4 21.8 26.1
Return on Assets (Before Tax)
Public Sector Commercial Banks 3.5 0.6 1.5 1.9 1.8 1.6 1.8
Local Private Banks 2.0 1.3 1.3 1.9 1.8 1.7 1.7
Foreign Banks 1.5 0.0 (0.3) 0.1 0.6 0.3 0.3
Commercial Banks 2.3 1.1 1.3 1.8 1.8 1.6 1.6
Specialized Banks 1.4 3.2 3.1 2.0 2.6 1.7 2.4
All Banks 2.2 1.2 1.3 1.8 1.8 1.6 1.7
ASSET QUALITY
EARNINGS
Indicators
CAPITAL ADEQUACY

8/3/2019 QPR-Dec-2010
http://slidepdf.com/reader/full/qpr-dec-2010 33/43
29
Annex-II
Financial Soundness Indicators
(In percent)
2007 2008 2009 Mar-10 Jun-10 Sep-10 Dec-10
Return on Assets (After Tax)Public Sector Commercial Banks 2.5 0.5 1.3 1.3 1.2 1.1 0.9
Local Private Banks 1.4 0.9 0.9 1.2 1.1 1.0 1.0
Foreign Banks 0.7 0.3 (0.3) 0.1 0.4 0.1 0.1
Commercial Banks 1.6 0.8 0.9 1.2 1.1 1.0 1.0
Specialized Banks 0.71 1.8 1.2 0.1 0.6 0.0 1.5
All Banks 1.5 0.8 0.9 1.1 1.1 1.0 1.0
ROE (Avg. Equity& Surplus) (Before Tax)
Public Sector Commercial Banks 27.2 5.2 13.3 16.7 16.8 15.1 16.3
Local Private Banks 20.4 12.9 13.2 18.8 18.2 16.8 16.8
Foreign Banks 13.1 0.0 (2.4) 0.7 3.8 2.7 2.7
Commercial Banks 21.8 10.6 12.4 17.4 17.1 15.8 16.2
Specialized Banks - - - - - - -
All Banks 22.6 11.4 13.2 17.8 17.7 16.2 16.7
ROE (Avg. Equity &Surplus) (After Tax)
Public Sector Commercial Banks 19.5 4.4 11.4 11.3 11.2 10.5 8.7
Local Private Banks 13.8 8.5 8.6 11.7 11.2 10.2 10.1
Foreign Banks 6.0 2.2 (2.3) 0.4 2.5 1.5 1.5
Commercial Banks 15.0 7.3 8.6 11.0 10.7 9.9 9.5
Specialized Banks - - - - - - -
All Banks 15.4 7.8 8.9 11.1 10.9 9.9 9.8
NII/Gross Income
Public Sector Commercial Banks 65.9 65.4 63.0 68.5 70.0 71.0 67.6
Local Private Banks 70.7 73.2 75.9 75.8 77.2 77.9 77.3
Foreign Banks 59.1 61.3 64.8 72.2 68.4 68.2 69.3
Commercial Banks 69.2 71.2 73.3 74.4 75.6 76.3 75.3
Specialized Banks 42.8 46.6 44.7 57.8 46.6 51.2 52.1
All Banks 68.2 70.3 72.4 74.0 74.7 75.6 74.7
Cost / Income Ratio
Public Sector Commercial Banks 30.2 39.1 47.5 47.4 49.5 51.0 48.1
Local Private Banks 45.4 51.6 50.1 51.2 52.4 53.3 53.3
Foreign Banks 57.0 69.6 77.5 68.0 63.2 64.5 63.8
Commercial Banks 42.8 50.0 50.9 51.2 52.4 53.4 52.8
Specialized Banks 53.2 52.1 61.3 76.2 57.8 61.2 59.1 All Banks 43.2 50.1 51.2 51.8 52.6 53.6 53.0
Liquid Assets/Total Assets
Public Sector Commercial Banks 37.0 30.6 31.1 29.7 33.6 29.4 31.8
Local Private Banks 32.5 26.8 32.3 32.2 33.6 33.8 35.0
Foreign Banks 41.6 45.2 55.0 58.2 58.5 59.6 65.5
Commercial Banks 33.8 28.3 32.9 32.8 34.6 34.0 35.3
Specialized Banks 27.9 24.5 19.8 15.5 17.3 15.9 20.1
All Banks 33.6 28.2 32.7 32.4 34.2 33.6 35.0
Liquid Assets/Total Deposits
Public Sector Commercial Banks 47.1 38.9 40.1 38.0 41.9 37.4 39.7
Local Private Banks 42.9 35.0 43.4 42.7 44.0 43.8 45.1
Foreign Banks 61.1 71.6 82.4 88.3 85.7 86.6 97.9
Commercial Banks 44.3 37.1 44.0 43.4 44.9 44.1 45.5
Specialized Banks 247.7 229.4 167.1 148.9 134.5 157.7 161.4
All Banks 45.1 37.7 44.5 43.7 45.3 44.4 45.9
Advances/DepositsPublic Sector Commercial Banks 60.0 68.4 65.2 63.9 58.3 62.7 57.7
Local Private Banks 70.1 75.1 66.6 65.4 62.7 61.7 61.2
Foreign Banks 75.2 68.9 56.1 51.2 49.6 47.6 47.6
Commercial Banks 73.8 73.6 66.0 64.6 61.4 61.4 59.9
Specialized Banks 507.3 577.0 560.8 669.3 534.5 693.1 526.6
All Banks 69.7 75.2 67.7 66.4 63.0 63.1 61.4
LIQUIDITY
Indicators
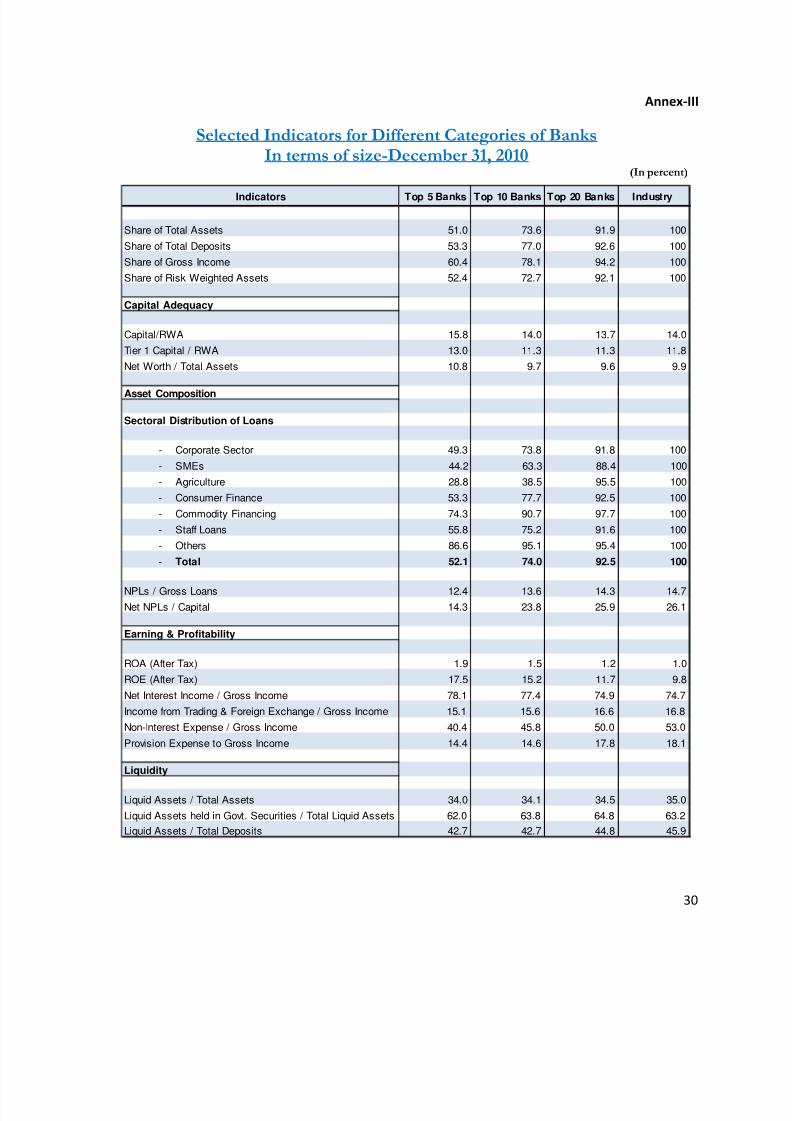
8/3/2019 QPR-Dec-2010
http://slidepdf.com/reader/full/qpr-dec-2010 34/43
30
Annex-III
Selected Indicators for Different Categories of BanksIn terms of size-December 31, 2010
(In percent)
Top 5 Banks Top 10 Banks Top 20 Banks Industry
Share of Total Assets 51.0 73.6 91.9 100
Share of Total Deposits 53.3 77.0 92.6 100
Share of Gross Income 60.4 78.1 94.2 100
Share of Risk Weighted Assets 52.4 72.7 92.1 100
Capital Adequacy
Capital/RWA 15.8 14.0 13.7 14.0
Tier 1 Capital / RWA 13.0 11.3 11.3 11.8
Net Worth / Total Assets 10.8 9.7 9.6 9.9
Asset Composition
Sectoral Distribution of Loans
- Corporate Sector 49.3 73.8 91.8 100
- SMEs 44.2 63.3 88.4 100
- Agriculture 28.8 38.5 95.5 100
- Consumer Finance 53.3 77.7 92.5 100
- Commodity Financing 74.3 90.7 97.7 100
- Staff Loans 55.8 75.2 91.6 100
- Others 86.6 95.1 95.4 100
- Total 52.1 74.0 92.5 100
NPLs / Gross Loans 12.4 13.6 14.3 14.7
Net NPLs / Capital 14.3 23.8 25.9 26.1
Earning & Profitability
ROA (After Tax) 1.9 1.5 1.2 1.0
ROE (After Tax) 17.5 15.2 11.7 9.8
Net Interest Income / Gross Income 78.1 77.4 74.9 74.7
Income from Trading & Foreign Exchange / Gross Income 15.1 15.6 16.6 16.8
Non-Interest Expense / Gross Income 40.4 45.8 50.0 53.0
Provision Expense to Gross Income 14.4 14.6 17.8 18.1
Liquidity
Liquid Assets / Total Assets 34.0 34.1 34.5 35.0
Liquid Assets held in Govt. Securities / Total Liquid Assets 62.0 63.8 64.8 63.2
Liquid Assets / Total Deposits 42.7 42.7 44.8 45.9
Indicators

8/3/2019 QPR-Dec-2010
http://slidepdf.com/reader/full/qpr-dec-2010 35/43
31
Annex-IV
Bank-wise Major StatisticsDecember 31, 2010
(Amount in million Rupees)
S. No. Name of the Banks Assets Advances Deposits Equity
1 National Bank of Pakistan 1,027,376 474,458 832,391 119,843
2 First Women Bank Limited 12,778 6,320 10,195 1,164
3 The Bank of Punjab 256,856 128,645 208,177 10,723
4 The Bank of Khyber 50,747 18,296 36,981 9,339
5 Sindh Bank Limited 10,213 7 1 10,065
1,357,970 627,726 1,087,745 151,134
5 Allied Bank Limited 452,773 253,054 371,284 36,022
6 Bank Alfalah Limited 412,934 207,793 354,040 23,328
7 Askari Bank Limited 315,889 153,361 255,937 16,371
8 Bank Al Habib Limited 303,749 125,773 249,774 15,982
9 Mybank Limited 39,916 20,204 29,479 4,522
10 SAMBA Bank Limited 30,511 12,138 14,872 7,926
11 Atlas Bank Limited 26,322 16,389 19,313 265
12 Faysal Bank Limited 184,756 97,223 129,174 13,019
13 Habib Bank Limited 888,273 436,217 721,069 89,490
14 KASB Bank Limited 58,331 30,411 46,274 2,836
15 Summit Bank Ltd (formerly Arif Habib Bank Limited) 50,037 22,891 42,295 3,738
16 JS Bank Limited 39,294 14,501 26,276 5,748
17 MCB Bank Limited 572,562 254,552 431,372 79,204
18 United Bank Limited 700,335 333,580 550,646 68,324
19 The Royal Bank of Scotland Limited 86,298 38,964 66,134 6,791
20 Habib Metropolitan Bank Limited 252,058 119,767 160,458 20,255
21 BankIslami Pakistan Limited 45,184 18,466 38,196 4,777
23 Soneri Bank Limited 108,826 54,758 82,017 8,978
24 SILKBANK Limited 72,484 44,360 55,706 4,831
25 NIB Bank Limited 167,393 77,325 99,169 16,706
26 Meezan Bank Limited 154,768 46,188 131,070 11,014
27 Dubai Islamic Bank Pakistan Limited 39,887 22,766 31,415 6,047
28 Standard Chartered Bank 322,200 128,683 220,266 51,347
29 Dawood Islamic Bank Limited 17,831 5,622 12,636 4,373
30 Albaraka Islamic Bank B.S.C. 60,996 27,278 49,324 5,963
5,403,606 2,562,263 4,188,197 507,855
31 Citibank N.A. (Pakistan Operations) 97,592 19,244 68,305 9,111
32 Deutsche Bank AG (Pakistan Operations) 17,740 3,245 6,066 5,303
33 HSBC Bank Middle East Limited - (Pakistan Operations) 56,946 22,242 46,461 6,199
34 Oman International Bank S.A.O.G (Pakistan Operations) 4,057 478 848 2,857
35 The Bank of Tokyo-Mitsubishi UFJ Limited (Pakistan Operat ions) 9,044 2,981 2,350 4,701
36 Barclays Bank PLC (Pakistan Operations) 48,444 17,437 32,302 6,528
233,823 65,627 156,331 34,698
37 The Punjab Provincial Cooperative Bank Ltd 14,119 5,757 2,552 7,724
38 Industrial Development Bank of Pakistan 4,214 108 3,313 (28,098) 39 Zarai Taraqiati Bank Limited 117,957 84,798 9,602 21,871
40 SME Bank Limited 5,966 2,511 2,226 1,963
142,256 93,174 17,693 3,461
Total 7,137,654 3,348,791 5,449,966 697,148
Specialized Banks
Public Sector Commercial Banks
Local Private Banks
Foreign Banks

8/3/2019 QPR-Dec-2010
http://slidepdf.com/reader/full/qpr-dec-2010 36/43
32
Annex-V
Results of Stress Tests of Banking SystemDecember 31, 2010
Shock Details
< 0% 0% - 10% > 10%
Pre-Shock Position3 5 32
Credit Risk Shocks < 0% 0% - 10% > 10%
C-120% of performing loans moving to substandard, 50% of substandard to
doubtful, 50% of doubtful to loss. 3 8 29
C-2Tightening of loan classification i.e. All NPLs under substandard
downgraded to doubtful and all doubtful downgraded to loss. 3 5 32
C-3Deterioration in performing loans of the textile sector (30%) directly
downgraded to doubtful category of NPLs.3 8 29
C-450% of consumer loans (credit cards, auto loans, personal loans &consumer durables only) directly classified into doubtful category of NPLs. 3 5 32
C-5Deterioration in performing loans of the SME Sector (25%) and Agri Sector
(25%) downgraded to Doubtful category of NPLs.3 7 30
C-6 Critical Infection Ratio (The ratio of NPLs to Loans where capital wipes out) 3 37 0
Market Risk Shocks< 0% 0% - 10% > 10%
IR-1 Increase in interest rates by 300 basis points. 3 7 30
IR-2Flattening of yield curve by increasing 300, 200 and 100 basis points at the
short, middle and long end respectively.3 6 31
ER-1 Depreciation of Pak Rupee exchange rate by 25% 3 6 31
ER-2 Appreciation of Pak Rupee exchange rate by 5% 3 5 32
EQ-1 Fall in general equity prices by 30%. 3 5 32
EQ-2 Fall in general equity prices by 50%. 3 5 32
Combined Credit & Market Shocks < 0% 0% - 10% > 10%
COMB-1
Increase in General Interest rates by 3%, deterioration in performing loans of
the SME Sector (25%) and Agri Sector (25%) downgraded to Doubtful
category of NPLs, deterioration of loans to the textile sector (30%) directly
downgraded to doubtful category, and fall in equity prices by 30%.
3 12 25
COMB-2
Flattening of yield curve by increasing 300, 200 and 100 basis points at the
short, middle and long end respectively, 20% of performing loans moving to
substandard, 50% of substandard to doubtful, 50% of doubtful to loss., fall in
equity prices by 50%.
3 8 29
Liquidity Risk Shocks 3 Days 4 Days 5 Days
L-1Withdrawal of customer deposits by 2%, 5%, 10%, 10% and 10% for five
consecutive days respectively.0 0 2
Number ofBanks with CAR

8/3/2019 QPR-Dec-2010
http://slidepdf.com/reader/full/qpr-dec-2010 37/43
33
Annex-VI
Group wise Balance Sheet and Income Statement of Islamic Banks/Branches – December 31, 2010
(Amount in million Rupees) Fina ncia l Position Isla mic Ba nks Islamic Ba nking Bra nche s Tota l Isla mic Ba nking
ASSETS
Cash & Balances With Treasury Banks 24,857 11,331 36,188
Balances With Other Banks 21,794 5,431 27,225
Due from Financial Institutions 18,707 550 19,257
Investments - Net 95,353 62,451 157,803
Financing - Net 120,320 60,079 180,399
Operating Fixed Assets 10,087 2,958 13,045
Deferred Tax Assets 2,153 0 2,153
Other Assets 25,395 15,515 40,910
TOTAL ASSETS 318,666 158,315 476,981
LIABILITIES 0 0 -
Bills Payable 3,257 879 4,136
Due to Financial Institution 10,176 8,132 18,308
Deposits And Other Accounts 262,641 127,419 390,060
Sub-ordinated Loans 0 0 -
Liabilities Against Assets Subject To Finance Lease 19 0 19
Deferred Tax Liabilities 32 485 517
Other Liabilities 10,366 7,155 17,521
TOTAL LIABILITIES 286,492 144,070 430,562
NET ASSETS 32,174 14,245 46,419
NET ASSETS REPRESENTED BY: - 0 0 -
Share Capital 32,984 7,923 40,907
Reserves 652 0 653
Unappropriated Profit (2,015) 4,643 2,628
Share Holders' Equity 31,621 12,566 44,188
Surplus/Deficit On Revaluation Of Assets 553 1,679 2,232
TOTAL 32,174 14,245 46,419
PROFIT AND LOSS STATEMENT
Mark-Up Income 23,671 12,710 36,381
Mark-Up Expenses 13,178 6,946 20,124
Net Mark-Up 10,493 5,764 16,257
Provisions & Bad Debts Written Off Directly/(Reversals 2,511 623 3,134
Net Mark-Up After Provision 7,982 5,141 13,123
Fees, Commission & Brokerage Income 1,033 596 1,628
Dividend Income 322 51 374
Income From Dealing In Foreign Currencies 1,726 83 1,809
Other Income 285 366 651
Total Non - Markup 3,367 1,096 4,462
11,348 6,237 17,585
Administrative Expenses 11,003 3,758 14,761
Other Expenses 221 58 280
Total Non-Markup 11,224 3,817 15,041
Profit before Tax and Extra ordinary Items 124 2,420 2,544Extra ordinary/unusual Items -- Gain/(Loss) 0 0 0
PROFIT/ (LOSS) BEFORE TAXATION 124 2,420 2,544
Taxation 278 0 278
PROFIT/ (LOSS) AFTER TAX (154) 2,420 2,266

8/3/2019 QPR-Dec-2010
http://slidepdf.com/reader/full/qpr-dec-2010 38/43
34
Annex-VII
Balance Sheet and Income Statement of DFIsDecember 31, 2010
(Amount in million Rupees)
Financial Position Dec-09 Mar-10 Jun-10 Sep-10 Dec-10
ASSETS
Cash & Balances With Treasury Banks 1,775 1,671 1,745 1,792 1,761
Balances With Other Banks 5,567 2,424 2,186 541 2,545
Lending To Financial Institutions 13,370 9,687 9,825 9,916 8,971
Investments - Net 63,007 65,105 73,154 63,519 64,395
Advances - Net 41,707 42,966 44,943 43,386 45,410
Operating Fixed Assets 3,015 2,979 2,957 2,899 3,046
Deferred Tax Assets 1,180 1,216 1,394 1,458 1,318
Other Assets 4,357 4,280 4,132 5,731 6,814
TOTAL ASSETS 133,978 130,328 140,336 129,241 134,261
LIABILITIES
Bills Payable - - - - -
Borrowings From Financial Institution 51,522 49,238 57,288 45,886 50,306 Deposits And Other Accounts 18,074 16,411 17,580 17,360 15,856
Sub-ordinated Loans - - - - -
Liabilities Against Assets Subject To Finance Lease 30 28 18 16 15
Deferred Tax Liabilities 11 4 - - 51
Other Liabilities 6,636 5,997 7,216 7,504 8,522
TOTAL LIABILITIES 76,273 71,679 82,102 70,766 74,751
NET ASSETS 57,705 58,650 58,235 58,475 59,510
NET ASSETS REPRESENTED BY: - 6,029
Share Capital 46,769 48,278 48,278 48,278 48,385
Reserves 8,575 6,986 7,170 7,040 7,211
Unappropriated Profit (426) 1,520 2,135 2,717 2,602
Share Holders' Equity 54,917 56,783 57,583 58,035 58,198
Surplus/Deficit On Revaluation Of Assets 2,788 1,866 651 440 1,312
TOTAL 57,705 58,650 58,235 58,475 59,510
OPERATING POSITION
Mark-Up/ Return/Interest Earned 12,549 3,239 6,786 10,281 13,785
Mark-Up/ Return/Interest Expenses 6,742 1,735 3,620 5,615 7,317
Net Mark-Up / Interest Income 5,807 1,504 3,166 4,666 6,468
Provisions & Bad Debts Written Off Directly/(Reversals) 2,955 (23) (863) 506 790
Net Mark-Up / Interest Income After Provision 2,852 1,527 4,029 4,160 5,678
Fees, Commission & Brokerage Income 211 (6) (755) 291 79
Dividend Income 413 104 168 312 484
Income From Dealing In Foreign Currencies 82 (2) 21 - -
Other Income 1,488 378 361 658 904
Total Non - Markup / Interest Income 2,194 474 (205) 1,260 1,468
5,046 2,001 3,823 5,421 7,146
Administrative Expenses 2,631 693 1,433 2,238 2,878
Other Expenses 102 (24) 4 112 (5)
Total Non-Markup/Interest Expenses 2,734 668 1,437 2,349 2,873
Profit before Tax and Extra ordinary Items 2,312 1,333 2,386 3,071 4,273 Extra ordinary/unusual Items -- Gain/(Loss) 221 - - - -
PROFIT/ (LOSS) BEFORE TAXATION 2,091 1,333 2,386 3,071 4,273
Taxation 630 405 673 920 1,561
PROFIT/ (LOSS) AFTER TAX 1,461 928 1,714 2,151 2,712

8/3/2019 QPR-Dec-2010
http://slidepdf.com/reader/full/qpr-dec-2010 39/43
35
Annex-VIII
Capital Structure and Capital Adequacy Ratios of Banks & DFIsDecember 31, 2010
(Amount in million Rupees)
All Banks
and DFIsPSCBs LPB FB SB All Banks DFIs
Equity
1.1 Fully Paid-up Capital/Capital Deposited with SBP 406,734.6 37,254.3 274,376.2 33,846.8 15,507.4 360,984.6 45,750.0
1.2 Balance in Share Premium Account 20,713.0 10,000.0 8,077.9 - - 18,077.9 2,635.1
1.3 Reserve for issue of Bonus shares - - - - - - -
1.4
General Reserves as disclosed on the Balance
Sheet (including statutory reserve) 131,762.0 18,075.9 99,041.8 92.7 7,313.8 124,524.1 7,237.9
1.5
Un-appropriated/Unremitted profits (net of
accumulated losses, if any) 89,468.6 42,979.9 66,208.0 1,058.5 (23,311.8) 86,934.6 2,533.9
1.6 Minority interest - - - - - - -
1.7 Sub-Total (1.1 to 1.5) 648,678.1 108,310.0 447,703.8 34,998.1 (490.6) 590,521.2 58,156.9
Deductions
1.8 Goodwill 39,215.7 726.4 38,191.5 271.5 8.7 39,198.2 17.5
1.9
Shortfall in Provisions required against Classified
assets 1,433.6 - 1,433.6 - - 1,433.6 -
1.10
Deficit on account of revaluation of AFS investment
3,990.5 665.9 1,896.7 447.2 397.2 3,407.1 583.4
1.11
Any increase in equity capital resulting from a
securitization transaction - - - - - - -
1.12 Investments in TFCs of other banks 885.7 - 6.6 - - 6.6 879.1
1.13 Other Deductions 12,446.8 2,140.4 8,661.4 - 157.7 10,966.4 1,487.2
1.14 Sub-Total (1.7 to 1.10) 57,986.1 3,532.7 50,203.7 718.7 563.7 55,011.9 2,967.3
1.15 Total Eligible Tier 1 capital 590,692.1 104,777.3 397,500.0 34,279.3 (1,054.3) 535,509.4 55,189.6
Supplementary Capital
2.1
Freely available General Provisions or reserves for
loan losses-upto maximum of 1.25% of Risk
Weighted Assets 13,785.5 3,020.4 8,682.6 437.3 1,462.9 13,603.3 182.3
2.2 Revaluation reserves eligible upto 45% 35,291.8 10,546.7 21,771.1 - 2,127.1 34,444.9 846.9
2.3 Foreign Exchange Translation Reserves 23,767.2 7,324.1 16,443.0 - - 23,767.2 -
2.4 Undisclosed reserves - - - - - - -
2.5
Subordinated debt-upto maximum of 50% of total
equity 40,025.4 - 36,821.1 - 3,204.3 40,025.4 -
2.6 Tota l Tier 2 Supplementary Capita l(2.1 - 2.5) 112,671.2 20,891.3 83,519.2 437.3 6,794.3 111,840.7 1,029.2
Deductions
Other deductions 12,446.8 2,140.4 8,661.4 - 157.7 10,966.4 1,487.2
Total Deductions 12,446.8 2,140.4 8,661.4 - 157.7 10,966.4 1,487.2
Total eligible tier 2 capital 100,224.5 18,750.9 74,857.8 437.3 6,636.6 100,874.3 (458.1)
2.7 Eligible tier 3 (as worked out in 3.9 below)
2.8 Total Supplementary Capital eligible for
MCR(maximum upto 100%of Tota l Equity) 100,224.5 18,750.9 74,857.8 437.3 6,636.6 100,682.5 (458.1)
2.9 TOTAL CAPITAL (1.12+2.8) 690,916.5 123,528.2 472,357.8 34,716.6 5,582.3 636,191.9 54,731.6
Risk Weighted Amounts
3.3 Total Credit Risk Weighted Assets 3,688,523.8 684,698.4 2,727,852.3 107,672.5 100,946.4 3,621,169.7 67,354.1
3.4 Total Market Risk Weighted Assets 298,695.5 88,980.4 180,417.3 7,593.2 58.5 277,049.4 21,646.1
Total Operational Risk Assets 666,924.1 117,310.0 493,355.9 25,750.0 18,954.6 655,370.4 11,553.7
3.5 Total Risk Weighted Amount 4,654,143.4 890,988.8 3,401,625.5 141,015.7 119,959.5 4,553,589.6 100,553.9
Capital Adequacy Ratios
Tier 1 capital to Total Risk Weighted Amount 12.7% 11.8% 11.7% 24.3% -0.9% 11.8% 54.9%
Total Capital Adequacy Ratio 14.8% 13.9% 13.9% 24.6% 4.7% 14.0% 54.4%
OTHER DEDUCTIONS FROM TIER 1 AND TIER 2
CAPITAL
1.1
Investments in equity and other regulatory capital
of majority owned securities or other financial
subsidiaries not consolidated in the balance sheet
19,163.8 2,101.7 15,030.7 - 315.5 17,447.8 1,716.0
1.2
Significant minority investments in banking,
securities and other financial entities 4,477.2 2,179.1 1,384.5 - - 3,563.7 913.5
(para 1.1 scope of Application) - - - - - - -
1.3
Equity holdings (majority or significant minority) in
an insurance subsidiary 594.6 - 249.6 - - 249.6 345.0
(para 1.1 scope of Application) - - - - - - -
1.4
Significant minority and majority investments in
commercial entities exceeding - - - - - - -
15% of bank's capital 627.9 - 627.9 - - 627.9 -
1.5
Securitization exposure subject to deduction (para
4.3.1 of instructions) - - - - - - -
1.6 Others 43.9 - 43.9 - - 43.9 -
-
1.7
Total Deductible Items to be deducted 50%
from Tier 1 -
capital and 50%from Tier 2 capital 24,907.4 4,280.8 17,336.6 - 315.5 21,932.9 2,974.5

8/3/2019 QPR-Dec-2010
http://slidepdf.com/reader/full/qpr-dec-2010 40/43
36
Annex-IX
Group-wise Composition of BanksDecember 31, 2010
2007 2008 2009 Dec-10 A . Public Sect or Com. Banks (4) A . Public Sect or Co m. Banks (4) A . Public Sect or Co m. Banks (4) A . Public Sect or Com. Banks (5)
First Women Bank Ltd. First Women Bank Ltd. First Women Bank Ltd. First Women Bank Ltd.
National Bank of Pakistan National Bank of Pakistan National Bank of Pakistan National Bank of Pakistan
The Bank of Khyber The Bank of Khyber The Bank of Khyber The Bank of Khyber
The Bank of Punjab The Bank of Punjab The Bank of Punjab The Bank of Punjab
Sindh Bank Ltd.
B. Local Private Banks (26) B. Local Private Banks (25) B. Local Private Banks (25) B. Local Private Banks (23)
Allied Bank Ltd. Allied Bank Ltd. Allied Bank Ltd. Albaraka Islamic Bank B.S.C.*
Arif Habib Bank Ltd. Askari Bank Ltd. Askari Bank Ltd. Allied Bank Ltd.
Askari Bank Ltd. Atlas Bank Ltd.. Atlas Bank Ltd.. Askari Bank Ltd.
Atlas Bank Ltd.. Bank AL Habib Ltd. Bank AL Habib Ltd. Bank AL Habib Ltd.
Bank AL Habib Ltd. Bank Alfalah Ltd. Bank Alfalah Ltd. Bank Alfalah Ltd.
Bank Alfalah Ltd. BankIslami Pakistan Ltd. BankIslami Pakistan Ltd. BankIslami Pakistan Ltd.
BankIs lami Pakistan Ltd. Dawood Is lamic Bank Ltd Dawood Is lamic Bank Ltd. Dawood Is lamic Bank Ltd.
C rescent Commercia l Bank Ltd. Em ir ate s Gl oba l Is lami c Bank Ltd. Emirates Global Islamic Bank Ltd. Faysal Bank Ltd.
Dawood Islamic Bank Ltd Faysal Bank Ltd. Faysal Bank Ltd. Habib Bank Ltd.
Dubai Islamic Bank Pakistan Ltd. Habib Bank Ltd. Habib Bank Ltd. Habib Metropolitan Bank Ltd.
Emirates Global Islamic Bank Ltd. Habib Metropolitan Bank Ltd. Habib Metropolitan Bank Ltd. JS Bank Ltd.
Faysal Bank Ltd. JS Bank Ltd. JS Bank Ltd. KASB Bank Ltd.
Habib Bank Ltd. KASB Bank Ltd. KASB Bank Ltd. MCB Bank Ltd.
Habib Metr opo li tan Bank Ltd. MCB Bank Ltd. MCB Bank Ltd. Meezan Bank Ltd.
JS Bank Ltd. Meezan Bank Ltd. Meezan Bank Ltd. Mybank Ltd.
KASB Bank Ltd. Mybank Ltd. Mybank Ltd. NIB Bank Ltd.
MCB Bank Ltd. NIB Bank Ltd. NIB Bank Ltd. SAMBA Bank Ltd.
Meezan Bank Ltd. SAMBA Bank Ltd. SAMBA Bank Ltd. Silk Bank Ltd
Mybank Ltd. Saudi Pak Commercial Bank Ltd. Silk Bank Ltd Soneri Bank Ltd.
NIB Bank Ltd. Soneri Bank Ltd. Soneri Bank Ltd. Standard Chartered Bank (Pakistan) Ltd.
PICIC Commercial Bank Ltd. Standard Chartered Bank (Pakistan) Ltd. Standard Chartered Bank (Pakistan) Ltd. United Bank Ltd.
Saudi Pak Commerc ia l Bank Ltd. The Roya l Bank of Scotl and Ltd . The Royal Bank of Scotland Ltd. Dubai Islamic Bank Pakistan Ltd.
Soneri Bank Ltd. United Bank Ltd. United Bank Ltd. Summit Bank Ltd.
Standard Chartered Bank (Pakistan) Ltd. Dubai Islamic Bank Pakistan Ltd. Dubai Islamic Bank Pakistan Ltd.
United Bank Ltd. Arif Habib Bank Ltd. Arif Habib Bank Ltd.
ABN AMRO Bank (Pakistan) Ltd.
C. Foreign Banks (6) C. Foreign Banks (7) C. Foreign Banks (7) C. Foreign Banks (6)
Albar aka Islamic Bank B. S.C. Albar aka Islamic Bank B.S .C. Albaraka Islamic Bank B.S.C. Bank of Tokyo - Mitsubishi UFJ, Ltd.
Bank of Tokyo - Mitsubishi UFJ, Ltd. Bank of Tokyo - Mitsubishi UFJ, Ltd. Bank of Tokyo - Mitsubishi UFJ, Ltd. Deutsche Bank AG
Deutsche Bank AG Deutsche Bank AG Deutsche Bank AG Citibank N.A.
Citibank N.A. Citibank N.A. Citibank N.A. Oman International Bank S.A.O.G.
Oman International Bank S .A.O.G. Oman Inte rna tional Ba nk S .A.O.G. Oman Inte rna tional Ba nk S .A.O.G. Barc la ys Ba nk PLC
Barclays Bank PLC Barclays Bank PLC HSBC Bank Milldle East Ltd.
HS BC Bank Milldle East Ltd. HS BC Bank Milldle East Ltd.
D. Specialized Banks (4) D. Specialized Banks (4) D. Specialized Banks (4) D. Specialized Banks (4)
Industrial Development Bank of Pakistan Industrial Development Bank of Pakistan Industrial Development Bank of Pakistan Industrial Development Bank of Pakistan
Punjab Provincial Co-operative Bank Ltd. Punjab Provincial Co-operative Bank Ltd. Punjab Provincial Co-operative Bank Ltd. Punjab Provincial Co-operative Bank Ltd.
SME Bank Ltd. SME Bank Ltd. SME Bank Ltd. SME Bank Ltd.
Zarai Taraqiati Bank Ltd. Zarai Taraqiati Bank Ltd. Zarai Taraqiati Bank Ltd. Zarai Taraqiati Bank Ltd.
All Commercial Banks (36) All Commercial Banks (36) All Commercial Banks (36) All Commercial Banks (34)
Include A + B + C Include A + B + C Include A + B + C Include A + B + C
All Banks (40) All Banks (40) All Banks (40) All Banks (38)Include A + B + C + D Include A + B + C + D Include A + B + C + D Include A + B + C + D
SBP declared “Sindh Bank Limited” as a scheduled bank with effec t from December 24, 2010.
**De-scheduling of Atlas Bank Limited with effect f rom the close of business on December 31, 2010, on account of it s merger with and into Summit Bank Limited.
The Hongkong & S hanghai Banking
Corporation Ltd.
* Descheduling of Albaraka Islamic Bank Pakistan Operations and merger into Emirates Global Islamic Bank Limited with effect from October 29, 2010. Subsequent upon its merger, name has been changed from
“Emirates Global Islamic Bank Limited” to “AlBaraka Bank (Pakistan) Limited” with effect from the close of business on October 29, 2010.

8/3/2019 QPR-Dec-2010
http://slidepdf.com/reader/full/qpr-dec-2010 41/43
37
Abbreviation
ADD Authorized DerivativesDealer
ADR Advances to Deposits Ratio
AFS Available For Sale ALM Asset Liability ManagementBIA Basic Indicator ApproachBps Basis PointsCAR Capital Adequacy RatioCB Commercial Bank CCF Credit Conversion FactorCCS Cross Country SwapsCDNS Central Directorate of
National Saving CPI Consumer Price IndexCPV Credit Portfolio View
CRR Cash Reserve RequirementsCRWA Credit Risk Weighted
AmountsCY Calendar YearDFIs Development Finance
InstitutionsERF Export RefinanceEURIBOR Euro Interbank Offered RateEXR Exchange RateFB Foreign Bank FDBR Financial Derivatives
Business Regulations
FDR Financing to Deposits RatioFRA Forward Rate AgreementsFSV Forced Sale ValueGDP Gross Domestic ProductGoP Government of PakistanHFT Held For Trading HTM Held-to-Maturity IBIs Islamic Banking InstitutionsIRS Interest Rate SwapsKIBOR Karachi Interbank Offered
RateLIBOR London Inter Bank offered
Rate
LPB Local Private Bank LSM Large Scale Manufacturing MCR Minimum Capital
RequirementMRWA Market Risk Weighted
AmountsMTB Market Treasury BillNII Net Interest Income
NMI Non-Market Maker FinancialInstitution
NOP Net Open Position
NPF Non Performing FinanceNPL Non Performing LoanNPLR Loan Infection RatioNSS National Saving SchemeOMO Open Market OperationORWA Operational Risk Weighted
AmountsOTC Over the CounterPAT Profit After TaxPIB Pakistan Investment BondPKR Pak RupeePSCB Public Sector Commercial
Bank PSE Public Sector EnterprisePTCs Participation Term
CertificatesQoQ Quarter on QuarterQPR Quarterly Performance
Review QRC Quarterly Report of
ConditionROA Return on AssetROE Return on Equity RSA Rate Sensitive Assets
RSL Rate Sensitive LiabilitiesRWA Risk Weighted AssetsSA Standardized approachSB Specialized Bank SBP State Bank of PakistanSECP Securities and Exchange
Commission of PakistanSLR Statutory Liquidity
RequirementsSME Small and Medium
Enterprise TFCs Term Finance CertificatesUSD United States Dollar
WALR Weighted Average Lending rate
WPI Wholesale Price Index YoY Year on Year

8/3/2019 QPR-Dec-2010
http://slidepdf.com/reader/full/qpr-dec-2010 42/43
Glossary
Capital Adequacy Ratio is the amount of risk-basedcapital as a percent of risk-weighted assets.
Coefficient of Variance The coefficient of variance isthe ratio of Standard Deviation to Arithmetic Mean.
The coefficient is a useful statistical tool for comparing
the degree of volatility of more than one data sets when
their means are significantly different from each other.
Consumer Financing means any financing allowed to
individuals for meeting their personal, family or
household needs. The facilities categorized as
Consumer Financing include credit cards, auto loans,
housing finance, consumer durables and personal loans.
Corporate means and includes public limited
companies and such entities, which do not come underthe definition of SME.
Credit risk arises from the potential that a borrower orcounter-party will fail to perform an obligation or repay a loan.
Discount rate is the rate at which SBP provides three-day repo facility to banks, acting as the lender of lastresort.
Duration (Macaulay’s Duration) is a time weightedpresent value measure of the cash flow of a loan orsecurity that takes into account the amount and timing of all promised interest and principal payments
associated with that loan or security. It shows how theprice of a bond is likely to react to different interestrate environments. A bond’s price is a function of itscoupon, maturity and yield.
Force Sale Value (FSV) means the value that can
currently be obtained by selling the mortgaged /
pledged assets in a forced / distressed sale conditions.
This value fully reflects the possibility of price
fluctuations.
GAP is the term commonly used to describe the rupee
volume of the interest-rate sensitive assets versus
interest-rate sensitive liabilities mismatch for a specific
time frame; often expressed as a percentage of total
assets.
Gross income is the net interest income (beforeprovisions) plus non-interest income; the incomeavailable to cover the operating expenses.
Interbank rates are the two-way quotes namely bidand offer rates quoted in interbank market are called asinterbank rates.
Interest rate risk is the exposure of an institution’sfinancial condition to adverse movement in interestrates, whether domestic or worldwide. The primary source of interest rate risk is difference in timing of there-pricing of bank’s assets, liabilities and off -balancesheet instruments.
Intermediation cost is the administrative expenses
divided by the average deposits and borrowings.
Liquid assets are the assets that are easily and cheaply turned into cash – notably cash and short-termsecurities. It includes cash and balances with banks, callmoney lending, lending under repo and investment ingovernment securities.
Liquidity risk is the risk that the bank will be unable
to accommodate decreases in liabilities or to fundincreases in assets. The liquidity represents the bank’sability to efficiently and economically accommodatedecreases in deposits and to fund increases in loandemand without negatively affecting its earnings.
Market risk is the risk that changes in the market ratesand prices will impair an obligor’s ability to performunder the contract negotiated between the parties.Market risk reflects the degree to which changes ininterest rates, foreign exchange rates, and equity pricescan adversely affect the earnings of a bank.
Net interest income is the total interest income lesstotal interest expense. This residual amount represents
most of the income available to cover expenses otherthan the interest expense.
Net Interest Margin (NIM) is the net interest
income as a percent of average earning assets.
Net loans are the loans net of provision held for NPLs.
Net Non-Performing Loans (NPLs) is the value of non-performing loans minus provision for loan losses.
Net NPLs to net loans means net NPLs as a percent
of net loans. It shows the degree of loans infection
after making adjustment for the provision held.
Non-Performing Loans (NPLs) are loans andadvances whose mark-up/interest or principal is
overdue by 90 days or more from the due date.
NPLs to loans ratio/Infection ratio stands for NPLsas a percent of gross loans.
Paid-up capital is the equity amount actually paid by the shareholders to a company for acquiring its shares.

8/3/2019 QPR-Dec-2010
http://slidepdf.com/reader/full/qpr-dec-2010 43/43
Rate Sensitive Assets (RSA) are assets susceptible tointerest rate movements; that will be re-priced or willhave a new interest rate associated with them over theforthcoming planning period.
Repricing risk arises from timing differences in thematurity of fixed rate and the repricing of floating rates
as applied to banks’ assets, liabilities and off -balancesheet positions
Return on assets measures the operating performanceof an institution. It is the widely used indicator of earning and is calculated as net profit as percentage of average assets.
Return on equity is a measure that indicates theearning power of equity and is calculated as net incomeavailable for common stockholders to average equity
Risk weighted Assets: Total risk weighted assets of abank would comprise two broad categories: credit risk- weighted assets and market risk-weighted assets. Credit
risk weighted assets are calculated from the adjusted value of funded risk assets i.e. on balance sheet assetsand non-funded risk exposures i.e. off-balance sheetitem. On the other hand for market risk-weightedassets, first the capital charge for market risk iscalculated and then on the basis of this charge amountthe value of Market Risk Weighted Assets is derived.
Secondary market is a market in which securities aretraded following the time of their original issue.
SME means an entity, ideally not a public limited
company, which does not employ more than 250
persons (if it is manufacturing/ service concern) and 50
persons (if it is trading concern) and also fulfils thefollowing criteria of either ‘a’ and ‘c’ or ‘b’ and ‘c’ as
relevant:
(a) A trading / service concern with total assets at cost
excluding land and building upto Rs50 million.
(b) A manufacturing concern with total assets at cost
excluding land and building upto Rs100 million.
(c) Any concern (trading, service or manufacturing) with net sales not exceeding Rs300 million as per latestfinancial statements.
Tier-I capital: The risk based capital system dividescapital into two tiers- core capital (Tier I) and
supplementary capital (Tier II and Tier III). Tier 1
capital includes fully paid up capital, balance in share
premium account, reserve for issue of bonus shares,
general reserves as disclosed on the balance-sheet and
un-appropriated /un-remitted profit (net of
accumulated losses, if any).
Tier-II capital or Supplementary Capital (Tier II &
III) is limited to 100 percent of core capital (Tier I).
Tier II includes; general provisions or general reserves
for loan losses, revaluation reserves, exchange
translation reserves, undisclosed reserves and
subordinated debt.
Tier-III capital consists of short-term subordinated
debt and is solely held for the purpose of meeting a
proportion of the capital requirements for market risks.
Yield risk is the risk that arises out of the changes in
interest rates on a bond or security when calculated as
that rate of interest, which, if applied uniformly to
future time periods sets the discounted value of future
bond coupon and principal payments equal to the
current market price of the bond.
Yield curve risk materializes when unanticipated shifts
have an adverse effect on the bank’s income or
underlying economic value.