qPCR with stochastic profiling samplesbme.virginia.edu/janes/resources/2015/StochProf_qPCR.pdf ·...
31
qPCR with stochastic profiling samples Chun-Chao Wang Kevin Janes Lab University of Virginia
Transcript of qPCR with stochastic profiling samplesbme.virginia.edu/janes/resources/2015/StochProf_qPCR.pdf ·...
qPCR with stochastic profiling samples
Chun-Chao Wang
Kevin Janes Lab University of Virginia
Lecture Objectives
qPCR detection method in Janes lab
Primer design and validation
Troubleshooting primers and amplifications
What we are going to do in the lab today
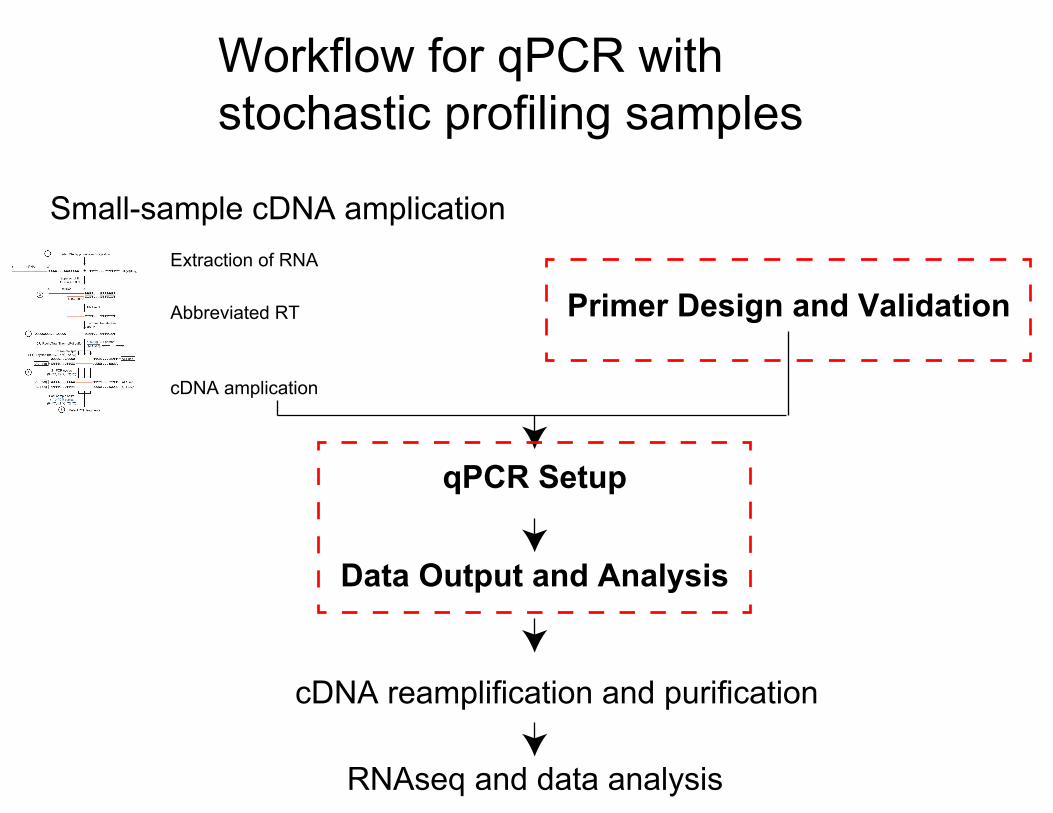
Workflow for qPCR with stochastic profiling samples
qPCR Setup
Data Output and Analysis
Extraction of RNA
Abbreviated RT
cDNA amplication
Small-sample cDNA amplication
Primer Design and Validation
cDNA reamplification and purification
RNAseq and data analysis
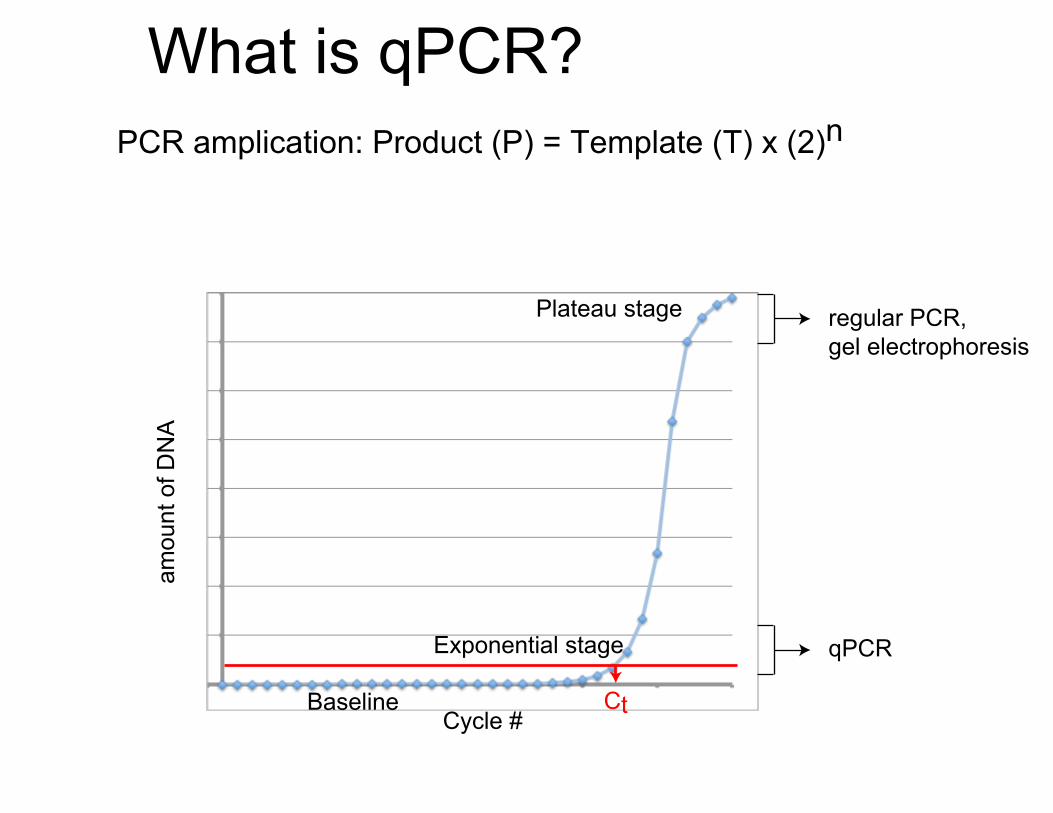
What is qPCR?PCR amplication: Product (P) = Template (T) x (2)n
Cycle #
amou
nt o
f DN
A
Baseline
Exponential stage
Plateau stage regular PCR,gel electrophoresis
qPCR
Ct
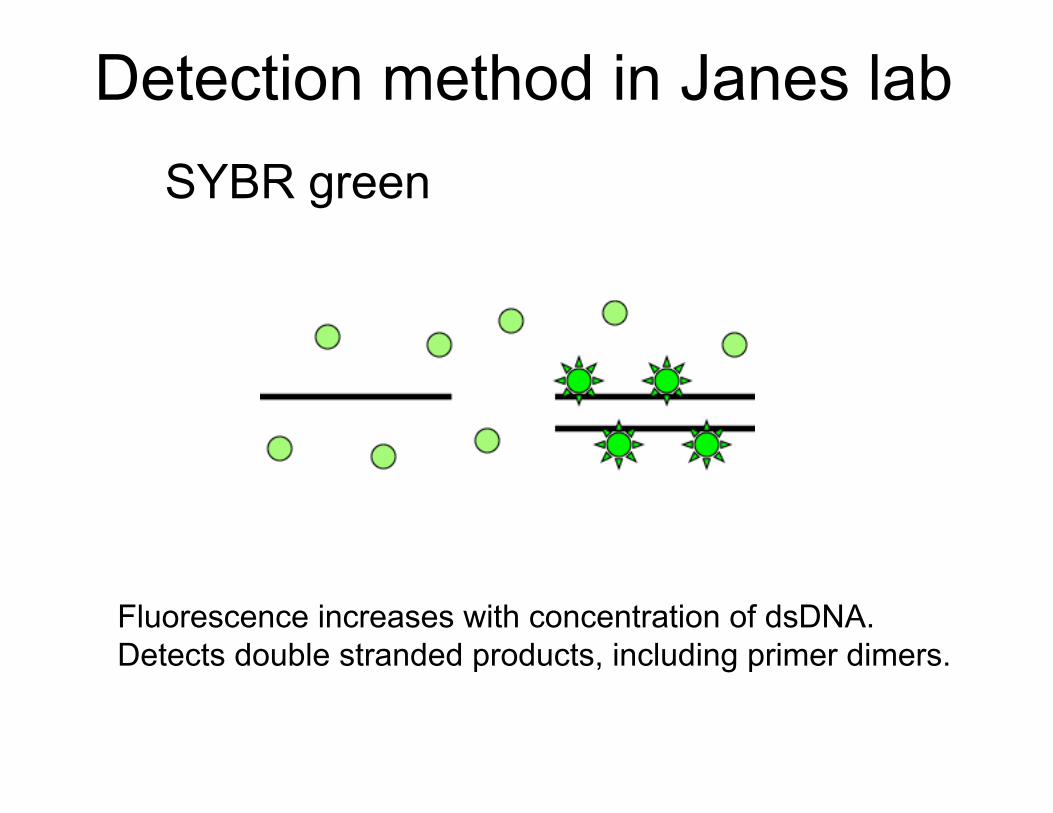
Detection method in Janes labSYBR green
Fluorescence increases with concentration of dsDNA. Detects double stranded products, including primer dimers.
Important controls
blank sample, no template control (NTC): to check primer dimers and contaminants no RT sample: to check genomic DNA
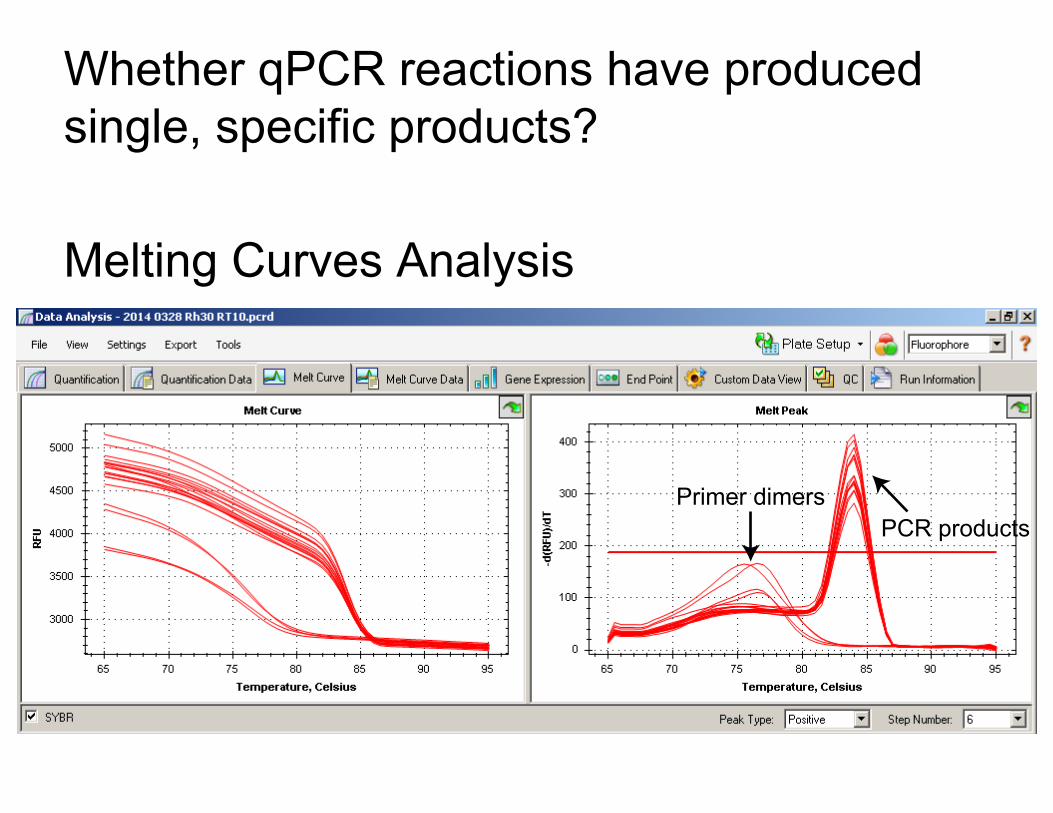
Melting Curves Analysis
Whether qPCR reactions have produced single, specific products?
Primer dimersPCR products
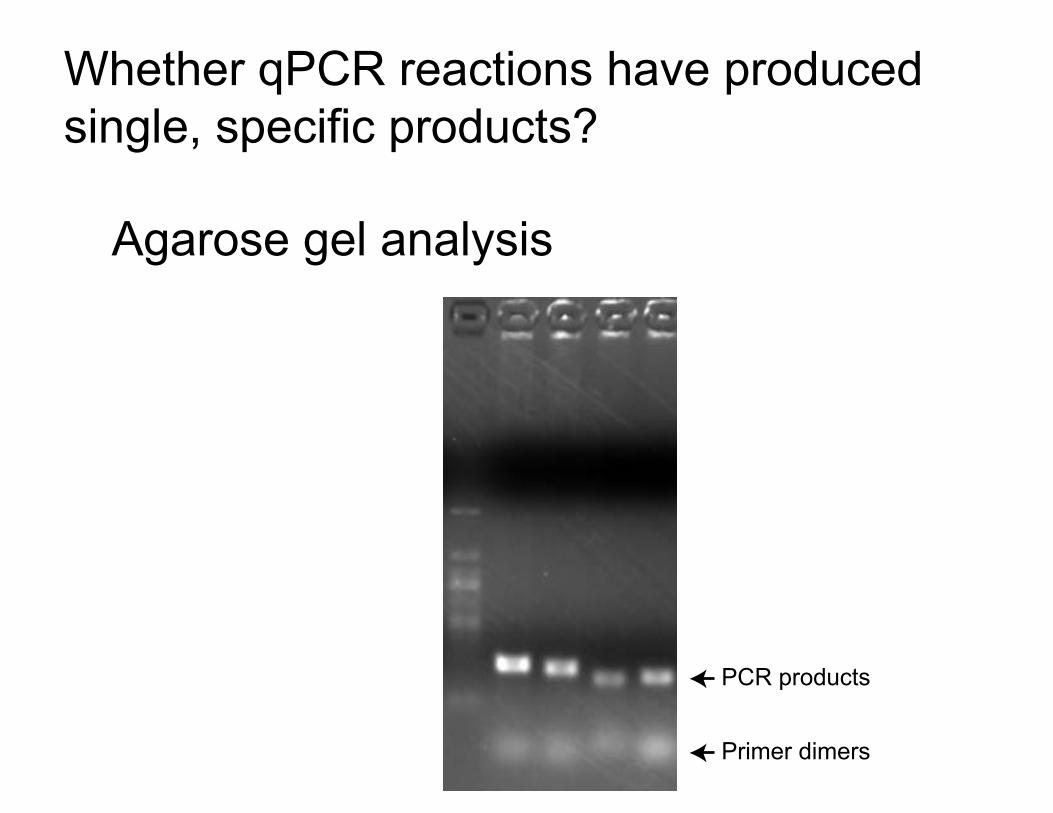
Whether qPCR reactions have produced single, specific products?
Agarose gel analysis
Primer dimers
PCR products
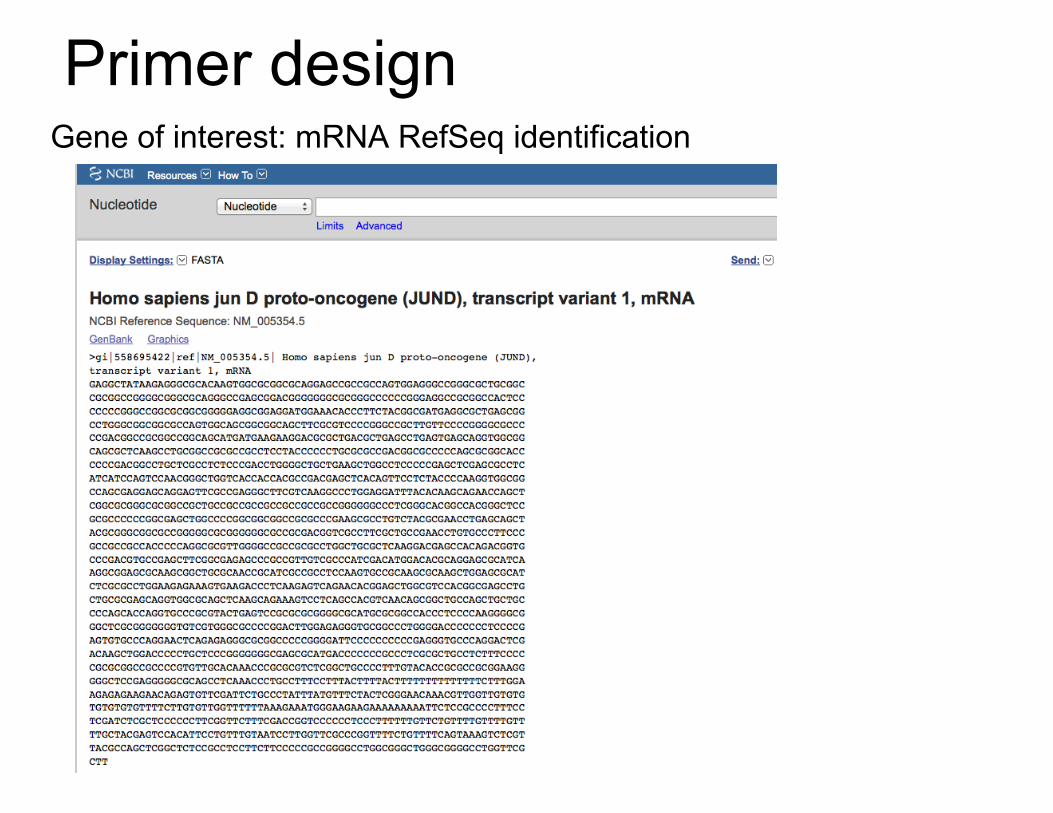
Primer design Gene of interest: mRNA RefSeq identification
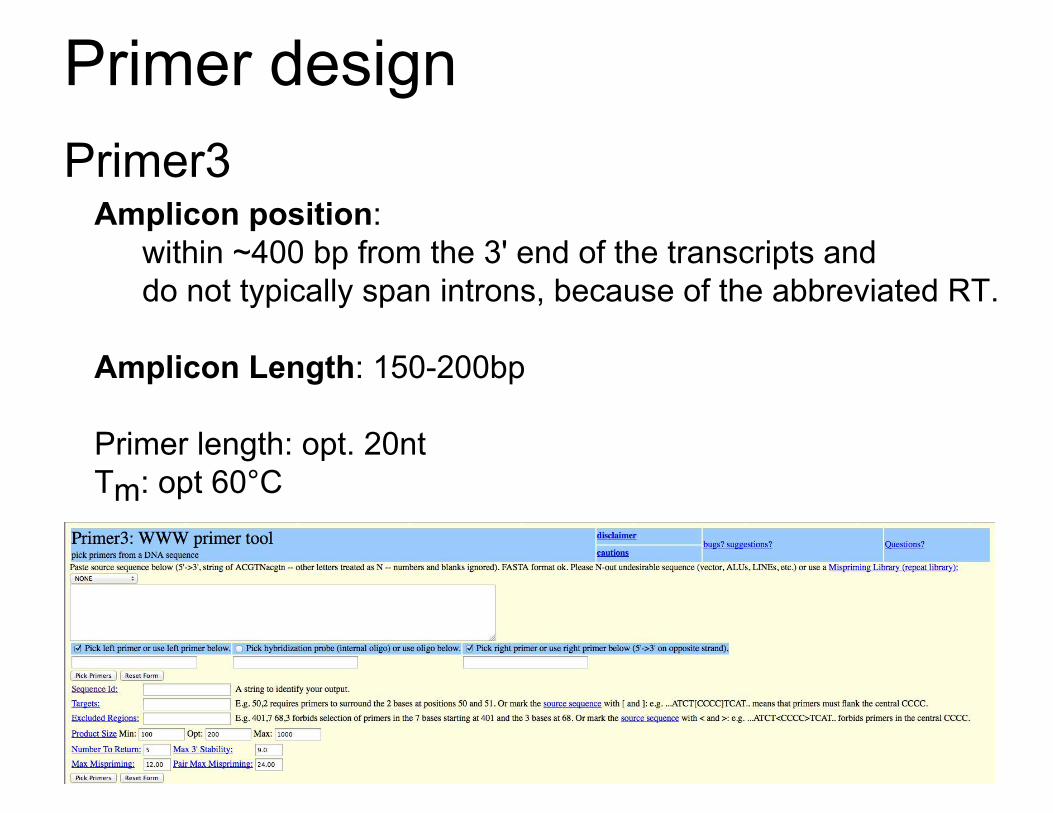
Primer design Primer3
Amplicon position: within ~400 bp from the 3' end of the transcripts and do not typically span introns, because of the abbreviated RT.
Amplicon Length: 150-200bp
Primer length: opt. 20nt Tm: opt 60°C
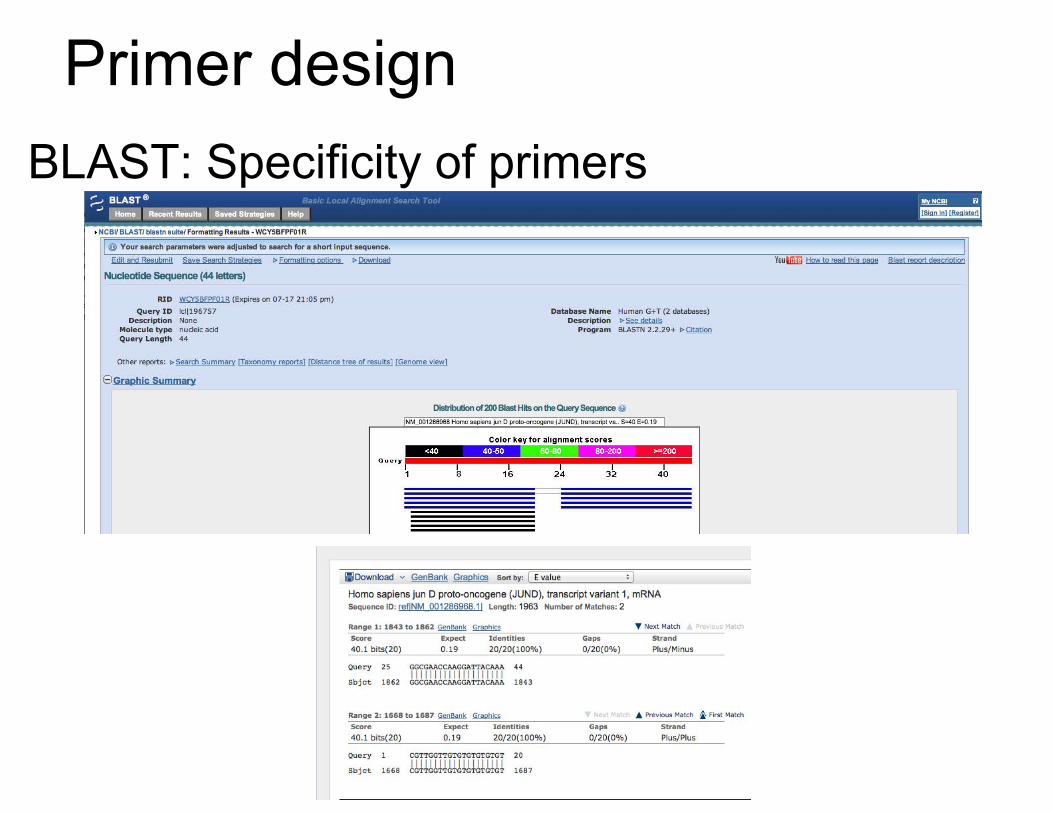
Primer design BLAST: Specificity of primers
Primer design
Order 2 sets of primer pairs from a low-cost provider of custom synthesis
We order 25 nmole with standard desalting. The cost is $0.35 per base in the scale of 15-60 bps.
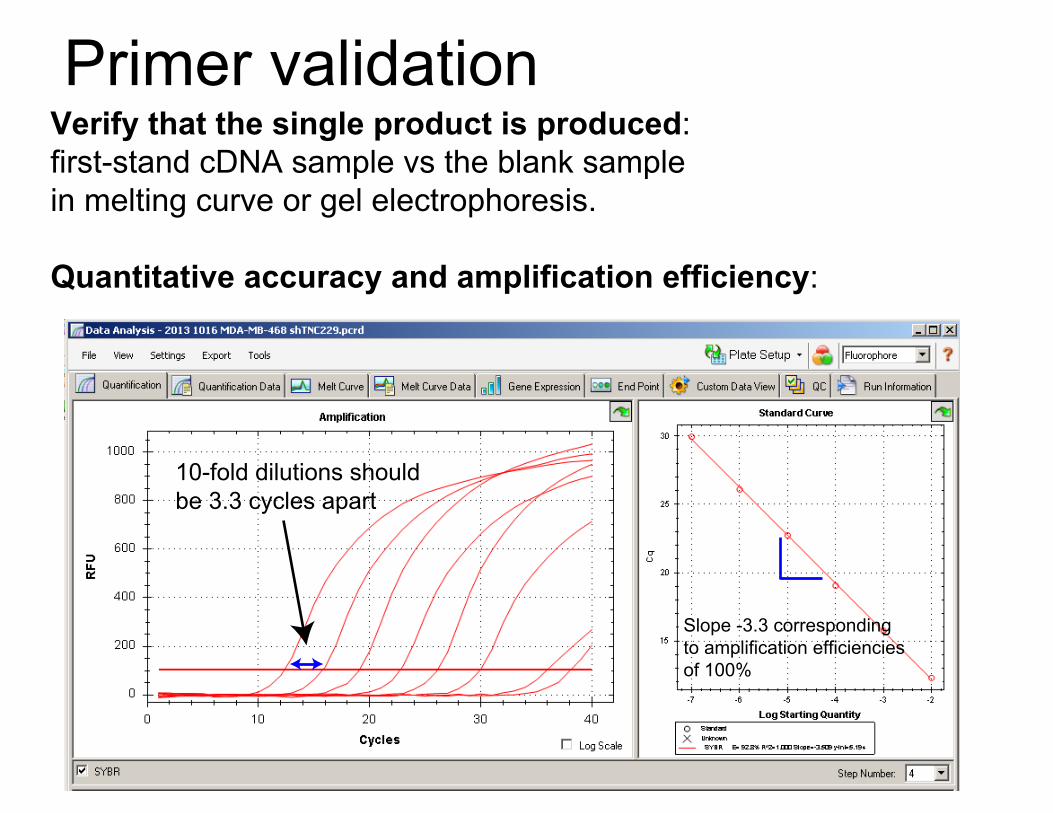
Primer validationVerify that the single product is produced: first-stand cDNA sample vs the blank sample in melting curve or gel electrophoresis. Quantitative accuracy and amplification efficiency:
10-fold dilutions should be 3.3 cycles apart
Slope -3.3 corresponding to amplification efficiencies of 100%
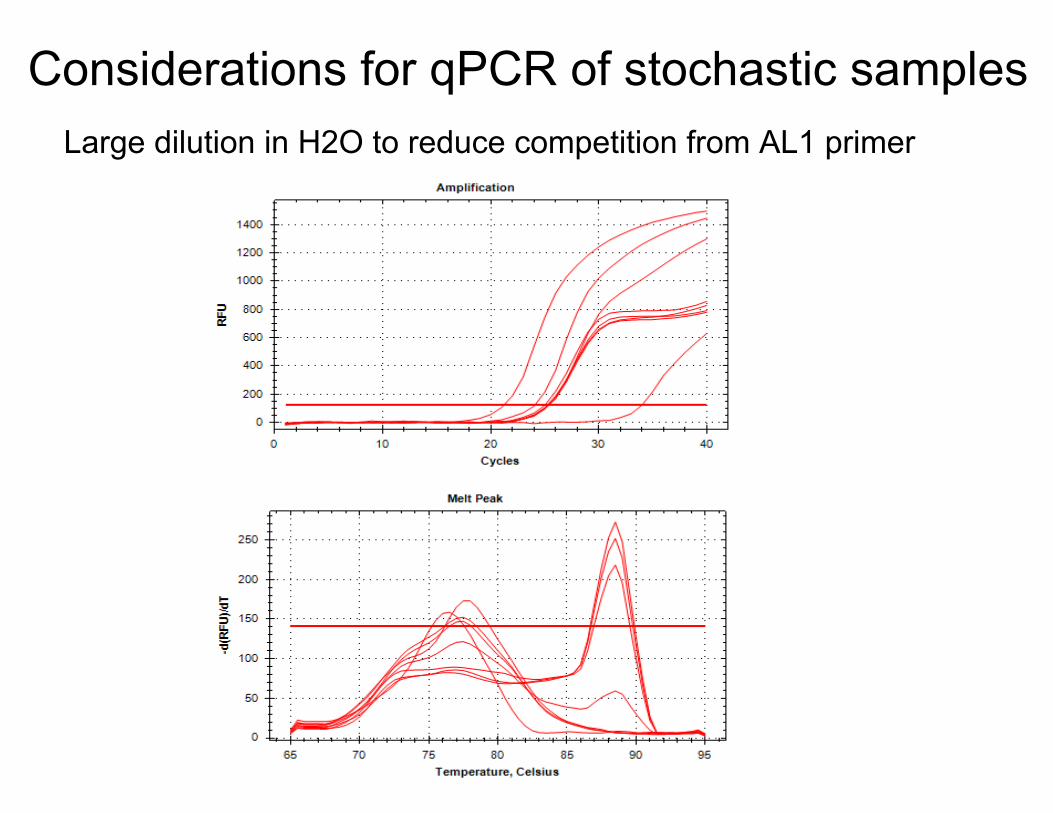
Considerations for qPCR of stochastic samplesLarge dilution in H2O to reduce competition from AL1 primer
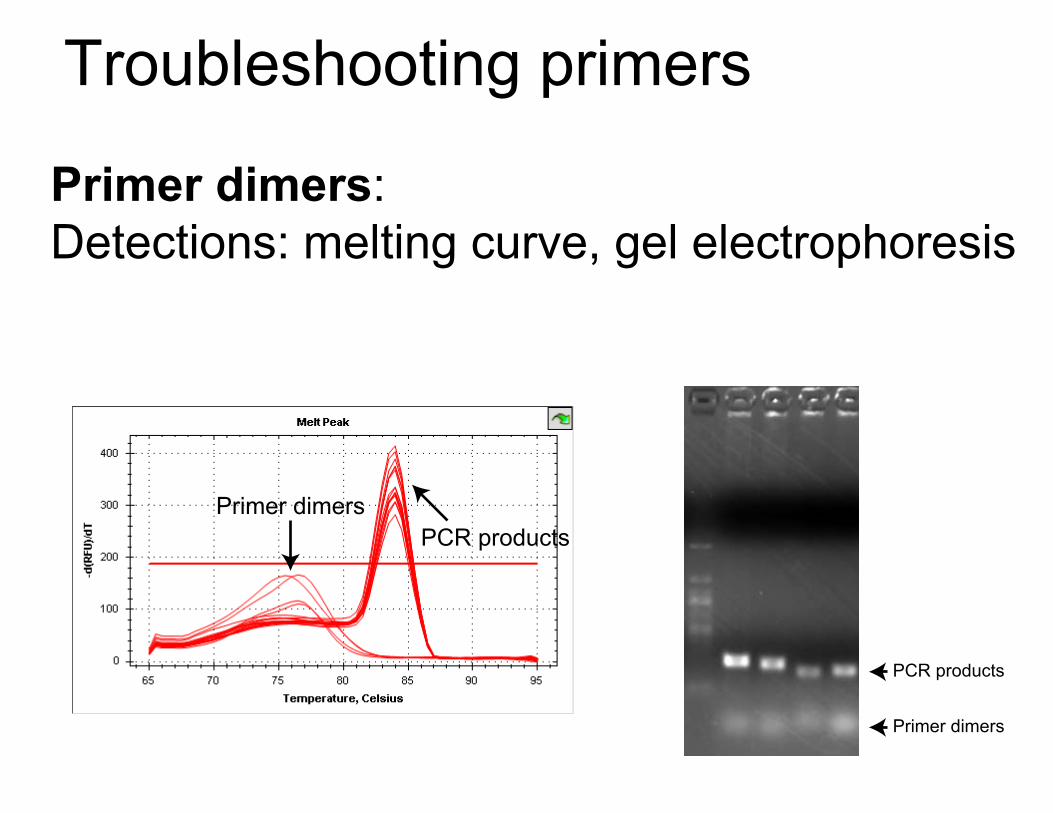
Troubleshooting primers
Primer dimers: Detections: melting curve, gel electrophoresis
Primer dimers
PCR products
Primer dimersPCR products
Troubleshooting primers
Primer dimers: Detections: melting curve, gel electrophoresis
Solutions: proper primer design that prevents the formation of hairpins, self dimers, and cross dimers. decreasing primer concentration two-fold in the RT-qPCR reaction
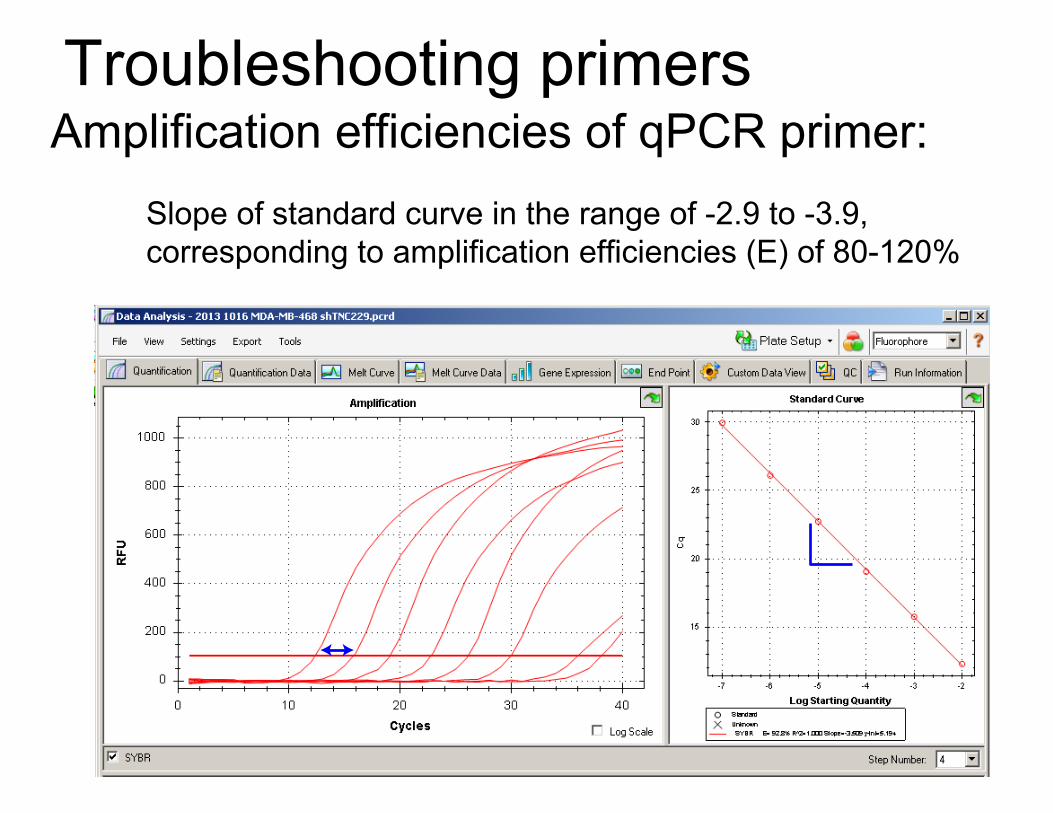
Troubleshooting primers Amplification efficiencies of qPCR primer: Slope of standard curve in the range of -2.9 to -3.9, corresponding to amplification efficiencies (E) of 80-120%
Troubleshooting primers Amplification efficiencies of qPCR primer:
Low efficiencies: Main reasons: bad primer design (2nd structure, not appropriate Tm);not-optimal reagent concentration.
Solutions:increasing the primer concentration two-fold in the RT-qPCR reaction
Troubleshooting primers Amplification efficiencies of qPCR primer:exceedingly high efficiencies: Reasons: 1. the presence of inhibitors of polymerase enzyme in cDNA samples.Most concentrated samples should be omitted.
2. primer dimers:Decreasing the primer concentration two-fold in the RT-qPCR reaction
3. contamination, inappropriate dilution series
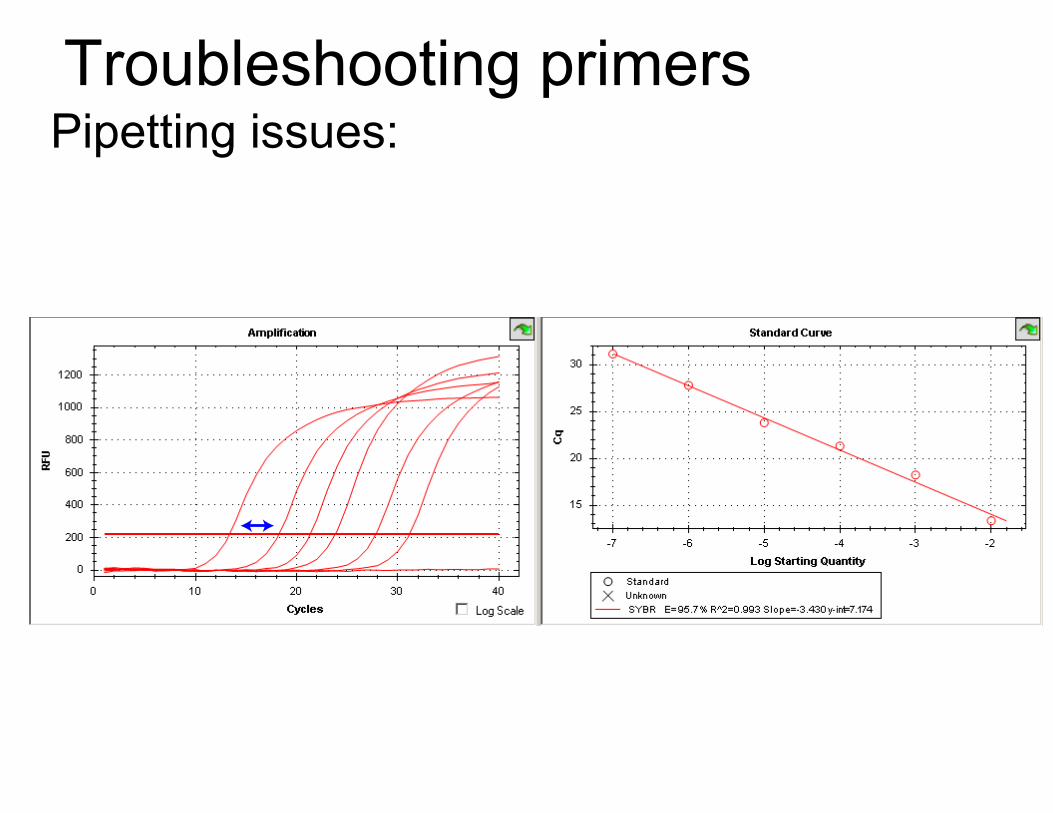
Troubleshooting primers Pipetting issues:
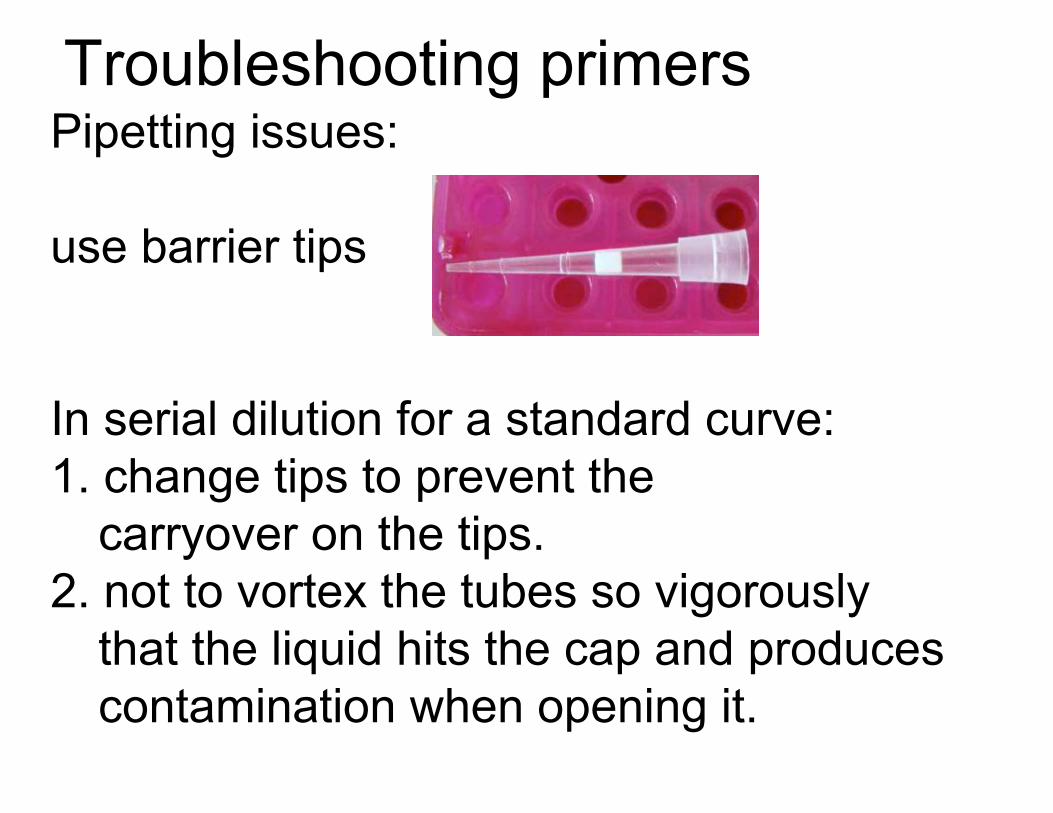
Troubleshooting primers Pipetting issues: use barrier tips
In serial dilution for a standard curve: 1. change tips to prevent the carryover on the tips. 2. not to vortex the tubes so vigorously that the liquid hits the cap and produces contamination when opening it.
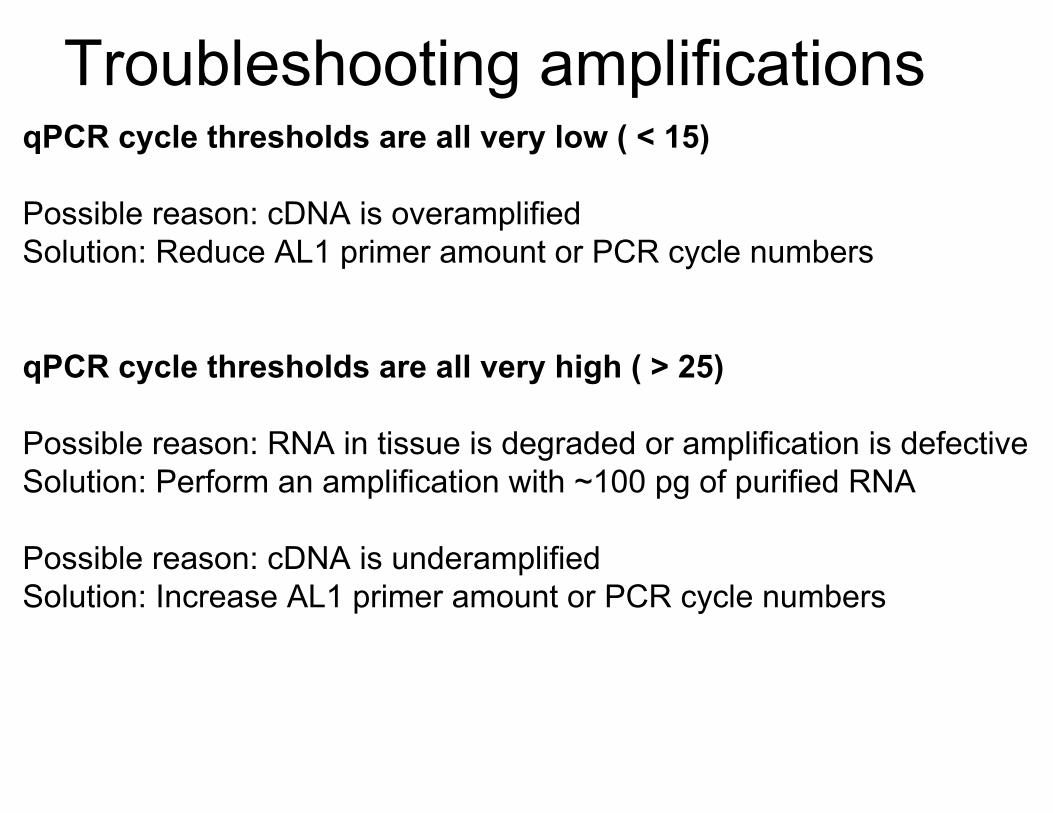
Troubleshooting amplificationsqPCR cycle thresholds are all very low ( < 15)
Possible reason: cDNA is overamplifiedSolution: Reduce AL1 primer amount or PCR cycle numbers
qPCR cycle thresholds are all very high ( > 25)
Possible reason: RNA in tissue is degraded or amplification is defectiveSolution: Perform an amplification with ~100 pg of purified RNA
Possible reason: cDNA is underamplifiedSolution: Increase AL1 primer amount or PCR cycle numbers
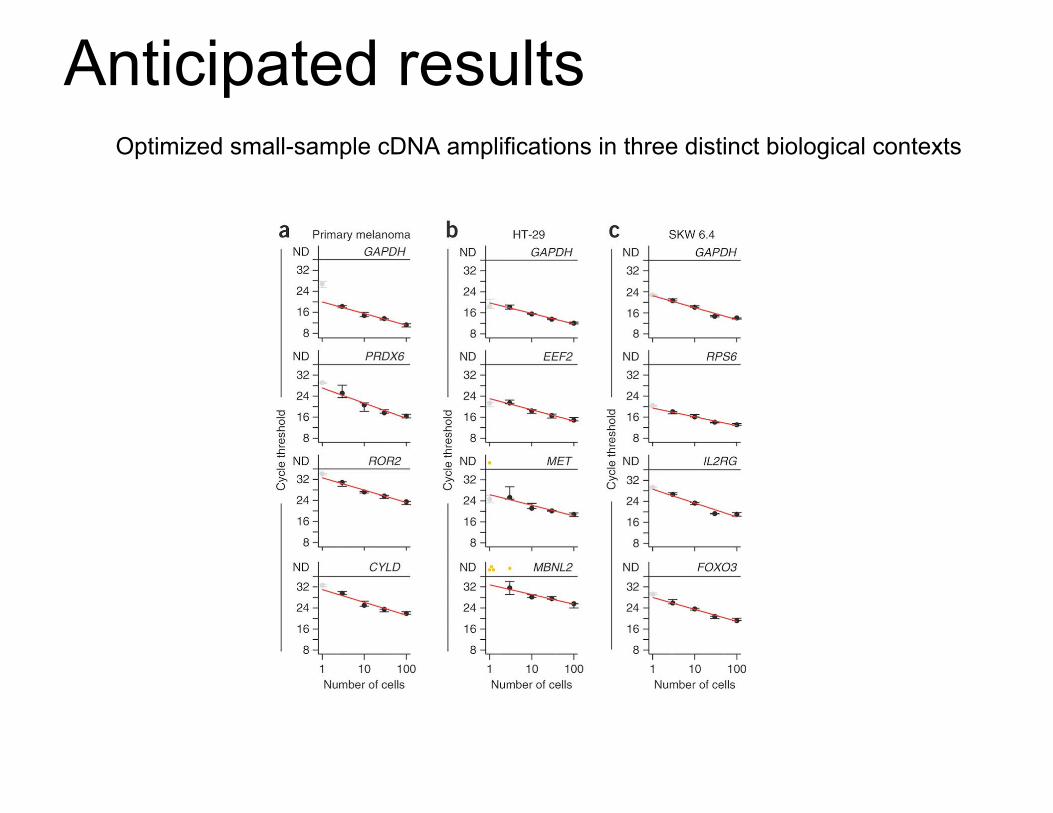
Anticipated resultsOptimized small-sample cDNA amplifications in three distinct biological contexts
What we are going to do in the lab today:
1. Standard curve with purified amplicon
high-abundant genes: GAPDH, HINT1 middle-abundant gene: MRPL33 low abundance gene: ANGPTL4
2. Optimization with Stochastic Profiling Samples
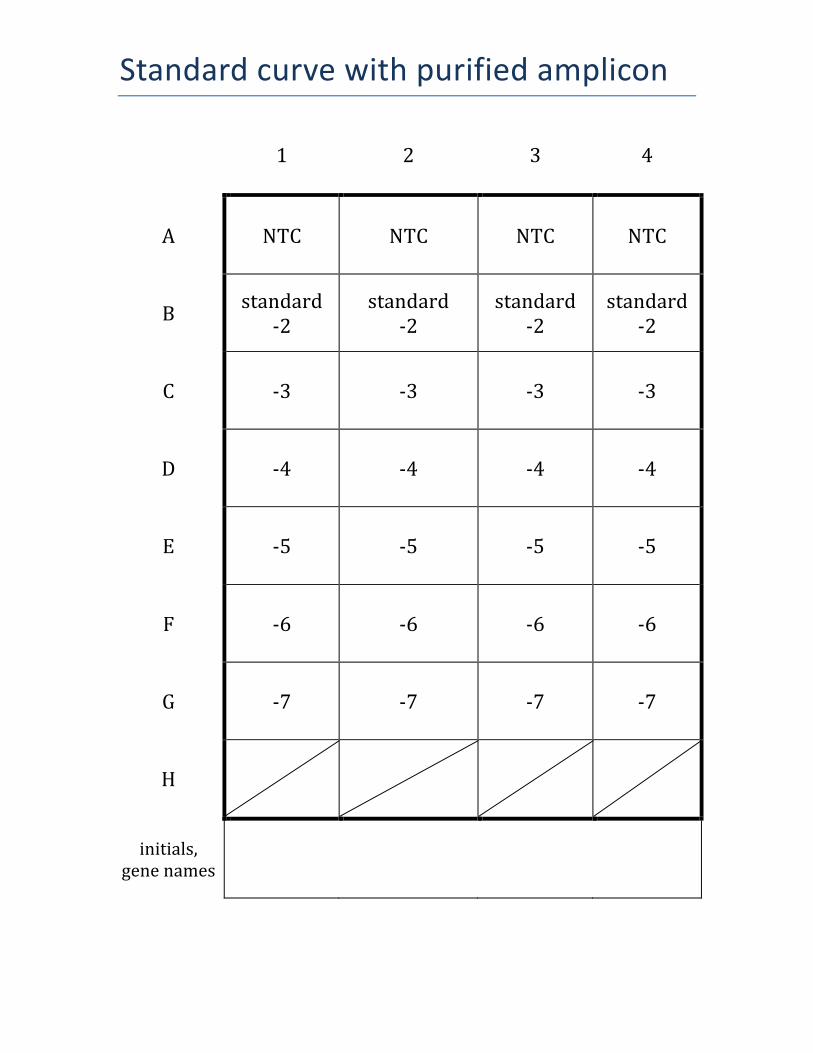
Standard curve with purified amplicon
1 2 3 4
A NTC NTC NTC NTC
B standard -‐2
standard -‐2
standard -‐2
standard -‐2
C -‐3 -‐3 -‐3 -‐3
D -‐4 -‐4 -‐4 -‐4
E -‐5 -‐5 -‐5 -‐5
F -‐6 -‐6 -‐6 -‐6
G -‐7 -‐7 -‐7 -‐7
H
initials, gene names
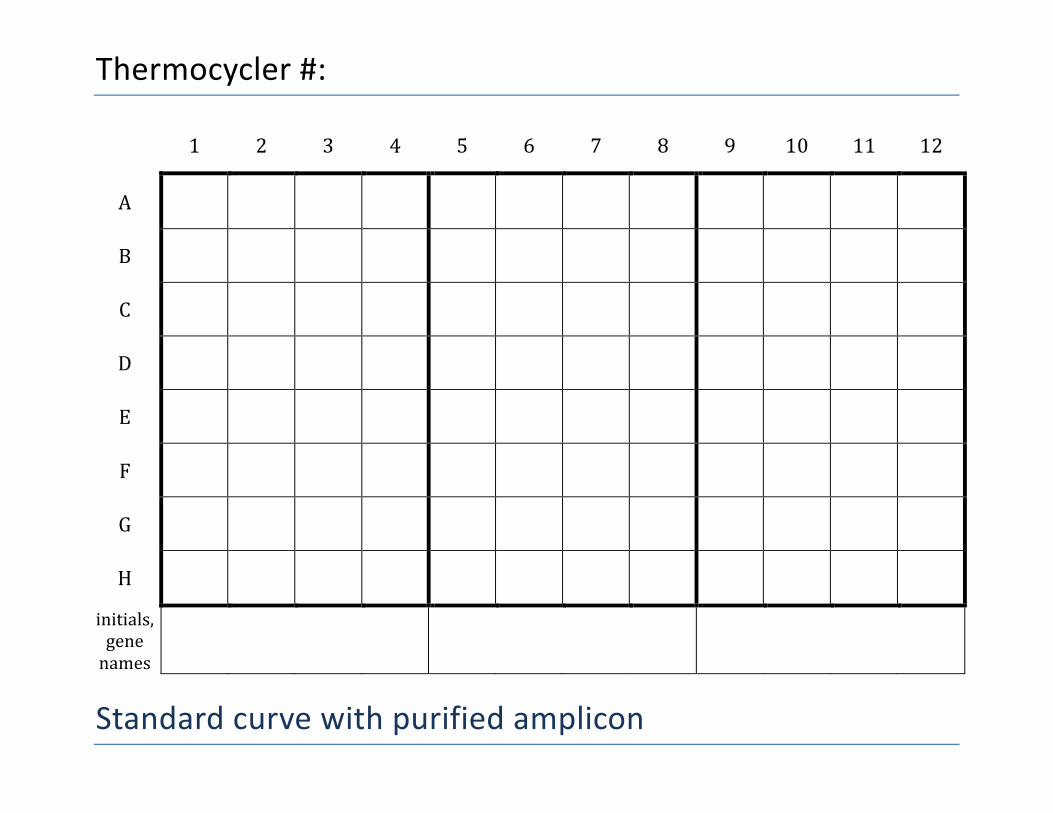
Thermocycler #:
Standard curve with purified amplicon
1 2 3 4 5 6 7 8 9 10 11 12
A
B
C
D
E
F
G
H
initials, gene names
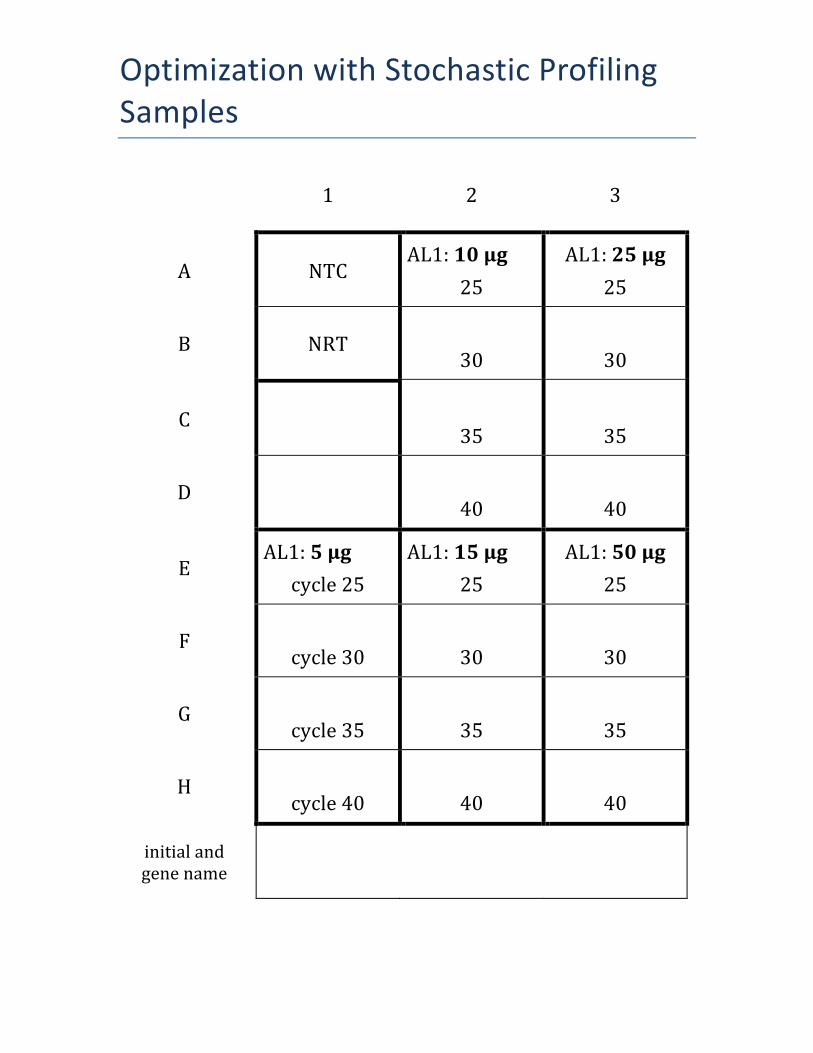
Optimization with Stochastic Profiling Samples
1 2 3
A NTC AL1: 10 μg
25 AL1: 25 μg
25
B NRT
30
30
C
35
35
D
40
40
E AL1: 5 μg
cycle 25 AL1: 15 μg
25 AL1: 50 μg
25
F
cycle 30
30
30
G
cycle 35
35
35
H
cycle 40
40
40
initial and gene name
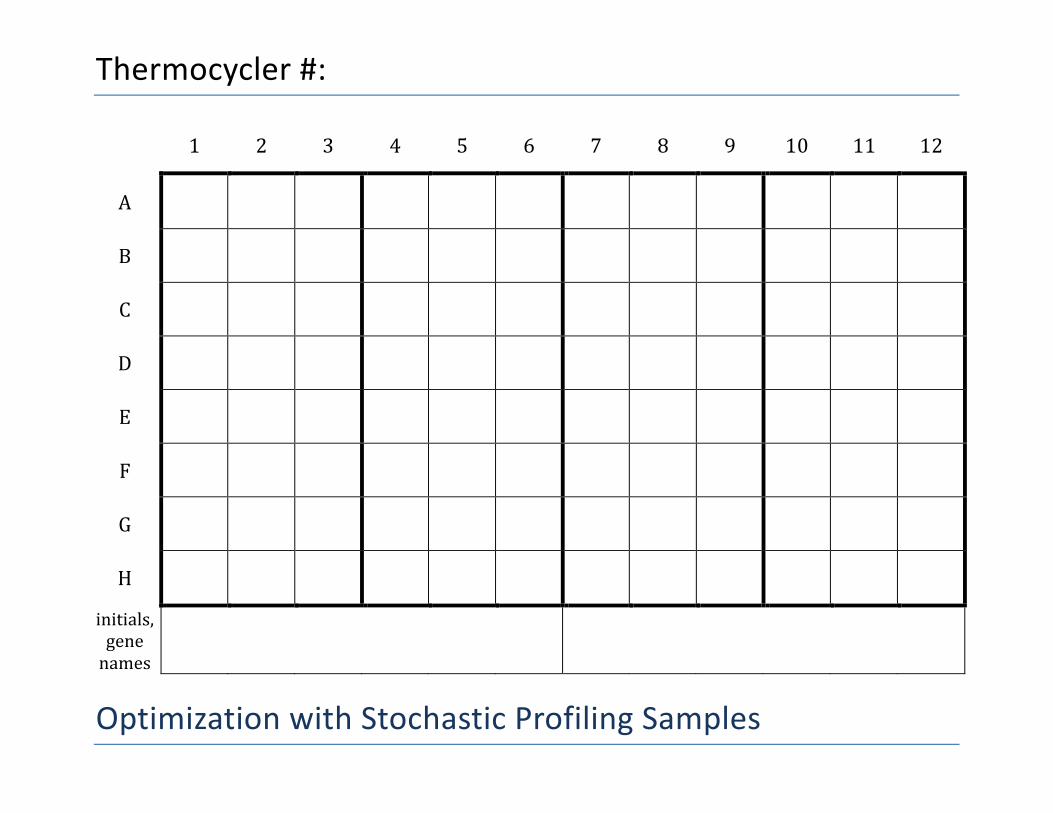
Thermocycler #:
Optimization with Stochastic Profiling Samples
1 2 3 4 5 6 7 8 9 10 11 12
A
B
C
D
E
F
G
H
initials, gene names
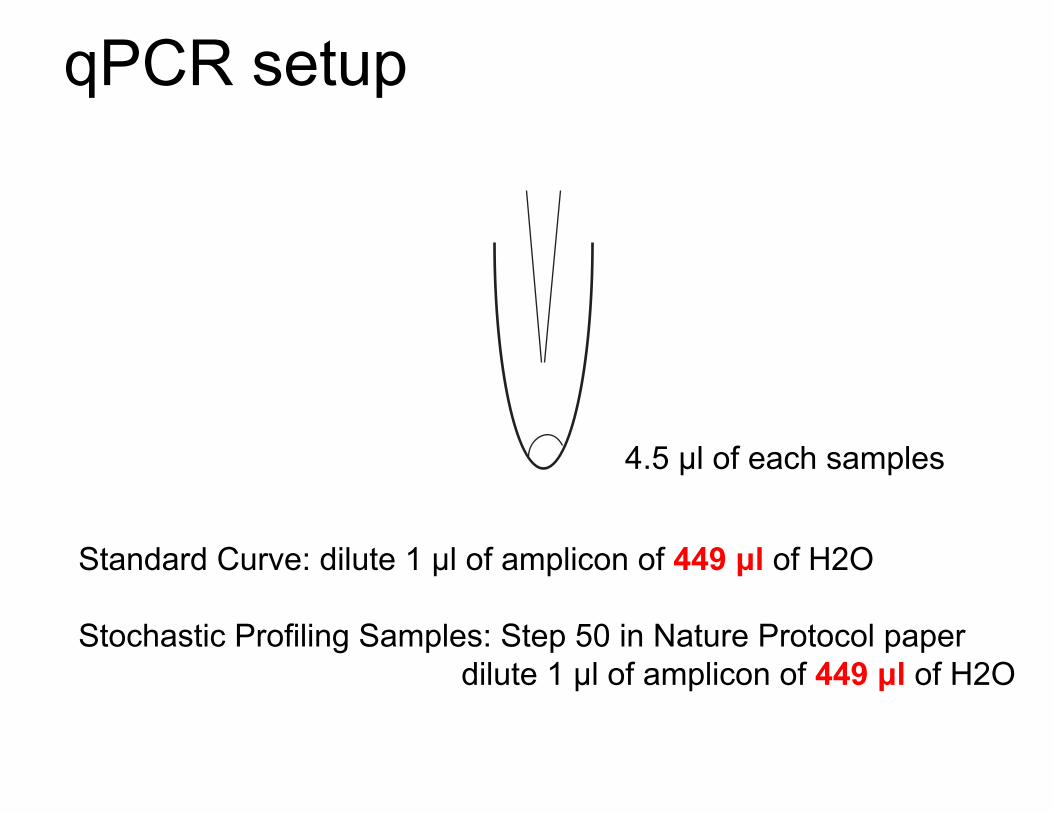
qPCR setup
4.5 μl of each samples
Standard Curve: dilute 1 μl of amplicon of 449 μl of H2O
Stochastic Profiling Samples: Step 50 in Nature Protocol paper dilute 1 μl of amplicon of 449 μl of H2O
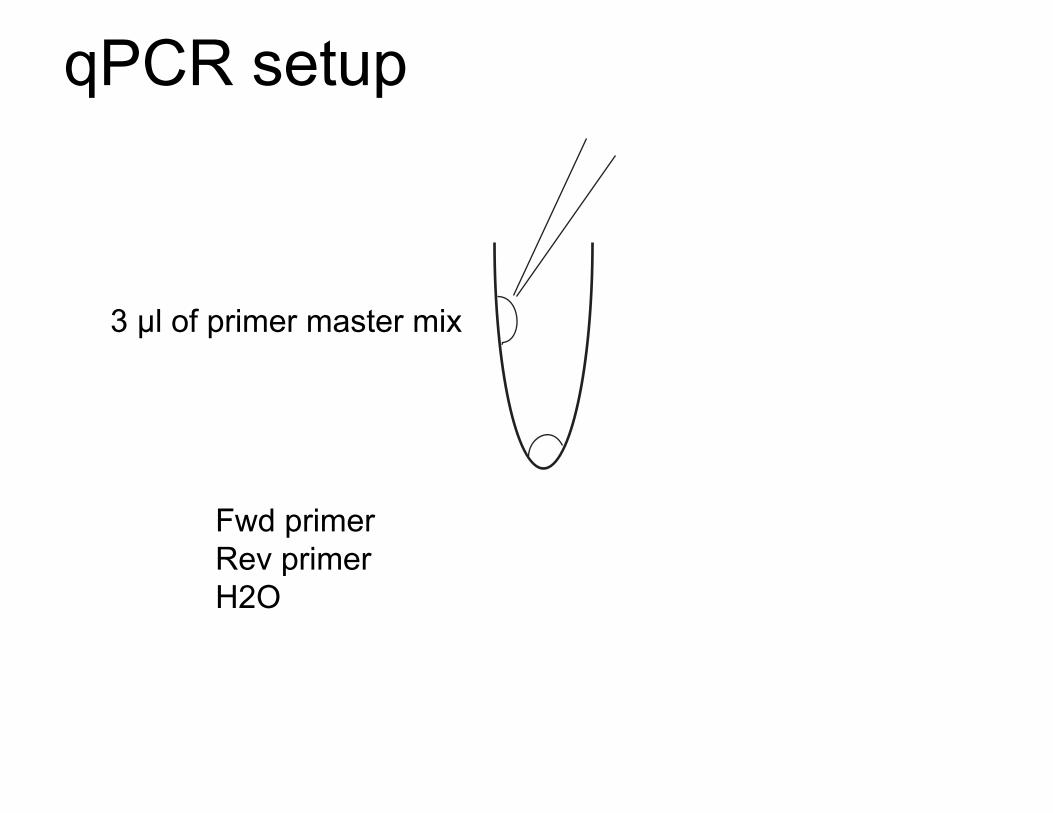
qPCR setup
3 μl of primer master mix
Fwd primerRev primer H2O
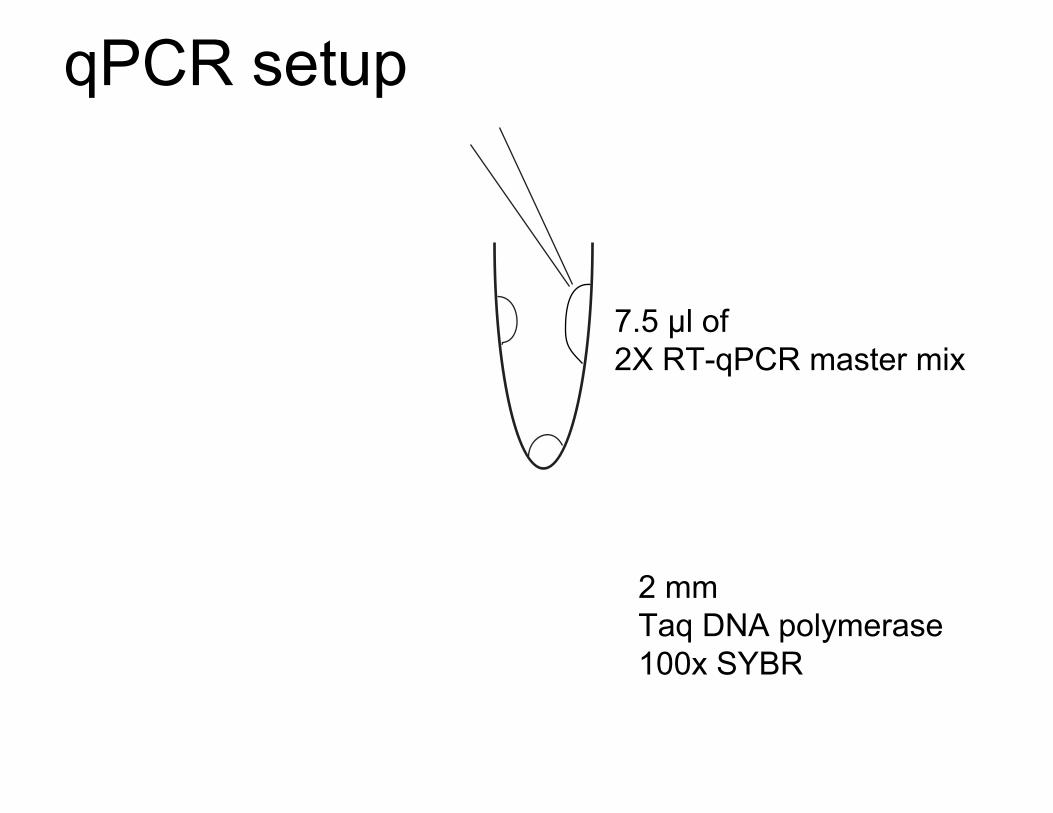
qPCR setup
7.5 μl of 2X RT-qPCR master mix
2 mm Taq DNA polymerase100x SYBR

![Janes Case (US [Janes] v Mexico)](https://static.fdocuments.net/doc/165x107/553757a04a795941208b4cb5/janes-case-us-janes-v-mexico.jpg)