
qPCR Guide
68
qPCR guide
-
Upload
viswa-deepika -
Category
Documents
-
view
36 -
download
1
description
Polymerase chain reaction guide
Transcript of qPCR Guide

qPCRgu ide


3
EUROGENTEC | www.eurogentec.com | [email protected]
pREfaCE
Real-Time quantitative PCR, or qPCR in short, is heralded as the gold standard for accurate, sensitive and fast quantification of nucleic acid sequences. Indeed it is a wonderful technology, simple to perform and the risk for cross contamination is extremely low, as reaction tubes do not need to be opened. However, the simplicity of generating data is also the Achilles heel of qPCR. Nowadays, high quality reagents are available, and dedicated instruments do a perfect job. Hence, anyone that masters the skill of pipetting can generate beautiful sigmoidal amplification curves. What many investigators unfortunately fail to appreciate is quality control, which is essential throughout the entire qPCR workflow (from living cells, over extraction of nucleic acids, storage, various enzymatic steps such as DNase treatment, reverse transcription and PCR amplification, and finally data-analysis) in order to draw biologically meaningful conclusions. It is now well over 10 years after the conception of qPCR and there is still no consensus on good laboratory practice in general, and the level of quality control, experiment design and the data-analysis strategy in particular. As such, the life science literature is flawed with studies that are meaningless, inconclusive, or in the worst case erroneous (resulting in retraction of some papers). Fortunately, standards for data exchange and reporting guidelines are finding their way to the scientific community (see for example efforts made by the RDML consortium, http://www.rdml.org).
When inspecting the scientific literature relating to qPCR, it is clear that the number of publications over the years follows the same exponential rate as the PCR reaction itself. Currently, there is no plateau phase in sight; qPCR remains a growing market, especially in clinical diagnostics. In the research field, gene expression analysis is by far the most popular application, with double stranded DNA specific binding dyes and hydrolysis probes as the dominating detection chemistries (source: the Real-Time PCR Primer and Probe database, RTPrimerDB, http://medgen.ugent.be/rtprimerdb/).
Coming from relatively low throughput qPCR systems a decade ago, 384-well instruments have now become more and more mainstream. “New kids” are now also on the block, implementing nanofluidic technologies, significantly increasing throughput and decreasing reaction volumes (down to nanoliter range), without the need for advanced liquid handling instruments. Following this promising path of ever increasing throughput, we might foresee a future in which we will simply PCR profile entire signalling networks or pathways, or even determine the expression level of almost every gene in an organism within only a few hours, with unprecedented sensitivity, accuracy and at low cost. Surely, it’s a long road with many hidden obstacles, but witnessing the tremendous progress the science community have made in the last decade, the envisioned whole genome PCR profiling comes within reach.
Jo VandesompeleProfessor functional genomics and applied bio-informatics, Ghent UniversityCo-founder and CEO, Biogazelle, the Real-Time PCR data analysis company
qpCR guide
EUROGENTEC | www.eurogentec.com | [email protected]
TablE Of CONTENTs
Introduction 6
preliminary steps 7
Template preparation: DNA or RNA 7
One-step or two-step reaction? 8
Which type of primers for the Reverse Transcription? 9
Qualitative vs quantitative pCR technologies 10
What are qualitative PCR & quantitative PCR? 10
Quantitative PCR 11
Qualitative PCR 11
Detection methods 12
SYBR® Green I 12
High Resolution Melting dyes (HRM dyes) 13
TaqMan® probes = Double-Dyes probes 13
LNA® Double-Dye probes 15
Molecular Beacon probes 16
Scorpions® primers 18
Hybridization probes (also called FRET probes) 19
TaqMan® MGB® probes 20
MGB Eclipse® probes 20
Other technologies 21
When should I multiplex? 21
How do you get started in qpCR? 22
Thermocycler 22
qPCR reagents : formats and components? 24
Core kits or MasterMixes? 24
Role of core kits and MasterMixes components 24
Probe and primer quality 26
Manual coupling 26
Automatic coupling 26
Purification level 26
5
EUROGENTEC | www.eurogentec.com | [email protected]
Guidelines for primers and probes design 27
General rules 27
Design guidelines for SYBR® Green I assays 28
Design guidelines for Double-Dye Probe assays 29
Quenching principle 31
Fluorophore and quencher: definitions 31
Different ways of quenching 31
FRET quenching 32
Optimal flurophore quencher combination 32
Dye-thermocyclers compatibility table 34
Double-Dye Oligonucleotides in single-color detection 34
Double-Dye Oligonucleotides for multiplexing detection 34
Example of a classical assay 36
Some tips and tricks before starting 36
Classical protocol and thermal profile 37
Useful definitions 38
Normalization and quantification methods 39
Absolute quantification 41
Relative quantification 41
Evaluation of your qpCR assay 43
Controls 43
Negative controls 43
Positive controls 44
Commonly used control kits 45
Singleplex or multiplex assay for the controls? 45
Role of the standard curve and evaluation of its parameters 46
PCR efficiency 46
R square (R²) 47
Sensitivity 47
Reproductibility 47
Specificity of a SYBR® Green I assay 47
Optimization tips 49
In general 49
For probe multiplexing assay/qualitative qPCR 50
Troubleshooting guide 51
frequently asked Questions 53
Eurogentec products 55
References 64
qpCR guide
EUROGENTEC | www.eurogentec.com | [email protected]
This guide is dedicated for both beginners and experts in qPCR. It explains both the basics of qPCR and gives useful tips for troubleshooting. Real-Time qPCR is a technique that involves a high number of parameters, all of them having to be optimized to get the highest quality assay, and all of which are specific to one assay only. There is consequently no “magic formula”. However, this booklet can provide tools to help you, from your first contact with qPCR to the optimization steps. If you are an expert, just go straight to the last pages of this booklet. We hope that by working through the pages, we will help you enjoy this technique and reach the best results for your research!
INTROdUCTION
The Polymerase Chain Reaction (PCR) has been invented in 1983 by Kary Mullis (Nobel Price in 1993), (Mullis K. et Fobona F., 1987). Three years after its invention, there was an incredible expansion of its use thanks to the commercialization of the Taq polymerase, a polymerase that resists high temperatures. In 1991, the first hydrolysis probe was used in combination with the technique. In 1992, the technique was again improved by the use of Ethidium Bromide (EtBr), thanks to the fluorescence that results from the binding to duplex DNA. The kinetics of fluorescence accumulation during thermocycling was directly related to the starting number of DNA copies. This was the starting point of Real-Time qPCR. Today, 25 years after Mullis’s discovery, both PCR and qPCR are widely used technologies. The principle, and aim, of the PCR technology is to specifically increase a target from an undetectable amount of starting material. In classical PCR, at the end of the amplification, the product can be run on a gel for detection of this specific product. In Real-Time PCR, this step can be avoided since the technology combines the DNA amplification with the immediate detection of the products in a single tube. The homogeneous format is highly beneficial as it removes the significant contamination risk caused by opening tubes for post-PCR manipulation. It is also less time consuming than gel based analysis and can give a quantitative result (Kubista M. et al., 2006).
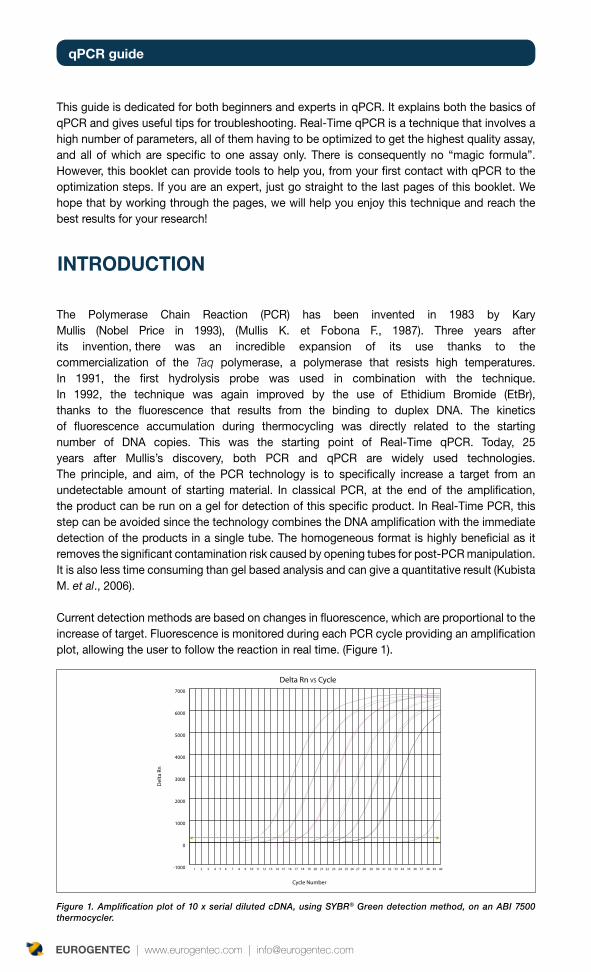
Current detection methods are based on changes in fluorescence, which are proportional to the increase of target. Fluorescence is monitored during each PCR cycle providing an amplification plot, allowing the user to follow the reaction in real time. (Figure 1).
-1000
0
1000
2000
3000
4000
5000
6000
7000
Delta Rn VS Cycle
Del
ta R
n
Cycle Number
1 2 3 4 5 6 7 8 9 10 11 12 13 14 15 16 17 18 19 20 21 22 23 24 25 26 27 28 29 30 31 32 33 34 35 36 37 38 39 40
Figure 1. Amplification plot of 10 x serial diluted cDNA, using SYBR® Green detection method, on an ABI 7500 thermocycler.
7
EUROGENTEC | www.eurogentec.com | [email protected]
pRElImINaRy sTEps
Variability in qPCR is often related to steps upstream to the qPCR step itself. Sample extraction, quantity of sample, or efficiency of the reverse transcription (RT) are some of the many parameters that can influence the results of your qPCR assay.
That’s why it is important to also consider the quality of these steps prior to performing your qPCR assay (Fleige S. and Pfaffl MW, 2006).
Template preparation: dNa or RNaDNA and RNA can be extracted with Trizol. This includes many steps and a careful wash of the sample, hence we recommend the use of an appropriate commercially available kit. Many column-based kits, which will contain all the required reagents for the full extraction / purification procedure are available.
These kits will also outline general guidelines, such as the storage conditions and shelf life of the extracted RNA or DNA. However these guidelines may vary between kits due to the different composition of buffers. It is also recommended that the buffers supplied with each kit are used according to the manufacturer protocol.
The final product should be cleaned and free from any residual buffers such as EDTA or buffers containing solvents. Otherwise, these residual products may inhibit the action of the Taq polymerase for the PCR step, or could modify the salt concentration of the buffer. This is usually not a problem when using spin column kits instead of manual extraction techniques.
It is worth bearing in mind, that this first step is nearly the most important of your RT-qPCR assay, as the quality of the extraction will influence the quality of your detection and quantification.It’s mostly important to ensure the reproducibility of your extraction steps, if you wish to compare biological samples.
The main problems that can occur, are extraction of inhibitors together with the nucleic acids or degradation of the sample. Inhibitors are mainly found in blood sample or environmental samples. For example, humic acid can be a strong inhibitor in samples extracted from soil. As a general rule, it is always better to extract DNA/RNA from fresh sample and to store it at -80 °C.
qpCR guide
EUROGENTEC | www.eurogentec.com | [email protected]
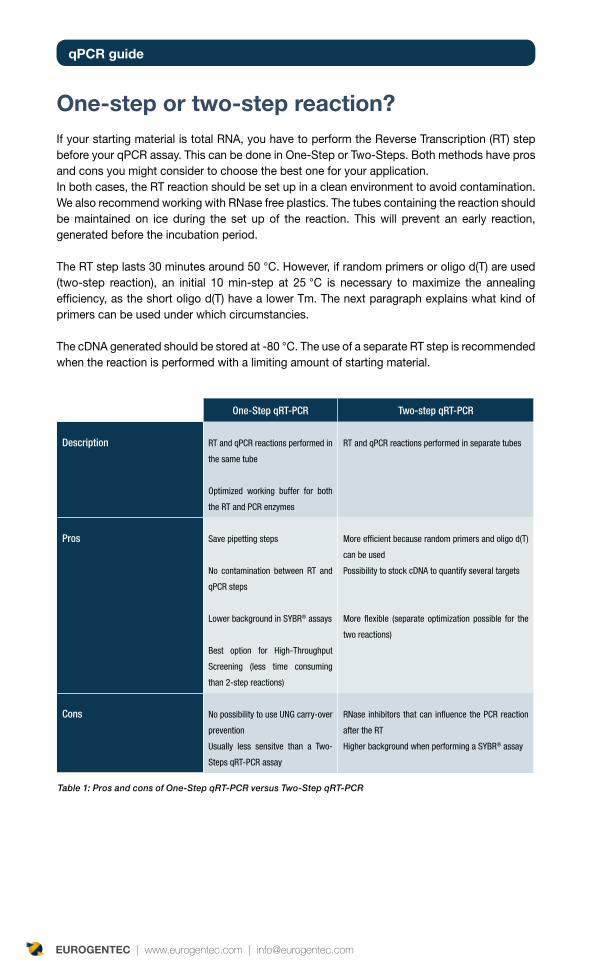
One-step or two-step reaction?If your starting material is total RNA, you have to perform the Reverse Transcription (RT) step before your qPCR assay. This can be done in One-Step or Two-Steps. Both methods have pros and cons you might consider to choose the best one for your application.In both cases, the RT reaction should be set up in a clean environment to avoid contamination. We also recommend working with RNase free plastics. The tubes containing the reaction should be maintained on ice during the set up of the reaction. This will prevent an early reaction, generated before the incubation period.
The RT step lasts 30 minutes around 50 °C. However, if random primers or oligo d(T) are used (two-step reaction), an initial 10 min-step at 25 °C is necessary to maximize the annealing efficiency, as the short oligo d(T) have a lower Tm. The next paragraph explains what kind of primers can be used under which circumstancies.
The cDNA generated should be stored at -80 °C. The use of a separate RT step is recommended when the reaction is performed with a limiting amount of starting material.
Table 1: Pros and cons of One-Step qRT-PCR versus Two-Step qRT-PCR
One-Step qRT-PCR Two-step qRT-PCR
Description RT and qPCR reactions performed in
the same tube
Optimized working buffer for both
the RT and PCR enzymes
RT and qPCR reactions performed in separate tubes
Pros Save pipetting steps
No contamination between RT and
qPCR steps
Lower background in SYBR® assays
Best option for High-Throughput
Screening (less time consuming
than 2-step reactions)
More efficient because random primers and oligo d(T)
can be used
Possibility to stock cDNA to quantify several targets
More flexible (separate optimization possible for the
two reactions)
Cons No possibility to use UNG carry-over
prevention
Usually less sensitve than a Two-
Steps qRT-PCR assay
RNase inhibitors that can influence the PCR reaction
after the RT
Higher background when performing a SYBR® assay
9
EUROGENTEC | www.eurogentec.com | [email protected]
Which type of primers for the Reverse Transcription?
When performing a RT, it is possible to use three different types of primers:
short random primers, which bind anywhere in the genome and allow the reverse •transcriptase to fill up the gaps, lead to higher yields
oligo d(T) bind to the poly-A tail of the RNA and then only transcribe RNA. This •will avoid contamination by genomic DNA. As the poly-A tail is located at the extremity of the gene, it will also lead to more full transcripts
specific primers, which bind to the gene of interest•
The combination of oligo d(T) primers and random primers will give the highest yields and the longest transcripts, whereas specific primers transcribe only specific RNA but reduce the yield.
With a One-Step qRT-PCR reaction, using specific primers is the only option, as it should be avoided that oligo d(T) primers and random nonamers participate in the PCR step, giving many aspecific products. The RT step is performed at 40-50 °C and the specific PCR primers are designed for the PCR step at 60 °C, leading to partial annealing of the primers during the RT step. In a Two-Steps qRT-PCR kit, oligo d(T) primers or/and random nonamers are used in the RT step, and specific primers in the PCR step, leading to specific cDNA.
qpCR guide
EUROGENTEC | www.eurogentec.com | [email protected]
QUalITaTIvE vs. QUaNTITaTIvE pCR
What are qualitative pCR & quantitative pCR?
Firstly it is important to review the principles of PCR, before making the distinction between qualitative and quantitative PCR.
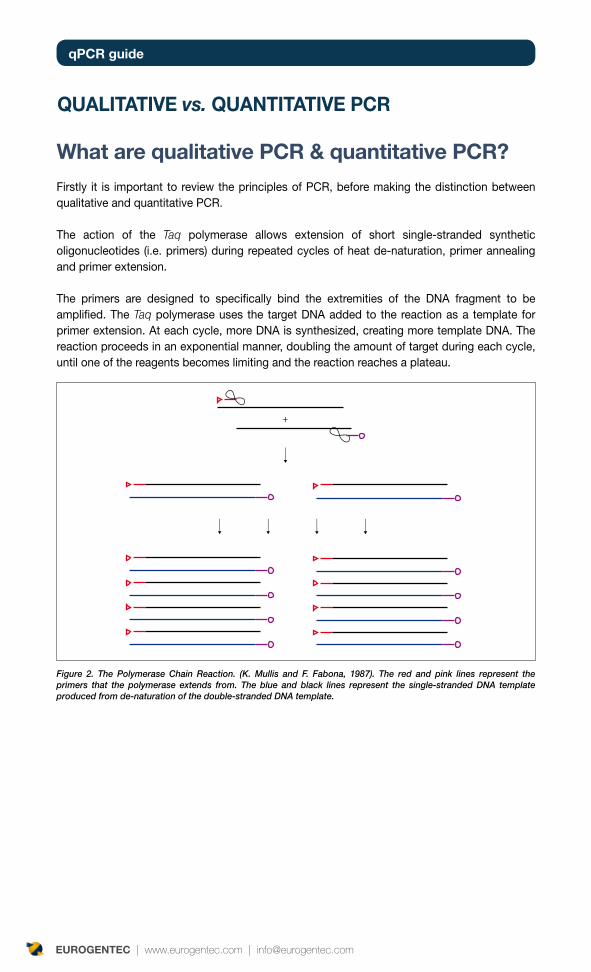
The action of the Taq polymerase allows extension of short single-stranded synthetic oligonucleotides (i.e. primers) during repeated cycles of heat de-naturation, primer annealing and primer extension.
The primers are designed to specifically bind the extremities of the DNA fragment to be amplified. The Taq polymerase uses the target DNA added to the reaction as a template for primer extension. At each cycle, more DNA is synthesized, creating more template DNA. The reaction proceeds in an exponential manner, doubling the amount of target during each cycle, until one of the reagents becomes limiting and the reaction reaches a plateau.
Figure 2. The Polymerase Chain Reaction. (K. Mullis and F. Fabona, 1987). The red and pink lines represent the primers that the polymerase extends from. The blue and black lines represent the single-stranded DNA template produced from de-naturation of the double-stranded DNA template.
11
EUROGENTEC | www.eurogentec.com | [email protected]
Quantitative PCR
In quantitative qPCR, a specific or non-specific detection chemistry allows the quantification of the amplified product. The amount detected at a certain point of the run is directly related to the initial amount of target in the sample.
The most common applications of quantitative PCR are gene expression analysis, pathogen detection/quantification and microRNA quantification (Schmittgen TD et al.,2008).
For example, effects of different treatments, on the level of mRNA transcription can be measured. Quantitative PCR software uses the exponential phase of PCR for quantification. PCR is initially an exponential process but eventually reaches a plateau phase, when one of the reagents becomes limited. Reactions can plateau at different levels even if they have the same starting concentration of target. During the exponential phase, the amount of target is assumed to be doubling every cycle and no bias is expected due to limiting reagents. Analysis takes the Ct (cycle number) value, at the point when the signal is detected above the background and the amplification is in exponential phase. The more abundant the template sample, the quicker this point is reached, thus giving earlier Ct values. Differences in Ct then have to be correlated to some other quantitative values to make them meaningful (cf. p. 39).
Qualitative PCR
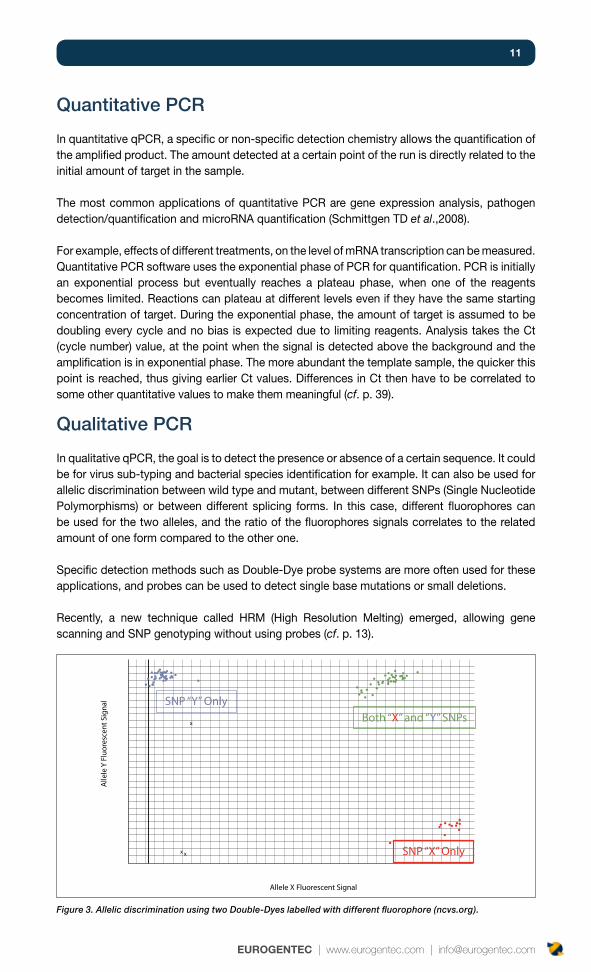
In qualitative qPCR, the goal is to detect the presence or absence of a certain sequence. It could be for virus sub-typing and bacterial species identification for example. It can also be used for allelic discrimination between wild type and mutant, between different SNPs (Single Nucleotide Polymorphisms) or between different splicing forms. In this case, different fluorophores can be used for the two alleles, and the ratio of the fluorophores signals correlates to the related amount of one form compared to the other one.
Specific detection methods such as Double-Dye probe systems are more often used for these applications, and probes can be used to detect single base mutations or small deletions.
Recently, a new technique called HRM (High Resolution Melting) emerged, allowing gene scanning and SNP genotyping without using probes (cf. p. 13).
Figure 3. Allelic discrimination using two Double-Dyes labelled with different fluorophore (ncvs.org).
Allele X Fluorescent Signal
Alle
le Y
Flu
ores
cent
Sig
nal
Both “X” and “Y” SNPsSNP “Y” Only
SNP “X” Only
qpCR guide
EUROGENTEC | www.eurogentec.com | [email protected]
detection methodsIn order to detect and measure the amount of target in the sample, a measurable signal has to be generated, which is proportional to the amount of amplified product. All current detection systems use fluorescent technologies.
Some of them are non-specific techniques, and consequently only allow the detection of one target at a time. Alternatively, specific detection chemistries can distinguish between non-specific amplification and target amplification. These specific techniques can be used to multiplex the assay, i.e. detecting several different targets in the same assay.
SYBR® Green I
SYBR® Green I is the most commonly used dye for non-specific detection. It is a double-stranded DNA intercalating dye, that fluoresces once bound to the DNA. A pair of specific primers is required to amplify the target with this chemistry. The amount of dye incorporated is proportional to the amount of generated target. The dye emits at 520 nm and fluorescence emitted can be detected and related to the amount of target.
The inconvenience of this technique is that the SYBR® Green I will bind to any amplified dsDNA. Consequently, primer dimers or unspecific products introduce a bias in the quantification. However, it is still possible to check for the specificity of the system by running a meltcurve at the end of the PCR run (cf. p. 47). The principle is that every product has a different dissociation temperature, depending of the size and base contents, so it is still possible to check the number of products amplified. A valid SYBR® assay - primer pair - should produce a unique, well defined peak on the meltcurve.
For these reasons, SYBR® Green I is rarely used for qualitative PCR. However, SYBR® Green I is often used as the first step to optimize a specific detection system assay, to check the specificity of the primers and validate the design.
SYBR® Green I advantages
Low cost assay•
Easy design and set up•
SYBR® Green I disadvantages
Non specific system•
Not adapted to multiplex•
Non suitable for qualitative qPCR•
13
EUROGENTEC | www.eurogentec.com | [email protected]
High Resolution Melting dyes (HRM dyes)
High Resolution Meltcurve analysis is a newly emerging technology, which characterizes nucleic acid samples based on their dissociation behaviour. It combines the principle of intercalating dyes, meltcurve analyses and the application of specific statistical analyses.
HRM uses the fundamental property of the separation of the two strands of DNA with heat (melting), and the monitoring of this melting with a fluorescent dye. On the contrary of SYBR Green, HRM dyes do not inhibit PCR at high concentration. The dye can consequently saturate the amplified target dsDNA and fluoresces. Melting temperature of a dsDNA target depends on GC content, length, and sequence. Due to the high sensitivity of HRM dyes, even a single base change will induce differences in the melting curve, and consequently in fluorescence (Erali M. et al., 2008).
Main applications of HRM include gene scanning (search for the presence of unknown variations in PCR amplicons), SNP genotyping, DNA methylation analysis, DNA mapping, DNA fingerprinting.This emerging method is less expensive and as precise than probe-based methods.
Only a few thermocyclers on the market currently allow the use of this technology, among them the Roche LightCycler®480, the Corbett Life Science Rotor-Gene™ 6000, and the ABI Prism® 7500. The main HRM dyes available are EvaGreen, LCGreen®, SYTO® 9 and BEBO.
TaqMan® probes = Double-Dye probes
TaqMan® probes, also called Double-Dye Oligonucleotides, Double-Dye Probes, or Dual-Labelled probes, are the most widely used type of probes and are often the method of choice for scientists who have just started using Real-Time PCR. They were developed by Roche (Basel, Switzerland) and ABI (Foster City, USA) from an assay that originally used a radio-labelled probe (Holland et al. 1991), which consisted of a single-stranded probe sequence that was complementary to one of the strands of the amplicon.
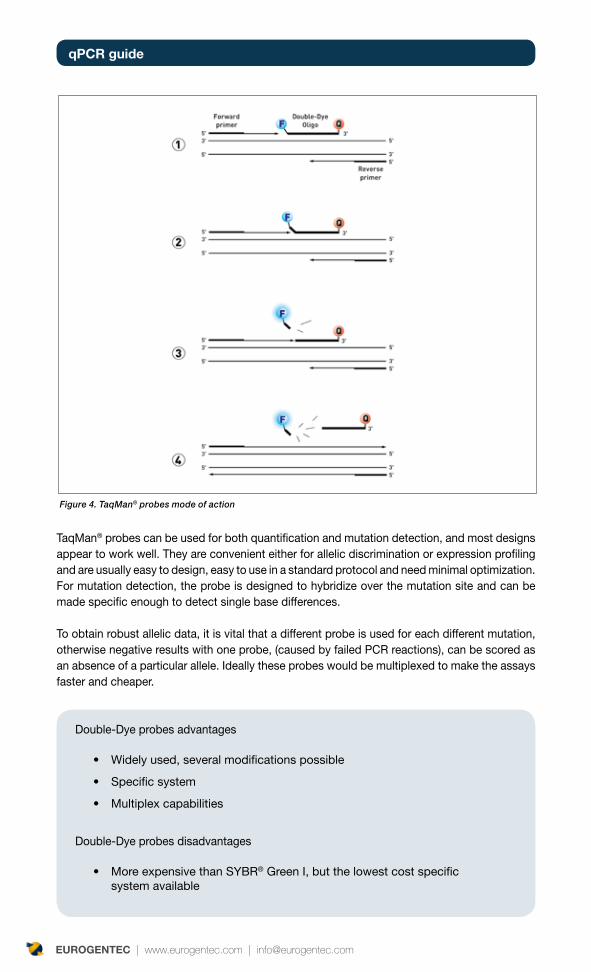
A fluorophore is attached to the 5’ end of the probe and a quencher to the 3’ end. The fluorophore is excited by the machine and passes its energy, via FRET (Fluorescence Resonance Energy Transfer) to the quencher. Traditionally the FRET pair has been FAM as the fluorophore and TAMRA as the quencher. In a well designed probe (cf. Taqman® design rules on p. 30), FAM does not fluoresce as it passes its energy onto TAMRA. As TAMRA fluorescence is detected at a different wavelength to FAM, the background level of FAM is low. The probe binds to the amplicon during each annealing step of the PCR. When the Taq polymerase extends from the primer which is bound to the amplicon, it displaces the 5’ end of the probe, which is then degraded by the 5’-3’ exonuclease activity of the Taq polymerase. Cleavage continues until the remaining probe melts off the amplicon (cf. fig. 4).
This process releases the fluorophore and quencher into solution, spatially separating them (compared to when they were held together by the probe). This leads to an irreversible increase in fluorescence from the FAM and a decrease in the TAMRA.
qpCR guide
EUROGENTEC | www.eurogentec.com | [email protected]
TaqMan® probes can be used for both quantification and mutation detection, and most designs appear to work well. They are convenient either for allelic discrimination or expression profiling and are usually easy to design, easy to use in a standard protocol and need minimal optimization. For mutation detection, the probe is designed to hybridize over the mutation site and can be made specific enough to detect single base differences.
To obtain robust allelic data, it is vital that a different probe is used for each different mutation, otherwise negative results with one probe, (caused by failed PCR reactions), can be scored as an absence of a particular allele. Ideally these probes would be multiplexed to make the assays faster and cheaper.
Double-Dye probes advantages
Widely used, several modifications possible•
Specific system•
Multiplex capabilities •
Double-Dye probes disadvantages
More expensive than SYBR• ® Green I, but the lowest cost specific system available
Figure 4. TaqMan® probes mode of action
15
EUROGENTEC | www.eurogentec.com | [email protected]
LNA® Double-Dye probes
LNA® (Locked Nucleic Acid) was developed by Exiqon® (Vedbaek, Denmark). LNA® changes the conformation of the helix and increases the stability of the duplex. The integration of LNA® bases into Double-Dye Oligonucleotide probes, opens up great opportunities to improve techniques requiring high affinity probes as specific as possible, like SNP detection, expression profiling and in situ hybridization.
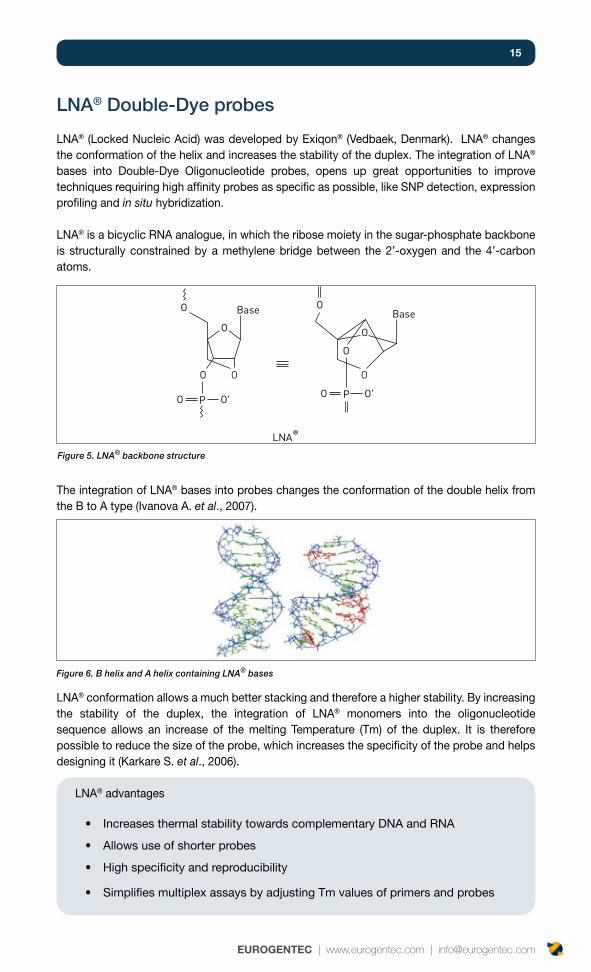
LNA® is a bicyclic RNA analogue, in which the ribose moiety in the sugar-phosphate backbone is structurally constrained by a methylene bridge between the 2’-oxygen and the 4’-carbon atoms.
The integration of LNA® bases into probes changes the conformation of the double helix from the B to A type (Ivanova A. et al., 2007).
LNA® conformation allows a much better stacking and therefore a higher stability. By increasing the stability of the duplex, the integration of LNA® monomers into the oligonucleotide sequence allows an increase of the melting Temperature (Tm) of the duplex. It is therefore possible to reduce the size of the probe, which increases the specificity of the probe and helps designing it (Karkare S. et al., 2006).
LNA® advantages
Increases thermal stability towards complementary DNA and RNA•
Allows use of shorter probes•
High specificity and reproducibility•
Simplifies multiplex assays by adjusting Tm values of primers and probes•
O
O O
BaseO
LNA
O
O
O
O O'
BaseO
PO O'P
Figure 5. LNA® backbone structure
Figure 6. B helix and A helix containing LNA® bases
qpCR guide
EUROGENTEC | www.eurogentec.com | [email protected]
Molecular Beacon probes
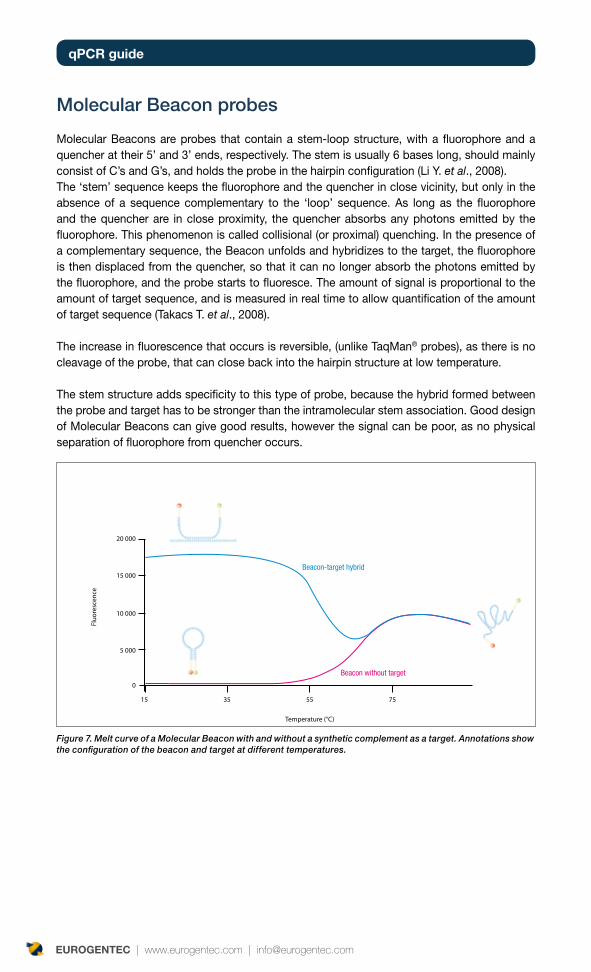
Molecular Beacons are probes that contain a stem-loop structure, with a fluorophore and a quencher at their 5’ and 3’ ends, respectively. The stem is usually 6 bases long, should mainly consist of C’s and G’s, and holds the probe in the hairpin configuration (Li Y. et al., 2008).The ‘stem’ sequence keeps the fluorophore and the quencher in close vicinity, but only in the absence of a sequence complementary to the ‘loop’ sequence. As long as the fluorophore and the quencher are in close proximity, the quencher absorbs any photons emitted by the fluorophore. This phenomenon is called collisional (or proximal) quenching. In the presence of a complementary sequence, the Beacon unfolds and hybridizes to the target, the fluorophore is then displaced from the quencher, so that it can no longer absorb the photons emitted by the fluorophore, and the probe starts to fluoresce. The amount of signal is proportional to the amount of target sequence, and is measured in real time to allow quantification of the amount of target sequence (Takacs T. et al., 2008).
The increase in fluorescence that occurs is reversible, (unlike TaqMan® probes), as there is no cleavage of the probe, that can close back into the hairpin structure at low temperature.
The stem structure adds specificity to this type of probe, because the hybrid formed between the probe and target has to be stronger than the intramolecular stem association. Good design of Molecular Beacons can give good results, however the signal can be poor, as no physical separation of fluorophore from quencher occurs.
Figure 7. Melt curve of a Molecular Beacon with and without a synthetic complement as a target. Annotations show the configuration of the beacon and target at different temperatures.
Temperature (°C)
Fluo
resc
ence
20 000
15 000
10 000
5 000
0
15 35 55 75
Beacon without target
Beacon-target hybrid

17
EUROGENTEC | www.eurogentec.com | [email protected]
Two improved forms of Molecular Beacons exist:
Wavelength-Shifting Molecular Beacons•Wavelength-Shifting Molecular Beacons are brighter than standard Molecular Beacons due to an enhanced fluorescence intensity of the emitter fluorophore. These probes contain a harvester fluorophore that absorbs strongly in the wavelength range of the monochromatic light source, an emitter fluorophore of the desired emission color, and a non-fluorescent (dark) quencher. In the absence of complementary nucleic acid targets, the probes are non-fluorescent, whereas in the presence of targets, they fluoresce, not in the emission range of the harvester fluorophore, that absorbs the light, but rather in the emission range of the emitter fluorophore. This shift in emission spectrum is due to the transfer of the absorbed energy from the harvester fluorophore to the emitter fluorophore by FRET, which only takes place in probes that are bound to the targets. Wavelength-Shifting Molecular Beacons are substantially brighter than conventional Molecular Beacons that cannot efficiently absorb energy from the available monochromatic light source (Tyagi S. et al., 2000).
2’ O-Methyl RNA Molecular Beacons•To detect the various RNA classes in living cells, several approaches have been developed. One of these is based on the use of 2’-O-Methyl RNA Molecular Beacon probes for the detection of small nuclear RNAs. 2’-O-methyl RNA probes are considered to perform better than DNA oligonucleotides because they are not only nuclease resistant, but also possess a higher affinity, increased specificity, faster hybridization kinetics, and a superior ability to bind to structured targets compared to DNA oligonucleotides. Recently Molecular Beacons were introduced for RNA detection in living cells. The rationale for using Molecular Beacons to detect RNAs in living cells was to improve signal-to-noise ratios by eliminating fluorescence signals derived from non-hybridized probe sequences.It appears that linear 2’-O-Methyl RNA probes are usually more suitable for specific detection of these RNAs, representing different classes of RNA, in the nuclei of living cells. Molecular Beacons result in images with improved signal to noise ratios, thereby leading to better detection sensitivity.
Molecular Beacons
Reversible phenomenon (melting curve possible)•
Increased discriminatory competence due to competition intra-inter target•
qpCR guide
EUROGENTEC | www.eurogentec.com | [email protected]
Scorpions® primers
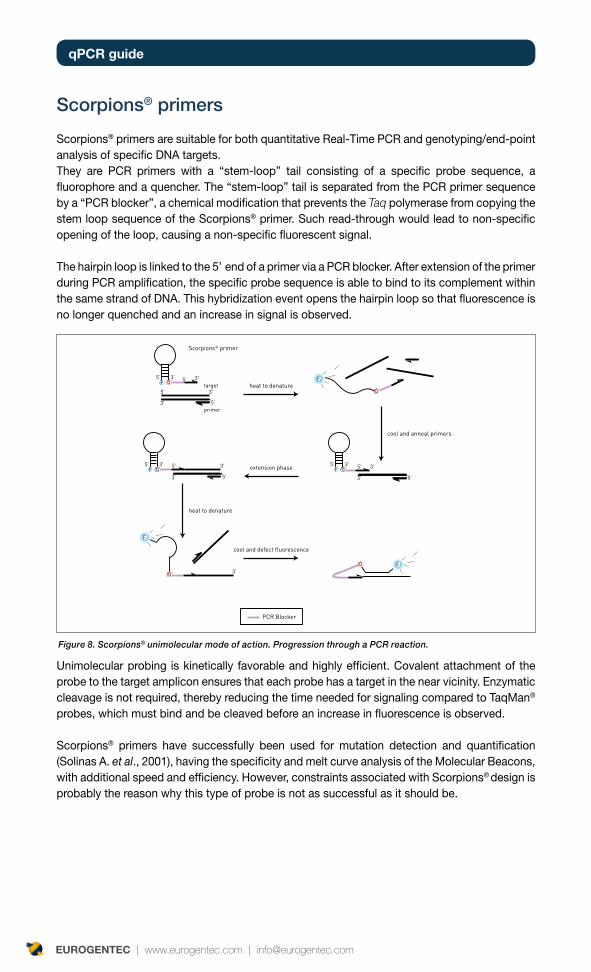
Scorpions® primers are suitable for both quantitative Real-Time PCR and genotyping/end-point analysis of specific DNA targets.They are PCR primers with a “stem-loop” tail consisting of a specific probe sequence, a fluorophore and a quencher. The “stem-loop” tail is separated from the PCR primer sequence by a “PCR blocker”, a chemical modification that prevents the Taq polymerase from copying the stem loop sequence of the Scorpions® primer. Such read-through would lead to non-specific opening of the loop, causing a non-specific fluorescent signal.
The hairpin loop is linked to the 5’ end of a primer via a PCR blocker. After extension of the primer during PCR amplification, the specific probe sequence is able to bind to its complement within the same strand of DNA. This hybridization event opens the hairpin loop so that fluorescence is no longer quenched and an increase in signal is observed.
Unimolecular probing is kinetically favorable and highly efficient. Covalent attachment of the probe to the target amplicon ensures that each probe has a target in the near vicinity. Enzymatic cleavage is not required, thereby reducing the time needed for signaling compared to TaqMan® probes, which must bind and be cleaved before an increase in fluorescence is observed.
Scorpions® primers have successfully been used for mutation detection and quantification (Solinas A. et al., 2001), having the specificity and melt curve analysis of the Molecular Beacons, with additional speed and efficiency. However, constraints associated with Scorpions® design is probably the reason why this type of probe is not as successful as it should be.
Figure 8. Scorpions® unimolecular mode of action. Progression through a PCR reaction.
19
EUROGENTEC | www.eurogentec.com | [email protected]
There are three types of Scorpions® primers :
Standard Scorpions• ®, which consist of a bi-labelled probe with a fluorescent dye at the 5’ end and an internal non-fluorescent quencher.
FRET Scorpions• ®, for use on a LightCycler® system. As the capillary system will only excite at 470 nm (FAM absorption wavelength) it is necessary to incorporate a FAM within the stem. A ROX is placed at the 5’end of the Scorpions® primer, FAM is excited and passes its energy onto the ROX.
Duplex Scorpions• ® have also been developed to give much better signal intensity than the normal Scorpions® format. In Standard Scorpions® the quencher and fluorophore remain within the same strand of DNA and some quenching can occur even in the open form. In the Duplex Scorpions® the quencher is on a different oligonucleotide and physical separation between the quencher and fluorophore is greatly increased, reducing the quenching when the probe is bound to the target.
Advantages of Scorpions® primers vs Taqman® probes
Stronger signal and lower background•
Improved SNP applications•
Compatible with any dye, convenient for extended multiplexing assays•
Primer and probe on one molecule, kinetically favorable, fast cycling •conditions
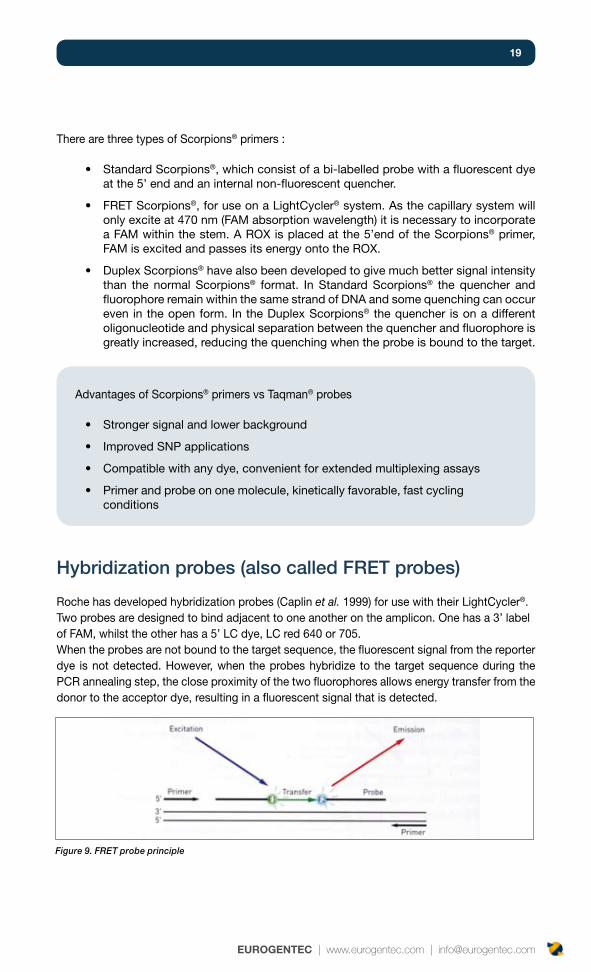
Hybridization probes (also called FRET probes)
Roche has developed hybridization probes (Caplin et al. 1999) for use with their LightCycler®. Two probes are designed to bind adjacent to one another on the amplicon. One has a 3’ label of FAM, whilst the other has a 5’ LC dye, LC red 640 or 705.When the probes are not bound to the target sequence, the fluorescent signal from the reporter dye is not detected. However, when the probes hybridize to the target sequence during the PCR annealing step, the close proximity of the two fluorophores allows energy transfer from the donor to the acceptor dye, resulting in a fluorescent signal that is detected.
Figure 9. FRET probe principle
qpCR guide
EUROGENTEC | www.eurogentec.com | [email protected]
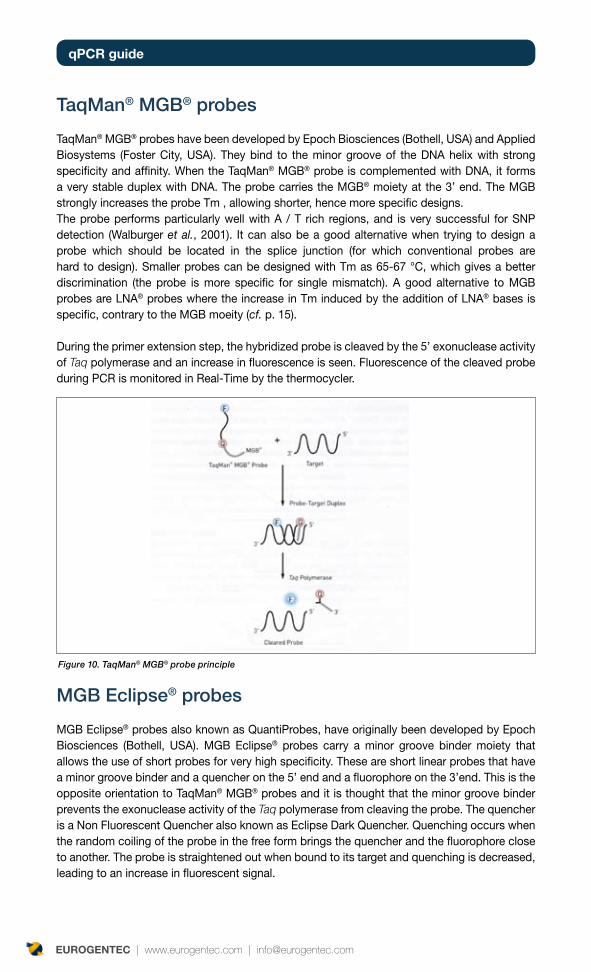
TaqMan® MGB® probes
TaqMan® MGB® probes have been developed by Epoch Biosciences (Bothell, USA) and Applied Biosystems (Foster City, USA). They bind to the minor groove of the DNA helix with strong specificity and affinity. When the TaqMan® MGB® probe is complemented with DNA, it forms a very stable duplex with DNA. The probe carries the MGB® moiety at the 3’ end. The MGB strongly increases the probe Tm , allowing shorter, hence more specific designs.The probe performs particularly well with A / T rich regions, and is very successful for SNP detection (Walburger et al., 2001). It can also be a good alternative when trying to design a probe which should be located in the splice junction (for which conventional probes are hard to design). Smaller probes can be designed with Tm as 65-67 °C, which gives a better discrimination (the probe is more specific for single mismatch). A good alternative to MGB probes are LNA® probes where the increase in Tm induced by the addition of LNA® bases is specific, contrary to the MGB moeity (cf. p. 15).
During the primer extension step, the hybridized probe is cleaved by the 5’ exonuclease activity of Taq polymerase and an increase in fluorescence is seen. Fluorescence of the cleaved probe during PCR is monitored in Real-Time by the thermocycler.
MGB Eclipse® probes
MGB Eclipse® probes also known as QuantiProbes, have originally been developed by Epoch Biosciences (Bothell, USA). MGB Eclipse® probes carry a minor groove binder moiety that allows the use of short probes for very high specificity. These are short linear probes that have a minor groove binder and a quencher on the 5’ end and a fluorophore on the 3’end. This is the opposite orientation to TaqMan® MGB® probes and it is thought that the minor groove binder prevents the exonuclease activity of the Taq polymerase from cleaving the probe. The quencher is a Non Fluorescent Quencher also known as Eclipse Dark Quencher. Quenching occurs when the random coiling of the probe in the free form brings the quencher and the fluorophore close to another. The probe is straightened out when bound to its target and quenching is decreased, leading to an increase in fluorescent signal.
Figure 10. TaqMan® MGB® probe principle
21
EUROGENTEC | www.eurogentec.com | [email protected]
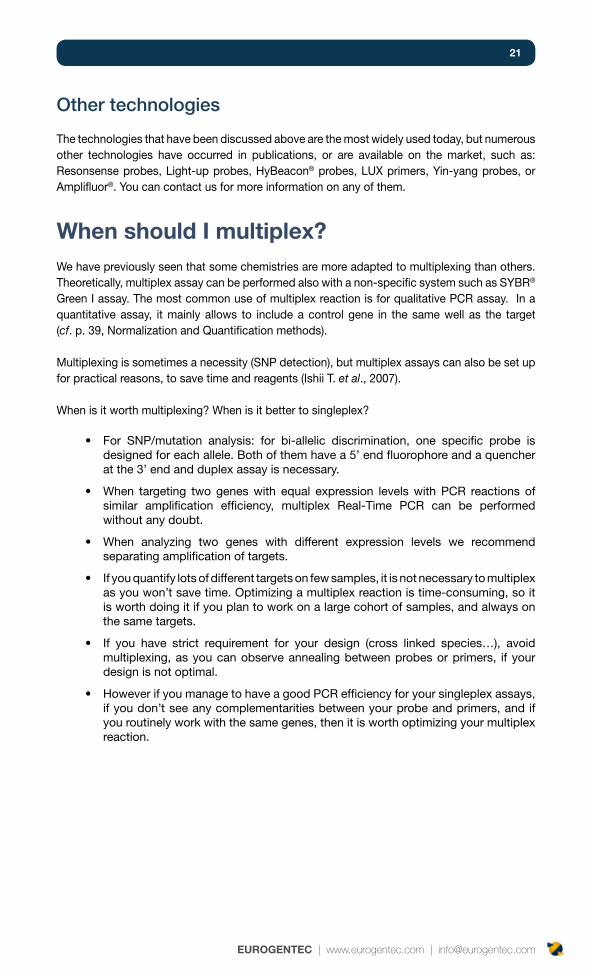
Other technologies
The technologies that have been discussed above are the most widely used today, but numerous other technologies have occurred in publications, or are available on the market, such as: Resonsense probes, Light-up probes, HyBeacon® probes, LUX primers, Yin-yang probes, or Amplifluor®. You can contact us for more information on any of them.
When should I multiplex?We have previously seen that some chemistries are more adapted to multiplexing than others. Theoretically, multiplex assay can be performed also with a non-specific system such as SYBR® Green I assay. The most common use of multiplex reaction is for qualitative PCR assay. In a quantitative assay, it mainly allows to include a control gene in the same well as the target (cf. p. 39, Normalization and Quantification methods).
Multiplexing is sometimes a necessity (SNP detection), but multiplex assays can also be set up for practical reasons, to save time and reagents (Ishii T. et al., 2007).
When is it worth multiplexing? When is it better to singleplex?
For SNP/mutation analysis: for bi-allelic discrimination, one specific probe is •designed for each allele. Both of them have a 5’ end fluorophore and a quencher at the 3’ end and duplex assay is necessary.
When targeting two genes with equal expression levels with PCR reactions of •similar amplification efficiency, multiplex Real-Time PCR can be performed without any doubt.
When analyzing two genes with different expression levels we recommend •separating amplification of targets.
If you quantify lots of different targets on few samples, it is not necessary to multiplex •as you won’t save time. Optimizing a multiplex reaction is time-consuming, so it is worth doing it if you plan to work on a large cohort of samples, and always on the same targets.
If you have strict requirement for your design (cross linked species…), avoid •multiplexing, as you can observe annealing between probes or primers, if your design is not optimal.
However if you manage to have a good PCR efficiency for your singleplex assays, •if you don’t see any complementarities between your probe and primers, and if you routinely work with the same genes, then it is worth optimizing your multiplex reaction.
qpCR guide
EUROGENTEC | www.eurogentec.com | [email protected]
HOW dO yOU GET sTaRTEd IN qpCR?
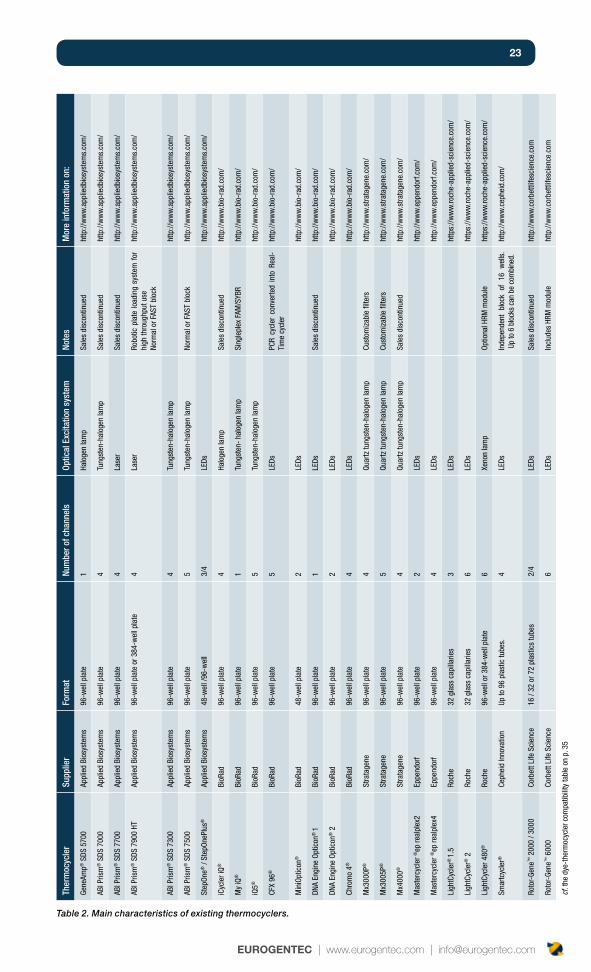
ThermocyclerIt seems logical, but you need to get a good thermocycler before you start your qPCR assay. You will most certainly start your qPCR project with the thermocycler available in your lab, or the lab nearby. The majority of the thermocyclers on the market now offer similar characteristics. The table shows the main thermocyclers on the market, and can be considered as a starting point in your decision making process.
The following characteristics should always be taken into consideration:
Format: glass capillaries, plastics tubes, 96-well plates or 384-wells plates. •Consider this aspect depending on your requirements, and also based on the reagent availability. A plate format is ideal if you have a high throughput requirement. Glass capillaries can reduce the choice of reagents which you may want to use.
Number of detection channels: if you want to multiplex, choose a thermocycler •with a large choice of dyes, in order to have the best combination for your assay. You can find on p. 35 the table showing available dye combinations, based on the type of thermocycler.
Software analysis: Consider the simplicity of the software, the format to export •data, statistical analysis performed etc. In addition to qPCR analysis, you can also perform High Resolution Meltcurve analysis with some thermocyclers.
Time of run: the newest thermocyclers enable a very short time of run (30-45 •minutes) compared to some of the older ones which take 2 hours.
Price and flexibility of the offer. Some suppliers try to tie up the machine with their •corresponding disposable and reagents.
23
EUROGENTEC | www.eurogentec.com | [email protected]
Ther
moc
ycle
rSu
pplie
rFo
rmat
Num
ber o
f cha
nnel
sOp
tical
Exc
itatio
n sy
stem
Note
sM
ore
info
rmat
ion
on:
Gene
Amp®
SDS
570
0Ap
plie
d Bi
osys
tem
s96
-wel
l pla
te1
Halo
gen
lam
pSa
les
disc
ontin
ued
http
://w
ww
.app
liedb
iosy
stem
s.co
m/
ABI P
rism
® S
DS 7
000
Appl
ied
Bios
yste
ms
96-w
ell p
late
4Tu
ngst
en-h
alog
en la
mp
Sale
s di
scon
tinue
dht
tp://
ww
w.a
pplie
dbio
syst
ems.
com
/
ABI P
rism
® S
DS 7
700
Appl
ied
Bios
yste
ms
96-w
ell p
late
4La
ser
Sale
s di
scon
tinue
dht
tp://
ww
w.a
pplie
dbio
syst
ems.
com
/
ABI P
rism
® S
DS 7
900
HTAp
plie
d Bi
osys
tem
s96
-wel
l pla
te o
r 384
-wel
l pla
te4
Lase
rRo
botic
pla
te lo
adin
g sy
stem
for
hi
gh th
roug
hput
use
Norm
al o
r FAS
T bl
ock
http
://w
ww
.app
liedb
iosy
stem
s.co
m/
ABI P
rism
® S
DS 7
300
Appl
ied
Bios
yste
ms
96-w
ell p
late
4Tu
ngst
en-h
alog
en la
mp
http
://w
ww
.app
liedb
iosy
stem
s.co
m/
ABI P
rism
® S
DS 7
500
Appl
ied
Bios
yste
ms
96-w
ell p
late
5Tu
ngst
en-h
alog
en la
mp
Norm
al o
r FAS
T bl
ock
http
://w
ww
.app
liedb
iosy
stem
s.co
m/
Step
One®
/ St
epOn
ePlu
s®Ap
plie
d Bi
osys
tem
s48
-wel
l /96
-wel
l3/
4LE
Dsht
tp://
ww
w.a
pplie
dbio
syst
ems.
com
/
iCyc
ler i
Q®Bi
oRad
96-w
ell p
late
4Ha
loge
n la
mp
Sale
s di
scon
tinue
dht
tp://
ww
w.b
io-r
ad.c
om/
My
iQ®
BioR
ad96
-wel
l pla
te1
Tung
sten
- ha
loge
n la
mp
Sing
lepl
ex F
AM/S
YBR
http
://w
ww
.bio
-rad
.com
/
iQ5®
BioR
ad96
-wel
l pla
te5
Tung
sten
-hal
ogen
lam
pht
tp://
ww
w.b
io-r
ad.c
om/
CFX
96®
Bi
oRad
96-w
ell p
late
5LE
DsPC
R cy
cler
con
verte
d in
to R
eal-
Tim
e cy
cler
http
://w
ww
.bio
-rad
.com
/
Min
iOpt
icon
®Bi
oRad
48-w
ell p
late
2LE
Dsht
tp://
ww
w.b
io-r
ad.c
om/
DNA
Engi
ne O
ptic
on®
1Bi
oRad
96-w
ell p
late
1LE
DsSa
les
disc
ontin
ued
http
://w
ww
.bio
-rad
.com
/
DNA
Engi
ne O
ptic
on® 2
BioR
ad96
-wel
l pla
te2
LEDs
http
://w
ww
.bio
-rad
.com
/
Chro
mo
4®Bi
oRad
96-w
ell p
late
4LE
Dsht
tp://
ww
w.b
io-r
ad.c
om/
Mx3
000P
®St
rata
gene
96-w
ell p
late
4Qu
artz
tung
sten
-hal
ogen
lam
pCu
stom
izab
le fi
lters
http
://w
ww
.stra
tage
ne.c
om/
Mx3
005P
®St
rata
gene
96-w
ell p
late
5Qu
artz
tung
sten
-hal
ogen
lam
pCu
stom
izab
le fi
lters
http
://w
ww
.stra
tage
ne.c
om/
Mx4
000®
Stra
tage
ne96
-wel
l pla
te4
Quar
tz tu
ngst
en-h
alog
en la
mp
Sale
s di
scon
tinue
dht
tp://
ww
w.s
trata
gene
.com
/
Mas
terc
ycle
r ®ep
real
plex
2Ep
pend
orf
96-w
ell p
late
2LE
Dsht
tp://
ww
w.e
ppen
dorf.
com
/
Mas
terc
ycle
r ®ep
real
plex
4Ep
pend
orf
96-w
ell p
late
4LE
Dsht
tp://
ww
w.e
ppen
dorf.
com
/
Ligh
tCyc
ler®
1.5
Roch
e32
gla
ss c
apill
arie
s3
LEDs
http
s://w
ww
.roch
e-ap
plie
d-sc
ienc
e.co
m/
Ligh
tCyc
ler®
2Ro
che
32 g
lass
cap
illar
ies
6LE
Dsht
tps:
//ww
w.ro
che-
appl
ied-
scie
nce.
com
/
Ligh
tCyc
ler 4
80®
Roch
e96
-wel
l or 3
84-w
ell p
late
6Xe
non
lam
pOp
tiona
l HRM
mod
ule
http
s://w
ww
.roch
e-ap
plie
d-sc
ienc
e.co
m/
Smar
tcyc
ler®
Ceph
eid
Inno
vatio
nUp
to 9
6 pl
astic
tube
s.4
LEDs
Inde
pend
ent
bloc
k of
16
wel
ls.
Up
to 6
blo
cks
can
be c
ombi
ned.
ht
tp://
ww
w.c
ephe
id.c
om/
Roto
r-Ge
ne™
200
0 / 3
000
Corb
ett L
ife S
cien
ce16
/ 32
or 7
2 pl
astic
s tu
bes
2/4
LEDs
Sale
s di
scon
tinue
dht
tp://
ww
w.c
orbe
ttlife
scie
nce.
com
Roto
r-Ge
ne™
600
0Co
rbet
t Life
Sci
ence
6LE
DsIn
clud
es H
RM m
odul
eht
tp://
ww
w.c
orbe
ttlife
scie
nce.
com
cf. t
he d
ye-t
herm
ocyc
ler c
ompa
tibili
ty ta
ble
on p
. 35
Table 2. Main characteristics of existing thermocyclers.
qpCR guide
EUROGENTEC | www.eurogentec.com | [email protected]
qpCR reagents : formats and components?When choosing a reagent for your qPCR assay, consider the format and the composition, in order to use one which is adapted to your assay, your machine, and your way of working.
Core kits or MasterMixes?
A Core kit, is a kit that contains all components in separate tubes, so you have to mix them yourself. It gives a maximum of flexibility, as you can optimize the concentration of each component of your assay. A qPCR Core kit contains individual tubes of reaction buffer, dNTP/dUTP mix, MgCl2, Taq and eventually SYBR® Green.On the contrary, a MasterMix is a ready-to-use reagent in which all the components are already mixed in an optimized way. Additional stabilizers are added to enable long-term storage. The concentration of components is perfectly adapted to most of the assays. Consequently, the 2 x mix guarantees a high reproducibility, ease of use, and time saving.
Role of Core kits and MasterMixes components
Slight component changes can significantly impact your assay. It is therefore important to consider them individually, understanding the role of each of them.
Taq polymerase
A HotStart Taq polymerase is inactive at low temperatures (room temperature). Heating at 95 °C for several - usually 5 to 10 - minutes activates the enzyme, and the amplification can begin once the primers are annealed. The enzyme is not active until the entire DNA is denatured.
Two major HotStart modifications exist, the antibody-blocked Taq and the chemically-blocked Taq. The antibody-blocked Taq is inactive because it is bound to a thermolabile inhibitor that is denatured during the initial step of PCR. The chemically-blocked Taq provides one clear advantage over the antibody-blocked Taq, as it is completely inactive at 60 °C, (the hybridization temperature of primers), thus preventing the formation of non-specific amplification and reducing primer dimer formation.
dNTps / dUTps
Some kits contain a blend of dNTPs and dUTPs, other ones contain only dNTPs. Using only dNTPs increases the sensitivity, the reason being that the Taq incorporates more easily dNTPs than dUTPs. However, using a mix containing dUTPs brings security to the assay, in case of contamination from a previous PCR product. Thanks to the UNG activity in association with incorporated dUTPs, this contamination can be eliminated.
25
EUROGENTEC | www.eurogentec.com | [email protected]
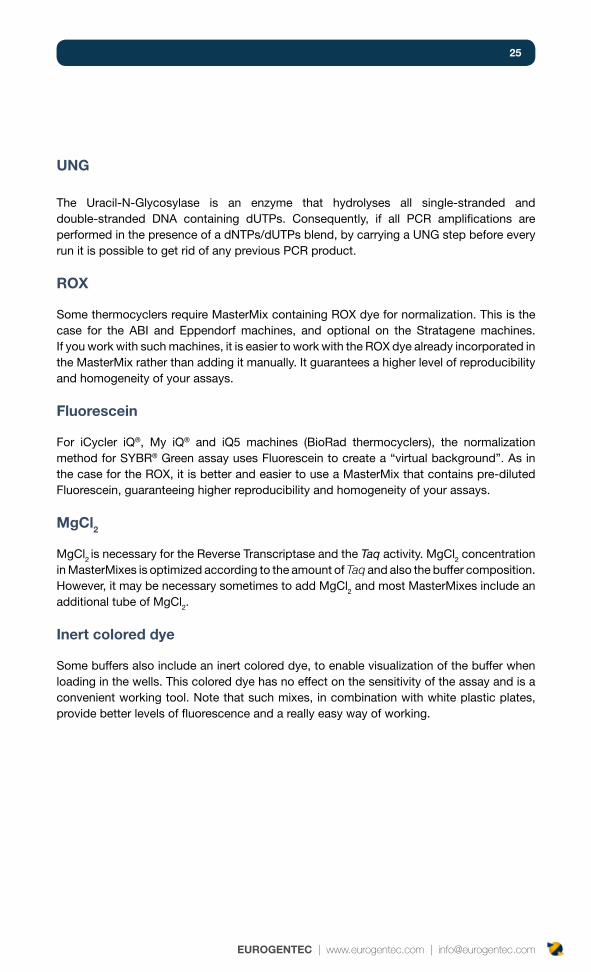
UNG
The Uracil-N-Glycosylase is an enzyme that hydrolyses all single-stranded and double-stranded DNA containing dUTPs. Consequently, if all PCR amplifications are performed in the presence of a dNTPs/dUTPs blend, by carrying a UNG step before every run it is possible to get rid of any previous PCR product.
ROX
Some thermocyclers require MasterMix containing ROX dye for normalization. This is the case for the ABI and Eppendorf machines, and optional on the Stratagene machines. If you work with such machines, it is easier to work with the ROX dye already incorporated in the MasterMix rather than adding it manually. It guarantees a higher level of reproducibility and homogeneity of your assays.
fluorescein
For iCycler iQ®, My iQ® and iQ5 machines (BioRad thermocyclers), the normalization method for SYBR® Green assay uses Fluorescein to create a “virtual background”. As in the case for the ROX, it is better and easier to use a MasterMix that contains pre-diluted Fluorescein, guaranteeing higher reproducibility and homogeneity of your assays.
mgCl2
MgCl2 is necessary for the Reverse Transcriptase and the Taq activity. MgCl2 concentration in MasterMixes is optimized according to the amount of Taq and also the buffer composition. However, it may be necessary sometimes to add MgCl2 and most MasterMixes include an additional tube of MgCl2.
Inert colored dye
Some buffers also include an inert colored dye, to enable visualization of the buffer when loading in the wells. This colored dye has no effect on the sensitivity of the assay and is a convenient working tool. Note that such mixes, in combination with white plastic plates, provide better levels of fluorescence and a really easy way of working.
qpCR guide
EUROGENTEC | www.eurogentec.com | [email protected]
probe and primer qualityWe really cannot insist enough, about the importance of this parameter. Your design is actually the most variable parameter, especially in the case of SYBR® Green assays. It is not uncommon to observe undetectable targets, high backgrounds or bad PCR efficiency, due only to the poor design of the primers and probes. The next chapter details more precisely, the rules for probe and primer design. However, consider also the quality and the purification level of your primers and probes, as this can also influence your results.
The classical way of synthesizing oligonucleotides, is the standard Beta-cyanoethyl synthesis cycle that includes: deblocking the first nucleotide, coupling of the second one, capping of any previous nucleotide that has not been coupled, oxidation to stabilize the growing chain, deblocking, then a new cycle starts. At the end of the oligonucleotide synthesis, the crude product is cleaved from the solid support (CPG or polystyrene beads).
Concerning probe coupling, there are different methods by which a dye can be incorporated into a probe. The choice of the coupling method used depends on the structure of the dye and of the length of the probe.
Manual coupling
Manual coupling can be done via amine or thiol groups, using activated dyes such as Texas Red®, TAMRA, JOE, Rhodamine (R6G) or ROX, BODIPY® and other dyes (Alexa®, Marina Blue®, etc.). These labels can be linked internally to any dT-residue, dR-residue or to either terminus. The fluorescent molecule is linked to the oligonucleotide via a spacer (a C-6 spacer generally) to limit the steric hindrances.
Automatic coupling
Automatic coupling uses the appropriate phosphoramidite to which the dye is already coupled like Cy® dyes, FAM, Fluorescein, HEX, TET and Yakima Yellow®. These labels are coupled during the synthesis at the 5’ terminus.The easiest probes to synthesize and to purify are Double-Dye Oligonucleotide probes, as they are not too long. Moreover, the probes where you can use phosphoramidites (automatic coupling method) are usually the easiest ones to synthesize and purify, as there is only one set-up for the synthesis and one purification step. They also give the highest yields. The probes, which require post-labelling procedures (manual coupling method) are more laborious to synthesize and will generally yield lower amounts of product.
Purification level
Regarding the quality, it is recommended to work with purified primers for qPCR assays (Cartridge Reverse Phase purified or HPLC purified primers are ideal). The first aim of any purification method is to remove the by-products, resulting from the synthesis step (mainly salts). The next goal is to enrich the product in full-length oligonucleotides. Consequently, purified primers are more adapted to the sensitive qPCR tool than simply desalted primers. It is particularly true when working with non-specific detection systems like SYBR® Green.
27
EUROGENTEC | www.eurogentec.com | [email protected]
GUIdElINEs fOR pRImERs aNd pRObEs dEsIGN
General rulesWell-designed primers and probes are a prerequisite for successful qRT-PCR. By using well-designed primers and probes, PCR efficiencies of 100 % can be obtained.If the following primer and probe design guidelines are taken into account you will achieve high PCR efficiencies, specific PCR products, non co-amplification of gDNA and therefore the most sensitive results.
We do recommend in general using a design software (for example Oligo® Primer Analysis Software) to check for all following criteria.Most thermocycler softwares now offer tools to help you designing primers with the best characteristics. Some of the best softwares are Beacon Designer, Primer Express, and DNA Star… Some other tools are freely available on the web, for example:
http://medgen.ugent.be/rtprimerdb/• (human primer and probe database)
http://frontend.bioinfo.rpi.edu/applications/mfold/• (for testing secondary structures)
http://www.ebi.ac.uk/~lenov/meltinghome.html• (Tm calculators)
http://frodo.wi.mit.edu/cgi-bin/primer/primer3_www.cgi• (Design Primer, also hybridization probes)
http://bibiserv.techfak.uni-bielefeld.de/genefisher2• (Design Primer including degenerate primers)
http://www.premierbiosoft.com/qpcr/index•
Primers or SNP databases are also freely available, for example OMIM (from the NCBI), SNPedia, Huge Navigator and RT Primer DB (Pattyn F. et al., 2006)
qpCR guide
EUROGENTEC | www.eurogentec.com | [email protected]
Design guidelines for SYBR® Green I assays
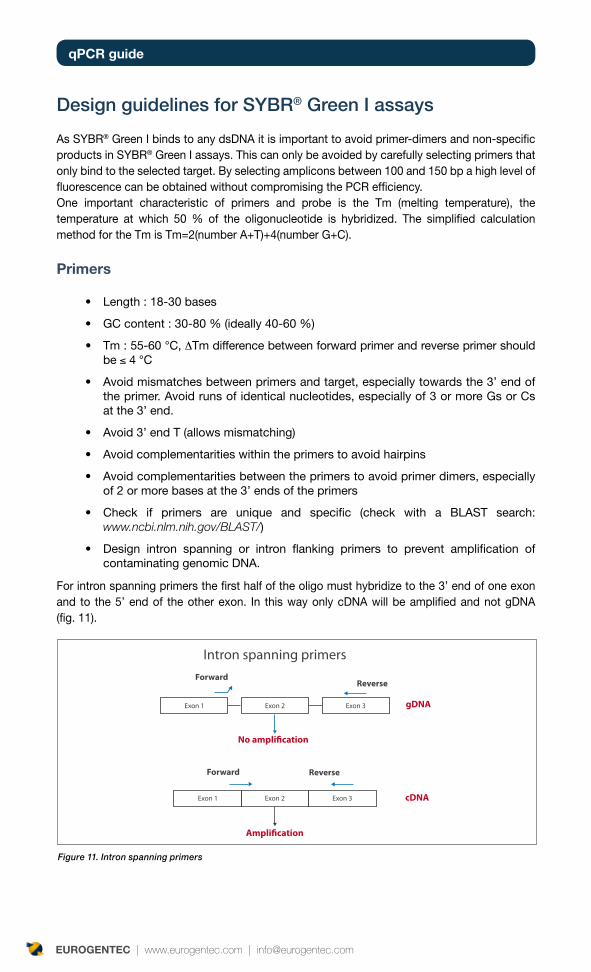
As SYBR® Green I binds to any dsDNA it is important to avoid primer-dimers and non-specific products in SYBR® Green I assays. This can only be avoided by carefully selecting primers that only bind to the selected target. By selecting amplicons between 100 and 150 bp a high level of fluorescence can be obtained without compromising the PCR efficiency.One important characteristic of primers and probe is the Tm (melting temperature), the temperature at which 50 % of the oligonucleotide is hybridized. The simplified calculation method for the Tm is Tm=2(number A+T)+4(number G+C).
primers
Length : 18-30 bases•
GC content : 30-80 % (ideally 40-60 %)•
Tm : 55-60 °C, • ∆Tm difference between forward primer and reverse primer should be ≤ 4 °C
Avoid mismatches between primers and target, especially towards the 3’ end of •the primer. Avoid runs of identical nucleotides, especially of 3 or more Gs or Cs at the 3’ end.
Avoid 3’ end T (allows mismatching)•
Avoid complementarities within the primers to avoid hairpins•
Avoid complementarities between the primers to avoid primer dimers, especially •of 2 or more bases at the 3’ ends of the primers
Check if primers are unique and specific (check with a BLAST search: •www.ncbi.nlm.nih.gov/BLAST/)
Design intron spanning or intron flanking primers to prevent amplification of •contaminating genomic DNA.
For intron spanning primers the first half of the oligo must hybridize to the 3’ end of one exon and to the 5’ end of the other exon. In this way only cDNA will be amplified and not gDNA (fig. 11).
Figure 11. Intron spanning primers
No ampli�cation
Ampli�cation
ForwardReverse
Forward Reverse
gDNA
cDNA
Intron spanning primers
29
EUROGENTEC | www.eurogentec.com | [email protected]
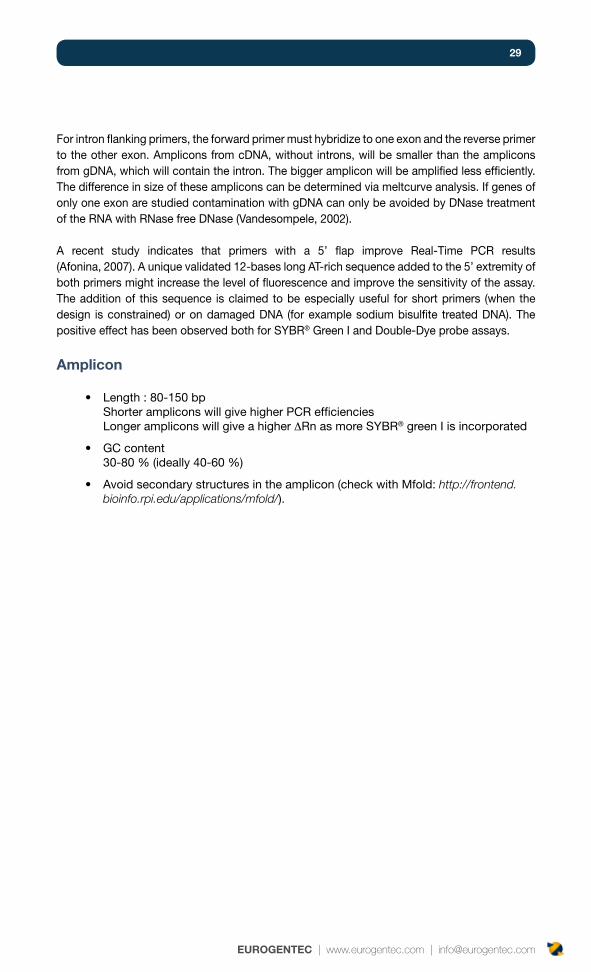
For intron flanking primers, the forward primer must hybridize to one exon and the reverse primer to the other exon. Amplicons from cDNA, without introns, will be smaller than the amplicons from gDNA, which will contain the intron. The bigger amplicon will be amplified less efficiently. The difference in size of these amplicons can be determined via meltcurve analysis. If genes of only one exon are studied contamination with gDNA can only be avoided by DNase treatment of the RNA with RNase free DNase (Vandesompele, 2002).
A recent study indicates that primers with a 5’ flap improve Real-Time PCR results (Afonina, 2007). A unique validated 12-bases long AT-rich sequence added to the 5’ extremity of both primers might increase the level of fluorescence and improve the sensitivity of the assay.The addition of this sequence is claimed to be especially useful for short primers (when the design is constrained) or on damaged DNA (for example sodium bisulfite treated DNA). The positive effect has been observed both for SYBR® Green I and Double-Dye probe assays.
amplicon
Length : 80-150 bp •Shorter amplicons will give higher PCR efficiencies Longer amplicons will give a higher ∆Rn as more SYBR® green I is incorporated
GC content •30-80 % (ideally 40-60 %)
Avoid secondary structures in the amplicon (check with Mfold: • http://frontend.bioinfo.rpi.edu/applications/mfold/).
qpCR guide
EUROGENTEC | www.eurogentec.com | [email protected]
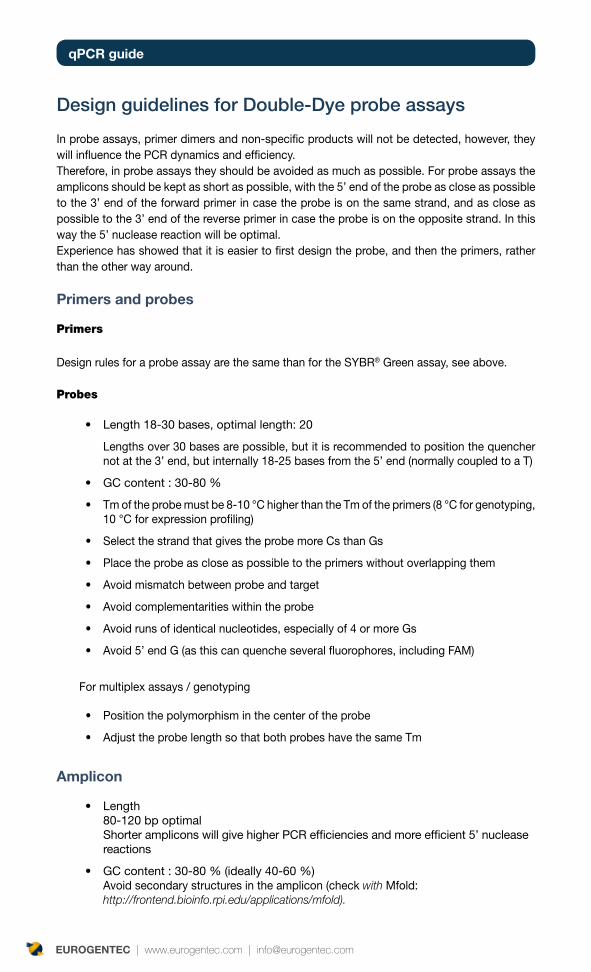
Design guidelines for Double-Dye probe assays
In probe assays, primer dimers and non-specific products will not be detected, however, they will influence the PCR dynamics and efficiency. Therefore, in probe assays they should be avoided as much as possible. For probe assays the amplicons should be kept as short as possible, with the 5’ end of the probe as close as possible to the 3’ end of the forward primer in case the probe is on the same strand, and as close as possible to the 3’ end of the reverse primer in case the probe is on the opposite strand. In this way the 5’ nuclease reaction will be optimal. Experience has showed that it is easier to first design the probe, and then the primers, rather than the other way around.
primers and probes
Primers
Design rules for a probe assay are the same than for the SYBR® Green assay, see above.
Probes
Length 18-30 bases, optimal length: 20•
Lengths over 30 bases are possible, but it is recommended to position the quencher not at the 3’ end, but internally 18-25 bases from the 5’ end (normally coupled to a T)
GC content : 30-80 %•
Tm of the probe must be 8-10 °C higher than the Tm of the primers (8 °C for genotyping, •10 °C for expression profiling)
Select the strand that gives the probe more Cs than Gs•
Place the probe as close as possible to the primers without overlapping them•
Avoid mismatch between probe and target•
Avoid complementarities within the probe•
Avoid runs of identical nucleotides, especially of 4 or more Gs•
Avoid 5’ end G (as this can quenche several fluorophores, including FAM)•
For multiplex assays / genotyping
Position the polymorphism in the center of the probe•
Adjust the probe length so that both probes have the same Tm•
amplicon
Length •80-120 bp optimal Shorter amplicons will give higher PCR efficiencies and more efficient 5’ nuclease reactions
GC content : 30-80 % (ideally 40-60 %) •Avoid secondary structures in the amplicon (check with Mfold: http://frontend.bioinfo.rpi.edu/applications/mfold).
31
EUROGENTEC | www.eurogentec.com | [email protected]
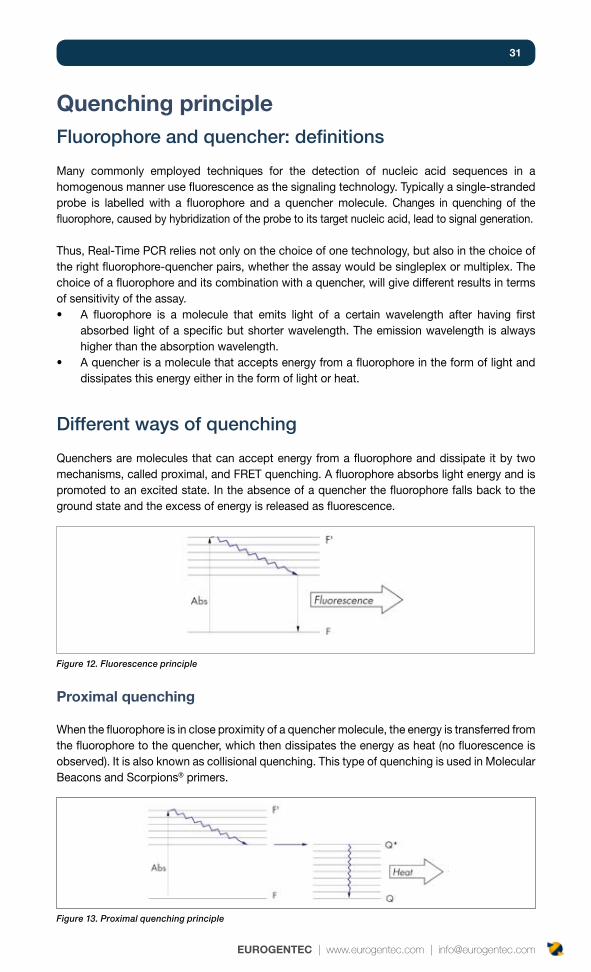
Quenching principleFluorophore and quencher: definitions
Many commonly employed techniques for the detection of nucleic acid sequences in a homogenous manner use fluorescence as the signaling technology. Typically a single-stranded probe is labelled with a fluorophore and a quencher molecule. Changes in quenching of the fluorophore, caused by hybridization of the probe to its target nucleic acid, lead to signal generation.
Thus, Real-Time PCR relies not only on the choice of one technology, but also in the choice of the right fluorophore-quencher pairs, whether the assay would be singleplex or multiplex. The choice of a fluorophore and its combination with a quencher, will give different results in terms of sensitivity of the assay.
A fluorophore is a molecule that emits light of a certain wavelength after having first •absorbed light of a specific but shorter wavelength. The emission wavelength is always higher than the absorption wavelength.A quencher is a molecule that accepts energy from a fluorophore in the form of light and •dissipates this energy either in the form of light or heat.
Different ways of quenching
Quenchers are molecules that can accept energy from a fluorophore and dissipate it by two mechanisms, called proximal, and FRET quenching. A fluorophore absorbs light energy and is promoted to an excited state. In the absence of a quencher the fluorophore falls back to the ground state and the excess of energy is released as fluorescence.
proximal quenching
When the fluorophore is in close proximity of a quencher molecule, the energy is transferred from the fluorophore to the quencher, which then dissipates the energy as heat (no fluorescence is observed). It is also known as collisional quenching. This type of quenching is used in Molecular Beacons and Scorpions® primers.
Figure 12. Fluorescence principle
Figure 13. Proximal quenching principle
qpCR guide
EUROGENTEC | www.eurogentec.com | [email protected]
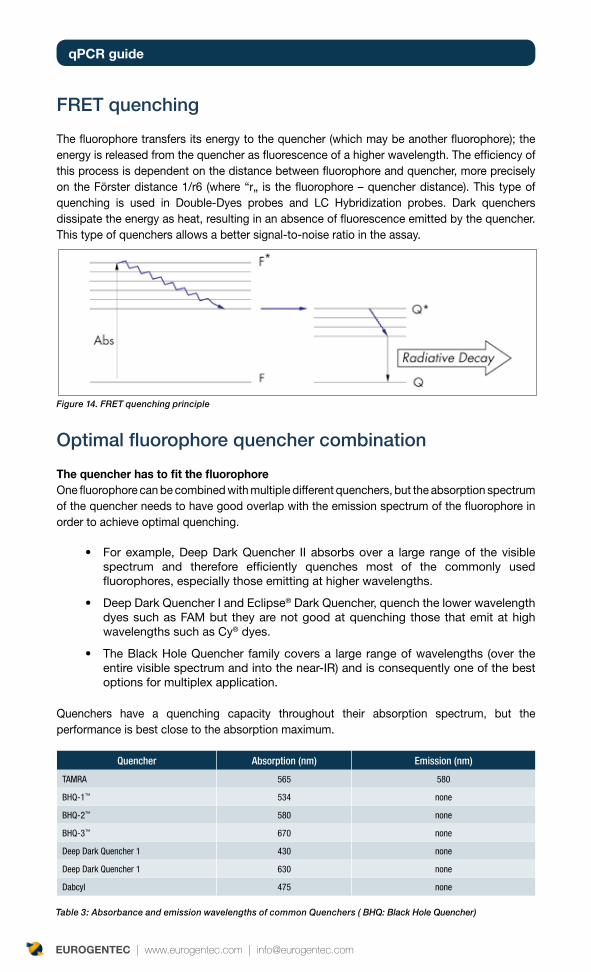
FRET quenching
The fluorophore transfers its energy to the quencher (which may be another fluorophore); the energy is released from the quencher as fluorescence of a higher wavelength. The efficiency of this process is dependent on the distance between fluorophore and quencher, more precisely on the Förster distance 1/r6 (where “r„ is the fluorophore – quencher distance). This type of quenching is used in Double-Dyes probes and LC Hybridization probes. Dark quenchers dissipate the energy as heat, resulting in an absence of fluorescence emitted by the quencher. This type of quenchers allows a better signal-to-noise ratio in the assay.
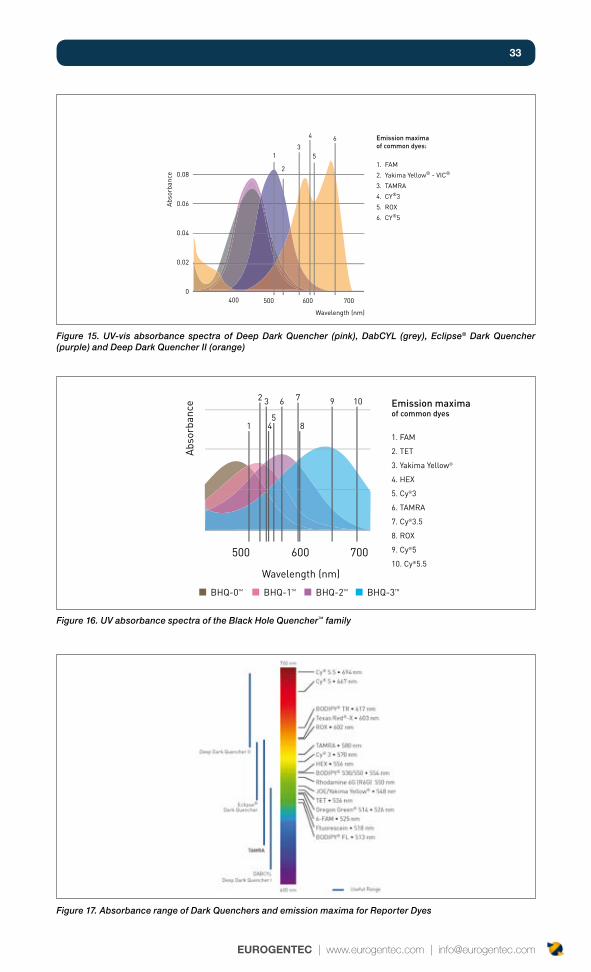
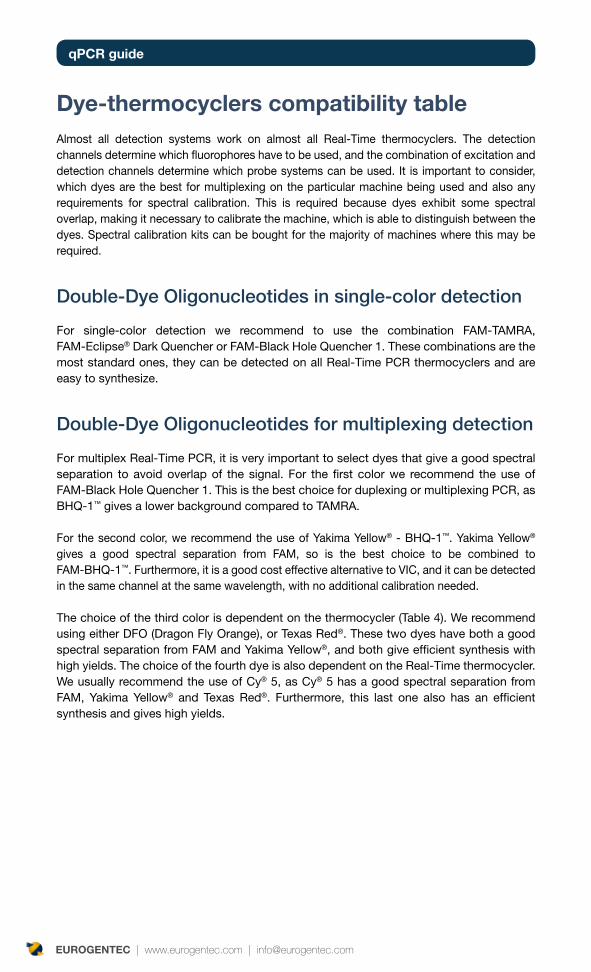
Optimal fluorophore quencher combination
The quencher has to fit the fluorophoreOne fluorophore can be combined with multiple different quenchers, but the absorption spectrum of the quencher needs to have good overlap with the emission spectrum of the fluorophore in order to achieve optimal quenching.
For example, Deep Dark Quencher II absorbs over a large range of the visible •spectrum and therefore efficiently quenches most of the commonly used fluorophores, especially those emitting at higher wavelengths.
Deep Dark Quencher I and Eclipse• ® Dark Quencher, quench the lower wavelength dyes such as FAM but they are not good at quenching those that emit at high wavelengths such as Cy® dyes.
The Black Hole Quencher family covers a large range of wavelengths (over the •entire visible spectrum and into the near-IR) and is consequently one of the best options for multiplex application.
Quenchers have a quenching capacity throughout their absorption spectrum, but the performance is best close to the absorption maximum.
Figure 14. FRET quenching principle
Quencher Absorption (nm) Emission (nm)
TAMRA 565 580
BHQ-1™ 534 none
BHQ-2™ 580 none
BHQ-3™ 670 none
Deep Dark Quencher 1 430 none
Deep Dark Quencher 1 630 none
Dabcyl 475 none
Table 3: Absorbance and emission wavelengths of common Quenchers ( BHQ: Black Hole Quencher)
33
EUROGENTEC | www.eurogentec.com | [email protected]
Figure 15. UV-vis absorbance spectra of Deep Dark Quencher (pink), DabCYL (grey), Eclipse® Dark Quencher (purple) and Deep Dark Quencher II (orange)
Figure 16. UV absorbance spectra of the Black Hole Quencher™ family
Figure 17. Absorbance range of Dark Quenchers and emission maxima for Reporter Dyes
0.08
0.06
0.04
0.02
0400
Emission maximaof common dyes:
1. FAM
2. Yakima Yellow® - VIC®
3. TAMRA
4. CY®3
5. ROX
6. CY®5
500 600 700
13
4
5
6
2
Wavelength (nm)
Deep Dark Quencher I
Deep Dark Quencher II
Eclipse® Dark Quencher
cnabrosbA
e
DABCYL
BHQ-0 TM
Wavelength (nm)
e c n a b r o s b A
BHQ-1 TM BHQ-2 TM BHQ-3 TM
Emission maxima of common dyes
1. FAM
2. TET
3. Yakima Yellow ®
4. HEX
5. Cy ® 3
6. TAMRA
7. Cy ® 3.5
8. ROX
9. Cy ® 5
10. Cy ® 5.5
1
2 3
4 5
6 7
8
9 10
500 600 700
qpCR guide
EUROGENTEC | www.eurogentec.com | [email protected]
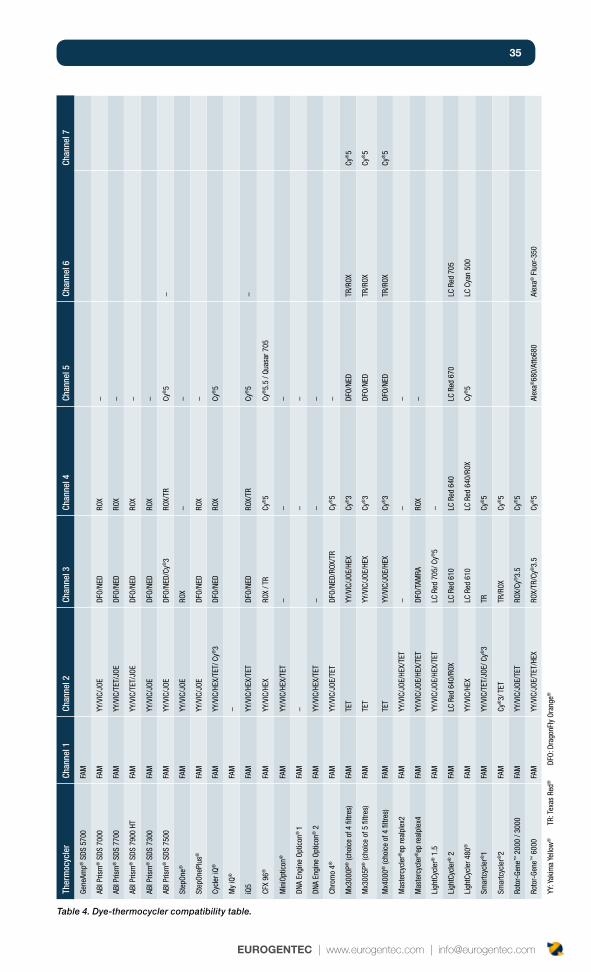
dye-thermocyclers compatibility tableAlmost all detection systems work on almost all Real-Time thermocyclers. The detection channels determine which fluorophores have to be used, and the combination of excitation and detection channels determine which probe systems can be used. It is important to consider, which dyes are the best for multiplexing on the particular machine being used and also any requirements for spectral calibration. This is required because dyes exhibit some spectral overlap, making it necessary to calibrate the machine, which is able to distinguish between the dyes. Spectral calibration kits can be bought for the majority of machines where this may be required.
Double-Dye Oligonucleotides in single-color detection
For single-color detection we recommend to use the combination FAM-TAMRA, FAM-Eclipse® Dark Quencher or FAM-Black Hole Quencher 1. These combinations are the most standard ones, they can be detected on all Real-Time PCR thermocyclers and are easy to synthesize.
Double-Dye Oligonucleotides for multiplexing detection
For multiplex Real-Time PCR, it is very important to select dyes that give a good spectral separation to avoid overlap of the signal. For the first color we recommend the use of FAM-Black Hole Quencher 1. This is the best choice for duplexing or multiplexing PCR, as BHQ-1™ gives a lower background compared to TAMRA.
For the second color, we recommend the use of Yakima Yellow® - BHQ-1™. Yakima Yellow® gives a good spectral separation from FAM, so is the best choice to be combined to FAM-BHQ-1™. Furthermore, it is a good cost effective alternative to VIC, and it can be detected in the same channel at the same wavelength, with no additional calibration needed.
The choice of the third color is dependent on the thermocycler (Table 4). We recommend using either DFO (Dragon Fly Orange), or Texas Red®. These two dyes have both a good spectral separation from FAM and Yakima Yellow®, and both give efficient synthesis with high yields. The choice of the fourth dye is also dependent on the Real-Time thermocycler. We usually recommend the use of Cy® 5, as Cy® 5 has a good spectral separation from FAM, Yakima Yellow® and Texas Red®. Furthermore, this last one also has an efficient synthesis and gives high yields.
35
EUROGENTEC | www.eurogentec.com | [email protected]
Ther
moc
ycle
rCh
anne
l 1Ch
anne
l 2Ch
anne
l 3Ch
anne
l 4Ch
anne
l 5Ch
anne
l 6Ch
anne
l 7
Gene
Amp®
SDS
570
0FA
M
ABI P
rism
® S
DS 7
000
FAM
YY/V
IC/J
OEDF
O/NE
DRO
X−
ABI P
rism
® S
DS 7
700
FAM
YY/V
IC/T
ET/J
OEDF
O/NE
DRO
X−
ABI P
rism
® S
DS 7
900
HTFA
MYY
/VIC
/TET
/JOE
DFO/
NED
ROX
−
ABI P
rism
® S
DS 7
300
FAM
YY/V
IC/J
OEDF
O/NE
DRO
X−
ABI P
rism
® S
DS 7
500
FAM
YY/V
IC/J
OEDF
O/NE
D/Cy
®3
ROX/
TRCy
®5
−
Step
One®
FAM
YY/V
IC/J
OERO
X−
−
Step
OneP
lus®
FA
MYY
/VIC
/JOE
DFO/
NED
ROX
−
Cycl
er iQ
®FA
MYY
/VIC
/HEX
/TET
/ Cy®
3DF
O/NE
DRO
XCy
®5
My
iQ®
FAM
−
iQ5
FAM
YY/V
IC/H
EX/T
ETDF
O/NE
DRO
X/TR
Cy
®5
−
CFX
96®
FA
MYY
/VIC
/HEX
ROX
/ TR
Cy®5
Cy®5.
5 / Q
uasa
r 705
Min
iOpt
icon
®FA
MYY
/VIC
/HEX
/TET
−−
−
DNA
Engi
ne O
ptic
on®
1FA
M−
−−
DNA
Engi
ne O
ptic
on® 2
FAM
YY/V
IC/H
EX/T
ET−
−−
Chro
mo
4®FA
MYY
/VIC
/JOE
/TET
DFO/
NED/
ROX/
TRCy
®5
−
Mx3
000P
® (c
hoic
e of
4 fi
ltres
)FA
MTE
TYY
/VIC
/JOE
/HEX
Cy®3
DFO/
NED
TR/R
OXCy
®5
Mx3
005P
® (c
hoic
e of
5 fi
ltres
)FA
MTE
TYY
/VIC
/JOE
/HEX
Cy®3
DFO/
NED
TR/R
OXCy
®5
Mx4
000®
(cho
ice
of 4
filtr
es)
FAM
TET
YY/V
IC/J
OE/H
EXCy
®3
DFO/
NED
TR/R
OXCy
®5
Mas
terc
ycle
r®ep
real
plex
2FA
MYY
/VIC
/JOE
/HEX
/TET
−−
−
Mas
terc
ycle
r®ep
real
plex
4FA
MYY
/VIC
/JOE
/HEX
/TET
DFO/
TAM
RARO
X−
Ligh
tCyc
ler®
1.5
FAM
YY/V
IC/J
OE/H
EX/T
ETLC
Red
705
/ Cy®
5−
Ligh
tCyc
ler®
2FA
MLC
Red
640
/ROX
LC R
ed 6
10LC
Red
640
LC R
ed 6
70LC
Red
705
Ligh
tCyc
ler 4
80®
FAM
YY/V
IC/H
EXLC
Red
610
LC R
ed 6
40/R
OXCy
®5
LC C
yan
500
Smar
tcyc
ler®
1FA
MYY
/VIC
/TET
/JOE
/ Cy®
3TR
Cy®5
Smar
tcyc
ler®
2FA
MCy
®3/
TET
TR/R
OXCy
®5
Roto
r-Ge
ne™
200
0 / 3
000
FAM
YY/V
IC/J
OE/T
ETRO
X/Cy
®3.
5Cy
®5
Roto
r-Ge
ne™
600
0FA
MYY
/VIC
/JOE
/TET
/HEX
ROX/
TR/C
y®3.
5Cy
®5
Alex
a®68
0/At
to68
0Al
exa®
Flu
or-3
50
YY: Y
akim
a Ye
llow
®
T
R: T
exas
Red
®
D
FO: D
rago
nFly
Ora
nge®
Table 4. Dye-thermocycler compatibility table.
qpCR guide
EUROGENTEC | www.eurogentec.com | [email protected]
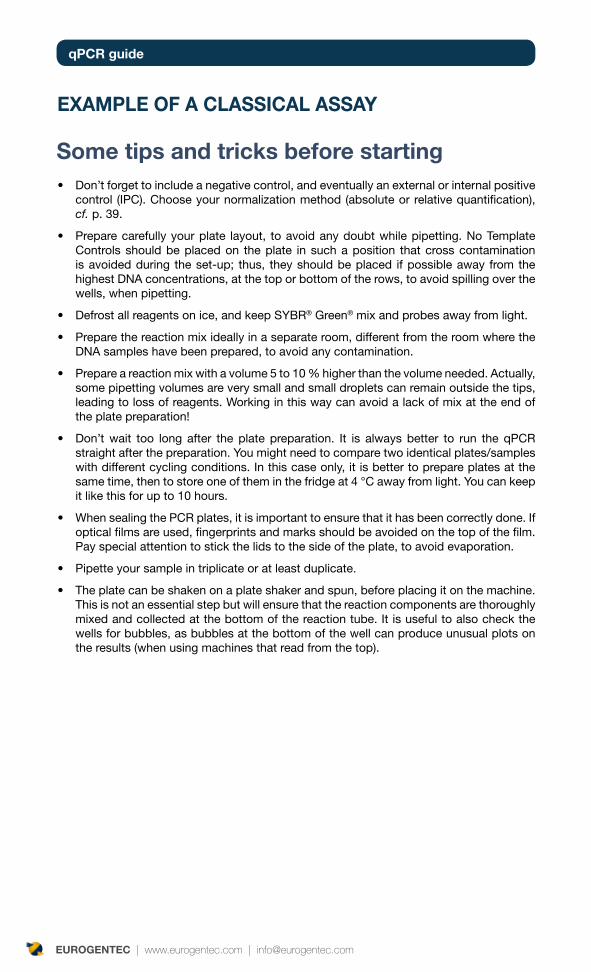
EXamplE Of a ClassICal assay
some tips and tricks before startingDon’t forget to include a negative control, and eventually an external or internal positive •control (IPC). Choose your normalization method (absolute or relative quantification), cf. p. 39.
Prepare carefully your plate layout, to avoid any doubt while pipetting. No Template •Controls should be placed on the plate in such a position that cross contamination is avoided during the set-up; thus, they should be placed if possible away from the highest DNA concentrations, at the top or bottom of the rows, to avoid spilling over the wells, when pipetting.
Defrost all reagents on ice, and keep SYBR• ® Green® mix and probes away from light.
Prepare the reaction mix ideally in a separate room, different from the room where the •DNA samples have been prepared, to avoid any contamination.
Prepare a reaction mix with a volume 5 to 10 % higher than the volume needed. Actually, •some pipetting volumes are very small and small droplets can remain outside the tips, leading to loss of reagents. Working in this way can avoid a lack of mix at the end of the plate preparation!
Don’t wait too long after the plate preparation. It is always better to run the qPCR •straight after the preparation. You might need to compare two identical plates/samples with different cycling conditions. In this case only, it is better to prepare plates at the same time, then to store one of them in the fridge at 4 °C away from light. You can keep it like this for up to 10 hours.
When sealing the PCR plates, it is important to ensure that it has been correctly done. If •optical films are used, fingerprints and marks should be avoided on the top of the film. Pay special attention to stick the lids to the side of the plate, to avoid evaporation.
Pipette your sample in triplicate or at least duplicate.•
The plate can be shaken on a plate shaker and spun, before placing it on the machine. •This is not an essential step but will ensure that the reaction components are thoroughly mixed and collected at the bottom of the reaction tube. It is useful to also check the wells for bubbles, as bubbles at the bottom of the well can produce unusual plots on the results (when using machines that read from the top).
37
EUROGENTEC | www.eurogentec.com | [email protected]
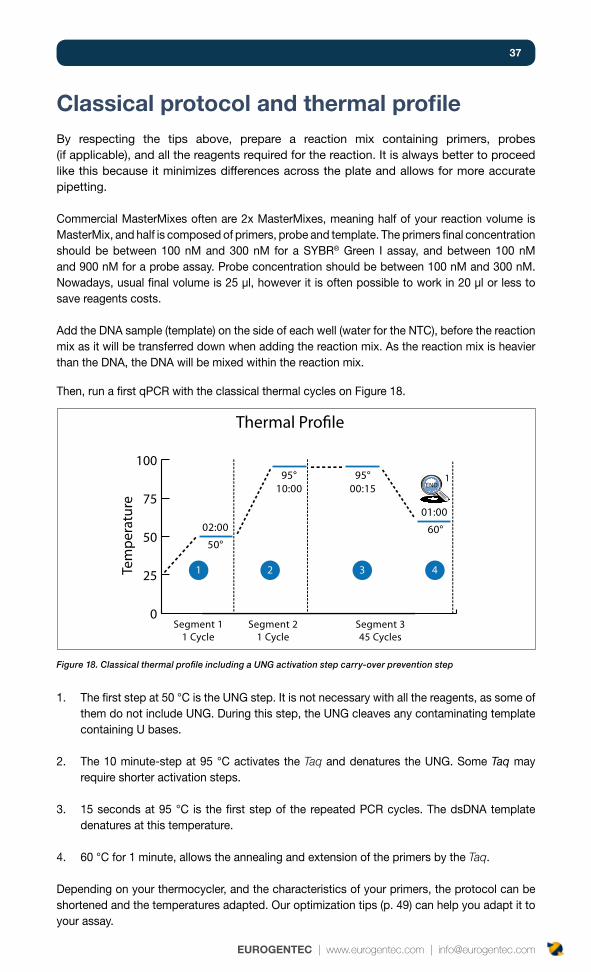
Classical protocol and thermal profileBy respecting the tips above, prepare a reaction mix containing primers, probes (if applicable), and all the reagents required for the reaction. It is always better to proceed like this because it minimizes differences across the plate and allows for more accurate pipetting.
Commercial MasterMixes often are 2x MasterMixes, meaning half of your reaction volume is MasterMix, and half is composed of primers, probe and template. The primers final concentration should be between 100 nM and 300 nM for a SYBR® Green I assay, and between 100 nM and 900 nM for a probe assay. Probe concentration should be between 100 nM and 300 nM. Nowadays, usual final volume is 25 µl, however it is often possible to work in 20 µl or less to save reagents costs.
Add the DNA sample (template) on the side of each well (water for the NTC), before the reaction mix as it will be transferred down when adding the reaction mix. As the reaction mix is heavier than the DNA, the DNA will be mixed within the reaction mix.
Then, run a first qPCR with the classical thermal cycles on Figure 18.
The first step at 50 °C is the UNG step. It is not necessary with all the reagents, as some of 1. them do not include UNG. During this step, the UNG cleaves any contaminating template containing U bases.
The 10 minute-step at 95 °C activates the 2. Taq and denatures the UNG. Some Taq may require shorter activation steps.
15 seconds at 95 °C is the first step of the repeated PCR cycles. The dsDNA template 3. denatures at this temperature.
60 °C for 1 minute, allows the annealing and extension of the primers by the 4. Taq.
Depending on your thermocycler, and the characteristics of your primers, the protocol can be shortened and the temperatures adapted. Our optimization tips (p. 49) can help you adapt it to your assay.
0
25
50
75
100
Thermal Pro�le
Tem
pera
ture
Segment 11 Cycle
Segment 21 Cycle
Segment 345 Cycles
95°10:00
95°00:15
50°60°02:00
01:00
END1
1 2 3 4
Figure 18. Classical thermal profile including a UNG activation step carry-over prevention step
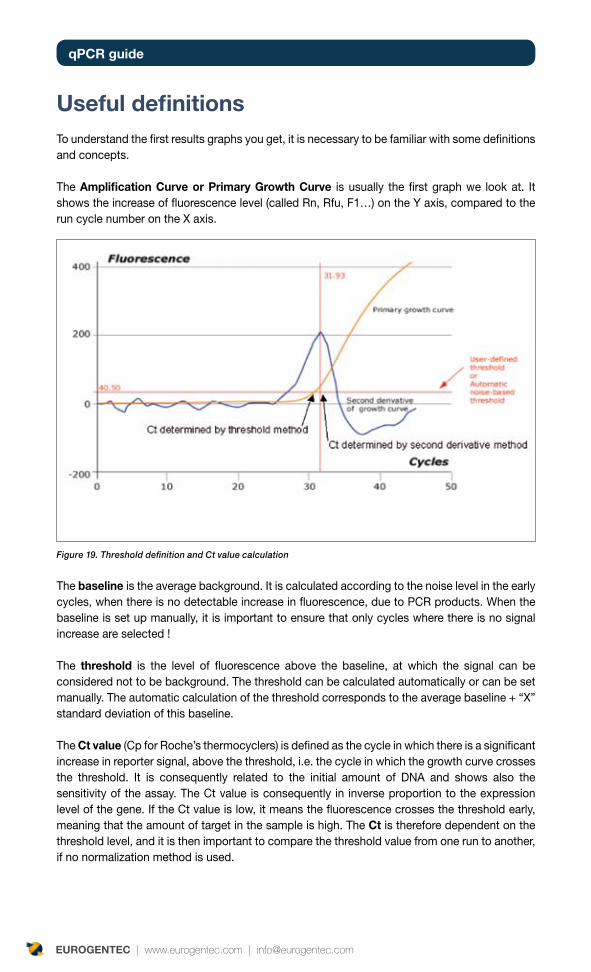
qpCR guide
EUROGENTEC | www.eurogentec.com | [email protected]
Useful definitionsTo understand the first results graphs you get, it is necessary to be familiar with some definitions and concepts.
The amplification Curve or primary Growth Curve is usually the first graph we look at. It shows the increase of fluorescence level (called Rn, Rfu, F1…) on the Y axis, compared to the run cycle number on the X axis.
Figure 19. Threshold definition and Ct value calculation
The baseline is the average background. It is calculated according to the noise level in the early cycles, when there is no detectable increase in fluorescence, due to PCR products. When the baseline is set up manually, it is important to ensure that only cycles where there is no signal increase are selected !
The threshold is the level of fluorescence above the baseline, at which the signal can be considered not to be background. The threshold can be calculated automatically or can be set manually. The automatic calculation of the threshold corresponds to the average baseline + “X” standard deviation of this baseline.
The Ct value (Cp for Roche’s thermocyclers) is defined as the cycle in which there is a significant increase in reporter signal, above the threshold, i.e. the cycle in which the growth curve crosses the threshold. It is consequently related to the initial amount of DNA and shows also the sensitivity of the assay. The Ct value is consequently in inverse proportion to the expression level of the gene. If the Ct value is low, it means the fluorescence crosses the threshold early, meaning that the amount of target in the sample is high. The Ct is therefore dependent on the threshold level, and it is then important to compare the threshold value from one run to another, if no normalization method is used.
39
EUROGENTEC | www.eurogentec.com | [email protected]
The ROX is a fluorescent dye that is used as a passive reference for some thermocyclers (Eppendorf, ABI Prism®, Stratagene…). This dye is usually spiked into the MasterMix and the reporter fluorescence is normalized to the ROX signal on ABI and Stratagene Mx machines.
The Rn (normalized reporter signal) is calculated by dividing the reporter signal by the ROX signal. This signal is then corrected for pipetting inaccuracies, variation in sample volume, bubbles in sample, plastics inconsistency…
When correction for background variations is required, the ∆Rn is used. The ∆Rn is calculated by subtracting the normalized baseline from the normalized reporter signal.
∆Rn = Rn-Bn where:
Rn= (reporter signal / ROX passive reference signal) Bn= (baseline signal / ROX passive reference)
Only a minor variation in the ROX passive reference will cause a change in the Rn, Bn, ∆Rn, threshold and Ct value. Therefore we recommend using MasterMixes that already contain a ROX passive reference to avoid such variations, which might be interpreted as real differences, but in reality are just experimental artifacts.
Normalization and quantification methodsWhen analyzing and comparing results of Real-Time qPCR assays many researchers are confronted with several uncontrolled variables, which can lead to misinterpretation of the results. Those uncontrolled variables can be the amount of starting material, enzymatic efficiencies, and differences between tissues, individuals or experimental conditions.
In order to make a good comparison, normalization can be used as a correction method, for these variables.
There are several ways to normalize, which all have some advantages and disadvantages.
The most commonly known and used ways of normalization are : normalization to the original number of cells, normalization to the total RNA mass, normalization to one or more housekeeping genes, and normalization to an internal or external calibrator.
Normalization to number of cells can actually only be done for cell culture and blood samples. In solid tissues and tumors, the amount of cells cannot be counted, only estimated and therefore leads to inaccuracies (Bustin, 2000).
Normalizing to the RNA mass quantity will lead to inaccuracies as the total RNA mass (rRNA, tRNA and mRNA) might contain varying imbalances between rRNA and mRNA (Solinas et al., 2001). The determination of the RNA amount by photospectrometry is another factor causing inaccuracy, as the A260 quantification is strongly influenced by the impurity of the sample, caused by contaminating DNA, free nucleotides and proteins (Bustin, 2000 – Bustin, 2002). As very little is known about total RNA content per cell (in different tissues), a variation between individuals and between normal or highly proliferating tissues, like tumors will cause unwanted inaccuracies (Bustin, 2000 – Bustin, 2002).
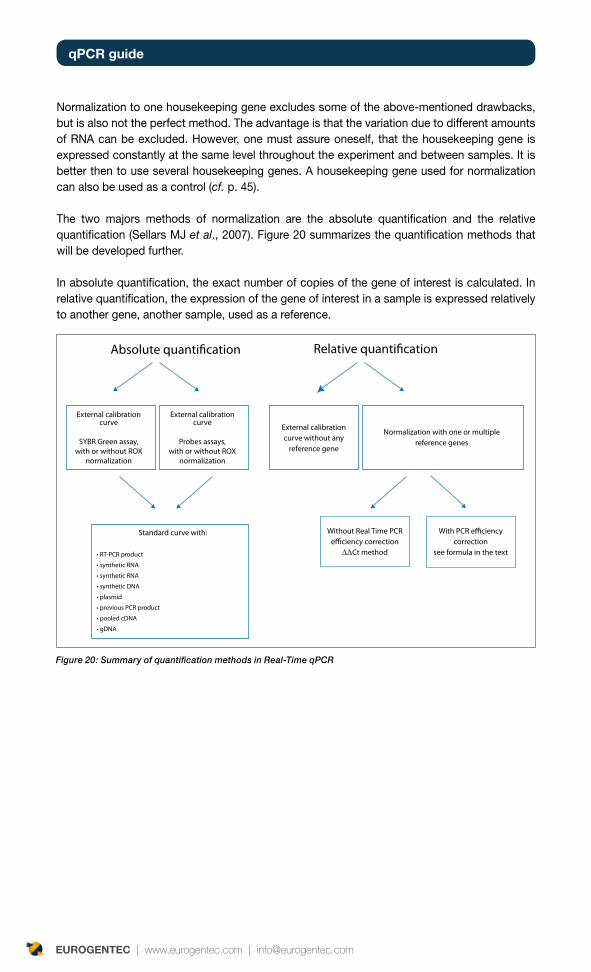
qpCR guide
EUROGENTEC | www.eurogentec.com | [email protected]
Normalization to one housekeeping gene excludes some of the above-mentioned drawbacks, but is also not the perfect method. The advantage is that the variation due to different amounts of RNA can be excluded. However, one must assure oneself, that the housekeeping gene is expressed constantly at the same level throughout the experiment and between samples. It is better then to use several housekeeping genes. A housekeeping gene used for normalization can also be used as a control (cf. p. 45).
The two majors methods of normalization are the absolute quantification and the relative quantification (Sellars MJ et al., 2007). Figure 20 summarizes the quantification methods that will be developed further.
In absolute quantification, the exact number of copies of the gene of interest is calculated. In relative quantification, the expression of the gene of interest in a sample is expressed relatively to another gene, another sample, used as a reference.
Absolute quanti�cation Relative quanti�cation
Standard curve with:
External calibrationcurve
with or without ROX
External calibrationcurve
with or without ROX
External calibration
ΔΔcorrection
Figure 20: Summary of quantification methods in Real-Time qPCR
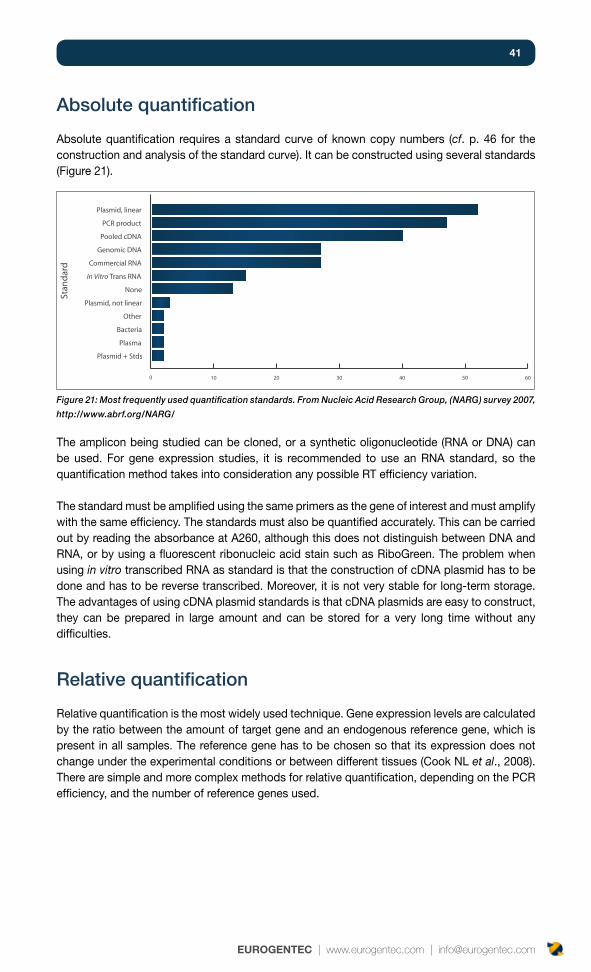
41
EUROGENTEC | www.eurogentec.com | [email protected]
Absolute quantification
Absolute quantification requires a standard curve of known copy numbers (cf. p. 46 for the construction and analysis of the standard curve). It can be constructed using several standards (Figure 21).
The amplicon being studied can be cloned, or a synthetic oligonucleotide (RNA or DNA) can be used. For gene expression studies, it is recommended to use an RNA standard, so the quantification method takes into consideration any possible RT efficiency variation.
The standard must be amplified using the same primers as the gene of interest and must amplify with the same efficiency. The standards must also be quantified accurately. This can be carried out by reading the absorbance at A260, although this does not distinguish between DNA and RNA, or by using a fluorescent ribonucleic acid stain such as RiboGreen. The problem when using in vitro transcribed RNA as standard is that the construction of cDNA plasmid has to be done and has to be reverse transcribed. Moreover, it is not very stable for long-term storage. The advantages of using cDNA plasmid standards is that cDNA plasmids are easy to construct, they can be prepared in large amount and can be stored for a very long time without any difficulties.
Relative quantification
Relative quantification is the most widely used technique. Gene expression levels are calculated by the ratio between the amount of target gene and an endogenous reference gene, which is present in all samples. The reference gene has to be chosen so that its expression does not change under the experimental conditions or between different tissues (Cook NL et al., 2008). There are simple and more complex methods for relative quantification, depending on the PCR efficiency, and the number of reference genes used.
0 10 20 30 40 50 60
Plasmid + Stds
Plasma
Bacteria
Other
Plasmid, not linear
None
In Vitro Trans RNA
Commercial RNA
Genomic DNA
Pooled cDNA
PCR product
Plasmid, linear
Stan
dard
Figure 21: Most frequently used quantification standards. From Nucleic Acid Research Group, (NARG) survey 2007,
http://www.abrf.org/NARG/
qpCR guide
EUROGENTEC | www.eurogentec.com | [email protected]
delta delta Ct (∆∆Ct) method
This method is the simplest one, as it is a direct comparison of Ct values between the target gene and the reference gene. However, PCR efficiencies of both the target and of the reference gene should be close to 100 % and not differ by more than 10 %. Only the initial experiment requires a standard curve to compare the PCR efficiency of the target and control gene (Schmittgen TD, et al., 2008).
Relative quantification involves the choice of a calibrator sample. The calibrator sample can be the untreated sample, the time=0 sample, or any sample you want to compare your unknown to.
Firstly, the ∆Ct between the target gene and the reference gene is calculated for each sample (for the unknown samples and also for the calibrator sample).
∆Ct = Cttarget – Ctreference gene
Then the difference between the ∆Ct of the unknown and the ∆Ct of the calibrator is calculated, giving the ∆∆Ct value:
∆∆Ct = (Cttarget – Ctreference)calibrator – (Cttarget – Ctreference)sample
The normalized target amount in the sample is then equal to 2-∆∆Ct and this value can be used to compare expression levels in samples.
different pCR efficiencies
If there is more than 10 % difference in PCR efficiencies, between the reference gene and the target gene, then it is inaccurate to use the ∆∆Ct method. The value used is then:
Ratio = (Etarget) ∆Ct target (calibrator - sample) / (Ereference)
∆Ct reference (calibrator - sample) where :
Etarget = PCR efficiency of the target ∆Ct target (calibrator - sample) = (Cttarget) in the calibrator - (Cttarget) in the sample.
When several reference genes are used
As mentioned in the Normalization chapter, it is better to use several control genes, because the expression of one reference gene might change slightly. It is then necessary to use an index reference gene (REF), a method described by M. Pfaffl and J. Vandesompele, 2004.
The normalization by geometrical averaging of multiple internal control genes (Vandesompele et al., 2002) is a robust and innovative approach for accurate normalization. It relies on the use of several housekeeping genes to even out variations in the expression of these genes.
Only the most stable expressed housekeeping genes are taken into the calculation. The calculation can be performed using the freely available software geNorm (http://medgen.ugent.be/~jvdesomp/genorm/). The major drawback of this method is the need for many primer pairs and the complicated way to process the data.
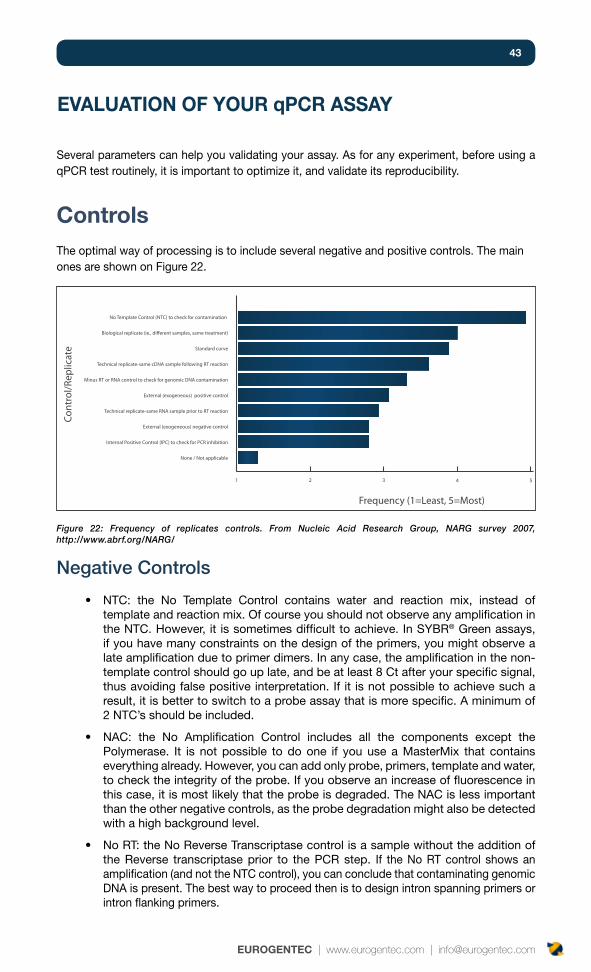
43
EUROGENTEC | www.eurogentec.com | [email protected]
EvalUaTION Of yOUR qpCR assay
Several parameters can help you validating your assay. As for any experiment, before using a qPCR test routinely, it is important to optimize it, and validate its reproducibility.
ControlsThe optimal way of processing is to include several negative and positive controls. The main ones are shown on Figure 22.
Negative Controls
NTC: the No Template Control contains water and reaction mix, instead of •template and reaction mix. Of course you should not observe any amplification in the NTC. However, it is sometimes difficult to achieve. In SYBR® Green assays, if you have many constraints on the design of the primers, you might observe a late amplification due to primer dimers. In any case, the amplification in the non-template control should go up late, and be at least 8 Ct after your specific signal, thus avoiding false positive interpretation. If it is not possible to achieve such a result, it is better to switch to a probe assay that is more specific. A minimum of 2 NTC’s should be included.
NAC: the No Amplification Control includes all the components except the •Polymerase. It is not possible to do one if you use a MasterMix that contains everything already. However, you can add only probe, primers, template and water, to check the integrity of the probe. If you observe an increase of fluorescence in this case, it is most likely that the probe is degraded. The NAC is less important than the other negative controls, as the probe degradation might also be detected with a high background level.
No RT: the No Reverse Transcriptase control is a sample without the addition of •the Reverse transcriptase prior to the PCR step. If the No RT control shows an amplification (and not the NTC control), you can conclude that contaminating genomic DNA is present. The best way to proceed then is to design intron spanning primers or intron flanking primers.
Figure 22: Frequency of replicates controls. From Nucleic Acid Research Group, NARG survey 2007, http://www.abrf.org/NARG/
1 2 3 4 5
Internal Positive Control (IPC) to check for PCR inhibition
External (exogeneous) negative control
Technical replicate-same RNA sample prior to RT reaction
External (exogeneous) positive control
Minus RT or RNA control to check for genomic DNA contamination
Technical replicate-same cDNA sample following RT reaction
Standard curve
Biological replicate (ie., di�erent samples, same treatment)
No Template Control (NTC) to check for contamination
None / Not applicable
Frequency (1=Least, 5=Most)
Cont
rol/R
eplic
ate
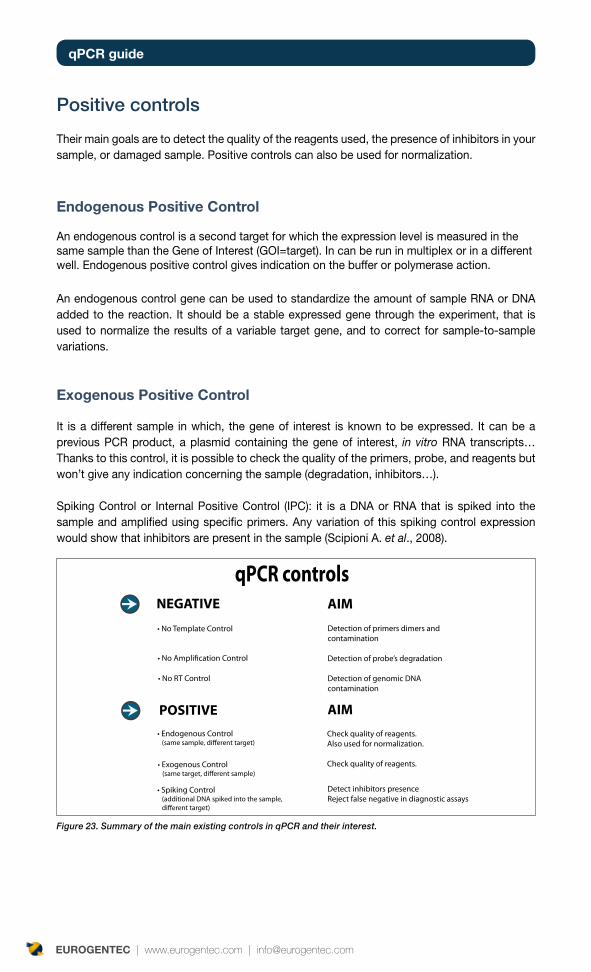
qpCR guide
EUROGENTEC | www.eurogentec.com | [email protected]
Positive controls
Their main goals are to detect the quality of the reagents used, the presence of inhibitors in your sample, or damaged sample. Positive controls can also be used for normalization.
Endogenous positive Control
An endogenous control is a second target for which the expression level is measured in the same sample than the Gene of Interest (GOI=target). In can be run in multiplex or in a different well. Endogenous positive control gives indication on the buffer or polymerase action.
An endogenous control gene can be used to standardize the amount of sample RNA or DNA added to the reaction. It should be a stable expressed gene through the experiment, that is used to normalize the results of a variable target gene, and to correct for sample-to-sample variations.
Exogenous positive Control
It is a different sample in which, the gene of interest is known to be expressed. It can be a previous PCR product, a plasmid containing the gene of interest, in vitro RNA transcripts… Thanks to this control, it is possible to check the quality of the primers, probe, and reagents but won’t give any indication concerning the sample (degradation, inhibitors…).
Spiking Control or Internal Positive Control (IPC): it is a DNA or RNA that is spiked into the sample and amplified using specific primers. Any variation of this spiking control expression would show that inhibitors are present in the sample (Scipioni A. et al., 2008).
NEGATIVE
POSITIVE
AIM
AIM
Detection of primers dimers andcontamination
Detection of probe’s degradation
Detection of genomic DNAcontamination
Check quality of reagents.Also used for normalization.
Check quality of reagents.
(same sample, di�erent target)
(same target, di�erent sample)
(additional DNA spiked into the sample, di�erent target)
Detect inhibitors presence
qPCR controls
Figure 23. Summary of the main existing controls in qPCR and their interest.
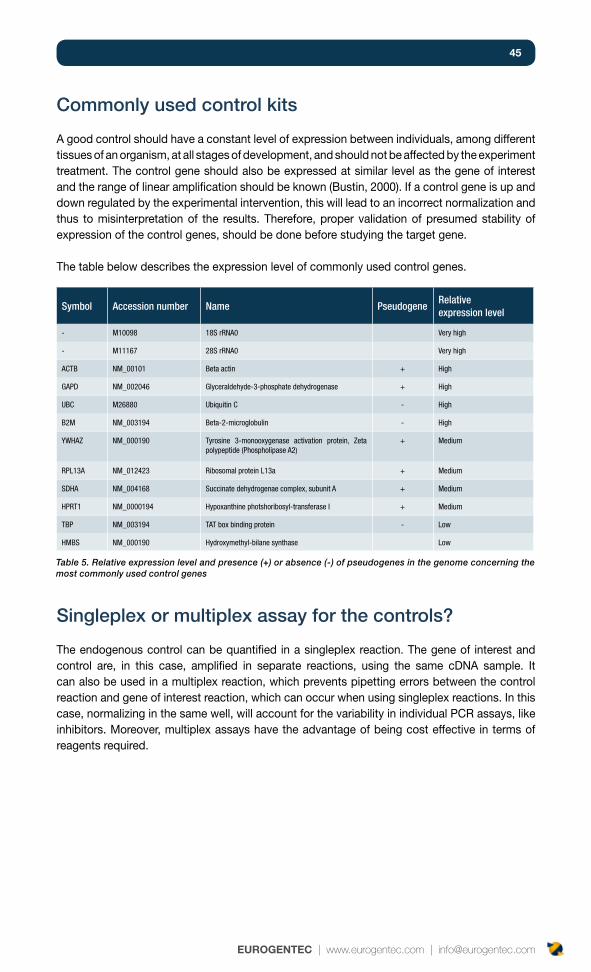
45
EUROGENTEC | www.eurogentec.com | [email protected]
Commonly used control kits
A good control should have a constant level of expression between individuals, among different tissues of an organism, at all stages of development, and should not be affected by the experiment treatment. The control gene should also be expressed at similar level as the gene of interest and the range of linear amplification should be known (Bustin, 2000). If a control gene is up and down regulated by the experimental intervention, this will lead to an incorrect normalization and thus to misinterpretation of the results. Therefore, proper validation of presumed stability of expression of the control genes, should be done before studying the target gene.
The table below describes the expression level of commonly used control genes.
Singleplex or multiplex assay for the controls?
The endogenous control can be quantified in a singleplex reaction. The gene of interest and control are, in this case, amplified in separate reactions, using the same cDNA sample. It can also be used in a multiplex reaction, which prevents pipetting errors between the control reaction and gene of interest reaction, which can occur when using singleplex reactions. In this case, normalizing in the same well, will account for the variability in individual PCR assays, like inhibitors. Moreover, multiplex assays have the advantage of being cost effective in terms of reagents required.
Symbol Accession number Name PseudogeneRelative expression level
- M10098 18S rRNA0 Very high
- M11167 28S rRNA0 Very high
ACTB NM_00101 Beta actin + High
GAPD NM_002046 Glyceraldehyde-3-phosphate dehydrogenase + High
UBC M26880 Ubiquitin C - High
B2M NM_003194 Beta-2-microglobulin - High
YWHAZ NM_000190 Tyrosine 3-monooxygenase activation protein, Zeta polypeptide (Phospholipase A2)
+ Medium
RPL13A NM_012423 Ribosomal protein L13a + Medium
SDHA NM_004168 Succinate dehydrogenae complex, subunit A + Medium
HPRT1 NM_0000194 Hypoxanthine photshoribosyl-transferase I + Medium
TBP NM_003194 TAT box binding protein - Low
HMBS NM_000190 Hydroxymethyl-bilane synthase Low
Table 5. Relative expression level and presence (+) or absence (-) of pseudogenes in the genome concerning the most commonly used control genes
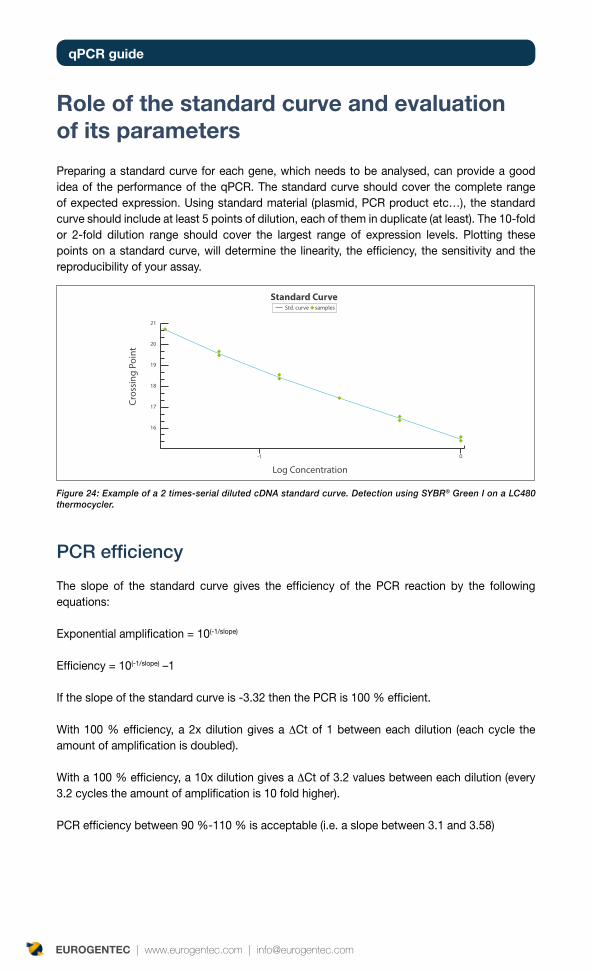
qpCR guide
EUROGENTEC | www.eurogentec.com | [email protected]
Role of the standard curve and evaluation of its parameters
Preparing a standard curve for each gene, which needs to be analysed, can provide a good idea of the performance of the qPCR. The standard curve should cover the complete range of expected expression. Using standard material (plasmid, PCR product etc…), the standard curve should include at least 5 points of dilution, each of them in duplicate (at least). The 10-fold or 2-fold dilution range should cover the largest range of expression levels. Plotting these points on a standard curve, will determine the linearity, the efficiency, the sensitivity and the reproducibility of your assay.
Figure 24: Example of a 2 times-serial diluted cDNA standard curve. Detection using SYBR® Green I on a LC480 thermocycler.
16
17
18
19
20
21
Log Concentration-1 0
Standard Curve
Cros
sing
Poi
nt
Std. curve samples
PCR efficiency
The slope of the standard curve gives the efficiency of the PCR reaction by the following equations:
Exponential amplification = 10(-1/slope)
Efficiency = 10(-1/slope) –1
If the slope of the standard curve is -3.32 then the PCR is 100 % efficient.
With 100 % efficiency, a 2x dilution gives a ∆Ct of 1 between each dilution (each cycle the amount of amplification is doubled).
With a 100 % efficiency, a 10x dilution gives a ∆Ct of 3.2 values between each dilution (every 3.2 cycles the amount of amplification is 10 fold higher).
PCR efficiency between 90 %-110 % is acceptable (i.e. a slope between 3.1 and 3.58)
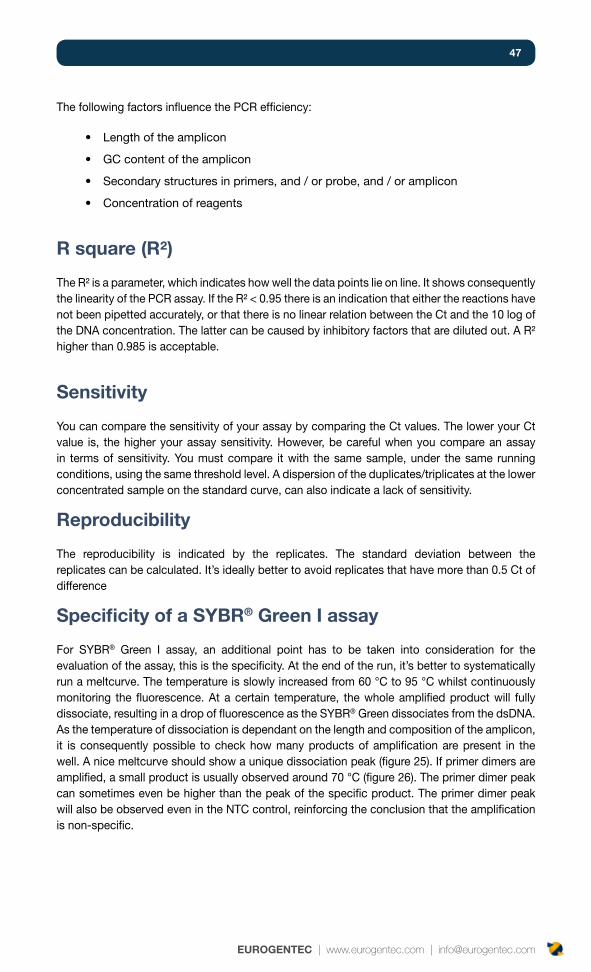
47
EUROGENTEC | www.eurogentec.com | [email protected]
The following factors influence the PCR efficiency:
Length of the amplicon•
GC content of the amplicon•
Secondary structures in primers, and / or probe, and / or amplicon•
Concentration of reagents•
R square (R²)
The R² is a parameter, which indicates how well the data points lie on line. It shows consequently the linearity of the PCR assay. If the R² < 0.95 there is an indication that either the reactions have not been pipetted accurately, or that there is no linear relation between the Ct and the 10 log of the DNA concentration. The latter can be caused by inhibitory factors that are diluted out. A R² higher than 0.985 is acceptable.
sensitivity
You can compare the sensitivity of your assay by comparing the Ct values. The lower your Ct value is, the higher your assay sensitivity. However, be careful when you compare an assay in terms of sensitivity. You must compare it with the same sample, under the same running conditions, using the same threshold level. A dispersion of the duplicates/triplicates at the lower concentrated sample on the standard curve, can also indicate a lack of sensitivity.
Reproducibility
The reproducibility is indicated by the replicates. The standard deviation between the replicates can be calculated. It’s ideally better to avoid replicates that have more than 0.5 Ct of difference
specificity of a sybR® Green I assay
For SYBR® Green I assay, an additional point has to be taken into consideration for the evaluation of the assay, this is the specificity. At the end of the run, it’s better to systematically run a meltcurve. The temperature is slowly increased from 60 °C to 95 °C whilst continuously monitoring the fluorescence. At a certain temperature, the whole amplified product will fully dissociate, resulting in a drop of fluorescence as the SYBR® Green dissociates from the dsDNA. As the temperature of dissociation is dependant on the length and composition of the amplicon, it is consequently possible to check how many products of amplification are present in the well. A nice meltcurve should show a unique dissociation peak (figure 25). If primer dimers are amplified, a small product is usually observed around 70 °C (figure 26). The primer dimer peak can sometimes even be higher than the peak of the specific product. The primer dimer peak will also be observed even in the NTC control, reinforcing the conclusion that the amplification is non-specific.
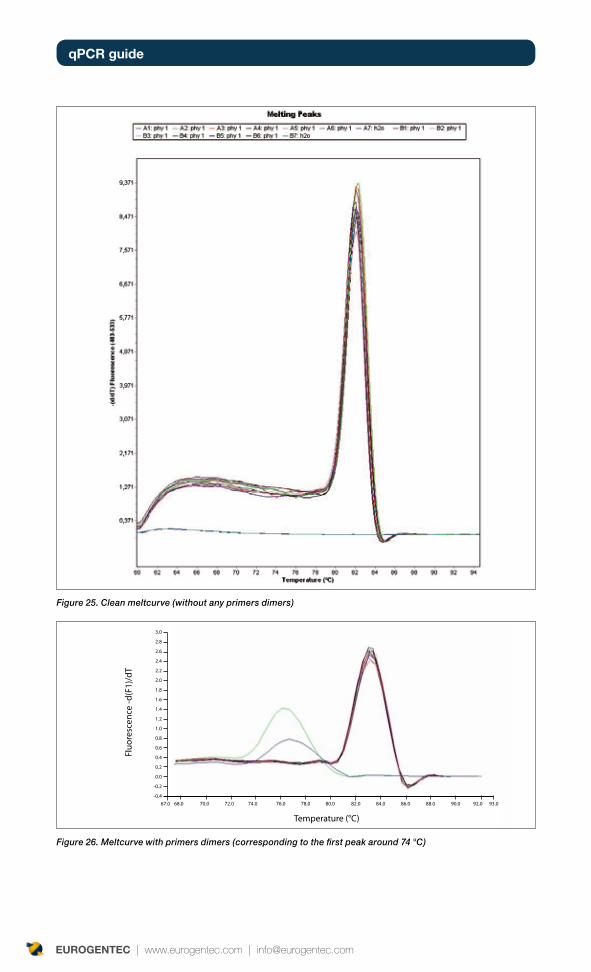
qpCR guide
EUROGENTEC | www.eurogentec.com | [email protected]
Figure 25. Clean meltcurve (without any primers dimers)
Temperature (°C)
Fluo
resc
ence
-d(F
1)/d
T
-0.4
-0.2
0.0
0.2
0.4
0.6
0.8
1.0
1.2
1.4
1.6
1.8
2.0
2.2
2.4
2.6
3.0
2.8
67.0 68.0 70.0 72.0 74.0 76.0 78.0 80.0 82.0 84.0 86.0 88.0 90.0 92.0 93.0
Figure 26. Meltcurve with primers dimers (corresponding to the first peak around 74 °C)
49
EUROGENTEC | www.eurogentec.com | [email protected]
OpTImIzaTION TIps
In generalIf the PCR efficiency is drastically lower than 100 % we would recommend the following:
Check the primer design and optimize the primer concentration•
Trying a new design is sometimes the quickest and cheapest option. To optimize an assay, it is also important to determine the best primer and probe concentration. We recommend testing a matrix of primer and probe concentrations. For SYBR® Green assay: test primers at 50 nM, 100 nM and 300 nM final concentration, each one independently of the other. For probe assay, test primers at 100 nM, 300 nM and 900 nM and test probes at 100 nM and 250 nM. The best combination of forward primer, reverse primer and probe concentrations can then be selected.
Optimize the temperature reaction and times•
Try to change annealing temperature. Start at 60 °C, and then try 58 °C, 56 °C, 54 °C. Try also to increase it up to 64 °C. This annealing temperature of course depends of the Tm of your primers.
Go for a 3-step instead of a 2-step protocol•
In the following cases we recommend performing a 3-step protocol to obtain better results: if results show late Ct values, if the amplicon is quite long, if the results give a less steep growth curve, or if it is not possible to re-do the design.
The protocol will then be as follows:
40 cycles Denaturation 95 °C for 15 seconds
Annealing 60 °C for 30 seconds
Extension 72 °C for 30 seconds
Extension time can be increased with 10-second steps.
It is also possible to add a data collection step after the extension step. To do so, ensure that the detection temperature is at least 3 °C lower than the Tm of the amplicon.
qpCR guide
EUROGENTEC | www.eurogentec.com | [email protected]
for probe multiplexing assay/qualitative qpCRGeneral way of processing for a multiplex assay:
Check carefully the possible complementarity between probes and primers for the •different targets.
Perform (with each target) a singleplex qPCR, with a standard curve to calculate •the PCR efficiency.
Optimize individually each singleplex assays to reach a PCR efficiency as close to •100 %. Multiplex and calculate again the PCR efficiency and the sensitivity of each target. You should not observe a big switch when comparing singleplex and multiplex results for the same target. If there is a loss of sensitivity/efficiency between the singleplex and the multiplex experiment, then try the following things, in this order:
Limit the probe/primer concentration of the most abundant target.•
Optimize the annealing temperatures by trying steps of 2 °C higher and lower than •the current annealing temperature.
Increase the primer/probe concentration of the less abundant target.•
It is actually important to do it in this order, as the main goal is to keep the total primers/probe concentration the lowest possible. A high concentration could partially inhibit the Taq polymerase activity.Such problems can arise when amplification of both genes compete for the PCR reagents. A highly abundant gene can out-compete a less abundant template leading to a bias in the results.
Limiting the primer concentration for the most abundant template can avoid this competition. However, this takes a considerable amount of development. Furthermore, even when working with limited primer concentrations, the detection of rarer target genes may not be possible or may be detectable at much reduced efficiency. Optimizing can also mean adding more units of Taq polymerase per reaction and therefore increasing the costs again.
Be more flexible with your design by using LNA• ® bases. By increasing the Tm of the probe, LNA® probes size can be reduced (cf. p. 15) and specificity increased.
Use a Dark Quencher: when multiplexing, the number of probes in the well •increases, and this can lead to an increase of basal fluorescence. Moreover, quenchers such as TAMRA are also fluorophores, leading to high background fluorescence. That is why we recommend the use of Dark Quencher for multiplex assays. There are now several ‘Dark quenchers’ available. These absorb the energy emitted by the fluorophore, but release it as heat rather than fluorescence, thus leading to a better signal to noise ratio (cf. “Quenching principle”). Dark quenchers are completely non-fluorescent, and have an extremely low background. Using dark quenchers significantly improves signal to noise ratios (higher ∆Rn, a lower background), and thus give a higher sensitivity in multiplex PCR.
51
EUROGENTEC | www.eurogentec.com | [email protected]
TROUblEsHOOTING GUIdE
Contamination
With genomic dNa
The best proof of contamination with genomic DNA is a clean NTC, and a No RT control showing amplification. In this case, carry out a fresh extraction and RT step. If your sample is rare and precious, then use intron spanning primers (cf. p. 28).
from a previous pCR run
When using MasterMixes containing a blend of dUTPs and dNTPs, you can easily get rid of a contamination from a previous PCR run. Just use the UNG at the beginning of each run, this will destroy any PCR product containing dUTPs.
bad pCR efficiency due to primer dimersPrimer dimers in SYBR® Green I assays are easily identifiable on the meltcurve, and the consequence would be a bad PCR efficiency. If you have the choice of the region in which you can design your primers, then the best way to proceed is to do another design. The time wasted for the achieved doubtful result during optimization of an assay with badly designed primers costs much more than a new pair of primers.If you are limited in the choice of the region for the design, then try to decrease the concentration of primers. You can also try different MgCl2 concentrations. The best way to proceed however would be to switch to a probe assay which can be more specific.
InhibitionDecreasing the amount of template can identify the presence of PCR inhibitors in the template. If the Ct values decrease when decreasing amounts of template are used (inverted result), then, it is usually characteristic of the presence of inhibitors. Using an external spiking control can also show the presence of inhibitors.
How to get rid of inhibitors?
There are now several commercial kits to purify RNA samples on columns. You can also try an ethanol precipitation.If your target is expressed in a sufficient amount, the best way of processing is to dilute the cDNA sample.
qpCR guide
EUROGENTEC | www.eurogentec.com | [email protected]
strong backgroundA strong background can be due to the degradation of the probe. Check it on the NTC, and/or on the multicomponent view, to see if the fluorescence increases without target.
A strong background can also be due to the quencher noise, as quencher such TAMRA is also a fluorophore. Use Dark Quencher, especially for multiplex assays.
A high concentration of DNA can also lead to a strong background, if you do multiplex, try to decrease the concentrations of individual primers and probes.
A strong background can also be explained by simple reasons such as fingerprints on the plate, dirt in the thermocycler block, particles in the tube etc.
Genotyping troubleshootingProbe cross hybridization or spectral overlap means that, for example, a X probe cross-hybridizes to the Y amplicon. The following solutions can be used:
Reduce the concentration of the “contaminating” probe, start at 300 nM and •decrease to 50 nM. Optimize the annealing temperature. A probe that hybridizes despite the SNP, •might not anneal at the optimal temperature. Carry out the same test by decreasing and increasing the annealing temperature by 2 °C-steps. Increase the concentration of the probe that gives the lowest signal. •Use LNA• ® to have a more specific X probe, for example by surrounding the SNP by three LNA® bases.
It can also be observed that the VIC/Yakima Yellow probe signal overlaps the FAM one, or the contrary. The same solution mentioned above can be tried. You might also try to reverse the fluorophore keeping the same sequences, or to redesign the probes.
53
EUROGENTEC | www.eurogentec.com | [email protected]
fREQUENTly askEd QUEsTIONs
Is a probe assay more sensitive than a sybR® Green assay?
Both assays can be equally sensitive, however the probe assay is more specific. Consequently, for difficult to optimize PCR assays, it is recommended to use a probe assay.
How can I get rid of a contamination from a previous pCR product?
Use a kit containing dUTP/dNTP and UNG, which will destroy previous PCR products at the beginning of each PCR program.
Why is my Negative Control, positive?
Simple contamination by pipetting over the NTC wells: place them as far as •possible from the lowest diluted sample (highest concentrated sample).
The water is contaminated: use freshly purified water•
There are primer dimers in the SYBR• ® Green assay, leading to a late amplification. This can be checked on the meltcurve.
The probe is degraded.•
How can I avoid gdNa being amplified in a reaction, in which I want to quantify the amount of mRNa?
Perform a DNase treatment of the sample, or design intron spanning primers.
How can I avoid the formation of primer dimers?
Use a HotStart enzyme, optimize the design, and reduce the primer concentration.
Can I use primers I designed for classical pCR for my qpCR experiment?
Some design rules are similar, however one major change is the length of the amplicon, which should ideally not exceed 150 bp in qPCR and can be much longer in PCR.
Why do I have several peaks on my meltcurve?
A peak before the specific peak is usually primer dimers. Two distinct melting peaks can be due to co-amplification of genomic DNA and cDNA, or can be due to a non specific product.
What amount of template should I use in each well?
50 ng of template per well is usually enough. The maximum recommended amount of cDNA is 500 ng in 50 µl, as a too high quantity of RNA/cDNA might inhibit the qPCR reaction.
qpCR guide
EUROGENTEC | www.eurogentec.com | [email protected]
How can I set up the threshold for my qpCR assay?
The threshold, as the baseline, is set up automatically on most machines, and calculated during the early cycles of the qPCR run. However, you can also set it up manually.
What is an acceptable pCR efficiency for my assay?
A PCR efficiency between 96 % and 104 % is ideal. However a PCR efficiency between 90 % and 110 % is acceptable, and the assay can usually be optimized to achieve this.
What is an acceptable R² value for my assay?
A R² higher than 0.985 is acceptable.
should I use a kit containing ROX or not?
It depends on your machine. The ROX passive reference is mainly used on the ABI Prism® and Eppendorf machines to normalize the signal. Check our thermocycler-kit compatibility table to be sure you use the right kit for your machine type.
What should I give Eurogentec to get optimization / troubleshooting advice on my results?
Try to sum up the aim of your qPCR assay and the species on which you work. Then you should send us the plate set up, the thermal cycling conditions, the kit and machine you use, the amplification curve and associated Ct values, the standard curve, the meltcurve for SYBR® Green assay, the raw data and multicomponent view if possible on your machine, the sequence and Tm of your primers/probe, the concentration of primers/probe, and the normalization method. Please send all this informations to [email protected].
How should I store kits, primers and probes?
Probe MasterMixes are stable for 2 years at -20 °C, SYBR® Green MasterMixes are stable for 1 year at -20 °C. It is also possible to store them at 4 °C for one month. Avoid doing more than 5 cycles of freeze-thawing. RT mixes are stable for one year at -20 °C or -80 °C.Probes and primers in solution should also be stored at -20 °C in the dark, and are stable for months.
In which buffer should probes be resuspended?
Probes are very sensitive to hydrolysis, so resuspend them in TE 0.01 or just water. Any acidic solution will hydrolyze the probes and give a lower signal to noise ratio.
In which case is a one-step qRT-pCR recommended?
For high-throughput screening and optimized reactions, and to avoid any contamination, a One-Step experiment is the best way to proceed.

55
EUROGENTEC | www.eurogentec.com | [email protected]
EUROGENTEC pROdUCTs
kits and consumablesOur MasterMixes are developed to work with standard temperature profiles, to be completely adapted to any assay. However, it is recommended to generate a primer optimization matrix and a primer and probe ratio matrix, as this is a crucial step to obtain the lowest signal-to-noise ratio, the earliest Ct value and to save maximum reagents.If you don’t find the reagent you need in the table below, please contact us at [email protected].
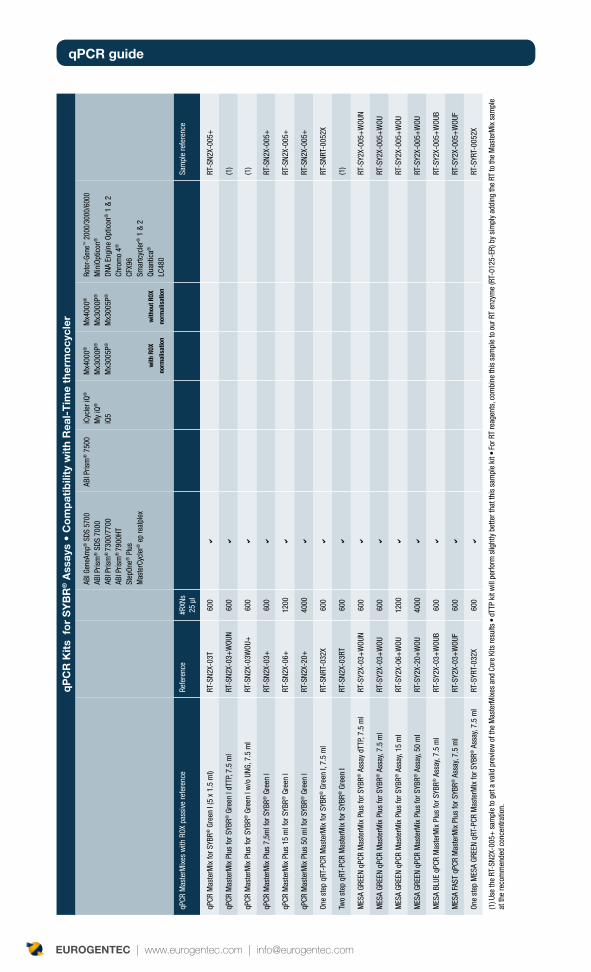
qpCR guide
EUROGENTEC | www.eurogentec.com | [email protected]
qp
CR
kit
s f
or
sy
bR
® A
ssay
s •
Co
mp
atib
ility
wit
h R
eal-
Tim
e th
erm
ocy
cler
ABI G
eneA
mp®
SDS
570
0AB
I Pris
m® S
DS 7
000
ABI P
rism
® 7
300/
7700
ABI P
rism
® 7
900H
TSt
epOn
e® P
lus
Mas
terC
ycle
r® e
p re
alpl
ex
ABI P
rism
® 7
500
iCyc
ler i
Q®
My
iQ®
iQ5
Mx4
000®
Mx3
000P
®
Mx3
005P
®
with
ROX
norm
alis
atio
n
Mx4
000®
Mx3
000P
®
Mx3
005P
®
with
out R
OX
norm
alis
atio
n
Roto
r-Gen
e™ 2
000/
3000
/600
0M
iniO
ptic
on®
DNA
Engi
ne O
ptic
on® 1
& 2
Chro
mo
4®
CFX9
6Sm
artc
ycle
r® 1
& 2
Quan
tica®
LC
480
qPCR
Mas
terM
ixes
with
ROX
pas
sive
refe
renc
eRe
fere
nce
#RXN
s25
µl
Sam
ple
refe
renc
e
qPCR
Mas
terM
ix fo
r SYB
R® G
reen
I (5
x 1
.5 m
l)RT
-SN2
X-03
T60
0a
RT-S
N2X-
005+
qPCR
Mas
terM
ix P
lus
for S
YBR®
Gre
en I
dTTP
, 7.5
ml
RT-S
N2X-
03+
WOU
N60
0a
(1)
qPCR
Mas
terM
ix P
lus
for S
YBR®
Gre
en I
w/o
UNG
, 7.5
ml
RT-S
N2X-
03W
OU+
600
a(1
)
qPCR
Mas
terM
ix P
lus
7,5m
l for
SYB
R® G
reen
IRT
-SN2
X-03
+60
0a
RT-S
N2X-
005+
qPCR
Mas
terM
ix P
lus
15 m
l for
SYB
R® G
reen
IRT
-SN2
X-06
+12
00a
RT-S
N2X-
005+
qPCR
Mas
terM
ix P
lus
50 m
l for
SYB
R® G
reen
IRT
-SN2
X-20
+40
00a
RT-S
N2X-
005+
One
step
qRT
-PCR
Mas
terM
ix fo
r SYB
R® G
reen
I, 7
.5 m
lRT
-SNR
T-03
2X60
0a
RT-S
NRT-
0052
X
Two
step
qRT
-PCR
Mas
terM
ix fo
r SYB
R® G
reen
IRT
-SN2
X-03
RT60
0a
(1)
MES
A GR
EEN
qPCR
Mas
terM
ix P
lus
for S
YBR®
Ass
ay d
TTP,
7.5
ml
RT-S
Y2X-
03+
WOU
N60
0a
RT-S
Y2X-
005+
WOU
N
MES
A GR
EEN
qPCR
Mas
terM
ix P
lus
for S
YBR®
Ass
ay, 7
.5 m
lRT
-SY2
X-03
+W
OU60
0a
RT-S
Y2X-
005+
WOU
MES
A GR
EEN
qPCR
Mas
terM
ix P
lus
for S
YBR®
Ass
ay, 1
5 m
lRT
-SY2
X-06
+W
OU12
00a
RT-S
Y2X-
005+
WOU
MES
A GR
EEN
qPCR
Mas
terM
ix P
lus
for S
YBR®
Ass
ay, 5
0 m
lRT
-SY2
X-20
+W
OU40
00a
RT-S
Y2X-
005+
WOU
MES
A BL
UE q
PCR
Mas
terM
ix P
lus
for S
YBR®
Ass
ay, 7
.5 m
lRT
-SY2
X-03
+W
OUB
600
aRT
-SY2
X-00
5+W
OUB
MES
A FA
ST q
PCR
Mas
terM
ix P
lus
for S
YBR®
Ass
ay, 7
.5 m
lRT
-SY2
X-03
+W
OUF
600
aRT
-SY2
X-00
5+W
OUF
One
step
MES
A GR
EEN
qRT-
PCR
Mas
terM
ix fo
r SYB
R® A
ssay
, 7.5
ml
RT-S
YRT-
032X
600
aRT
-SYR
T-00
52X
(1) U
se th
e RT
-SN2
X-00
5+ s
ampl
e to
get
a v
alid
pre
view
of t
he M
aste
rMix
es a
nd C
ore
Kits
resu
lts •
dTT
P ki
t will
per
form
slig
htly
bet
ter t
hat t
his
sam
ple
kit •
For
RT
reag
ents
, com
bine
this
sam
ple
to o
ur R
T en
zym
e (R
T-01
25-E
R) b
y si
mpl
y ad
ding
the
RT to
the
Mas
terM
ix s
ampl
e at
the
reco
mm
ende
d co
ncen
tratio
n.
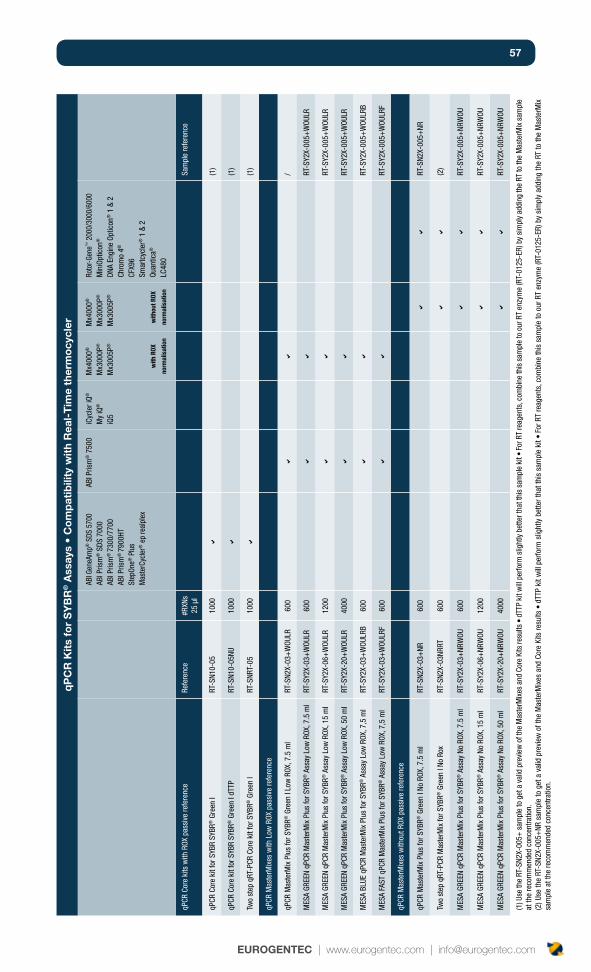
57
EUROGENTEC | www.eurogentec.com | [email protected]
qp
CR
kit
s fo
r s
yb
R® A
ssay
s •
Co
mp
atib
ility
wit
h R
eal-
Tim
e th
erm
ocy
cler
ABI G
eneA
mp®
SDS
570
0AB
I Pris
m® S
DS 7
000
ABI P
rism
® 7
300/
7700
ABI P
rism
® 7
900H
TSt
epOn
e® P
lus
Mas
terC
ycle
r® e
p re
alpl
ex
ABI P
rism
® 7
500
iCyc
ler i
Q®
My
iQ®
iQ5
Mx4
000®
Mx3
000P
®
Mx3
005P
®
with
ROX
norm
alis
atio
n
Mx4
000®
Mx3
000P
®
Mx3
005P
®
with
out R
OX
norm
alis
atio
n
Roto
r-Gen
e™ 2
000/
3000
/600
0M
iniO
ptic
on®
DNA
Engi
ne O
ptic
on® 1
& 2
Chro
mo
4®
CFX9
6Sm
artc
ycle
r® 1
& 2
Quan
tica®
LC
480
qPCR
Cor
e ki
ts w
ith R
OX p
assi
ve re
fere
nce
Refe
renc
e#R
XNs
25 µ
lSa
mpl
e re
fere
nce
qPCR
Cor
e ki
t for
SYB
R SY
BR® G
reen
IRT
-SN1
0-05
1000
a(1
)
qPCR
Cor
e ki
t for
SYB
R SY
BR® G
reen
I dT
TPRT
-SN1
0-05
NU10
00a
(1)
Two
step
qRT
-PCR
Cor
e ki
t for
SYB
R® G
reen
IRT
-SNR
T-05
1000
a(1
)
qPCR
Mas
terM
ixes
with
Low
ROX
pas
sive
refe
renc
e
qPCR
Mas
terM
ix P
lus
for S
YBR®
Gre
en I
Low
ROX
, 7.5
ml
RT-S
N2X-
03+
WOU
LR60
0a
a/
MES
A GR
EEN
qPCR
Mas
terM
ix P
lus
for S
YBR®
Ass
ay L
ow R
OX, 7
.5 m
lRT
-SY2
X-03
+W
OULR
600
aa
RT-S
Y2X-
005+
WOU
LR
MES
A GR
EEN
qPCR
Mas
terM
ix P
lus
for S
YBR®
Ass
ay L
ow R
OX, 1
5 m
lRT
-SY2
X-06
+W
OULR
1200
aa
RT-S
Y2X-
005+
WOU
LR
MES
A GR
EEN
qPCR
Mas
terM
ix P
lus
for S
YBR®
Ass
ay L
ow R
OX, 5
0 m
lRT
-SY2
X-20
+W
OULR
4000
aa
RT-S
Y2X-
005+
WOU
LR
MES
A BL
UE q
PCR
Mas
terM
ix P
lus
for S
YBR®
Ass
ay L
ow R
OX, 7
,5 m
lRT
-SY2
X-03
+W
OULR
B60
0a
aRT
-SY2
X-00
5+W
OULR
B
MES
A FA
ST q
PCR
Mas
terM
ix P
lus
for S
YBR®
Ass
ay L
ow R
OX, 7
,5 m
lRT
-SY2
X-03
+W
OULR
F60
0a
aRT
-SY2
X-00
5+W
OULR
F
qPCR
Mas
terM
ixes
with
out R
OX p
assi
ve re
fere
nce
qPCR
Mas
terM
ix P
lus
for S
YBR®
Gre
en I
No R
OX, 7
.5 m
lRT
-SN2
X-03
+NR
600
aa
RT-S
N2X-
005+
NR
Two
step
qRT
-PCR
Mas
terM
ix fo
r SYB
R® G
reen
I No
Rox
RT-S
N2X-
03NR
RT60
0a
a(2
)
MES
A GR
EEN
qPCR
Mas
terM
ix P
lus
for S
YBR®
Ass
ay N
o RO
X, 7
.5 m
lRT
-SY2
X-03
+NR
WOU
600
aa
RT-S
Y2X-
005+
NRW
OU
MES
A GR
EEN
qPCR
Mas
terM
ix P
lus
for S
YBR®
Ass
ay N
o RO
X, 1
5 m
lRT
-SY2
X-06
+NR
WOU
1200
aa
RT-S
Y2X-
005+
NRW
OU
MES
A GR
EEN
qPCR
Mas
terM
ix P
lus
for S
YBR®
Ass
ay N
o RO
X, 5
0 m
lRT
-SY2
X-20
+NR
WOU
4000
aa
RT-S
Y2X-
005+
NRW
OU
(1) U
se th
e RT
-SN2
X-00
5+ s
ampl
e to
get
a v
alid
pre
view
of t
he M
aste
rMix
es a
nd C
ore
Kits
resu
lts •
dTT
P ki
t will
per
form
slig
htly
bet
ter t
hat t
his
sam
ple
kit •
For
RT
reag
ents
, com
bine
this
sam
ple
to o
ur R
T en
zym
e (R
T-01
25-E
R) b
y si
mpl
y ad
ding
the
RT to
the
Mas
terM
ix s
ampl
e at
the
reco
mm
ende
d co
ncen
tratio
n.
(2) U
se th
e RT
-SN2
X-00
5+NR
sam
ple
to g
et a
val
id p
revi
ew o
f the
Mas
terM
ixes
and
Cor
e Ki
ts re
sults
• d
TTP
kit w
ill p
erfo
rm s
light
ly b
ette
r tha
t thi
s sa
mpl
e ki
t • F
or R
T re
agen
ts, c
ombi
ne th
is s
ampl
e to
our
RT
enzy
me
(RT-
0125
-ER)
by
sim
ply
addi
ng th
e RT
to th
e M
aste
rMix
sa
mpl
e at
the
reco
mm
ende
d co
ncen
tratio
n.
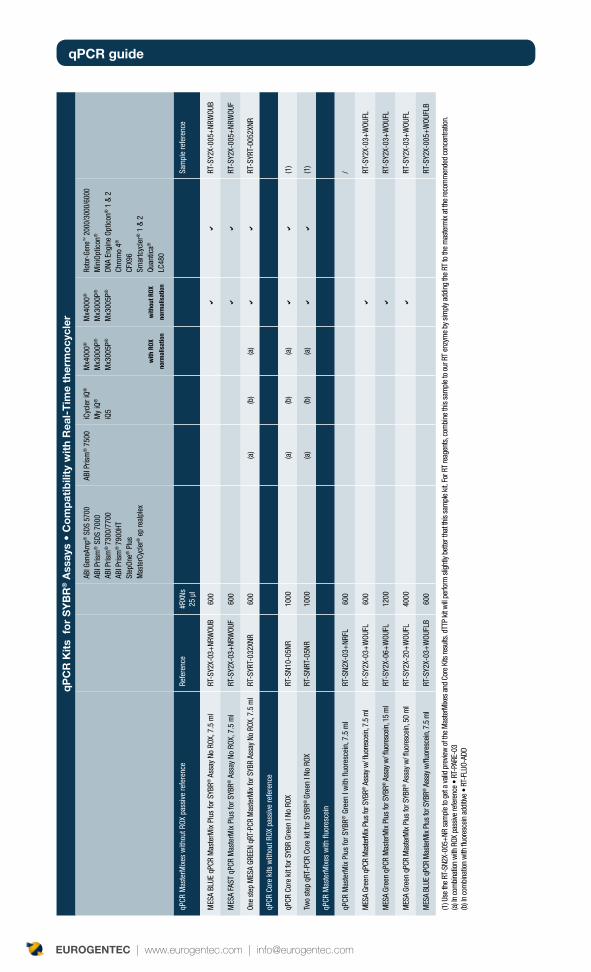
qpCR guide
EUROGENTEC | www.eurogentec.com | [email protected]
qp
CR
kit
s f
or
sy
bR
® A
ssay
s •
Co
mp
atib
ility
wit
h R
eal-
Tim
e th
erm
ocy
cler
ABI G
eneA
mp®
SDS
570
0AB
I Pris
m® S
DS 7
000
ABI P
rism
® 7
300/
7700
ABI P
rism
® 7
900H
TSt
epOn
e® P
lus
Mas
terC
ycle
r® e
p re
alpl
ex
ABI P
rism
® 7
500
iCyc
ler i
Q®
My
iQ®
iQ5
Mx4
000®
Mx3
000P
®
Mx3
005P
®
with
ROX
norm
alis
atio
n
Mx4
000®
Mx3
000P
®
Mx3
005P
®
with
out R
OX
norm
alis
atio
n
Roto
r-Gen
e™ 2
000/
3000
/600
0M
iniO
ptic
on®
DNA
Engi
ne O
ptic
on® 1
& 2
Chro
mo
4®
CFX9
6Sm
artc
ycle
r® 1
& 2
Quan
tica®
LC
480
qPCR
Mas
terM
ixes
with
out R
OX p
assi
ve re
fere
nce
Refe
renc
e#R
XNs
25 µ
lSa
mpl
e re
fere
nce
MES
A BL
UE q
PCR
Mas
terM
ix P
lus
for S
YBR®
Ass
ay N
o RO
X, 7
.5 m
lRT
-SY2
X-03
+NR
WOU
B60
0a
aRT
-SY2
X-00
5+NR
WOU
B
MES
A FA
ST q
PCR
Mas
terM
ix P
lus
for S
YBR®
Ass
ay N
o RO
X, 7
.5 m
lRT
-SY2
X-03
+NR
WOU
F60
0a
aRT
-SY2
X-00
5+NR
WOU
F
One
step
MES
A GR
EEN
qRT-
PCR
Mas
terM
ix fo
r SYB
R As
say
No R
OX, 7
.5 m
lRT
-SYR
T-03
2XNR
600
(a)
(b)
(a)
aa
RT-S
YRT-
0052
XNR
qPCR
Cor
e ki
ts w
ithou
t ROX
pas
sive
refe
renc
e
qPCR
Cor
e ki
t for
SYB
R Gr
een
I No
ROX
RT-S
N10-
05NR
1000
(a)
(b)
(a)
aa
(1)
Two
step
qRT
-PCR
Cor
e ki
t for
SYB
R® G
reen
I No
ROX
RT-S
NRT-
05NR
1000
(a)
(b)
(a)
aa
(1)
qPCR
Mas
terM
ixes
with
fluo
resc
ein
qPCR
Mas
terM
ix P
lus
for S
YBR®
Gre
en I
with
fluo
resc
ein,
7.5
ml
RT-S
N2X-
03+
NRFL
600
/
MES
A Gr
een
qPCR
Mas
terM
ix Pl
us fo
r SYB
R® A
ssay
w/ fl
uore
scei
n, 7
.5 m
lRT
-SY2
X-03
+W
OUFL
600
aRT
-SY2
X-03
+W
OUFL
MES
A Gr
een
qPCR
Mas
terM
ix P
lus
for S
YBR®
Ass
ay w
/ fluo
resc
ein,
15
ml
RT-S
Y2X-
06+
WOU
FL12
00a
RT-S
Y2X-
03+
WOU
FL
MES
A Gr
een
qPCR
Mas
terM
ix Pl
us fo
r SYB
R® A
ssay
w/ fl
uore
scei
n, 5
0 m
lRT
-SY2
X-20
+W
OUFL
4000
aRT
-SY2
X-03
+W
OUFL
MES
A BL
UE q
PCR
Mas
terM
ix Pl
us fo
r SYB
R® A
ssay
w/fl
uore
scei
n, 7
.5 m
lRT
-SY2
X-03
+W
OUFL
B60
0RT
-SY2
X-00
5+W
OUFL
B
(1) U
se th
e RT
-SN2
X-00
5+NR
sam
ple
to g
et a
val
id p
revie
w o
f the
Mas
terM
ixes
and
Core
Kits
resu
lts. d
TTP
kit w
ill pe
rform
slig
htly
bette
r tha
t thi
s sa
mpl
e ki
t. Fo
r RT
reag
ents
, com
bine
this
sam
ple
to o
ur R
T en
zym
e by
sim
ply
addi
ng th
e RT
to th
e m
aste
rmix
at th
e re
com
men
ded
conc
entra
tion.
(a) I
n co
mbi
natio
n w
ith R
OX p
assiv
e re
fere
nce
• RT
-PAR
E-03
(b) I
n co
mbi
natio
n w
ith fl
uore
scei
n ad
ditiv
e •
RT-F
LUO-
ADD
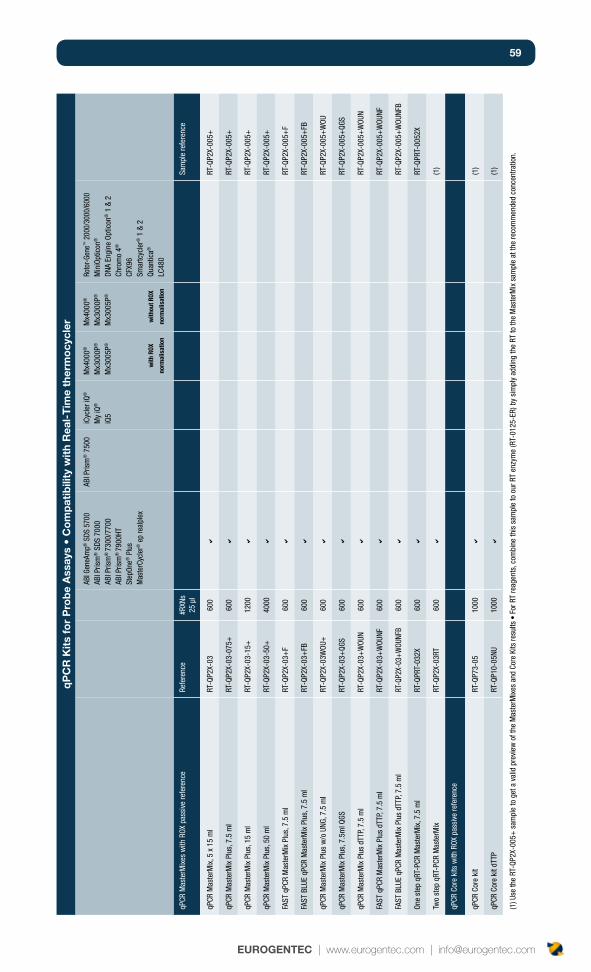
59
EUROGENTEC | www.eurogentec.com | [email protected]
qP
CR
Kit
s fo
r P
rob
e A
ssay
s •
Co
mp
atib
ility
wit
h R
eal-
Tim
e th
erm
ocy
cler
ABI G
eneA
mp®
SDS
570
0AB
I Pris
m® S
DS 7
000
ABI P
rism
® 7
300/
7700
ABI P
rism
® 7
900H
TSt
epOn
e® P
lus
Mas
terC
ycle
r® e
p re
alpl
ex
ABI P
rism
® 7
500
iCyc
ler i
Q®
My
iQ®
iQ5
Mx4
000®
Mx3
000P
®
Mx3
005P
®
with
ROX
norm
alis
atio
n
Mx4
000®
Mx3
000P
®
Mx3
005P
®
with
out R
OX
norm
alis
atio
n
Roto
r-Gen
e™ 2
000/
3000
/600
0M
iniO
ptic
on®
DNA
Engi
ne O
ptic
on® 1
& 2
Chro
mo
4®
CFX9
6Sm
artc
ycle
r® 1
& 2
Quan
tica®
LC
480
qPCR
Mas
terM
ixes
with
ROX
pas
sive
refe
renc
eRe
fere
nce
#RXN
s25
µl
Sam
ple
refe
renc
e
qPCR
Mas
terM
ix, 5
x 1
5 m
lRT
-QP2
X-03
600
aRT
-QP2
X-00
5+
qPCR
Mas
terM
ix P
lus,
7.5
ml
RT-Q
P2X-
03-0
75+
600
aRT
-QP2
X-00
5+
qPCR
Mas
terM
ix P
lus,
15
ml
RT-Q
P2X-
03-1
5+12
00a
RT-Q
P2X-
005+
qPCR
Mas
terM
ix P
lus,
50
ml
RT-Q
P2X-
03-5
0+40
00a
RT-Q
P2X-
005+
FAST
qPC
R M
aste
rMix
Plu
s, 7
.5 m
lRT
-QP2
X-03
+F
600
aRT
-QP2
X-00
5+F
FAST
BLU
E qP
CR M
aste
rMix
Plu
s, 7
.5 m
lRT
-QP2
X-03
+FB
600
aRT
-QP2
X-00
5+FB
qPCR
Mas
terM
ix P
lus
w/o
UNG
, 7.5
ml
RT-Q
P2X-
03W
OU+
600
aRT
-QP2
X-00
5+W
OU
qPCR
Mas
terM
ix P
lus,
7.5
ml Q
GSRT
-QP2
X-03
+QG
S60
0a
RT-Q
P2X-
005+
QGS
qPCR
Mas
terM
ix P
lus
dTTP
, 7.5
ml
RT-Q
P2X-
03+
WOU
N60
0a
RT-Q
P2X-
005+
WOU
N
FAST
qPC
R M
aste
rMix
Plu
s dT
TP, 7
.5 m
lRT
-QP2
X-03
+W
OUNF
600
aRT
-QP2
X-00
5+W
OUNF
FAST
BLU
E qP
CR M
aste
rMix
Plu
s dT
TP, 7
.5 m
lRT
-QP2
X-03
+WOU
NFB
600
aRT
-QP2
X-00
5+W
OUNF
B
One
step
qRT
-PCR
Mas
terM
ix, 7
.5 m
lRT
-QPR
T-03
2X60
0a
RT-Q
PRT-
0052
X
Two
step
qRT
-PCR
Mas
terM
ixRT
-QP2
X-03
RT60
0a
(1)
qPCR
Cor
e ki
ts w
ith R
OX p
assi
ve re
fere
nce
qPCR
Cor
e ki
tRT
-QP7
3-05
1000
a(1
)
qPCR
Cor
e ki
t dTT
PRT
-QP1
0-05
NU10
00a
(1)
(1) U
se th
e RT
-QP2
X-00
5+ s
ampl
e to
get
a v
alid
pre
view
of t
he M
aste
rMix
es a
nd C
ore
Kits
resu
lts •
For
RT
reag
ents
, com
bine
this
sam
ple
to o
ur R
T en
zym
e (R
T-01
25-E
R) b
y si
mpl
y ad
ding
the
RT to
the
Mas
terM
ix s
ampl
e at
the
reco
mm
ende
d co
ncen
tratio
n.
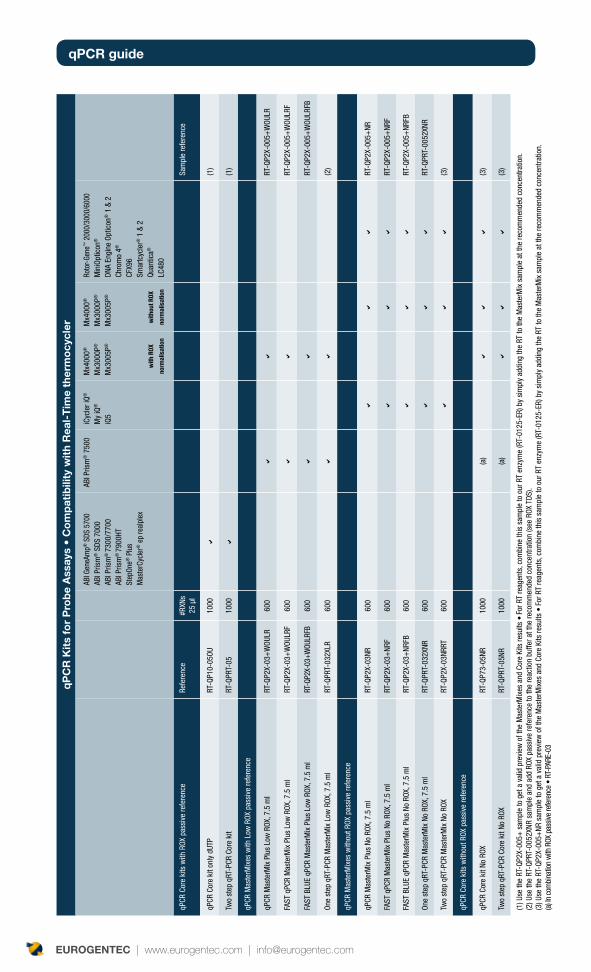
qpCR guide
EUROGENTEC | www.eurogentec.com | [email protected]
qP
CR
Kit
s fo
r P
rob
e A
ssay
s •
Co
mp
atib
ility
wit
h R
eal-
Tim
e th
erm
ocy
cler
ABI G
eneA
mp®
SDS
570
0AB
I Pris
m® S
DS 7
000
ABI P
rism
® 7
300/
7700
ABI P
rism
® 7
900H
TSt
epOn
e® P
lus
Mas
terC
ycle
r® e
p re
alpl
ex
ABI P
rism
® 7
500
iCyc
ler i
Q®
My
iQ®
iQ5
Mx4
000®
Mx3
000P
®
Mx3
005P
®
with
ROX
norm
alis
atio
n
Mx4
000®
Mx3
000P
®
Mx3
005P
®
with
out R
OX
norm
alis
atio
n
Roto
r-Gen
e™ 2
000/
3000
/600
0M
iniO
ptic
on®
DNA
Engi
ne O
ptic
on® 1
& 2
Chro
mo
4®
CFX9
6Sm
artc
ycle
r® 1
& 2
Quan
tica®
LC
480
qPCR
Cor
e ki
ts w
ith R
OX p
assi
ve re
fere
nce
Refe
renc
e#R
XNs
25 µ
l Sa
mpl
e re
fere
nce
qPCR
Cor
e ki
t onl
y dU
TPRT
-QP1
0-05
OU10
00a
(1)
Two
step
qRT
-PCR
Cor
e ki
tRT
-QPR
T-05
1000
a(1
)
qPCR
Mas
terM
ixes
with
Low
ROX
pas
sive
refe
renc
e
qPCR
Mas
terM
ix P
lus
Low
ROX
, 7.5
ml
RT-Q
P2X-
03+
WOU
LR60
0a
aRT
-QP2
X-00
5+W
OULR
FAST
qPC
R M
aste
rMix
Plu
s Lo
w R
OX, 7
.5 m
lRT
-QP2
X-03
+W
OULR
F60
0a
aRT
-QP2
X-00
5+W
OULR
F
FAST
BLU
E qP
CR M
aste
rMix
Plu
s Lo
w R
OX, 7
.5 m
lRT
-QP2
X-03
+WOU
LRFB
600
aa
RT-Q
P2X-
005+
WOU
LRFB
One
step
qRT
-PCR
Mas
terM
ix L
ow R
OX, 7
.5 m
lRT
-QPR
T-03
2XLR
600
aa
(2)
qPCR
Mas
terM
ixes
with
out R
OX p
assi
ve re
fere
nce
qPCR
Mas
terM
ix P
lus
No R
OX, 7
.5 m
lRT
-QP2
X-03
NR60
0a
aa
RT-Q
P2X-
005+
NR
FAST
qPC
R M
aste
rMix
Plu
s No
ROX
, 7.5
ml
RT-Q
P2X-
03+
NRF
600
aa
aRT
-QP2
X-00
5+NR
F
FAST
BLU
E qP
CR M
aste
rMix
Plu
s No
ROX
, 7.5
ml
RT-Q
P2X-
03+
NRFB
600
aa
aRT
-QP2
X-00
5+NR
FB
One
step
qRT
-PCR
Mas
terM
ix N
o RO
X, 7
.5 m
lRT
-QPR
T-03
2XNR
600
aa
aRT
-QPR
T-00
52XN
R
Two
step
qRT
-PCR
Mas
terM
ix N
o RO
XRT
-QP2
X-03
NRRT
600
aa
a(3
)
qPCR
Cor
e ki
ts w
ithou
t ROX
pas
sive
refe
renc
e
qPCR
Cor
e ki
t No
ROX
RT-Q
P73-
05NR
1000
(a)
aa
a(3
)
Two
step
qRT
-PCR
Cor
e ki
t No
ROX
RT-Q
PRT-
05NR
1000
(a)
aa
a(3
)
(1) U
se th
e RT
-QP2
X-00
5+ s
ampl
e to
get
a v
alid
pre
view
of t
he M
aste
rMix
es a
nd C
ore
Kits
resu
lts •
For
RT
reag
ents
, com
bine
this
sam
ple
to o
ur R
T en
zym
e (R
T-01
25-E
R) b
y si
mpl
y ad
ding
the
RT to
the
Mas
terM
ix s
ampl
e at
the
reco
mm
ende
d co
ncen
tratio
n.
(2) U
se th
e RT
-QPR
T-00
52XN
R sa
mpl
e an
d ad
d RO
X pa
ssiv
e re
fere
nce
to th
e re
actio
n bu
ffer a
t the
reco
mm
ende
d co
ncen
tratio
n (s
ee R
OX T
DS).
(3) U
se th
e RT
-QP2
X-00
5+NR
sam
ple
to g
et a
val
id p
revi
ew o
f the
Mas
terM
ixes
and
Cor
e Ki
ts re
sults
• F
or R
T re
agen
ts, c
ombi
ne th
is s
ampl
e to
our
RT
enzy
me
(RT-
0125
-ER)
by
sim
ply
addi
ng th
e RT
to th
e M
aste
rMix
sam
ple
at th
e re
com
men
ded
conc
entra
tion.
(a) I
n co
mbi
natio
n w
ith R
OX p
assiv
e re
fere
nce
• RT
-PAR
E-03
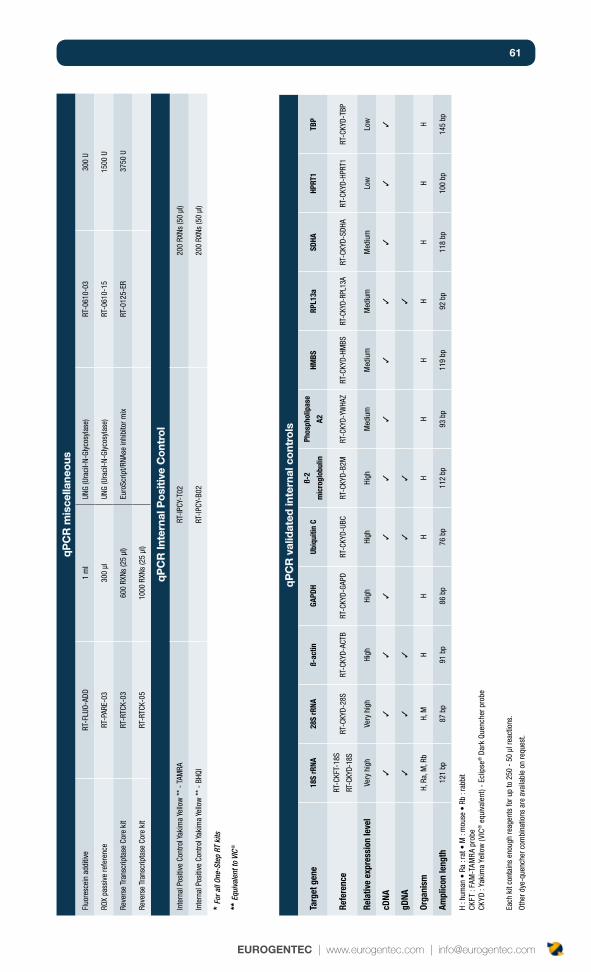
61
EUROGENTEC | www.eurogentec.com | [email protected]
qP
CR
Kit
s fo
r P
rob
e A
ssay
s •
Co
mp
atib
ility
wit
h R
eal-
Tim
e th
erm
ocy
cler
ABI G
eneA
mp®
SDS
570
0AB
I Pris
m® S
DS 7
000
ABI P
rism
® 7
300/
7700
ABI P
rism
® 7
900H
TSt
epOn
e® P
lus
Mas
terC
ycle
r® e
p re
alpl
ex
ABI P
rism
® 7
500
iCyc
ler i
Q®
My
iQ®
iQ5
Mx4
000®
Mx3
000P
®
Mx3
005P
®
with
ROX
norm
alis
atio
n
Mx4
000®
Mx3
000P
®
Mx3
005P
®
with
out R
OX
norm
alis
atio
n
Roto
r-Gen
e™ 2
000/
3000
/600
0M
iniO
ptic
on®
DNA
Engi
ne O
ptic
on® 1
& 2
Chro
mo
4®
CFX9
6Sm
artc
ycle
r® 1
& 2
Quan
tica®
LC
480
qPCR
Cor
e ki
ts w
ith R
OX p
assi
ve re
fere
nce
Refe
renc
e#R
XNs
25 µ
l Sa
mpl
e re
fere
nce
qPCR
Cor
e ki
t onl
y dU
TPRT
-QP1
0-05
OU10
00a
(1)
Two
step
qRT
-PCR
Cor
e ki
tRT
-QPR
T-05
1000
a(1
)
qPCR
Mas
terM
ixes
with
Low
ROX
pas
sive
refe
renc
e
qPCR
Mas
terM
ix P
lus
Low
ROX
, 7.5
ml
RT-Q
P2X-
03+
WOU
LR60
0a
aRT
-QP2
X-00
5+W
OULR
FAST
qPC
R M
aste
rMix
Plu
s Lo
w R
OX, 7
.5 m
lRT
-QP2
X-03
+W
OULR
F60
0a
aRT
-QP2
X-00
5+W
OULR
F
FAST
BLU
E qP
CR M
aste
rMix
Plu
s Lo
w R
OX, 7
.5 m
lRT
-QP2
X-03
+WOU
LRFB
600
aa
RT-Q
P2X-
005+
WOU
LRFB
One
step
qRT
-PCR
Mas
terM
ix L
ow R
OX, 7
.5 m
lRT
-QPR
T-03
2XLR
600
aa
(2)
qPCR
Mas
terM
ixes
with
out R
OX p
assi
ve re
fere
nce
qPCR
Mas
terM
ix P
lus
No R
OX, 7
.5 m
lRT
-QP2
X-03
NR60
0a
aa
RT-Q
P2X-
005+
NR
FAST
qPC
R M
aste
rMix
Plu
s No
ROX
, 7.5
ml
RT-Q
P2X-
03+
NRF
600
aa
aRT
-QP2
X-00
5+NR
F
FAST
BLU
E qP
CR M
aste
rMix
Plu
s No
ROX
, 7.5
ml
RT-Q
P2X-
03+
NRFB
600
aa
aRT
-QP2
X-00
5+NR
FB
One
step
qRT
-PCR
Mas
terM
ix N
o RO
X, 7
.5 m
lRT
-QPR
T-03
2XNR
600
aa
aRT
-QPR
T-00
52XN
R
Two
step
qRT
-PCR
Mas
terM
ix N
o RO
XRT
-QP2
X-03
NRRT
600
aa
a(3
)
qPCR
Cor
e ki
ts w
ithou
t ROX
pas
sive
refe
renc
e
qPCR
Cor
e ki
t No
ROX
RT-Q
P73-
05NR
1000
(a)
aa
a(3
)
Two
step
qRT
-PCR
Cor
e ki
t No
ROX
RT-Q
PRT-
05NR
1000
(a)
aa
a(3
)
(1) U
se th
e RT
-QP2
X-00
5+ s
ampl
e to
get
a v
alid
pre
view
of t
he M
aste
rMix
es a
nd C
ore
Kits
resu
lts •
For
RT
reag
ents
, com
bine
this
sam
ple
to o
ur R
T en
zym
e (R
T-01
25-E
R) b
y si
mpl
y ad
ding
the
RT to
the
Mas
terM
ix s
ampl
e at
the
reco
mm
ende
d co
ncen
tratio
n.
(2) U
se th
e RT
-QPR
T-00
52XN
R sa
mpl
e an
d ad
d RO
X pa
ssiv
e re
fere
nce
to th
e re
actio
n bu
ffer a
t the
reco
mm
ende
d co
ncen
tratio
n (s
ee R
OX T
DS).
(3) U
se th
e RT
-QP2
X-00
5+NR
sam
ple
to g
et a
val
id p
revi
ew o
f the
Mas
terM
ixes
and
Cor
e Ki
ts re
sults
• F
or R
T re
agen
ts, c
ombi
ne th
is s
ampl
e to
our
RT
enzy
me
(RT-
0125
-ER)
by
sim
ply
addi
ng th
e RT
to th
e M
aste
rMix
sam
ple
at th
e re
com
men
ded
conc
entra
tion.
(a) I
n co
mbi
natio
n w
ith R
OX p
assiv
e re
fere
nce
• RT
-PAR
E-03
qp
CR
val
idat
ed in
tern
al c
ont
rols
Targ
et g
ene
18S
rRNA
28S
rRNA
ß-ac
tinGA
PDH
Ubiq
uitin
Cß-
2
mic
rogl
obul
in
Phos
phol
ipas
e
A2HM
BSRP
L13a
SDHA
HPRT
1TB
P
Refe
renc
eRT
-CKF
T-18
S
RT-C
KYD-
18S
RT-C
KYD-
28S
RT-C
KYD-
ACTB
RT-C
KYD-
GAPD
RT-C
KYD-
UBC
RT-C
KYD-
B2M
RT-C
KYD-
YWHA
ZRT
-CKY
D-HM
BSRT
-CKY
D-RP
L13A
RT-C
KYD-
SDHA
RT-C
KYD-
HPRT
1RT
-CKY
D-TB
P
Rela
tive
expr
essi
on le
vel
Very
hig
hVe
ry h
igh
High
High
High
High
Med
ium
Med
ium
Med
ium
Med
ium
Low
Low
cDNA
33
33
33
33
33
33
gDNA
33
33
33
Orga
nism
H, R
a, M
, Rb
H, M
HH
HH
HH
HH
HH
Ampl
icon
leng
th12
1 bp
87 b
p91
bp
86 b
p76
bp
112
bp93
bp
119
bp92
bp
118
bp10
0 bp
145
bp
H : h
uman
• R
a : r
at •
M :
mou
se •
Rb
: rab
bit
CKFT
: FA
M-T
AMR
A pr
obe
CKYD
: Ya
kim
a Ye
llow
(VIC
® e
quiv
alen
t) -
Eclip
se® D
ark
Que
nche
r pro
be
Each
kit
cont
ains
eno
ugh
reag
ents
for u
p to
250
- 5
0 µl
reac
tions
.
Othe
r dye
-que
nche
r com
bina
tions
are
ava
ilabl
e on
requ
est.
qp
CR
mis
cella
neo
us
Fluo
resc
ein
addi
tive
RT-F
LUO-
ADD
1 m
lUN
G (U
raci
l-N-G
lyco
syla
se)
RT-0
610-
0330
0 U
ROX
pass
ive
refe
renc
eRT
-PAR
E-03
30
0 µl
UNG
(Ura
cil-N
-Gly
cosy
lase
)RT
-061
0-15
1500
U
Reve
rse
Tran
scrip
tase
Cor
e ki
tRT
-RTC
K-03
600
RXNs
(25
µl)
Euro
Scrip
t/RNA
se in
hibi
tor m
ixRT
-012
5-ER
375
0 U
Reve
rse
Tran
scrip
tase
Cor
e ki
tRT
-RTC
K-05
1000
RXN
s (2
5 µl
)
qp
CR
Inte
rnal
po
siti
ve C
ont
rol
Inte
rnal
Pos
itive
Con
trol Y
akim
a Ye
llow
**
- TAM
RART
-IPCY
-T02
200
RXNs
(50
µl)
Inte
rnal
Pos
itive
Con
trol Y
akim
a Ye
llow
**
- BH
QIRT
-IPCY
-B02
200
RXNs
(50
µl)
* Fo
r all
One-
Step
RT
kits
** E
quiv
alen
t to
VIC ®
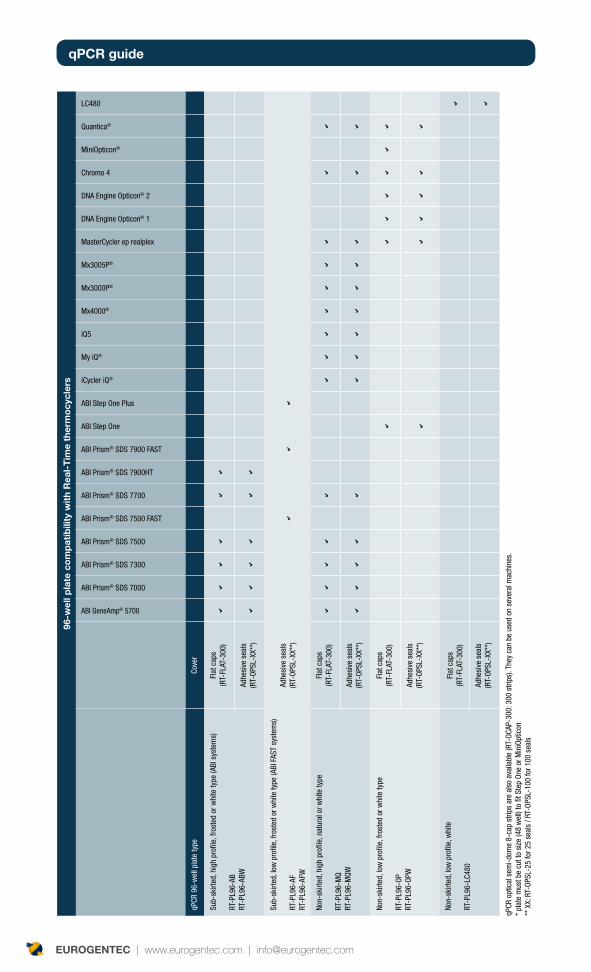
qpCR guide
EUROGENTEC | www.eurogentec.com | [email protected]
96-w
ell p
late
co
mp
atib
ility
wit
h R
eal-
Tim
e th
erm
ocy
cler
s
ABI GeneAmp® 5700
ABI Prism® SDS 7000
ABI Prism® SDS 7300
ABI Prism® SDS 7500
ABI Prism® SDS 7500 FAST
ABI Prism® SDS 7700
ABI Prism® SDS 7900HT
ABI Prism® SDS 7900 FAST
ABI Step One
ABI Step One Plus
iCycler iQ®
My iQ®
iQ5
Mx4000®
Mx3000P®
Mx3005P®
MasterCycler ep realplex
DNA Engine Opticon® 1
DNA Engine Opticon® 2
Chromo 4
MiniOpticon®
Quantica®
LC480
qPCR
96-
wel
l pla
te ty
peCo
ver
Sub-
skirt
ed, h
igh
profi
le, f
rost
ed o
r whi
te ty
pe (A
BI s
yste
ms)
RT-P
L96-
ABRT
-PL9
6-AB
W
Flat
cap
s (R
T-FL
AT-3
00)
aa
aa
aa
Adhe
sive
sea
ls(R
T-OP
SL-X
X**)
aa
aa
aa
Sub-
skirt
ed, l
ow p
rofil
e, fr
oste
d or
whi
te ty
pe (A
BI F
AST
syst
ems)
RT-P
L96-
AF
RT-P
L96-
AFW
Adhe
sive
sea
ls(R
T-OP
SL-X
X**)
aa
a
Non-
skirt
ed, h
igh
profi
le, n
atur
al o
r whi
te ty
pe
RT-P
L96-
MQ
RT-P
L96-
MQW
Flat
cap
s (R
T-FL
AT-3
00)
aa
aa
aa
aa
aa
aa
aa
Adhe
sive
sea
ls(R
T-OP
SL-X
X**)
aa
aa
aa
aa
aa
aa
aa
Non-
skirt
ed, l
ow p
rofil
e, fr
oste
d or
whi
te ty
pe
RT-P
L96-
OPRT
-PL9
6-OP
W
Flat
cap
s (R
T-FL
AT-3
00)
aa
aa
aa
a
Adhe
sive
sea
ls(R
T-OP
SL-X
X**)
aa
aa
aa
Non-
skirt
ed, l
ow p
rofil
e, w
hite
RT-P
L96-
LC48
0
Flat
cap
s (R
T-FL
AT-3
00)
a
Adhe
sive
sea
ls(R
T-OP
SL-X
X**)
a
qPCR
opt
ical
sem
i-dom
e 8-
cap
strip
s ar
e al
so a
vaila
ble
(RT-
OCAP
-300
: 300
stri
ps).
They
can
be
used
on
seve
ral m
achi
nes.
* pl
ate
mus
t be
cut t
o si
ze (4
8 w
ell)
to fi
t Ste
p On
e or
Min
iOpt
icon
** X
X: R
T-OP
SL-2
5 fo
r 25
seal
s / R
T-OP
SL-1
00 fo
r 100
sea
ls
63
EUROGENTEC | www.eurogentec.com | [email protected]
primers and probesSince 1987, Eurogentec has been committed to providing oligonucleotides of the highest quality matching all research needs. Our oligonucleotide synthesis service offers custom synthesis in large variety of scales with a wide range of modifications (FAM, DragonFly Orange®, Yakima Yellow®, TAMRA, BHQ, Deep Dark Quencher...) and purification levels:
Unmodified and Modified Primer Pairs•
Double-Dye Probes•
LNA• ® Double-Dye Probes
Molecular Beacons•
Standard and Duplex Scorpions• ®
LC Hybridization Probes•
Plexor Primer Pairs•
Eurogentec know-how currently meets the satisfaction of more than 35 000 users worldwide.
And if you became the next Eurogentec’s customer for PCR and qPCR oligonucleotides... If you need help with the design of your oligonucleotides, information about prices and delivery estimation or any other question, please contact our Customer HelpDesk, staffed by qualified and experienced scientists in Molecular Biology and Chemistry at [email protected].
qpCR guide
EUROGENTEC | www.eurogentec.com | [email protected]
REfERENCEs
ABOU-BACAR A., PFAFF A.W., GEORGES S., LETSHER-BRU V., FILISETTI D., VILLARD O., ANTONI E., KLEIN J.P., CONDOLFI E., “Role of NK cells and gamma interferon in transplacental passage of toxoplasma gondii in mouse model of primary infection”, Infection and Immunity, Vol.72 (3), 1397-1401, 2004
AFONINA I., ANKOUDINOVA I., MILLS A., LOKHOV S., HUYNH P., MAHONEY W., “Primers with 5’ flaps improve real-time PCR”, Biotechniques, Vol.43, 770-774, 2007.
BUSTIN S., “Absolute quantification of mRNA using Real-Time reverse transcriptin polymerase chain reaction assays”, Journal of Molecular Endocrinology, Vol.25, p.169-193, 2000
BUSTIN S., “Quantification of mRNA using Real-Time reverse transcription PCR (RT-PCR); trends and problems”, Journal of Molecular Endocrinology, 29, 23-39, 2002
COOK NL., VINK R., DONKIN JJ., VAN DEN HEUVEL C., “Validation of reference genes for normalization of real-time quantitative RT-PCR data in traumatic brain injury.”, J Neurosci Res., 2008.
ERALI M., VOELKERDING KV., WITTWER CT., “High resolution melting applications for clinical laboratory medicine.”, Exp Mol Pathol. ,85(1):50-8, 2008.
FLEIGE S. and PFAFFL MW., “RNA integrity and the effect on the real-time qRT-PCR performance”, Mol Aspects Med. 27(2-3): 126-139, 2006
FREEMAN W.M., WALKER S.J., VRANA K.E., “Quantitative Rt-PCR:pitfalls and potential”, Biotechniques, Vol.112 (22), 124-125, 1999
HALFORD W.P., “The essential prerequisites for quantitative RT-PCR: pitfalls and potential”, Nature Biotechnology, Vol.17 (19), 835, 1999
HERNANDEZ M., PLA M., ESTEVE T., PRAT S., PUIDOMENECH P. and FERRANDO A., “A specific real-time quantitative PCR detection system for event MON810 in Maize YieldGard® based on the 3’-transgene integration sequence”, Transgenic Research, Vol.12, 179-189, 2003
HOLLAND P., ABRAMSON R.D., WATSON R. and GELLAND D.H., “Detection of specific polymerase chain reaction product by utilizing the 5’-3’ exonuclease activity of thermos aquatus.”, Proc. Natl, Acad, Sci. USA, Vol.88, 7276-7280, 1991
HOOGEWIJS D., HOUTHOOFD K., MATTHIJSSENS F., VANDESOMPELE J., VANFLETEREN JR., “Selection and validation of a set of reliable reference genes for quantitative sod gene expression analysis in C. elegans.”, BMC Mol Biol. 9:9, 2008
ILVANDERBROUCKE I., VANDESOMPELE J., DEPAEPE A. and MESSIAEN L., “Quantification of splice variants using Real-Time PCR”, Nucleic Acids Research, Vol.29 (13), 2001
ISHII T., SOOTOME H., YAMASHITA K., “Practical evaluation of universal conditions for four-plex quantitative PCR.”, Anal Bioanal Chem. 388(1):271-8, 2007
IVANOVA A., ROSCH N., “The structure of LNA:DNA hybrids from molecular dynamics simulations: the effect of locked nucleotides.”,
J Phys Chem A.111(38):9307-19, 2007
JU J., RUAN C., FULLER C.W., GLAZER A.A. and MATHIES R.A., ‘’Fluorescence energy transfer dye-labeled primers for DNA sequencing and Analysis’’, Proc. Natl. Acad. Sci. USA., Vol.92, 4347-4351, 1995
KARKARE S., BHATNAGAR D., “Promising nucleic acid analogs and mimics: characteristic features and applications of PNA, LNA, and morpholino.”, Appl Microbiol Biotechnol. 71(5):575-86, 2006
KUBISTA M., ANDRADE JM., BENGTSSON M., FOROOTAN A., JONAK J., LIND K., SINDELKA R., SJOBACK R., SJOGREEN B., STROMBOM L., STAHLBERG A., ZORIC N., “The real-time polymerase chain reaction”, Mol Aspects Med. 27(2-3):95-125, 2006.
LE CANN P., RANARIJAONA S., MONOEHO S., LEGYADER S., FERRE V., “Quantification of human astroviruses in sewage using real-time RT-PCR”, Res. Microbiol., Vol.155 (1), 11-15, 2003
LETERTRE C., PERELLE S., DILASSE F., ARAR K., FACH P., “Evaluation of the performance of LNA and MGB probes in 5’ nuclease assays”, Molecular and cellular probes, Vol.17 (6), 307-11, 2003
LI Y., ZHOU X., YE D., “Molecular beacons: an optimal multifunctional biological probe.”, Biochem Biophys Res Commun. 5;373(4):457-61, 2008
MASON M., PROVERO P., VAIRA A.M. and PAOLO P., ACCOTTO, “Estimating the number of integrations in transformed plants by quantitative real-time PCR”,.BMC Biotechnology, Vol.2 (20), 2002
MYAKISHEV M., KHRIPIN Y., MU S., DEAN M., ‘’High-Throughput SNP Genotyping by Allele-Specific PCR with Universal Energy-Transfer-Labeled primers’’, Genome Research, Vol.1, 163-169, 2001
MULLIS K. and FOBONA F., In methods in Enzymology, Vol.155, 335, 1987
OVERBERGH L., GIULIETTI A., VALCKS D., DECALLONNE B., BOUILLON R. and MATHIEU C. J., “The use of real-time transcriptase PCR for the quantification of Cytokine Gene Expression”, Biomol.Tech, Vol.14, 33-43, 2003
PATTYN F., ROBBRECHT P., DE PAEPE F., SPELEMAN F., VANDESOMPELE J., « RTPrimersDB : the real-time PCR primer and probe database, major update 2006”. Nucleic Acids Res 34, D684-8, 2006

65
EUROGENTEC | www.eurogentec.com | [email protected]
SCHMITTGEN TD., LEE E.J., JIANG J., SARKAR A., YANG L., ELTON T.S., CHEN C., “Real-time PCR quantification of precursor and matire microRNA.” Methods 44, 31-8, 2008
SCHMITTGEN TD., LIVAK KJ., “Analyzing real-time PCR data by the comparative C(T) method.” Nat Protoc. 3(6):1101-8, 2008
SCIPIONI A., MAUROY A., ZIANT D., SAEGERMAN C., THIRY E., “A SYBR Green RT-PCR assay in single tube to detect human and bovine noroviruses and control for inhibition.”, Virol J. 5(1):94, 2008
SELLARS MJ., VUOCOLO T., LEETON LA., COMAN GJ., DEGNAN BM., PRESTON NP., “Real-time RT-PCR quantification of Kuruma shrimp transcripts: a comparison of relative and absolute quantification procedures.”, J Biotechnol. 129(3):391-9, 2007
SOLINAS A., BROWN L.J., MXKEEN C., MELLOR J.M., NICOL J., THELWELL N., BROWN T., “Duplex Scorpions primers in SNP analysis and FRET applications”, Nucleic Acids Res, Vol.29, E96, 2001
TAKACS T., JENEY C., KOVACS L., MOZES J., BENCZIK M., SEBE A., “Molecular beacon-based real-time PCR method for detection of 15 high-risk and 5 low-risk HPV types.”, J Virol Methods.;149(1):153-162, 2008
TYAGI S., MARRAS S.A.E. and KRAMER F.R., ‘’Wavelength-Shifting Molecular Beacons’’, Nature Biotechnology, Vol.18, 1191-1196, 2000
VANDESOMPELE J., DE PRETER K., PATTYN F., POPPE B., VAN ROT N., DE PAEPE A. and SPELEMAN F., “Accurate normalization of real time quantitative RT-PCR data by geometric averaging of multiple internal control genes”, Genome Biology, Vol.3 (7), 2002
qpCR guide
EUROGENTEC | www.eurogentec.com | [email protected]
dIsClaImERs
The polymerase Chain Reaction (PCR) process is covered by patents owned Hoffmann-La Roche, Inc. use of the PCR process requires a license.
A license under U.S. Patents 4,683,202, 4,683,195 and 4,965,188 or their foreign counterparts, owned by Roche Molecular Systems, Inc. and F. Hoffmann-La Roche Ltd (Roche”), has an up-front fee component and a running-royalty component. The purchase price of this product includes limited, non-transferrable rights under the running-royalty component to use only this amount of the product to practice the Polymerase Chain Reaction (“PCR”) and related processes described in said patents solely for the research and development activities of the purchaser when this product is used in conjunction with a thermal cycler whose use is covered by the up-front fee component. Rights to the up-front fee component must be obtained by the end user in order to have a complete license. These rights under the up-front fee component may be purchased from Applied Biosystems or obtained by purchasing an Authorized Thermal Cycler. No right to perform or offer commercial services of any kind using PCR, including without limitation reporting the results of purchaser’s activities for a fee or other commercial consideration, is hereby granted by implication or estoppel. Further information on purchasing licenses to practice the PCR Process may be obtained by contacting the Director of Licensing at Applied Biosystems, 850 Lincoln Centre Drive, Foster City, California 94404 or the Licensing Department at Roche Molecular Systems, Inc., 1145 Atlantic Avenue, Alameda, California 94501.
Use of UDG employs U.S. Patents 5,035,996, 5,945,313, 5,683,896 and their foreign counterparts licensed to Eurogentec S.A. from Invitrogen Corporation.
Cyclic-substituted unsymmetrical cyanine dyes are covered by U.S. Patents 5,436,134 and 5,658,751 and licensed to Eurogentec S.A. by Molecular Probes, Inc. in the direct research field.
The use of certain fluorogenic probes in 5’ nuclease assays may be covered by U.S. Patents 5,210,015 and 5,487,972, owned by Roche Molecular Systems, Inc., and by U.S. Patent 5.538.848, owned by The Perkin-Elmer Corporation. The purchase of Eurogentec’s product does not provide a license to use this patented technology. A license must be obtained by contacting the Director of Licensing Applied Biosystems, 850 Lincoln Centre Drive, Foster City, CA 94404 or the Licensing Department at Roche Molecular Systems Inc., 1145 Atlantic Avenue, Almeda, CA 94501.
The use of Scorpions® Probes for research purposes is covered by a license to Eurogentec S.A. from DxS Ltd. No rights to perform or offer diagnostic, commercial testing or other commercial services for money or money’s worth are granted by the supply of this product. Should you wish to use this product for any other purpose not covered by this license, please contact DxS Limited at Manchester Incubator Building, 48 Grafton Street, Manchester, M13 9XX.
The use of Custom Molecular Beacon Probes employs the following patent rights licensed to Eurogentec S.A. from The Public Health Research Institute of the City of New York: [a] the claims of U.S. Patent Application Serial No. 08/439,819; [b] the claims of U.S. Patent Application Serial No. 08/990,176; and [c] all patent application claims and all patent claims, U.S. and foreign, that cover improvements in the foregoing claimed probes, kits and assays and whose subjects are inventions and discoveries that are made by The Public Health Research Institute of New York. The use of Custom Molecular Beacon Probes is limited to the field of use comprising the internal use by an end user of a product solely in assays of the end user [or in applications of the end user’s customer, if the end user is performing contract research] in scientific research and development.
The oligonucleotides probes and primers using the Yakima Yellow®‚ amidite and the Eclipse®‚ Non-Fluorescent Quencher are for research purposes only, and may not be used for commercial, clinical, diagnostic or any other use. These products or portions thereof are subject to proprietary rights of Epoch Biosciences, Inc. and are made and sold under license from Epoch Biosciences, Inc. under the patent rights WO 0142505 and other pending patent applications. There is no implied license for commercial use with respect to these products. A license must be obtained directly from Epoch Biosciences, Inc. with respect to any proposed commercial use of these products.
LNA oligonucleotides produced under license from Exiqon® A/S for research use only. Not for resale or for therapeutic use or use in humans.
Alexa Fluor® dyes are provided under license from Molecular Probes, Inc., for research use only, and are covered by U.S. Patents 5,696,157 and 6,130,101 and their foreign counterparts.
Texas Red®, Rhodamine Red™, Marina Blue®‚ dyes are provided under license from Molecular Probes, Inc., for research use only, and are covered by U.S. Patents 4,774,339; 5,132,432; 5,227,487; 5,274,113; 5,696,157; 5,798,276; 5,830,912; 5,846,737; 5,955,612; 6,162,931 and their foreign counterparts.
TRadEmaRks
ABI Prism® is a registered trademark of The Perkin-Elmer Corp. Amplifluor® is a registered trademark of Intergen Alexa®, Alexa Fluor®, Marina Blue®, SYBR®, SYBR gold® and Texas Red® are registered trademarks of Molecular Probes, Inc. Cy® and Cy®5 Direct are registered trademarks of Amersham Biosciences Corp. DNA Engine Opticon® is a registered trademark of MJ Research, Inc. Eclipse®, MGB®, MGB Eclipse® and Yakima Yellow® are registered trademarks of Epoch Biosciences, Inc. Exiqon® is a registered trademark of Exiqon A/S GeneAmp® and TaqMan® are registered trademarks of Roche Molecular Systems, Inc. GoldStar® is a registered trademark of Eurogentec S.A. HyBeacons® is a registered trademark of LGC. I-Core® and Smartcycler® are registered trademarks of Cepheid, Inc. iCycler iQ® is a registered trademark of Bio-Rad Laboratories, Inc. Mx3000p® and Mx4000® are registered trademarks of Stratagene Primer Express® is a registered trademark of Applera Corporation. Oligo® Primer Analysis Software is a registered trademark of Molecular Biology Insights Inc. Quantica® is a registered trademark of Techne, Ltd and Techne, Inc. Scorpions® is a registered trademark of DxS Ltd Uniprimer® is a registered trademark of Serologicals Royalty Company, Rotor-Gene™ is a registered trademark of Corbett Life Science.

EUROGENTEC s.a. - LIEGE Science Park - 4102 Seraing – BELGIUMRPM Liège - VAT (BE) 0427.348.346 – Tel.: + 32 (0)4 372 74 00Fax: + 32 (0)4 372 75 00 – [email protected]
Ref.:
q&q
PCR
book
let-0
708-
V2
EUROpEaN OffICEs
BELGIUM
Eurogentec Headquarters
Tel.: + 32 4 372 74 00
Fax: + 32 4 372 75 00
Eurogentec Biologics Department
Tel.: + 32 4 372 74 00
Fax: + 32 4 365 16 04
UNITED KINGDOM
Eurogentec ltd.
Tel.: + 44 1794 511 411
Fax: + 44 1794 522 417
FRANCE
Eurogentec france s.a.s.u.
Tel.: + 33 2 41 73 33 73
Fax: + 33 2 41 73 10 26
GERMANY
Eurogentec deutschland GmbH
Tel.: + 49 221 258 94 55
Fax: + 49 221 258 94 54
THE NETHERLANDS
Eurogentec Nederland b.v.
Tel.: + 31 43 352 06 98
Fax: + 31 43 354 19 65
SWITZERLAND
Eurogentec s.a., succursale de Genève
Français :
Tel.: + 32 4 372 74 00
Fax: + 32 4 372 75 00
Deutsch:
Tel.: + 49 221 258 94 55
Fax: + 49 221 258 94 54
Us OffICE
NORTH AMERICA
Eurogentec North america, Inc.
Production Site
Tel.: + 1 858 793 2661
Toll-free: + 1 877 387 6436
Fax: + 1 858 793 2666
asIaN OffICEs
JAPAN
Nippon EGT Co., ltd.
Tel.: + 81 76 411 02 77
Fax: + 81 76 452 03 99
SINGAPORE
aIT biotech, pte. ltd.
Tel.: + 65 6778 9388
+ 65 6778 6822
Fax: + 65 6778 2962