
QM Ch 5 Conf Interval
9
Milky Way has a diameter of approximately 100,000 light years. The Sun's diameter is 864938 miles (1391980 km) almost 10 times larger 109 times as big than the planet Jupiter as the Earth Confidence interval A confidence interval gives an estimated range of values, which is likely to
Transcript of QM Ch 5 Conf Interval
Milky Way has a diameter of approximately 100,000
light years.
The Sun's diameter is 864938 miles (1391980 km)
almost 10 times larger 109 times as big
than the planet Jupiter as the Earth
Confidence interval
A confidence interval gives an estimated range of values, which is likely to include an unknown population parameter, the estimated range being calculated from a given set of sample data.
Confidence intervals are usually calculated so that this percentage is 95%, but we can produce 90%, 99%, 99.9%, confidence intervals for the unknown parameter.
(This % is the confidence level)
Confidence limits are the lower and upper boundaries of a confidence interval, i.e., the values which define the range of a confidence interval.
Example: Suppose an opinion poll predicted that, if the election were
held today, the Conservative Party would win 60% of the vote.
I might attach a 95% confidence level to the interval 60%
plus or minus 3%.
That is, I think it very likely (about95% confident) that the Conservative Party would get between 57% and 63% of the total vote.
Pr (57 % < < 63 %) = 0.95
Confidence Interval of population mean
x z (1 -- )/2 * (/ n)
1. Find a 99 % Confidence Interval of population mean, given sample mean = 23.4, 0.3, n=36
Pr (a < < b) = 0.99
The confidence limits are a and b
The confidence limits are
= x z (1 -- )/2 * (/ n)

= x z (1 -- 0.99)/2 * (/ n)
= x 0.129
= (23.271, 23.529)
That is, 99% of time the population mean is likely to lie in the
interval (23.271, 23.529).
That is, Pr (23.27121 < < 23.52879) = 0.99
2. Find a ‘94 % Confidence Interval’ of population mean, given sample mean = populationvariance= 4, n=36.
Confidence Interval of difference of two population means
We take as an example the data on Strength from the Animal Research case study.
Means and Variances in Animal Research study
Condition n Mean Strength
Variance of Strength
FemalesMales
1717
5.3533.882
2.7432.985
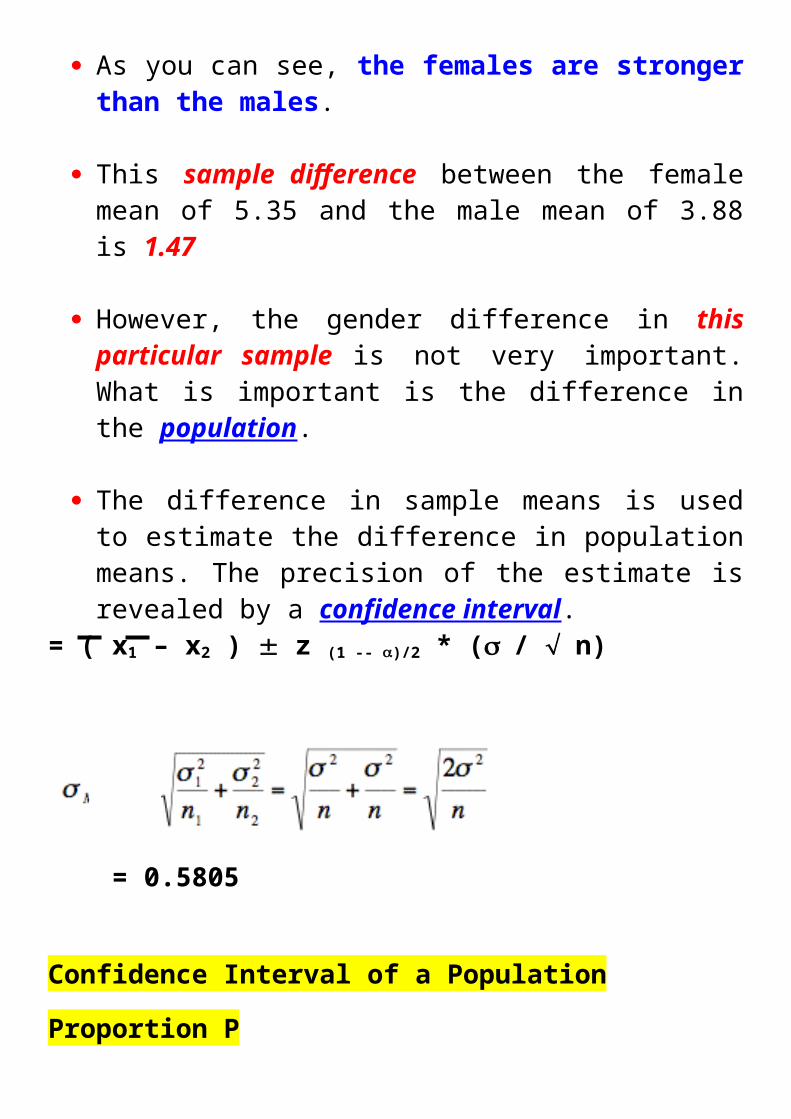
As you can see, the females are stronger than the males.
This sample difference between the female mean of 5.35 and the male mean of 3.88 is 1.47

However, the gender difference in this particular sample is not very important. What is important is the difference in the population.
The difference in sample means is used to estimate the difference in population means. The precision of the estimate is revealed by a confidence interval.
= ( x1 – x2 ) z (1 -- )/2 * (/ n)
= 0.5805
Confidence Interval of a Population Proportion P
where: 1 - is the confidence coefficient
p is the sample proportion
Consider a researcher wishing to estimate the proportion of X-ray machines that malfunction and produce excess radiation. A random sample of 40 machines is taken and 12 of the machines malfunction. The problem is to compute the 95% confidence interval on P, the proportion that malfunction in the population.
The value of p is 12/40 = 0.30
The estimated value of σp is = 0.072
Lower limit = .30 - (1.96)(.072) = 0.16
Upper limit = .30 + (1.96)(.072) = 0.44.
The confidence interval is: (0.16, 0.44)
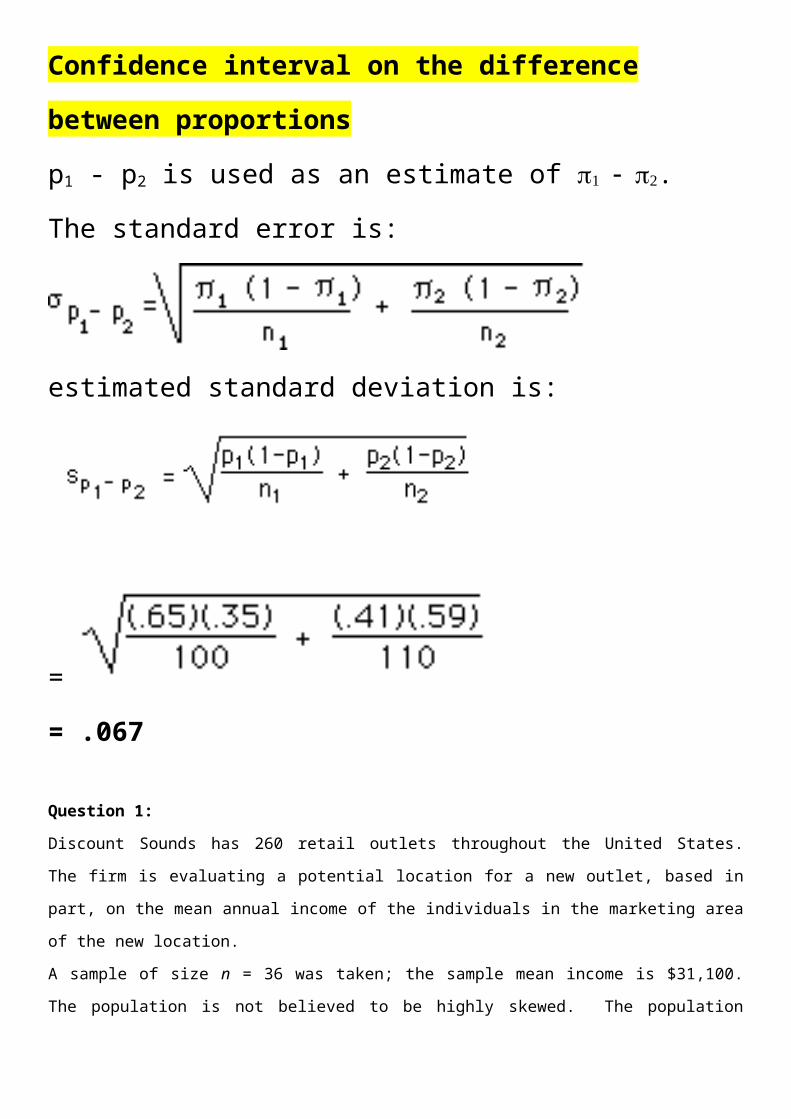
Confidence interval on the difference between proportions
p1 - p2 is used as an estimate of .
The standard error is:
estimated standard deviation is:
=
= .067
Question 1:
Discount Sounds has 260 retail outlets throughout the United States. The firm is evaluating a potential
location for a new outlet, based in part, on the mean annual income of the individuals in the marketing area
of the new location.

A sample of size n = 36 was taken; the sample mean income is $31,100. The population is not believed to
be highly skewed. The population standard deviation is estimated to be $4,500, and the confidence
coefficient to be used in the interval estimate is .95.
Question 2:
Based on sample size 50, find the ’96.4 % Confidence Interval’ of population mean, given sample mean = --
0.02, 0.0025.
Confidence Interval using Normal Tables
Question 3: Find a ‘99 % Confidence Interval’ of population mean, given sample mean = 23.4, 0.3, n=36.
Solution:Let the confidence limits be a and b.
Pr (a < < b) = 0.99
Pr xmean - a > xmean - > xmean - b = 0.99 … (A)
n n n
Now, X ~ N ()
Xmean ~ N (/ n)
(Xmean - n]~ N (0, 1)
(A) Pr xmean - a > z > xmean - b = 0.99 nn
99 % CI of population mean, = xmean z (1 -- 0.99)/2 * (/ n)
= xmean 0.129
= (23.271, 23.529)
That is, 99% of time the population mean is likely to lie in the interval
(23.271, 23.529).
That is, Pr (23.27121 < < 23.52879) = 0.99