Qlikview Synergy Xperience 2010
14
Serkan Unal Partner manager
-
Upload
nobel -
Category
Technology
-
view
1.367 -
download
2
Transcript of Qlikview Synergy Xperience 2010

Serkan Unal Partner manager

Simplifying Decisions for Everyone.
A New Kind of Software Company
• U.S.-based company, founded in 1993 in Sweden
• Highest customer success rate
• World’s fastest-growingBI vendor*
• $120 million revenue and50% growth in 2008
• 560,000 users in 12,500 customers in 95 countries
• 800+ global partners
• 530 employees across 22 offices in 12 countries
Broad Base of 12,500 Customers
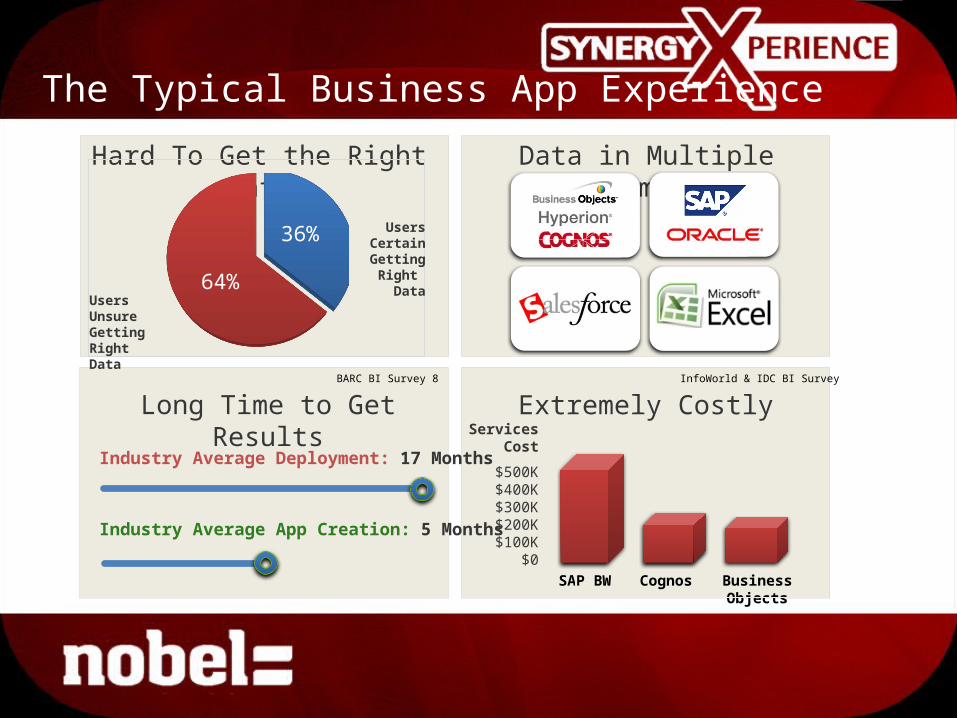
The Typical Business App Experience
Extremely Costly
Hard To Get the Right Data
Industry Average Deployment: 17 Months
Industry Average App Creation: 5 Months
ServicesCost
$500K$400K$300K$200K$100K
$0
Long Time to Get Results
SAP BW Cognos Business Objects
Data in Multiple Formats
Users Unsure Getting Right Data
64%
36% Users Certain Getting
Right Data
BARC BI Survey 8 InfoWorld & IDC BI Survey

• Anyone can use them
• Simple and intuitive
• Results in seconds
• No training
• Self-service
• Addictive
• People love using them
Today’s Consumer App Experience
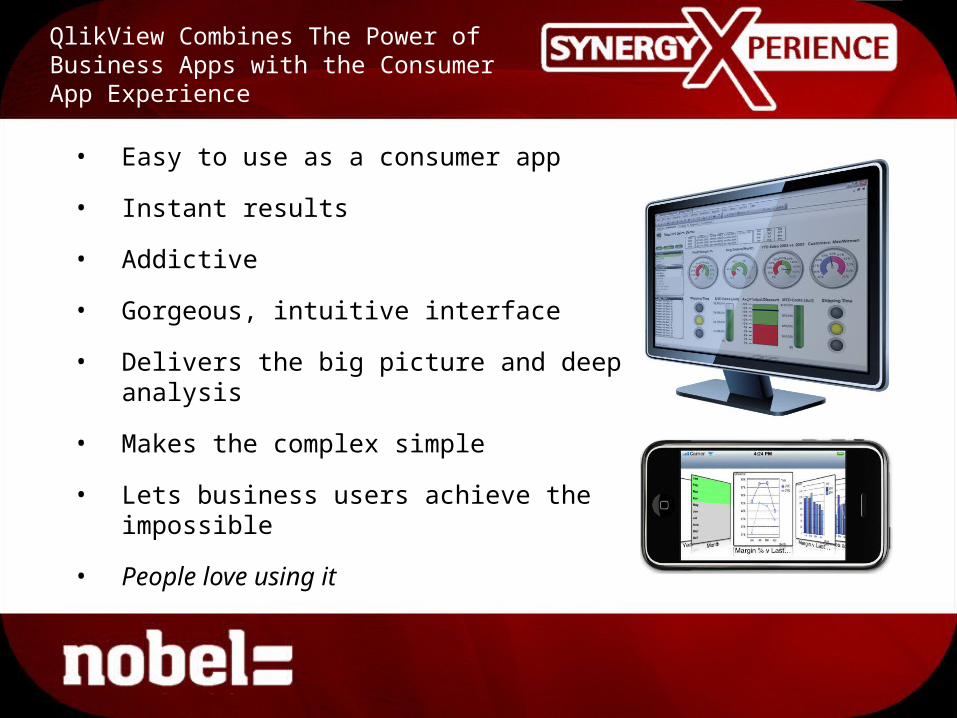
QlikView Combines The Power of Business Apps with the Consumer App Experience
• Easy to use as a consumer app
• Instant results
• Addictive
• Gorgeous, intuitive interface
• Delivers the big picture and deep analysis
• Makes the complex simple
• Lets business users achieve the impossible
• People love using it

Achieving The Impossible:The QlikView Customer Experience
Findings from IDC/QlikTech Joint Survey
BI Initiative Success and Satisfaction• 96% of customers are satisfied with QlikView
ROI (Return On Investment)• 186% Return On Investment• 6.5 month payback period
Time to Value
44% deployed QlikView in 1 Month
77% deployed QlikView in 3 Months
50% reduction in information access and analysis time
-100 0 100
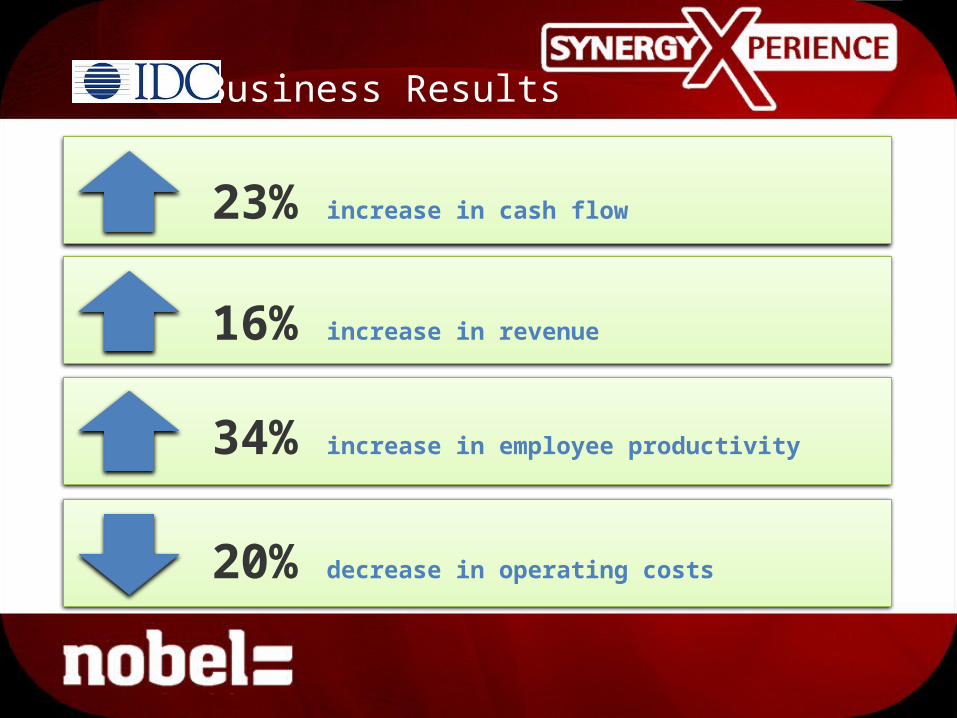
Business Results
20% decrease in operating costs
34% increase in employee productivity
16% increase in revenue
23% increase in cash flow
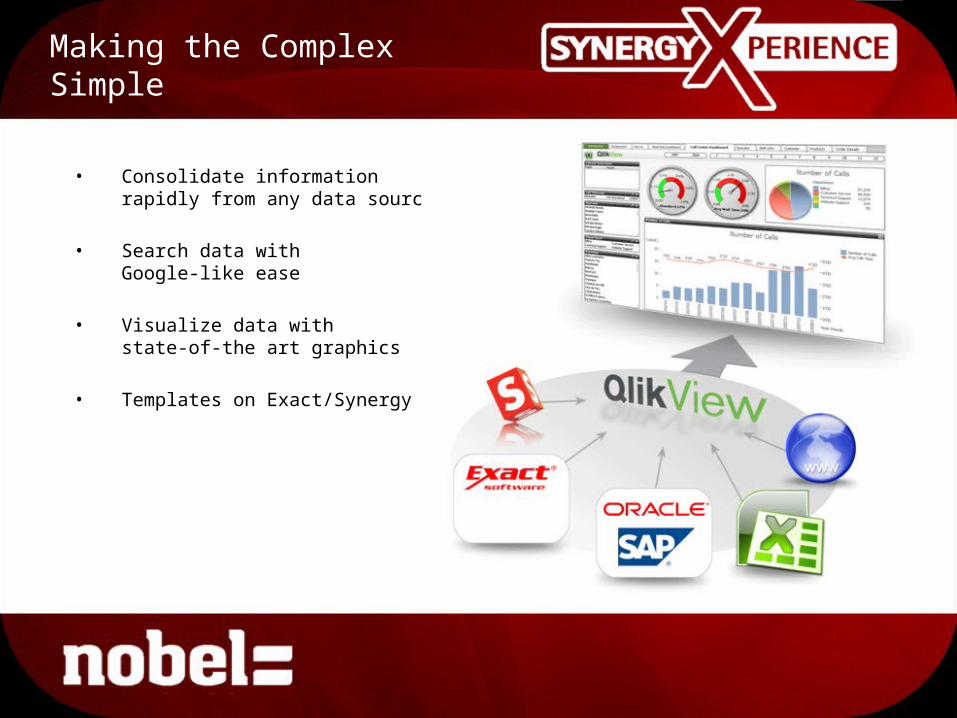
Making the Complex Simple
• Consolidate informationrapidly from any data source
• Search data withGoogle-like ease
• Visualize data withstate-of-the art graphics
• Templates on Exact/Synergy
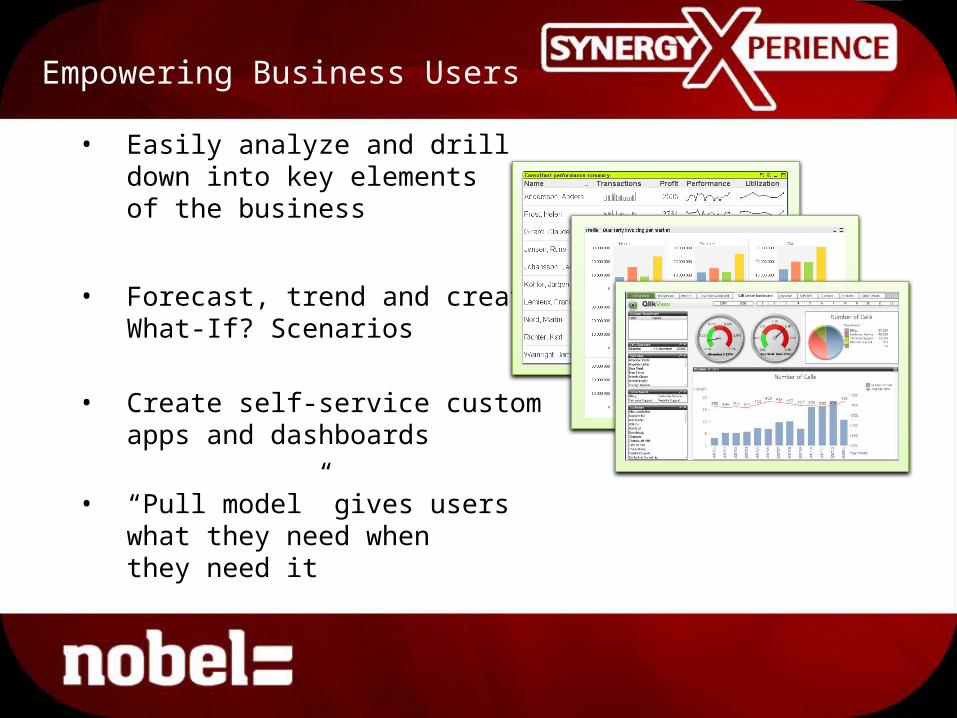
Empowering Business Users
• Easily analyze and drill down into key elementsof the business
• Forecast, trend and createWhat-If? Scenarios
• Create self-service custom apps and dashboards
• “Pull model” gives users what they need when they need it
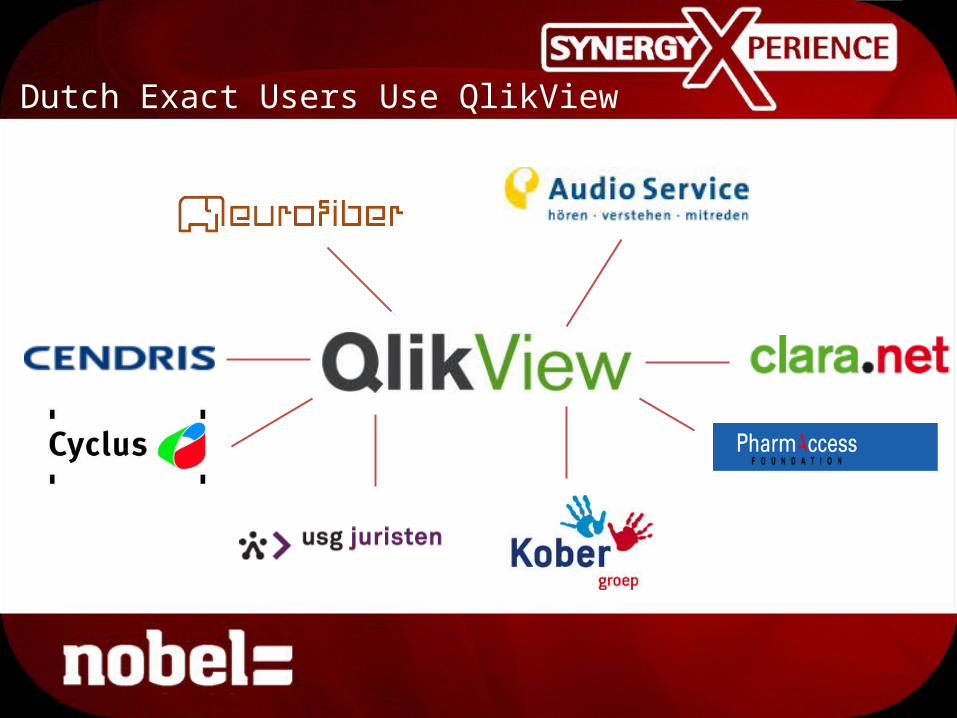
Dutch Exact Users Use QlikView
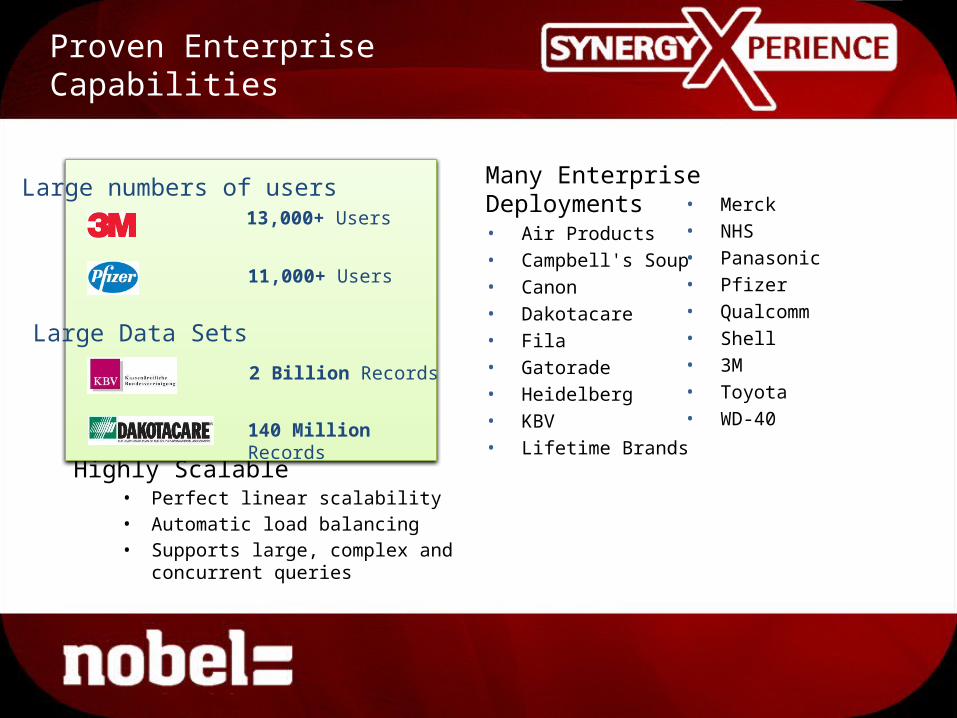
Proven Enterprise Capabilities
Highly Scalable• Perfect linear scalability• Automatic load balancing• Supports large, complex and
concurrent queries
• Merck• NHS• Panasonic• Pfizer• Qualcomm• Shell• 3M• Toyota• WD-40
13,000+ Users
11,000+ Users
2 Billion Records
140 Million Records
Large numbers of users
Large Data Sets
Many Enterprise Deployments• Air Products• Campbell's Soup• Canon• Dakotacare• Fila• Gatorade• Heidelberg• KBV• Lifetime Brands

Customer Snapshot: Royal Sens
Production of high quality labels for consumer goods
Deployed in 3 weeks, 1st application running in 3 days (seeing is believing event)Data sources: Account View, Common Sens (production)
• Production analysis• Financial & Budget analysis• Sales analysis
Results:• 25% reduction in information analysis time• Improved decisions and measuring costs• Able to make fast changes in production process
Summary
• Provides a consumer app experience using sophisticated business data
• Highest customer satisfaction: 96%
• Fastest time to value: 1-3 Months
• 30-day money back guarantee
• Seeing Is Believing—In 2-3 days, we will build any company a working QlikView application using its own data