QL2 Pricing Data & Insights TIRES · © 2017 QL2 Software, LLC All rights reserved. Proprietary and...
19
© 2017 QL2 Software, LLC All rights reserved. Proprietary and Confidential. QL2 Pricing Data & Insights TIRES Q3 2017
Transcript of QL2 Pricing Data & Insights TIRES · © 2017 QL2 Software, LLC All rights reserved. Proprietary and...

© 2017 QL2 Software, LLC All rights reserved. Proprietary and Confidential.
QL2 Pricing Data & Insights
TIRES
Q3 2017

© 2017 QL2 Software, LLC All rights reserved. Proprietary and Confidential.
QL2 Pricing Insights: Tires June 2017 QL2 delivers true competitive advantage through on-demand data extraction and analysis, producing a real-time, insightful picture of your market so you can make profitable decisions. QL2 has spent the last 15 years pioneering the market for competitive data and analysis. We provide advanced real-time data capture technology and analytical tools that create business intelligence solutions for managing the complexity of optimizing and managing pricing, revenue and other competitive data points on a real-time basis. We proudly serve global customers across the travel, retail, automotive and finance and data aggregator sectors. Our June 2017 Pricing Insights will analyze our Tire data product which includes daily pricing shops across the tire industry and over 3 years of historic pricing and product data. The following insights, trends and analysis are sourced from our daily pricing shops from 6 top tire retailers: Americas Tire, Costco, Discount Tire, Firestone Complete Auto Care (FCAC), Tire Buyer, and Tire Rack. All data is updated through May 31, 2017.

© 2017 QL2 Software, LLC All rights reserved. Proprietary and Confidential.
Opening Pricing Point In order to help our clients determine opening price points for their tires we look at the lowest price points available over time, across retailer, size and brand. Chart 1 below summarizes the lowest price point available in 2017 for the top 10 US tire sizes broken out by our six tire retailers. Note that both tire size and brand rankings are based on full year 2016 sales.
Chart 1: 2017 Lowest Price for Top Tire Sizes by Retailer – All Brands
In the first five months of 2017, Costco has the highest opening price point across all of our top tire sizes while Tirebuyer generally has the lowest opening price point. The large Costco discrepancy can be explained by product mix as they only carry tires for BFGoodrich, Bridgestone and Michelin. In order to compare similar brands we will focus only on the top 5 tire brands from 2016, Michelin, BFGoodrich, Goodyear, Continental, and Bridgestone. Chart 2 again shows the lowest price point available at each of our six retailers for the top 10 sizes, but now is filtered for only the top five brands. Costco still generally has the highest opening price point across many of the top 10 sizes while Tirerack consistently has the lowest.

© 2017 QL2 Software, LLC All rights reserved. Proprietary and Confidential.
Chart 2: 2017 Lowest Price for Top Tire Sizes by Retailer: Top 5 Brands Only
In Chart 3 we can now look at the lowest price available across the first five months of 2017 for each brand and size. This chart is inclusive of all 6 retailers. See charts 14 – 23 for detailed brand and size breakout by retailer.
Chart 3: 2017 Lowest Price for Top Tire Sizes by Brand

© 2017 QL2 Software, LLC All rights reserved. Proprietary and Confidential.
Retail Price Drivers It is essential to understand which retailers are leading the pricing decisions for tires and which are following that lead. Our data allows clients to track price changes over time to identify on a detailed level the timing and magnitude of price changes. In order to illustrate the price drivers we have sampled two models to focus on. The models selected are based on Consumer Reports Top Tire Picks for 2016.1
• Top All-Season Tires: Michelin Defender
• Top Performance All-Season Tires: Continental PureContact
Chart 4 shows the price changes in dollars week over week of the Michelin Defender in 2017 across four retailers. The graph reveals that Costco appears to lead price increases and decreases over this time with the other retailers generally raising or decreasing price in the same direction the week after Costco. It is important to note that the retailers differ in the magnitude of these changes, but follow similar directions of movement within a week or two of each other.
Chart 4: 2017 Weekly Price Changes by Retailer: Michelin Defender
1 Petersen, G. (2016, May 10). Top Pick Tires for 2016, from http://www.consumerreports.org/tires/top-pick-tires-for-2016/

© 2017 QL2 Software, LLC All rights reserved. Proprietary and Confidential.
Continuing this analysis for Continental’s PureContact model, Chart 5 graphs the week over week price changes by retailer for Americas Tire, Discount Tire and TireBuyer. In this example, we see TireBuyer leading the direction of price changes through the end of March with Americas Tire and Discount Tire appearing to react to those changes. However, starting in April TireBuyer leaves the price of PureContact unchanged throughout the month while the others continue to change price. At the end of April Americas Tire and Discount both raise price in early May and TireBuyer appears to react with a slight increase through early May.
Chart 5: 2017 Price Changes by Retailer: Continental PureContact

© 2017 QL2 Software, LLC All rights reserved. Proprietary and Confidential.
Retail Price Correlation Pricing correlation attempts to measure the relationship between the change in price between two retailers by specific model and size. Correlation values fall between 1 and -1. A value of 1 would indicate perfect correlation or that two retailers pricing move at the same magnitude and timing. Whereas a value of -1 would indicate they move in the exact opposite direction. A value of 0 would indicate no measured relationship between the pricing of two retailers. In order to measure the pricing correlation between the six retailers we looked at only the top five US Brands and Top 10 US sizes from 2016, which we previously defined. Looking at the relative price on the same product by week across each of these retailers revealed that unsurprisingly all were highly correlated with values of at least 0.9. This is not surprising in a marketplace where consumers can compare prices across retailers with relative ease and are price sensitive to the same product available at different stores. In relative terms Americas Tires and Discount Tire exhibit the highest price correlation at 0.98 while Firestone Complete Auto Care and Tire Rack exhibit the lowest at 0.91. Overall FCAC has the lowest price correlation with the other five retailers. With correlation measurement it is always important to recognize that it is not a measure of causation. Correlation only measures the similarities in price between the two retailers and does not indicate what is causing that similarity. It is a valuable measure for determining how closely the pricing is between two retailers and which retailer(s) more frequently deviate from others.
Chart 6: Retailer Price Correlation
*Heat map displays positive to perfectly positive correlation from red to green.
AMERICAS TIRE COSTCO DISCOUNT TIRE FCAC TIREBUYER TIRERACK
AMERICAS TIRE 1.00 0.98 0.98 0.90 0.97 0.97
COSTCO 0.98 1.00 0.96 0.92 0.97 0.94
DISCOUNT TIRE 0.98 0.96 1.00 0.93 0.97 0.97
FCAC 0.90 0.92 0.93 1.00 0.95 0.91
TIREBUYER 0.97 0.97 0.97 0.95 1.00 0.95
TIRERACK 0.97 0.94 0.97 0.91 0.95 1.00

© 2017 QL2 Software, LLC All rights reserved. Proprietary and Confidential.
Pricing by Tire Size Below is a summary of average price by size for January – May 2017. Top 10 sizes are based on 2016 rankings.
Chart 7: 2017 Avg. Price for Top Tire Sizes by Retailer
Chart 8: 2017 Avg. Price for Top Tire Sizes by Brand Below is a summary of 2017 average pricing for the top 10 US tire sizes across all retailers for top five US brands.

© 2017 QL2 Software, LLC All rights reserved. Proprietary and Confidential.
To this point we have focused on average and lowest price points by size across first five months of 2017. Chart 9 looks at the pricing trend over 2017 for each of the top 5 tire sizes. Chart 9 is inclusive of all brands and retailers. Overall, we see rather consistent price trends across 2017 for each of these sizes with a few notable movements in early March. We will drill deeper into the detail in order to better understand trends and average pricing for specific brands and sizes.
Chart 9: Average Price Trend by Size

© 2017 QL2 Software, LLC All rights reserved. Proprietary and Confidential.
Size Deep Dive: 205/55/16 We can dig deeper into the most popular replacement tire size from 2016, 205/55/16 in order to identify unique trends to the size. Chart 10 graphs the average price trend for only 205/55/16 tires across all brands for each of the 6 retailers. All size retailers reveal slightly upward trends across the first 5 months of 2016. Costco remains the highest in terms of average price, but as we saw earlier this is driven by the limited brands they carry. We see a cluster of average price for Americas Tire, Discount Tire and TireBuyer while Tire Rack maintains the lowest average price.
Chart 10: Average Price Trend by Size

© 2017 QL2 Software, LLC All rights reserved. Proprietary and Confidential.
We can drill down further on tire size 205/55/16 by looking at the lowest (Chart 11) and average price (Chart 12) across 2017. Michelin consistently has the highest opening price across all retailers by a fairly significant margin. Goodyear maintains the lowest opening price point across all 4 retailers who carry all 5 brands. However, on an average price basis, BFGoodRich is the lowest price across the 5 retailers who carry their tires. Michelin remains the most expensive on an average price basis, but the gap is closed significantly by Bridgestone.
Chart 11: Opening Rate by Retailer – Top 5 Brands
Chart 12: Average Rate by Retailer – Top 5 Brands

© 2017 QL2 Software, LLC All rights reserved. Proprietary and Confidential.
We can also look at the difference between the average and lowest rate over time in order to determine if that spread has remained consistent or changed over 2017. Chart 11 below again only focuses on size 205/55/16 and graphs this difference between the average rate and lowest rate by month for each retailer. Overall, we see relative consistency within each retailer but with a slightly increasing trend for Americas Tire, Discount Tire and FCAC. Costco maintains the smallest spread between average and lowest price on 205/55/16, but does exhibit a slight upward trend over time. Tire Buyer has the most interesting outlier with a large increase in spread in April.
Chart 13: Difference between Average and Lowest Rate

© 2017 QL2 Software, LLC All rights reserved. Proprietary and Confidential.
Chart 14: Pricing Distribution – All Brands

© 2017 QL2 Software, LLC All rights reserved. Proprietary and Confidential.
Appendix: Pricing for Top Brands At the beginning of this paper we looked at the opening price points across the top 5 US brands. We will now drill deeper into the detail of each in order to better understand pricing trends, average pricing and the lowest price available by retailer. Chart 15 shows the average price over time for each brand across all of the retailers we have observed.
Chart 15: 2017 Pricing Trend – Top 5 Brands
We observe Michelin remaining the highest priced on average with an upward trend across 2017. BFGoodRich generally is the lowest priced on average with an increase above Continental from late February to late April. In order to understand these trends in greater context we can drill down deeper into the breakout by size and store for each brands. Charts 16 – 25 summarize the lowest and average price points for each brand across the top 10 tire sizes and across all 6 retailers.

© 2017 QL2 Software, LLC All rights reserved. Proprietary and Confidential.
Michelin Chart 16: Opening Pricing for Top Tire Sizes
Chart 17: Average Pricing for Top Tire Sizes
© 2017 QL2 Software, LLC All rights reserved. Proprietary and Confidential.
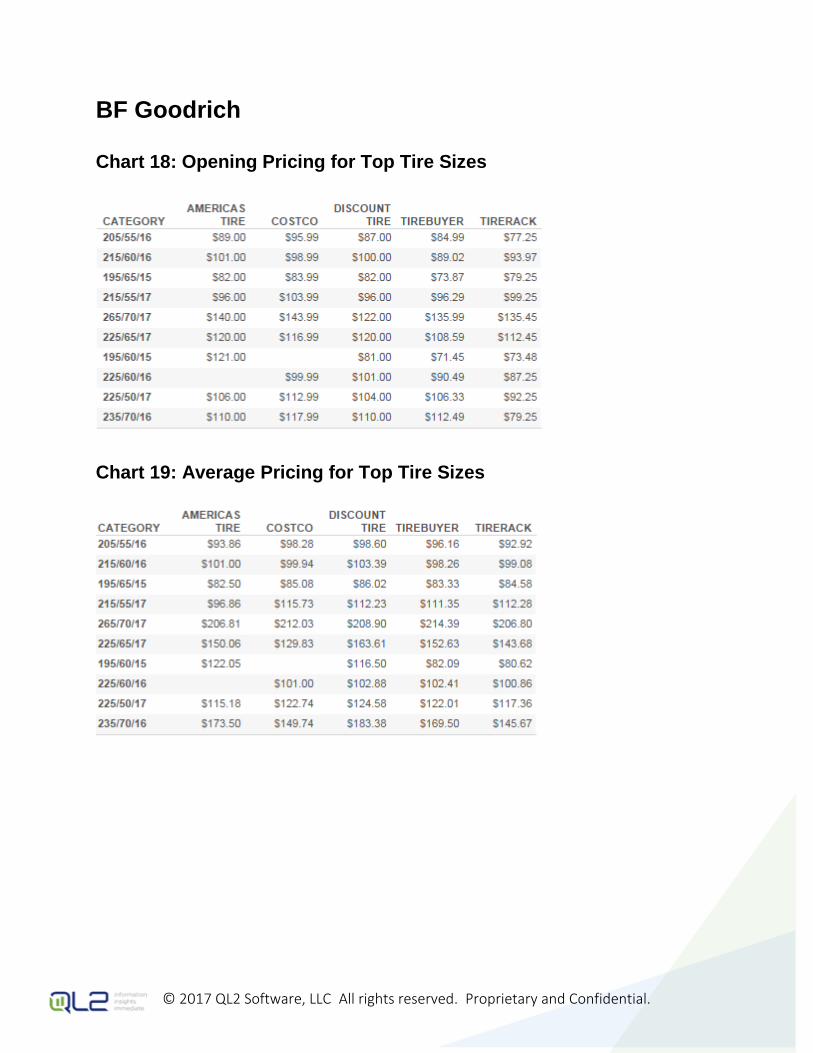
BF Goodrich Chart 18: Opening Pricing for Top Tire Sizes
Chart 19: Average Pricing for Top Tire Sizes

© 2017 QL2 Software, LLC All rights reserved. Proprietary and Confidential.
Continental Chart 20: Opening Pricing for Top Tire Sizes
Chart 21: Average Pricing for Top Tire Sizes

© 2017 QL2 Software, LLC All rights reserved. Proprietary and Confidential.
Goodyear Chart 22: Opening Pricing for Top Tire Sizes
Chart 23: Average Pricing for Top Tire Sizes

© 2017 QL2 Software, LLC All rights reserved. Proprietary and Confidential.
Bridgestone Chart 24: Opening Pricing for Top Tire Sizes
Chart 25: Average Pricing for Top Tire Sizes