QGIS Overview - OSGeo · • current coordinates of cursor (Figure 2 ). Figure 2. Status bar Let's...
16
QGIS Overview UMass FOSS v1.0 Copyright © 2007- 2008 Education and Curriculum Project, OSGEO Group Abstract This module opens a set of FOSS GIS tutorials prepared by UMass group 1. Intro to Quantum GIS Lab Setup Get the data files • We will use the following datasets for this lab: a) vector towns boundary for MA, b) vector landuse and roads data for the Town of Amherst, MA, and c) 2 meter resolution orthophoto(s). • Please download the dataset to a temporary folder on your computer from this location: http://linuxlab.sbs.umass.edu/intro-fossgis-umass/datasets/lab_intro/IntroQGISClassDemo.zip. • This data was made available from the Massachusetts GIS repository (MassGIS) and is in United States State Plane Coordinate System, Lambert Conformal Conic, NAD83, Massachusetts Mainland. • Unzip data to your working directory. You should see the following files appear: • Orthophoto • 2_117902.aux • 2_117902.tfw • 2_117902.tif • Landuse layer • lus8.dbf • lus8.prj • lus8.sbn • lus8.sbx • lus8.shp • lus8.shp.xml Intro to Foss GIS v1.0 QGIS Overview 1
Transcript of QGIS Overview - OSGeo · • current coordinates of cursor (Figure 2 ). Figure 2. Status bar Let's...

QGIS OverviewUMass FOSS
v1.0
Copyright © 2007- 2008 Education and Curriculum Project, OSGEO Group
Abstract
This module opens a set of FOSS GIS tutorials prepared by UMass group
1. Intro to Quantum GIS
Lab Setup
Get the data files
• We will use the following datasets for this lab: a) vector towns boundary for MA, b) vector landuse and roads datafor the Town of Amherst, MA, and c) 2 meter resolution orthophoto(s).
• Please download the dataset to a temporary folder on your computer from this location:http://linuxlab.sbs.umass.edu/intro-fossgis-umass/datasets/lab_intro/IntroQGISClassDemo.zip.
• This data was made available from the Massachusetts GIS repository (MassGIS) and is in United States StatePlane Coordinate System, Lambert Conformal Conic, NAD83, Massachusetts Mainland.
• Unzip data to your working directory. You should see the following files appear:
• Orthophoto
• 2_117902.aux
• 2_117902.tfw
• 2_117902.tif
• Landuse layer
• lus8.dbf
• lus8.prj
• lus8.sbn
• lus8.sbx
• lus8.shp
• lus8.shp.xml
Intro to Foss GIS v1.0 QGIS Overview 1

• lus8.shp
• Roads layer
• rd5k8.dbf
• rd5k8.shp
• rd5k8.shx
• Towns layer
• TOWNS_POLY.dbf
• TOWNS_POLY.prj
• TOWNS_POLY.sbn
• TOWNS_POLY.sbx
• TOWNS_POLY.shp
• TOWNS_POLY.shx
• TOWNS_POLY_AREACODE.dbf
Getting Started: Let's look at the Menus of QGIS
1. Start up QGIS application.
QGIS Overview
Intro to Foss GIS v1.0 QGIS Overview 2

Figure 1. Main window
There are 5 major areas of QGIS main screen (Figure 1):
1. Table of Contents (layers) on the left
2. Map Overview Area
3. Standard Menu System
4. Zoom and other tools in the button row
5. Map area at the center (blank right now)
6. Status bar (area at the bottom of the application screen)
The status bar provides information on:
• spatial extent
• scale2
QGIS Overview
Intro to Foss GIS v1.0 QGIS Overview 3

• current coordinates of cursor (Figure 2 ).
Figure 2. Status bar
Let's consider menu system and toolbars in detail.
Menu
QGIS has a standard menu system:
• File > New Project, Open Project, Save Project, Save Project As ..., Print, Export As Image, Export As Mapserverfile, Check QGIS Version
• View > Zoom to full extent, Zoom to selected features, Zoom to previous extent, Zoom to layer, Geospatialbookmarks, New Geospatial bookmark, Refresh
• Layer > Add a Vector Layer, Add a Raster Layer, Add a PostGIS Layer, Remove Layer, New Vector Layer,Toggle in Overview, Add All To Overview, Remove All From Overview, Show All Layers, Hide All Layers,Attribute Table, Properties
• Settings > Project Properties, Custom Projections
• Plugins > Plugin Manager
• Help > Contents, QGIS Home Page, QGIS SourceForge Page
Icons
Look at the Icon Menus/Toolbars. The major toolbars buttons are described below (Figures 3-6)
Figure 3. Standard toolbar
QGIS Overview
Intro to Foss GIS v1.0 QGIS Overview 4

Figure 4. Tools for adding/removing/manipulating layers
Figure 5. Toolbar (cont.)
Figure 6. Toolbar (cont.)
Using QGIS
Recall that QGIS is a tool for viewing, querying, editing, composing and publishing electronic maps. It combinesfunctionality for electronic mapping and spatial analysis. For those of you who have seen or used the ArcView 3.xproduct, it's quite similar.
1. Start QGIS (if you don't have QGIS open)
QGIS Overview
Intro to Foss GIS v1.0 QGIS Overview 5

2. The main window will be blank, this is an empty default project.
3. To set project properties click "[Settings > Project Properties]" in the main menu. The "Project Properties"window will appear.
4. Click on the "[General]" tab and set Project Title and Map Units. Call this project Class Demo:QGIS and set theMap Units to Meters.
5. To set the projection of the project, click on the projection tab and find Projected Coordinate System, LambertConformal Conic, and NAD83 Massachusetts Mainland.
6. Click "[Ok]" button to make changes. (Figure 6)
Figure 7. Setting project properties
7. First we will add a vector file.
8. Click on "[Add a Vector Layer]" button or select "Layer > Add a Vector Layer" in the main menu
9. A dialog window will appear. Please select a landuse layer (lus8.shp) from your working directory.(Figure 7).
Figure 8. Adding a vector layer
10.Now let's display the raster file.
11.Click on "[Add a Raster Layer]" button or select "Layer > Add a Raster Layer" in the main menu.
12.Select orthophoto file 2_117902.tif from your working directory and click [Open]
13.You have two overlaying layers now in QGIS (Figure 8)
QGIS Overview
Intro to Foss GIS v1.0 QGIS Overview 6

Figure 9. Project layers added
14.If you don't have the raster image in your view, then select any layer in the Table of Contents (TOC) and clickthe "Zoom to layer" menu button. The view should refresh itself and you will be able to see two data layers(Figure 9).
QGIS Overview
Intro to Foss GIS v1.0 QGIS Overview 7

Figure . Refresh screen
15.Click on the raster file (2_117902.tif) and drag it down so that it is listed in the table of contents BELOW theland use vector layer. You should see the raster image covered with the land use layer (Figure 10).
16.If the land use layer does not cover the raster image select "View > Refresh"
QGIS Overview
Intro to Foss GIS v1.0 QGIS Overview 8
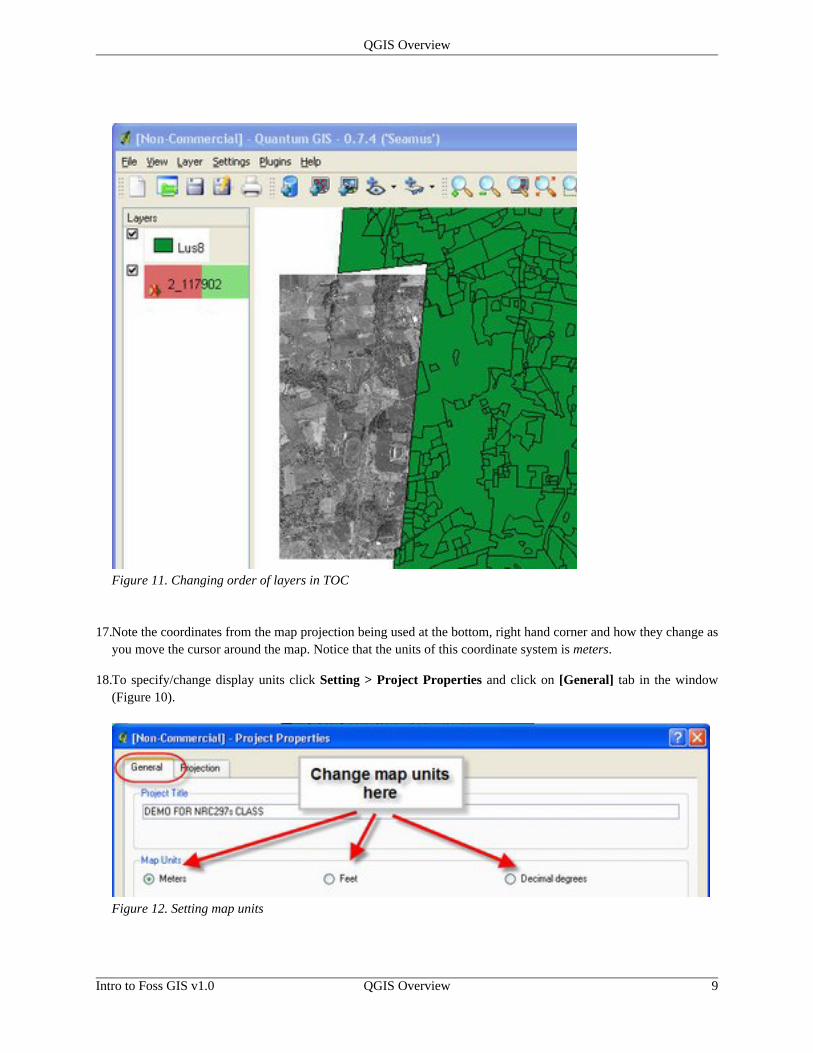
Figure 11. Changing order of layers in TOC
17.Note the coordinates from the map projection being used at the bottom, right hand corner and how they change asyou move the cursor around the map. Notice that the units of this coordinate system is meters.
18.To specify/change display units click Setting > Project Properties and click on [General] tab in the window(Figure 10).
Figure 12. Setting map units
QGIS Overview
Intro to Foss GIS v1.0 QGIS Overview 9

It's a good habit to specify these settings when you start working on the project.
Now let's consider some map tools:
Map Tools
The map tools provide functions that help you navigate around the map.
Figure 13. Map tools
Specific tools:
• Zoom in and out (the magnifying tool + and -). This tool requires you to left-click and draw a rectangle aroundthe area that you want to zoom in on. Zoom in and notice how the map scale (at status bar) changes. GIS is"scale-less" which is why it is important as to what scales input maps were at so you don't try to use the GIS atinappropriate scales!
• Zoom to layer. Select any layer in TOC and try this tool. Please, notice that map extent is set up to the selectedlayer.
• Zoom to full extent. This tool zooms in such way that all data are viewable in the map area.
Adding New Layers
• We have added one vector layer (land use) and the raster layer (orthophoto image).
• Use the "Add Vector data" button to add road data layer (Rd5k8.shp) for the Town of Amherst.
QGIS Overview
Intro to Foss GIS v1.0 QGIS Overview 10

Figure 14. Add Layer Tools
Change TOC information
Let's change the Table of Contents references:
• Right click on landuse layer entry: "'lus8p1.shp
Figure 15. Opening properties window for a layer
• Choose Properties from the menu
• Layer Properties window will appear
• Click on the General tab
QGIS Overview
Intro to Foss GIS v1.0 QGIS Overview 11
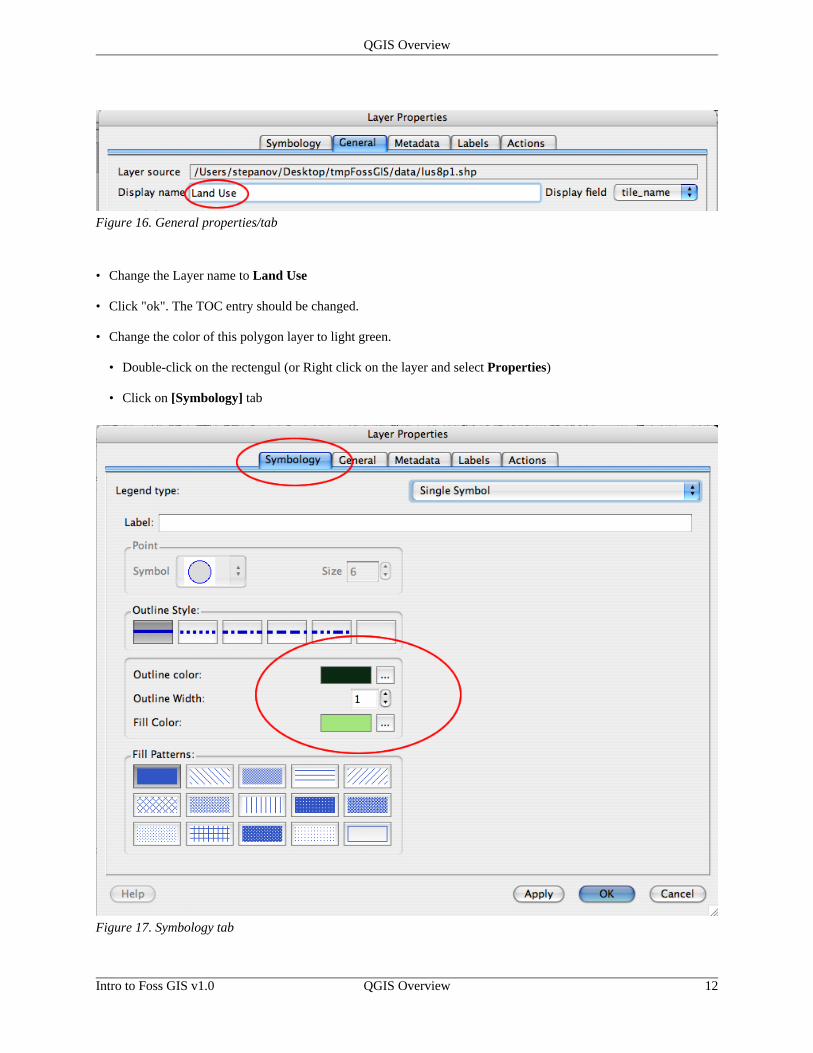
Figure 16. General properties/tab
• Change the Layer name to Land Use
• Click "ok". The TOC entry should be changed.
• Change the color of this polygon layer to light green.
• Double-click on the rectengul (or Right click on the layer and select Properties)
• Click on [Symbology] tab
Figure 17. Symbology tab
QGIS Overview
Intro to Foss GIS v1.0 QGIS Overview 12
• Change the fill and outline colors of the polygon features.
• Click [ok] and notice that color of land use layer was changed.
• Whatever layer is at the top of the TOC will be displayed on top
• Move the raster image to the top of the table of contents
• Click and hold on the 2_117902.tif image
• Drag this up to the top of the TOC
• You should see that some line and polygon features disappear because the raster grid is overlaying on thevector layer
View Attribute Data
To look at the associated attribute database for the landuse features:
• Select Land Use Layer in TOC (put the layer on the top)
• Click on "Open Attribute Table" tool button.
• Scroll to the right to view various records of data
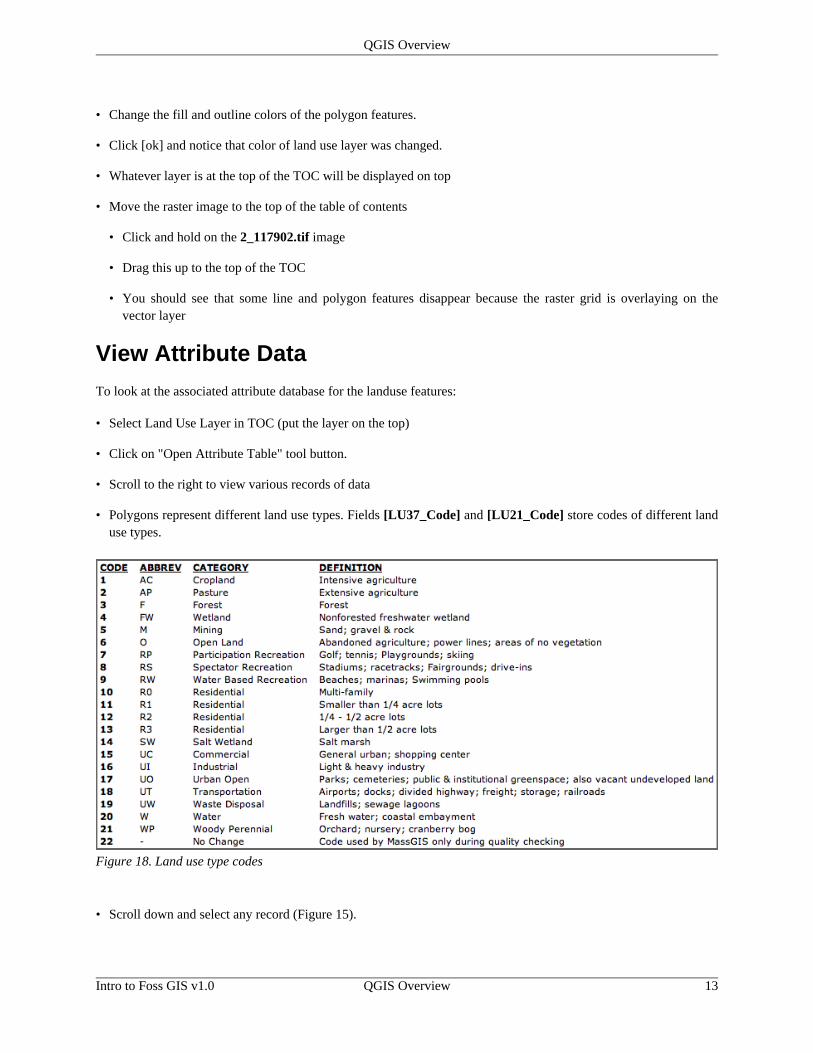
• Polygons represent different land use types. Fields [LU37_Code] and [LU21_Code] store codes of different landuse types.
Figure 18. Land use type codes
• Scroll down and select any record (Figure 15).
QGIS Overview
Intro to Foss GIS v1.0 QGIS Overview 13

Figure 19. Selecting record in attribute table
• To see the selected parcel(s) on the map, switch to the map view and click on the [Refresh] button
Figure 20. Refreshing selection set
• The selected parcels are shown in yellow color.
• Another way to see attribute information for a specific spatial feature (polygon, in our case), use [Info] tool(Figure 17).
Figure 21. Info tool
• Click on Info tool and then click on a feature (in the active layer) you are interested in.
• A window containing information for this feature will apear. Scroll down and note that it has the same fields asthe attribute table.
Measuring distances
Let's measure the distance between objects on the map. We will use Measure Tool for this operaton.
• Click on the Measure tool (it's a button with picture of ruler on it).
Figure 22. Measure tool
QGIS Overview
Intro to Foss GIS v1.0 QGIS Overview 14

• Navigate a cursor over a feature and left click with a mouse to set a starting point. Select another point and clickagain. A window showing segments' length will appear
Figure 23. Measure tool output
• The results will be in the map units you are working in. In this case, meters.
• Continue to measure or right-click to stop.
Finishing the work
Saving a map as an image:
• Click File > Export As Image
• A dialog window will apper. You will need to specify file name and location, as well as to select imageformat.JPEG and PNG are wide supported formats. So we would advise to save your map as jpeg or png files.Then you can insert them into text document or presentation.
• To save the project, click [File > Save Project (As)]. The next time you can open the project in QGIS and QGISwill restore your work status on the moment of saving. Note: Be sure to check where the file will be saved.
2. External Links• Wikipedia articles on Image Formats: http://en.wikipedia.org/wiki/Image_formats
• GDAL (Geospatial Data Abstraction Library): http://www.gdal.org [http://www.gdal.org/]
• FW tools: http://fwtools.maptools.org/
• MassGIS: http://www.mass.gov/mgis/
QGIS Overview
Intro to Foss GIS v1.0 QGIS Overview 15

3. Author AttributionMajor contributors to this curriculum include (alphabetical):
Maria Fernandez
Michael Hamel
Quentin Lewis
James Peters
Charlie Schweik
Alexander Stepanov
4. Module Licensing InformationVersion 1.0.
This exercise is licensed under a Creative Commons Attribution-ShareAlike 2.5 License[http://creativecommons.org/licenses/by-sa/2.5/] and is being developed as a future contribution to the [OpenGeospatial Foundation's educational resources effort [http://wiki.osgeo.org/index.php/Educational_Resources]]. Thismeans that users are free to copy and share this material with others.
We intend to make this available in summer 2007 to the OSGeo community. Prior to this, we ask that you contact usfirst if you would like to edit or make a new derivative of this content. Email address: cschweik AT pubpol DOTumass DOT edu).
5. Reviewed byQuentin Lewis
Retrieved from "http://linuxlab.sbs.umass.edu/intro-fossgis-umass/index.php?title=QGIS_overview"
QGIS Overview
Intro to Foss GIS v1.0 QGIS Overview 16