QBR Metric Improvement Project Update
12
QBR Metric Improvement Project Update Local Program Leadership Team November 5, 2014 Ken Franklin | Highway Division | SBS
-
Upload
cedric-greene -
Category
Documents
-
view
35 -
download
1
description
QBR Metric Improvement Project Update. Ken Franklin | Highway Division | SBS. Local Program Leadership Team November 5, 2014. Project O verview. Goals Assess reliability, validity, and business value of PDLT’s project delivery performance measures Recommend and implement improvements. - PowerPoint PPT Presentation
Transcript of QBR Metric Improvement Project Update

QBR Metric Improvement Project Update
Local Program Leadership TeamNovember 5, 2014
Ken Franklin | Highway Division | SBS

Project Overview
Goals• Assess reliability, validity, and business value
of PDLT’s project delivery performance measures
• Recommend and implement improvements
2 Phases1. Data quality of the three KPMs 2. Reliability, validity, and business
value of the seven PDLT measures
January 2015
December 2015

Assess data quality
Obtain clean data sets
Recommend improvements
Phase 1: The 3 KPMS
NTP initiated analysisPCOT initiated analysisPOB initiated analysis
NTP is the focus of my talk today

NTP Measure: How is it defined?!What’s been reported at QBR since SFY 2007 Q1• Percentage of projects
which reached NTP before their target bid-let date + 147 days.
• Actual NTP < (target bid let date + 90 window + 57 days for NTP) = “on time”
What the dashboard (and others*) state• Deadline = PS&E Accept
Date + Advt Length + FHWA Review weeks + 27 days for OPL’s activities + 57 days for contract time between bid and NTP
*Eryca McCartin June 2011 memo

Actually, it’s not!
NTP (% On Time)
Q. Why is local performance worse?
Days
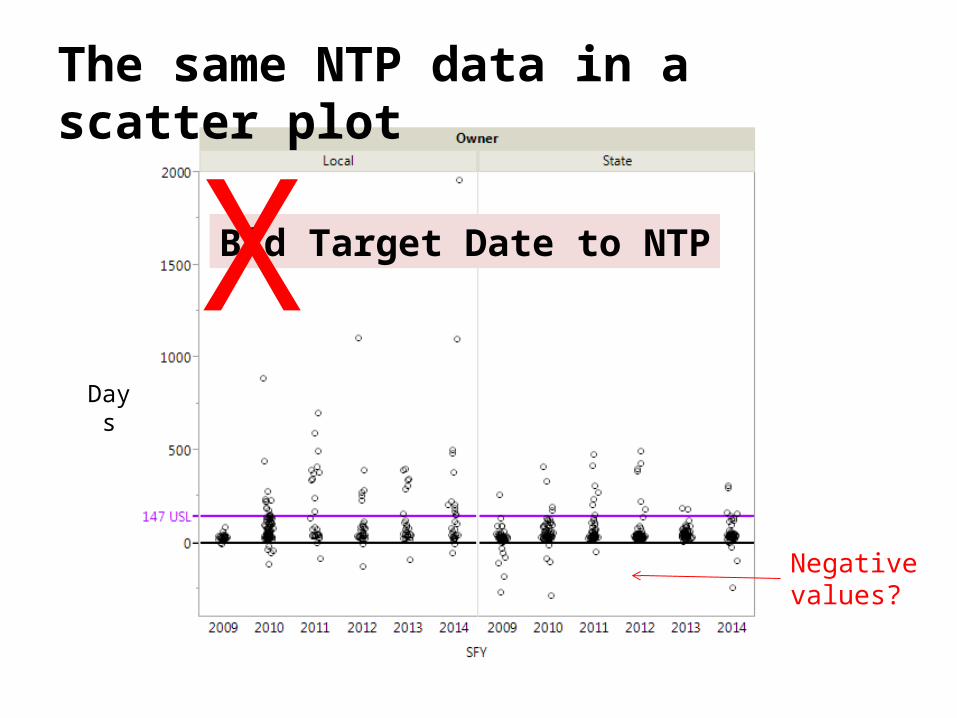
The same NTP data in a scatter plot
Bid Target Date to NTP
Negative values?
X

What we have been measuring
Bid Target Date to NTP
What we should have been measuring
PSE Acceptance to NTP

Incorrect (Bid Target Date to NTP)Corrected (PSE Acceptance to NTP)
% NTP On Time: Incorrect vs. Corrected Values
STATELOCAL
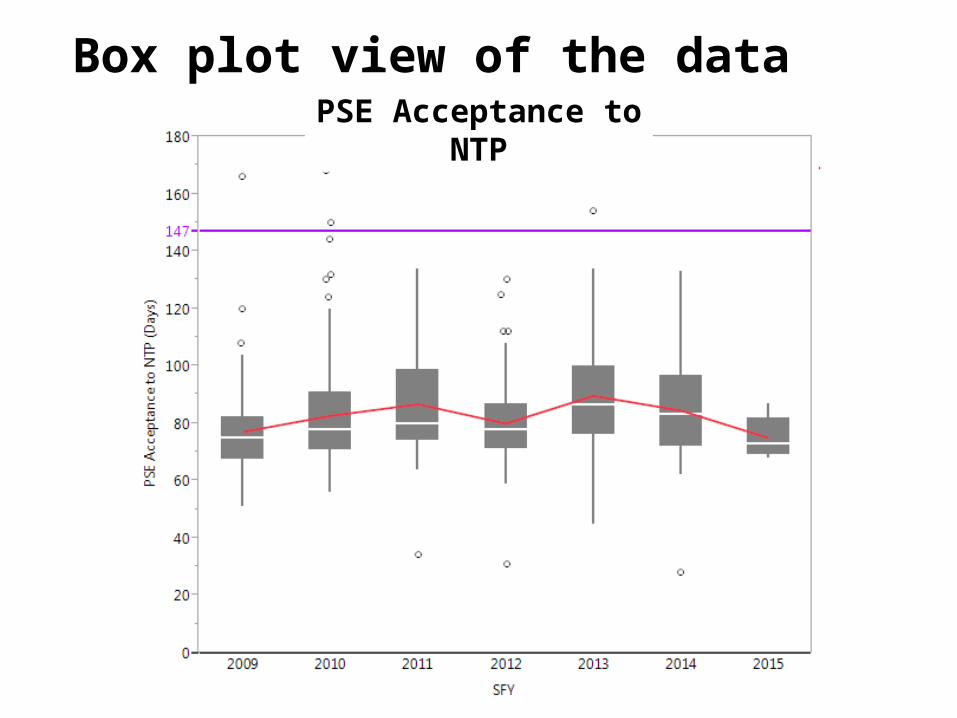
PSE Acceptance to NTP
Box plot view of the data

Median
1st Quartile
How to read a box plot
WhiskerPossible outliers
Means connected by a line
3rd Quartile

The original legislative intent of this measure?
Bid Date to NTP

It’s important to look under the hood!