QbD implementation in Generic...
36
QbD implementation in Generic Industry: Are we there yet? Inna Ben-Anat, Director, Global QbD and Product Robustness, Teva Pharmaceuticals Jan 2015
Transcript of QbD implementation in Generic...

QbD implementation in Generic Industry:
Are we there yet?
Inna Ben-Anat, Director, Global QbD and Product Robustness, Teva Pharmaceuticals
Jan 2015

Generic Industry is functioning at a Rapid Pace

The Market is very Competitive

Products Complexity is growing
The bar for Quality of Applications is raising

From our perspective: Patients deserve quality medications
Lawrence X. Yu, Ph.D., Acting Director of FDA’s Center for Drug Evaluation and Research’s Office of Pharmaceutical Science, discusses the important roles of FDA and drug companies in ensuring quality drug products.
Drug quality -- a shared responsibility
At t he end of t he day, it ’s t he pat ien t s w ho
rely on t heir m ed icat ions and w ho su f fer
t he consequences of poor qualit y; Provid ing
pat ien t s w it h subst andard or con t am inat ed
m edicat ions is sim p ly unaccep t ab le.
From our perspective: Patients deserve quality medications
(Dr. Lawrence X. Yu, Acting Director, OPS, January 5, 2015)
http://www.fda.gov/Drugs/NewsEvents/ucm428298.htm

The ultimate goal-robust supply of highest quality affordable medication for
the patient
(~ 80% prescriptions in US are generics)
Quality by Design
Enhanced Product and Process Understanding
Are We There Yet ???

Where we are today with QbD Implementation

Published FDA Case-Studies
FDA/GPhA CMC Meeting, May 2013

Updated QbD Implementation Paper Understanding Pharmaceutical Quality by Design

Product and Process Understanding

QbD for Generics: Finding the right balance between
Speed, Efficiency and Excellence
FTF, FTM Highest Quality &
Excellence
Efficiency, Resources

GPhA QbD Workshop, October 2014

Product Development Outline based on QbD
Methodology
• Characterization of the Reference Listed Drug (RLD)
• Defining Quality Target Product Profile (QTPP)
• Identification of Critical Quality Attributes (CQAs)
Design/
Definitions
• Identification and evaluation of potential risks related to Drug Product Components (DS and Excipients – stability and compatibility), Formulation and Manufacturing Process, etc.
Risk Assessment
• Screening and optimization of formulation and Critical Material Attributes (CMAs)
• Development of a robust process (DOE for high risk Critical Process Parameters, CPPs)
Risk Evaluation
• Establishment of Control Strategies and manufacture of the exhibit batches
• Continuous Monitoring and Improvement
Control/
Implementation
Prior Knowledge Management, Risk Assessment Techniques, Statistically
Designed Experimentation, Data Management are some of the tools that
will assure the desired balance between Efficiency and Excellence

QbD Implementation in Generics:
Where we are today
QbD format (content?) in almost 100% submitted applications
Follow the QbD implementation guideline as illustrated in published
IR/MR case-studies (sometimes too close? )
o Include all five QbD Elements in submission (QTPP, CQAs,
Product Design, Process Design, Control Strategy) (supported by relevant data? )
Routinely Perform Risk Assessment and utilize Risk Assessment
tools (Cause and Effect diagrams, Risk Ranking, FMEA etc.)
(proactively?)
Conduct Design of Experiments-the ultimate tool to demonstrate
enhanced product and process understanding (based on the Risk Assessment? understanding practical significance and interactions? )
Enhanced statistics utilization
o Statistically trend and assess Stability Data
o Assessing Process Capability, Data-Driven Justification of
Specifications (before CRL is asking to justify/tighten?)
subconscious
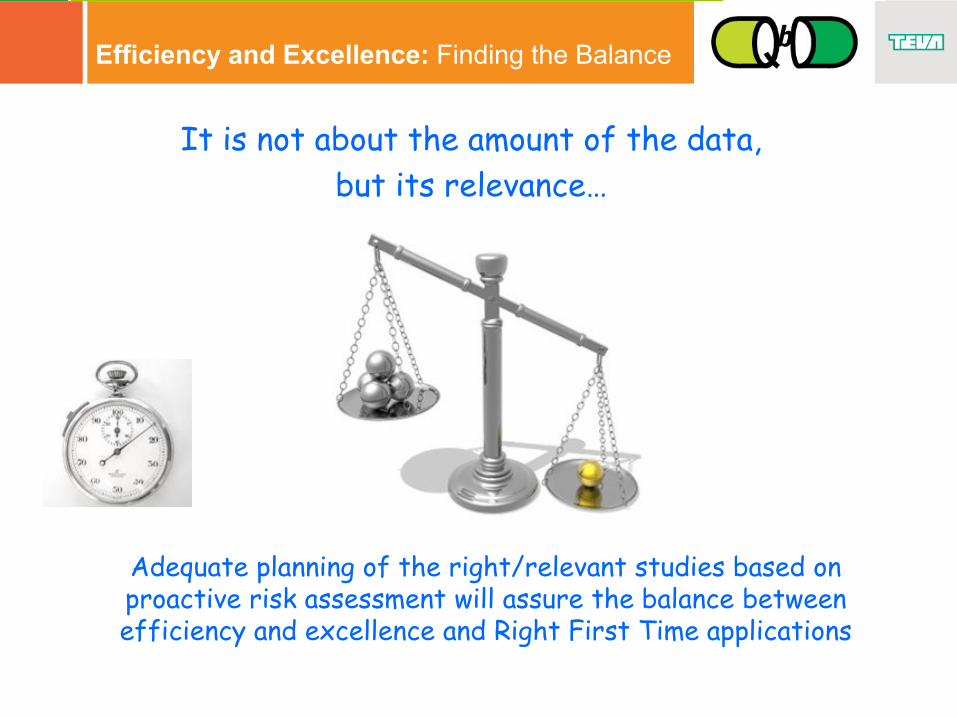
Efficiency and Excellence: Finding the Balance
It is not about the amount of the data,
but its relevance…
Adequate planning of the right/relevant studies based on proactive risk assessment will assure the balance between efficiency and excellence and Right First Time applications
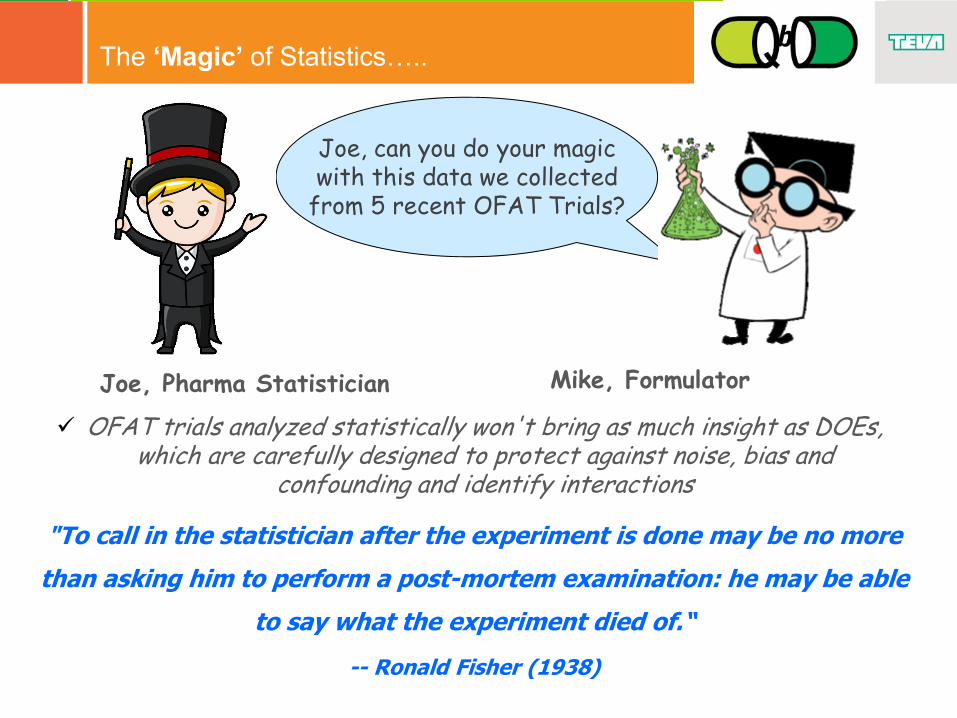
The ‘Magic’ of Statistics…..
"To call in the statistician after the experiment is done may be no more
than asking him to perform a post-mortem examination: he may be able
to say what the experiment died of.“
-- Ronald Fisher (1938)
OFAT trials analyzed statistically won't bring as much insight as DOEs, which are carefully designed to protect against noise, bias and
confounding and identify interactions
Joe, Pharma Statistician Mike, Formulator
Joe, can you do your magic with this data we collected
from 5 recent OFAT Trials?

New from the Regulator….
Supporting Regulatory Landscape
GDUFA - encourages RFT High Quality Submissions
Updated QbR - formalizes QbD milestones and format
Shift in Complete Response Letters questions ‘culture’
toward Product and Process Understanding
Future ICH Q12 –Lifecycle Management
Next

What does GDUFA mean for the Industry
• What worked in the past will not work under GDUFA!
Transformational Change!
• Increased focus on Quality: Develop robust products; submit
high quality ANDA and maintain high quality in manufacturing;
Quality will either be a differentiator or a barrier
• Requires complete visibility of the suppliers ; APIs, third party
manufacturers, testing sites, packaging sites, etc
• Higher barrier to entry in the market - building the quality into the
systems.
• Robust product & process: Implementation of Full Quality by
Design
• Ensure 100% alignment and training of all R&D and Regulatory
staff on new Guidance's and GDUFA requirements.
• Further collaboration among the network from product
identification through commercialization
Strategy
Execution
back

QbR, November 2014

QbR, November 2014
back

Example of CRL Comment
back

ICH Q12 Final Business Plan
back

How Do We (Industry) Measure Success

Defining QbD Success:
Metrics and KPIs examples
Short Term KPIs examples:
% QbD Submissions (include 5 elements outlined by FDA)
% Submissions contain Formulation/Process DOE-enhanced approach
% Submissions utilizing PAT tools-enhanced approach
Long Term metrics examples:
Success rate of scale-up, validation and launch
Overall products quality and robustness improvement
Shorter review cycle/fewer DL rounds-RFT Submission

Where we want to be…
How will we get there…

Areas of Additional Focus
PAT Implementation and application
More hands on experience with QbD application for additional dosage
forms (injectables, patches, films, etc.)
Leveraging prior knowledge efficiently: effective knowledge management
platform, historical data mining and filtering capabilities
Leverage QbD based development throughout product validation and
commercialization-lifecycle approach
Manage Risk Assessment (QRM) throughout product lifecycle
Leverage QbD-gained knowledge through CPV stage
Data collection and analysis automation

QbD doesn’t end once file is submitted
It’s a lifecycle
approach
Implementation of QbD Principles post-
submission
• Risk Assessment, DOE and Historical Data
Mining techniques utilization
• Product Robustness initiatives
• CPV (Continuous Process Verification)
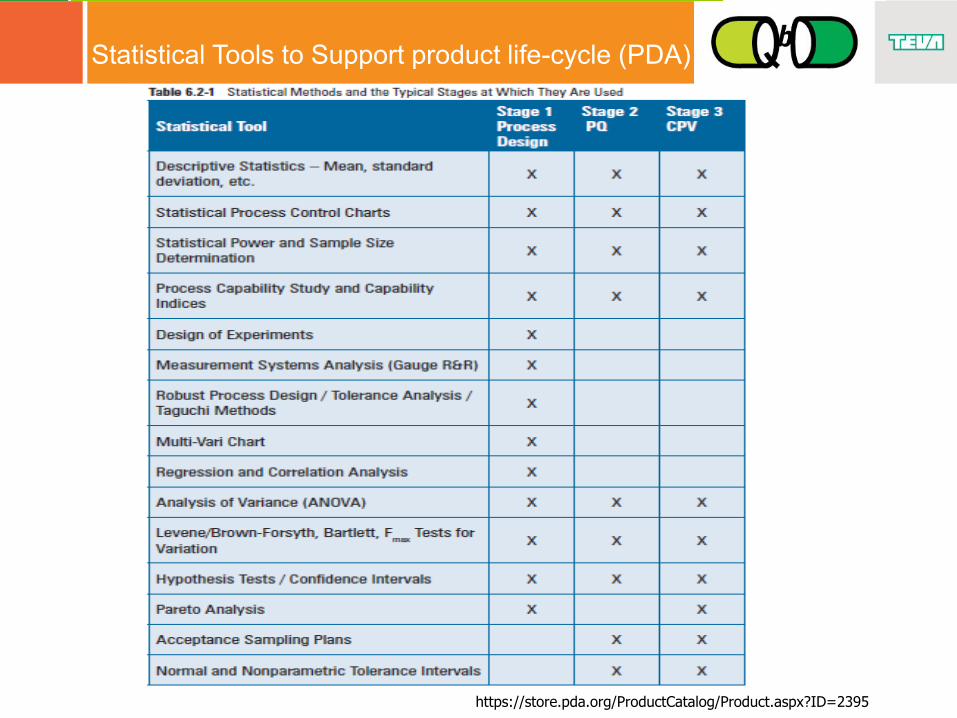
Statistical Tools to Support product life-cycle (PDA)
https://store.pda.org/ProductCatalog/Product.aspx?ID=2395

R&D Stage: Formulation/Process optimization, DOE
CMAs and CPPs are identified and their impact
on CQAs is understood; Product Robustness is
designed in and assessed with simulation tools
‘All examples are for illustration purposes only’
Variability
explained
Factors’
significance
Relationship Relationship

Submission Stage: Stability Data Assessment, 3
Submission batches
Stability Platform assures compliance with ICH
requirements and provides comprehensive overview of stability data assessment and batches poolability
‘All examples are for illustration purposes only’

Submission/Process Design Stage: Uniformity VCA
(Variance Components Analysis)
VCA platform provides enhanced uniformity and
process robustness assessment already at R&D
stages
‘All examples are for illustration purposes only’

Development/Process Design Stage: Simulation Tools
to evaluate Process Robustness at pilot scale
‘All examples are for illustration purposes only’
Distribution of the
predicted output
Predicted OOS rate
Estimated Process Variability
Estimated Analytical Variability

Continuous Process Verification (CPV)
SPC as main tool for CPV stage and continuous improvement
throughout life-cycle
‘All examples are for illustration purposes only’

Are We
There Yet?
Slow and
Steady Progress
…
Thank you! Any Questions?