
Edge QAM Overview Chris Brown, Sr. Product Manager, Motorola, Inc.
Upload
jamal-hagiCategory
view
109download
0description


Overview • What is QAM?
• Why Use QAM? • Quadrature Amplitude Modulation • Bits and Symbols • QAM Encoding and Implementation
• QAM Measurement • What Constellations Tell Us • Modulation Error Ratio (MER) • BER • FEC

Why Go Digital? • Cable and Terrestrial TV signals are going digital
– Digital Cable - Now; Terrestrial Xmit - 2006
– Standard Definition TV (SDTV)
– High Definition TV (HDTV)
• Better Picture and Sound Quality
• Cable Modems transmit and receive digital data
• Digital signals can be less susceptible to noise
• Data Compression, error detection and correction is done with digital data
• Datacasting easily multiplexed into digital signal
• Higher Data Security
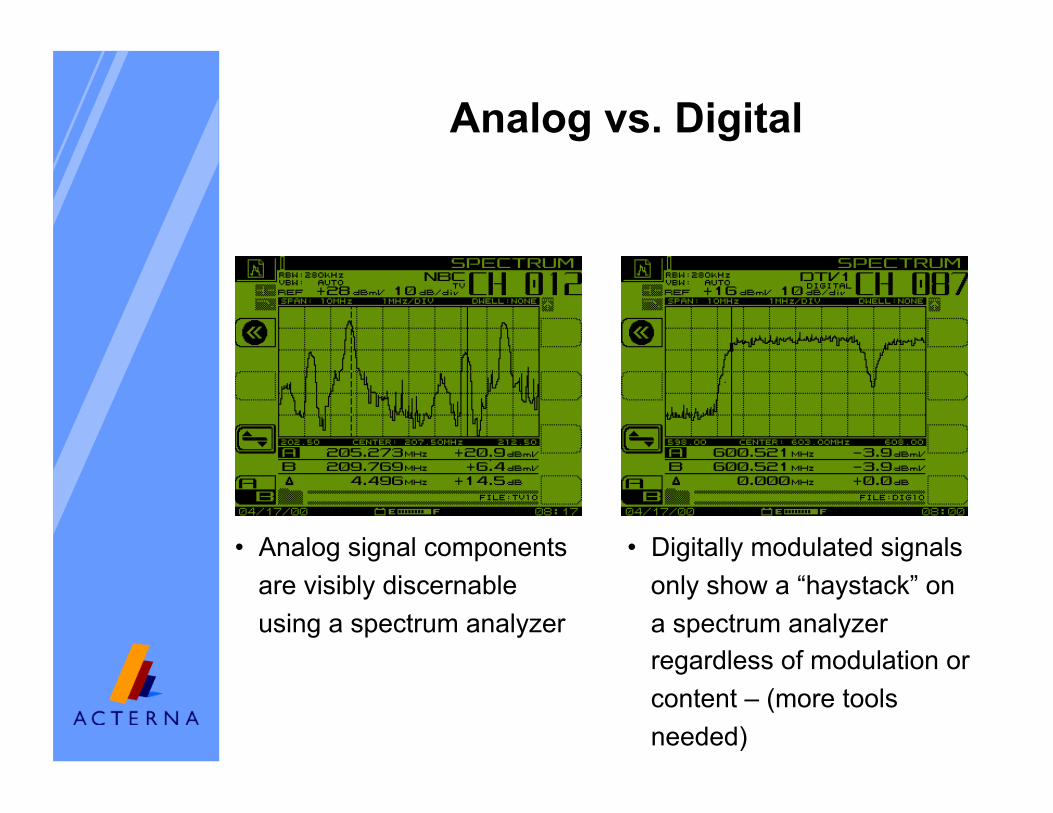
Analog vs. Digital
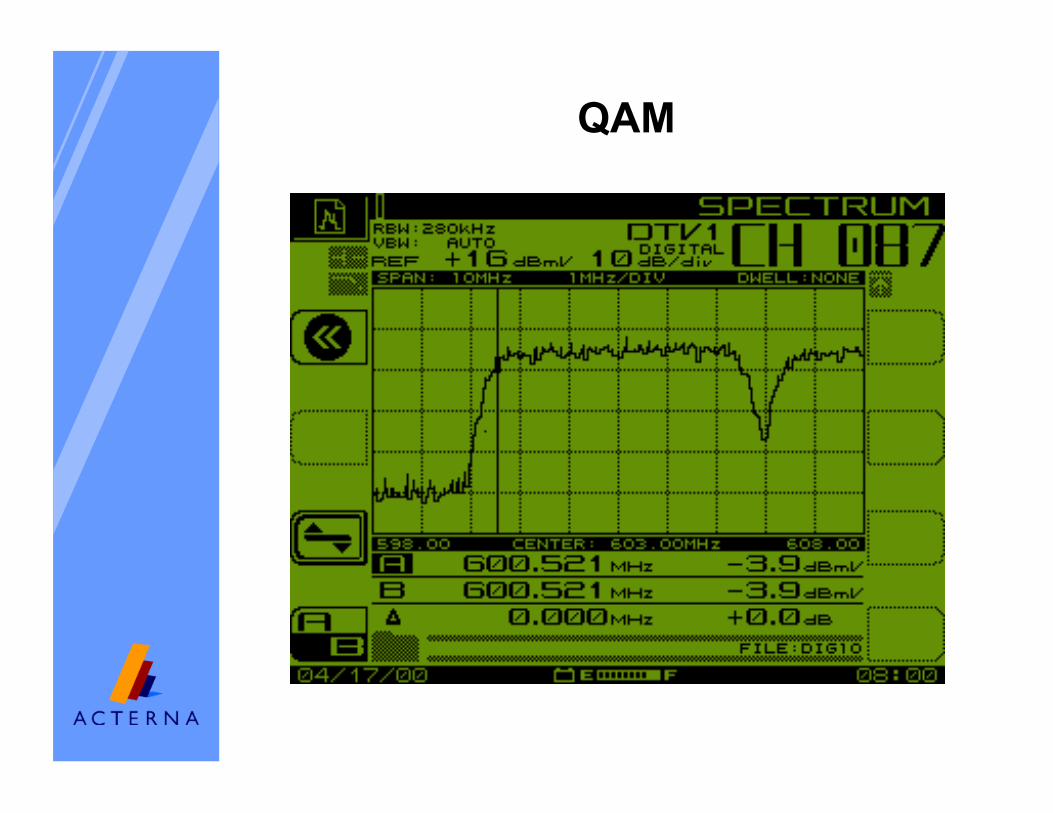
• Analog signal components are visibly discernable using a spectrum analyzer
• Digitally modulated signals only show a “haystack” on a spectrum analyzer regardless of modulation or content – (more tools needed)
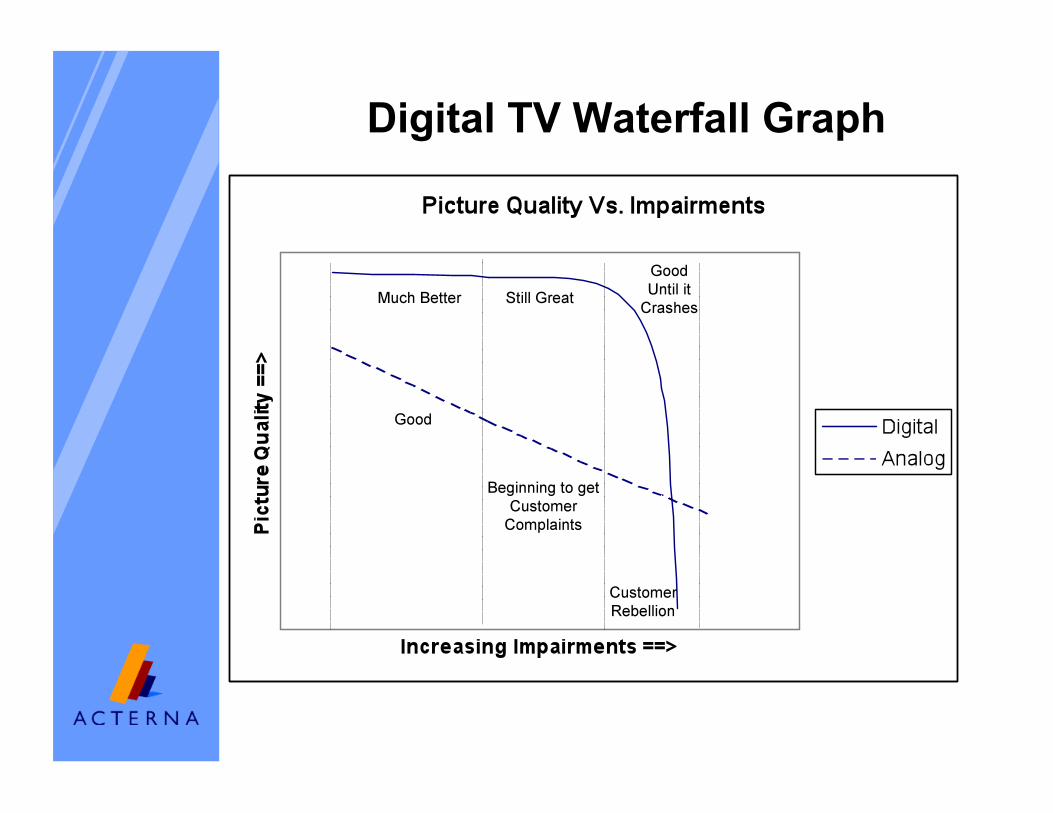
Digital TV Waterfall Graph
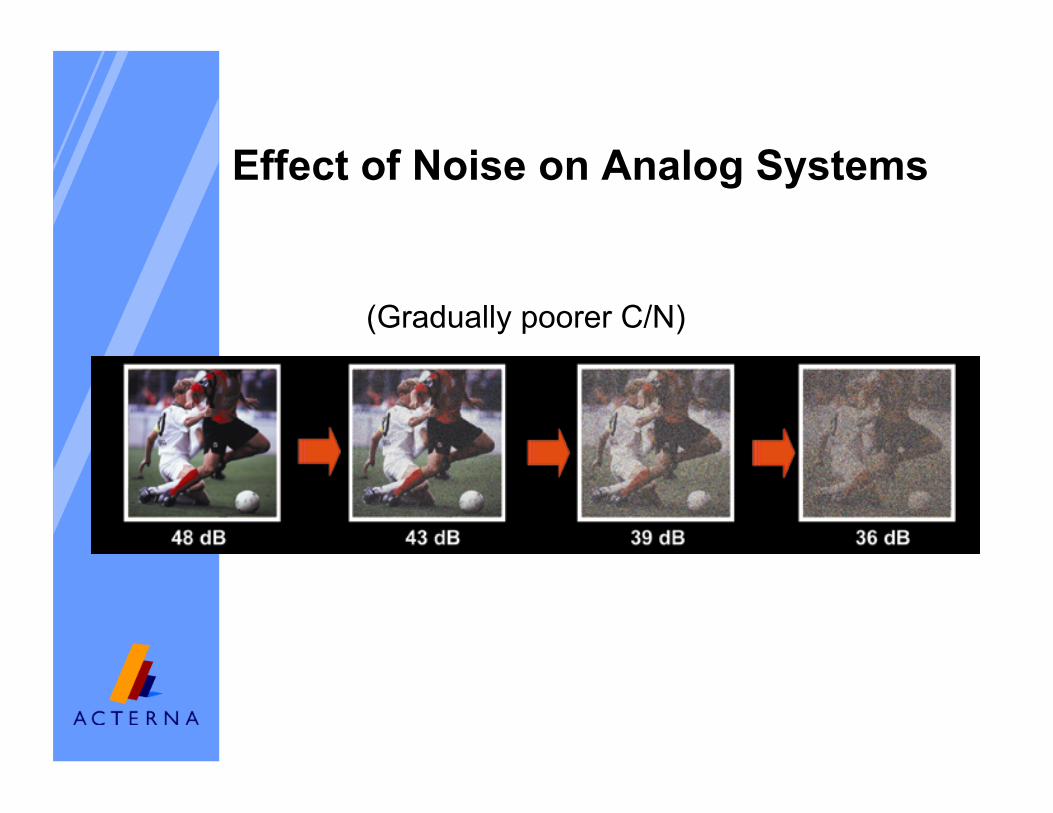
(Gradually poorer C/N)
Effect of Noise on Analog Systems
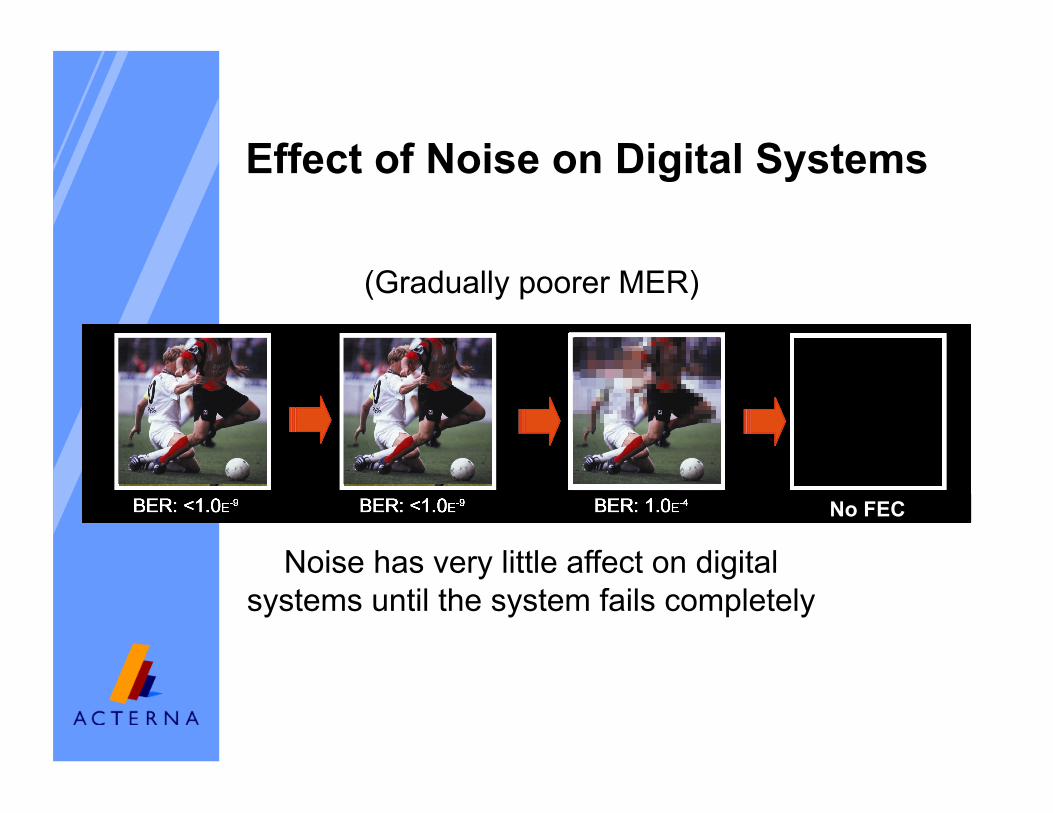
(Gradually poorer MER)
Noise has very little affect on digital systems until the system fails completely
Effect of Noise on Digital Systems
No FEC

Modulation formats in Cable Modulation Description Use Comments
AM, FM, PM Amplitude Modulation, Frequency Modulation, and Phase Modulation
Radio, CB, Cable Low spectral efficiency
PAL, NTSC Phase Alternate Line, National Television System Committee
Commercial Television and Cable
Low spectral efficiency, noise viewable by users
QPSK, BPSK, FSK
Quadrature Phase Shift Keying, Binary Phase Shift keying, Frequency Shift Keying
Cable modem return path, DVB-S, Telemetry channels
Robust in poor signal to noise
VSB Partially-suppressed-carrier Vestigial SideBand
North American broadcast digital television
Good performance in multipath conditions
QAM Quadrature Amplitude Modulation
Digital cable broadcast DVB-C, Cable modems,
Requires good signal to noise
S-CDMA Synchronous Code Division Multiple Access
DOCSIS 2.0 return path Good performance in poor signal to noise

What is QAM?
• Quadrature Amplitude Modulation – pronounced as “kwam”)
• Modulation Scheme where Phase and Amplitude are modulated to represent data
• Similar to QPSK which is robust and has been used for years (QPSK is the same as 4QAM)
• By providing different levels of amplitude and phase modulation, groups of bits can be represented as a symbol.
• Additional levels of modulation provide higher data capacity (16QAM, 64QAM, 256QAM, 1024QAM)
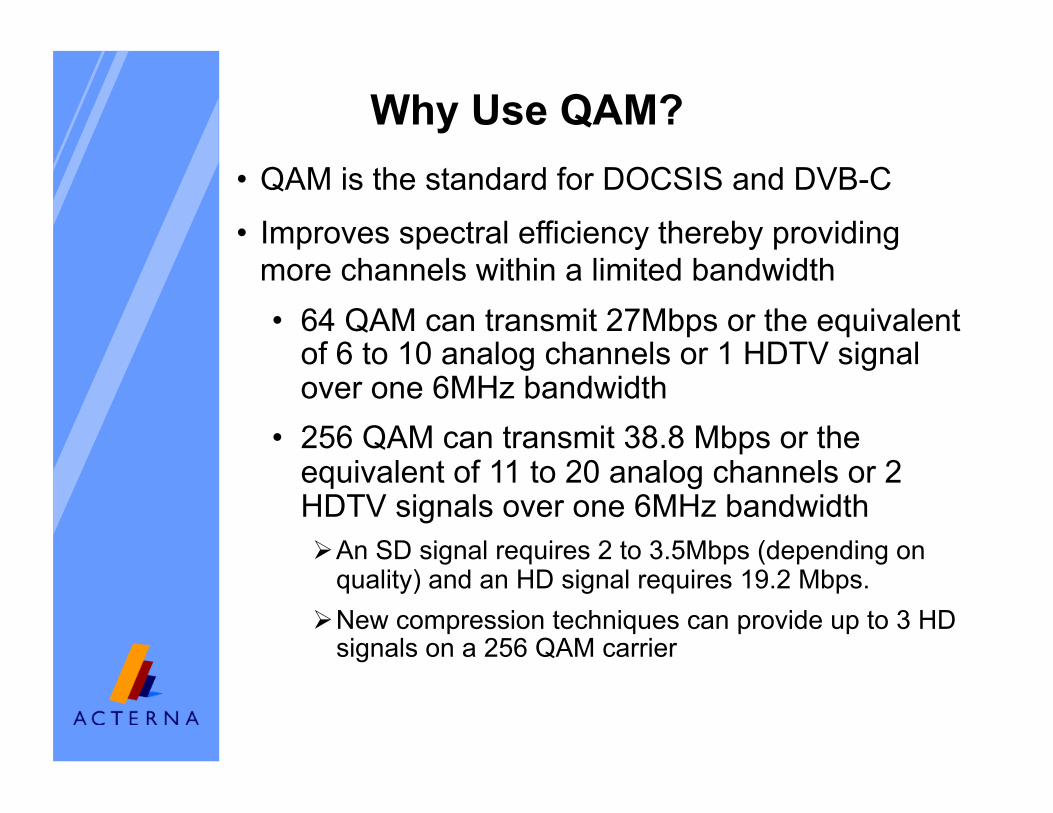
Why Use QAM? • QAM is the standard for DOCSIS and DVB-C
• Improves spectral efficiency thereby providing more channels within a limited bandwidth • 64 QAM can transmit 27Mbps or the equivalent
of 6 to 10 analog channels or 1 HDTV signal over one 6MHz bandwidth
• 256 QAM can transmit 38.8 Mbps or the equivalent of 11 to 20 analog channels or 2 HDTV signals over one 6MHz bandwidth An SD signal requires 2 to 3.5Mbps (depending on
quality) and an HD signal requires 19.2 Mbps. New compression techniques can provide up to 3 HD
signals on a 256 QAM carrier
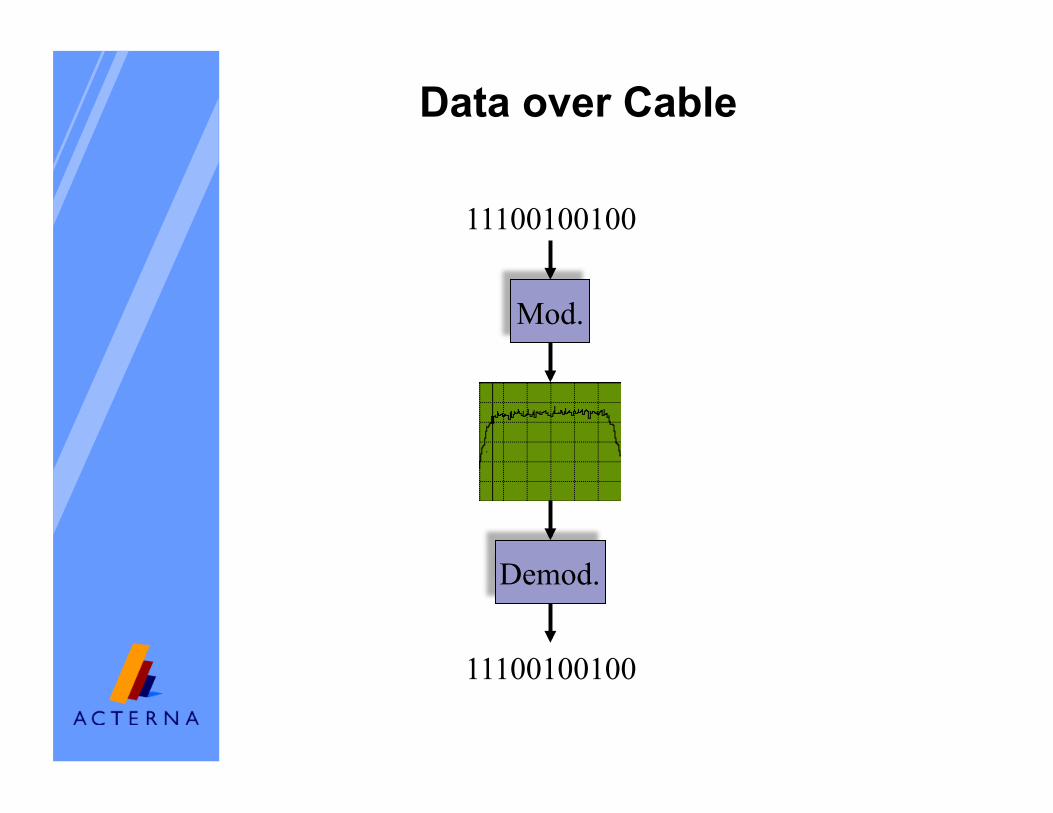
Data over Cable
Mod.
11100100100
11100100100
Demod.
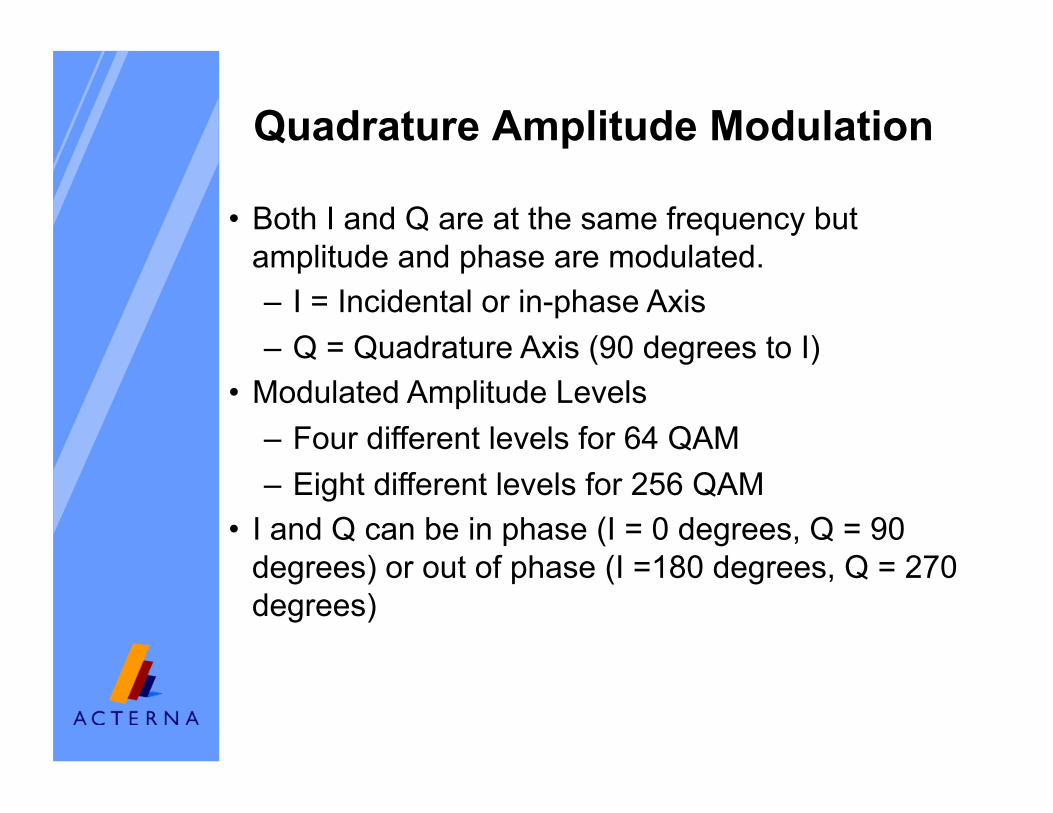
Quadrature Amplitude Modulation
• Both I and Q are at the same frequency but amplitude and phase are modulated. – I = Incidental or in-phase Axis – Q = Quadrature Axis (90 degrees to I)
• Modulated Amplitude Levels – Four different levels for 64 QAM – Eight different levels for 256 QAM
• I and Q can be in phase (I = 0 degrees, Q = 90 degrees) or out of phase (I =180 degrees, Q = 270 degrees)
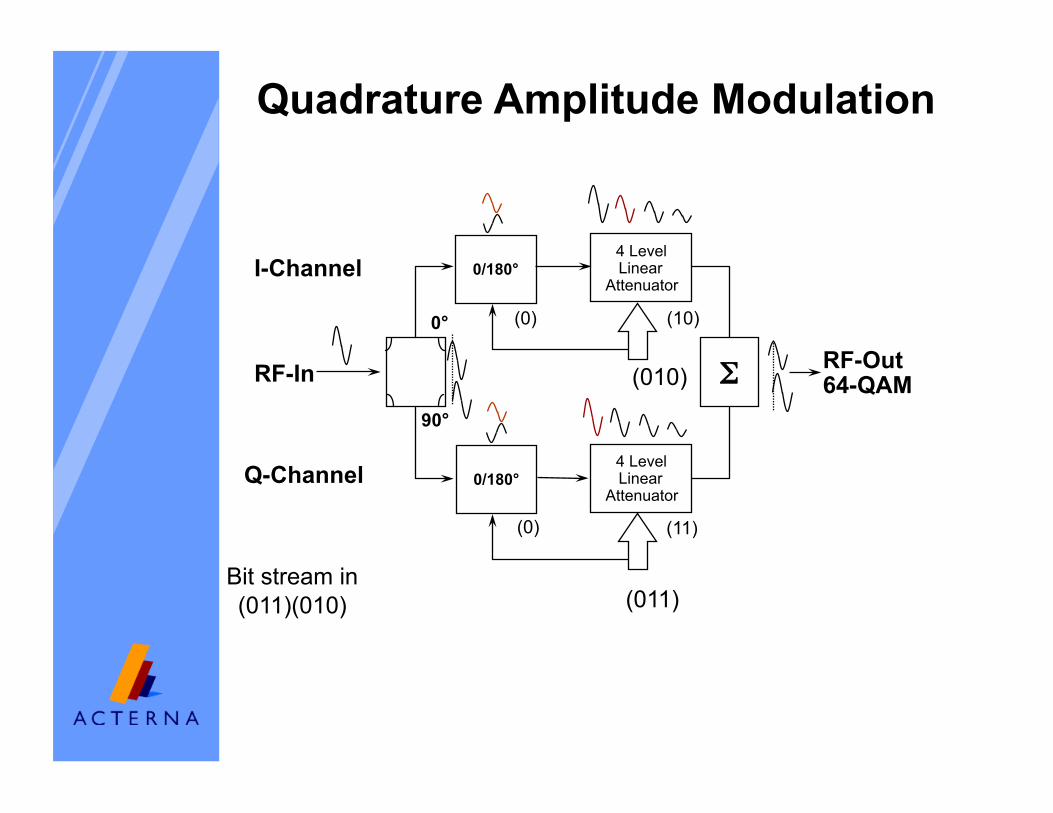
Quadrature Amplitude Modulation
RF-Out 64-QAM
4 Level Linear
Attenuator
0/180°
0/180°
Σ
I-Channel
Q-Channel
RF-In
0°
90°
(010)
(011) Bit stream in (011)(010)
(0) (10)
(0) (11)
4 Level Linear
Attenuator

64 QAM Waveforms
• I and Q are in phase or 180 degrees out of phase
• I and Q are four discrete independent levels

Carrier Amplitude Modulation
Analog Video AM Modulation Carrier Phase Shift
Carrier Amplitude Modulation
QAM Modulation
Quadrature Modulation
• Simply measuring the carrier level relative to the noise level does not take into account any phase noise that may also be present on the signal
QAM
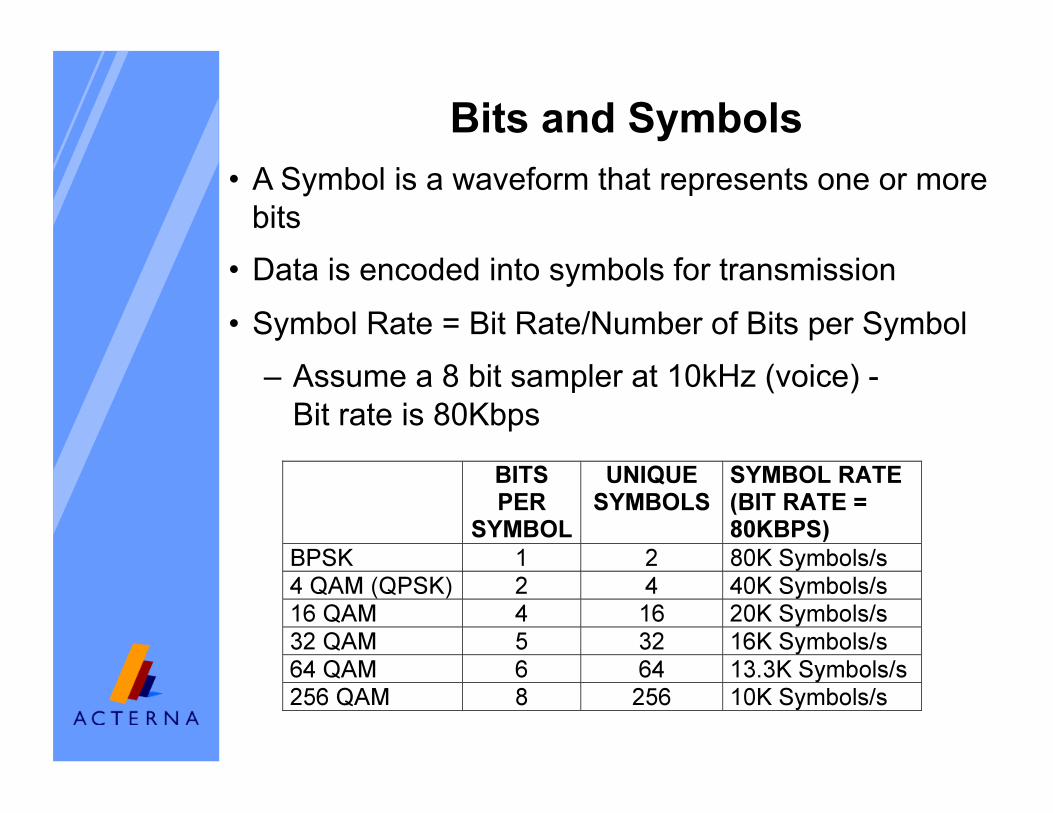
Bits and Symbols • A Symbol is a waveform that represents one or more
bits • Data is encoded into symbols for transmission
• Symbol Rate = Bit Rate/Number of Bits per Symbol
– Assume a 8 bit sampler at 10kHz (voice) - Bit rate is 80Kbps

Forward Error Correction (FEC)
• Adds redundant information to the data stream
• Trade-off of data size vs error correction
• Trellis Encoding
• Randomization
• Interleaving
• Reed Solomon

FEC Made Easy
Alternates odd even, sum is 100
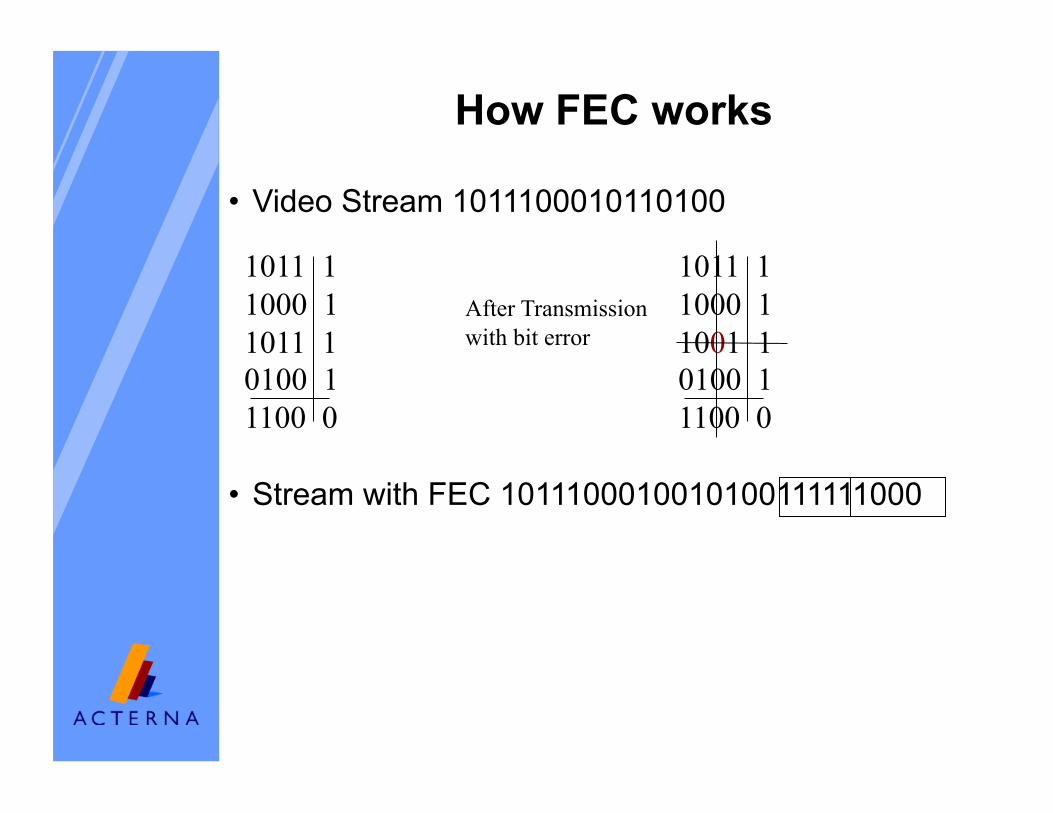
How FEC works
• Video Stream 1011100010110100
• Stream with FEC 1011100010010100111111000
1011 1 1000 1 1011 1 0100 1 1100 0
1011 1 1000 1 1001 1 0100 1 1100 0
After Transmission with bit error

Digital Modulation Stream
Digital Modulation Stream
Reed-Solomon Encoder
Interleaver
Randomizer
Trellis Encoder
Reed-Solomon Coding provides block encoding and decoding to correct up to three symbols within an RS block
Interleaving evenly disperses the symbols, protecting against a burst of symbol errors from being sent to the RS decoder
Randomizes the data on the channel to allow effective QAM demodulation synchronization
Trellis Coding provides convolutional encoding and with the possibility of using soft decision trellis decoding of random channel errors
Modulation
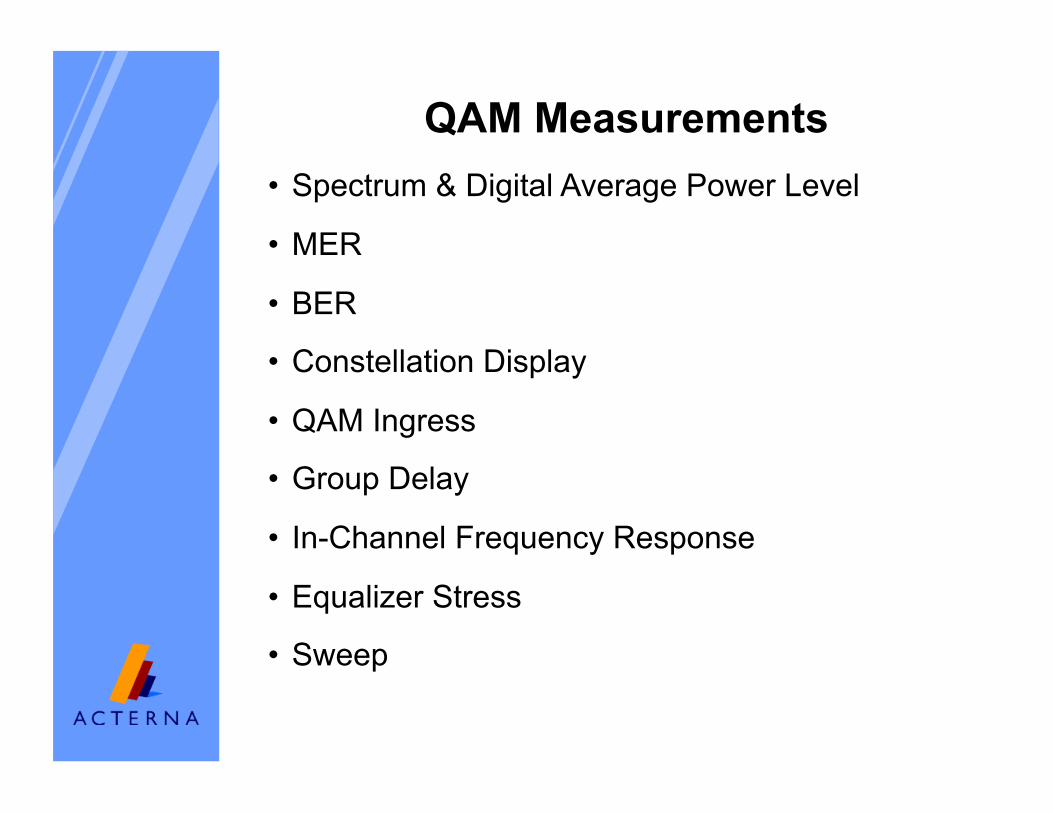
QAM Measurements • Spectrum & Digital Average Power Level
• MER
• BER
• Constellation Display
• QAM Ingress
• Group Delay
• In-Channel Frequency Response
• Equalizer Stress
• Sweep

• Digital Average Power Measurements and Measurement Bandwidth
• The spectrum analyzer view is an excellent tool to see discreet RF-carriers.
• Caution is needed when viewing digital modulated signals (noise mountain). The signals level is depended from the selected measurement bandwidth (resolution bandwidth). At a RBW = 300 kHz, a 64QAM - 6 MHz wide digital signal reads in the spectrum analyzer trace 3 dB to low.
• The Average Power principle takes little slices from the integrated RF-energy, summing them together to one total power reading in the LEVEL-mode.
Digital Average Power Level Measurements
Summing slices of the total integrated energy
Analog and digital (broadcast) signal. The delta in level should be 10 dB.

Spectrum analyzers can cause confusion
• The spectrum analyzer’s different resolution-bandwidth filter give different results for power level measurements.
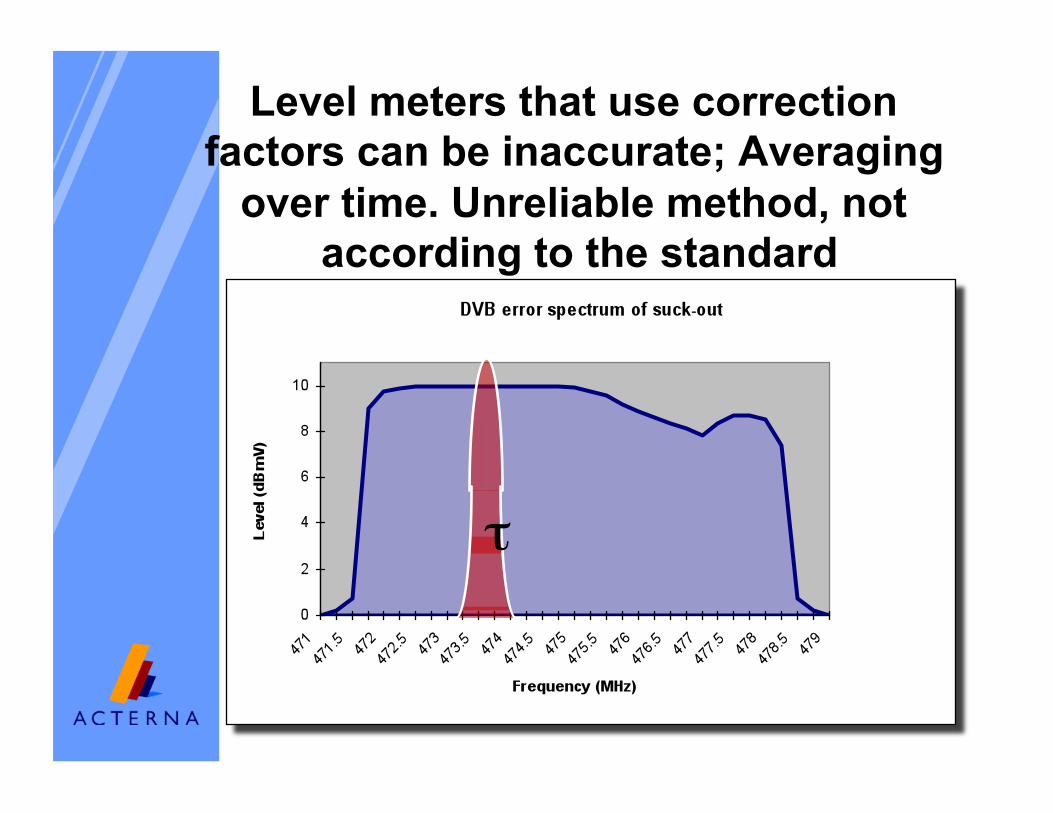
Level meters that use correction factors can be inaccurate; Averaging
over time. Unreliable method, not according to the standard
τ

Level measurements on digital video channels
• Average Power Level according to standards
• Scanning the level envelope of the channel using a 280 kHz IF-filter and summing the values of all samples.
• Can be used on all digital channels QPSK, QAM, 8-VSB
> 10 dB
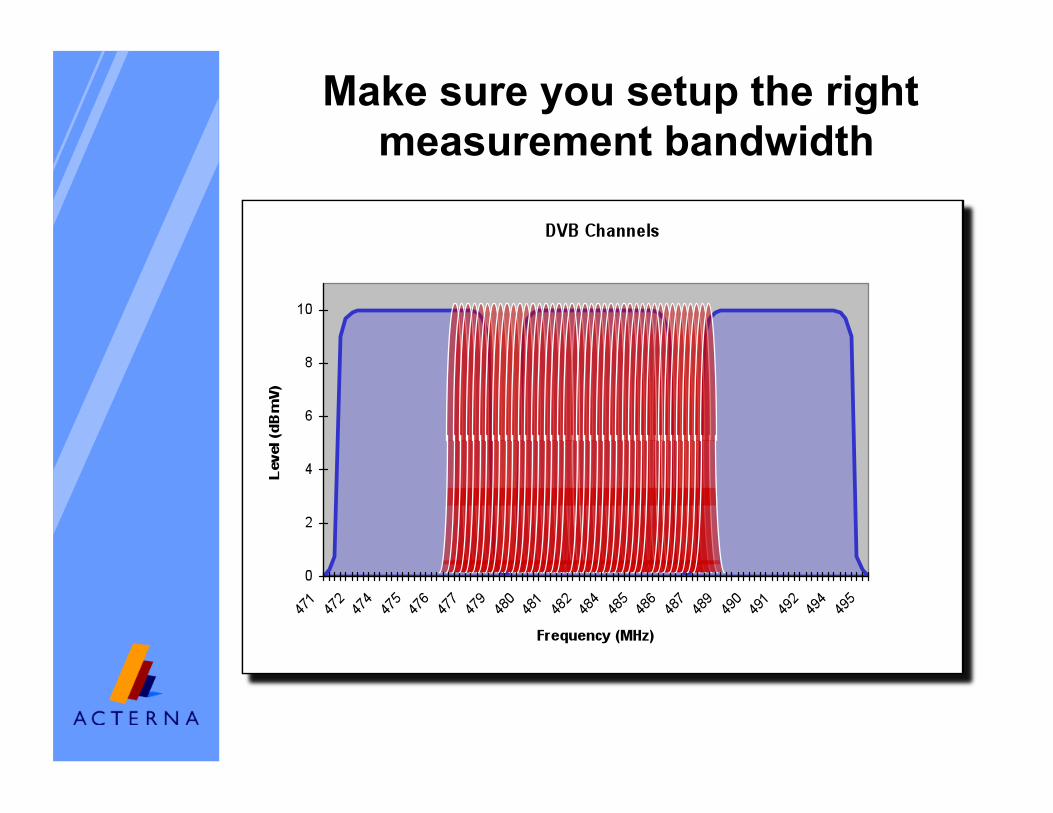
Make sure you setup the right measurement bandwidth

Modulation Error Ratio (MER)
• Analogous to S/N or C/N • A measure of how tightly symbols are recorded
with respect to desired symbol location
• MER(dB) = 20 x log RMS error magnitude average symbol magnitude
• Good MER
– 64 QAM: 23 dB MER
– 256 QAM: 29 dB MER RMS error magnitude
Average symbol
magnitude
MER • Modulation Error Ratio (MER) in digital systems is
similar to S/N or C/N used in analog systems
• MER determines how much margin the system has before failure
• Analog systems that have a poor C/N show up as a “snowy” picture
• A poor MER is not noticeable on the picture right up to the point of system failure - “Cliff Effect”
• Can’t use the TV as a piece of test equipment anymore

(Gradually poorer C/N)
Effect of Noise on Analog Systems
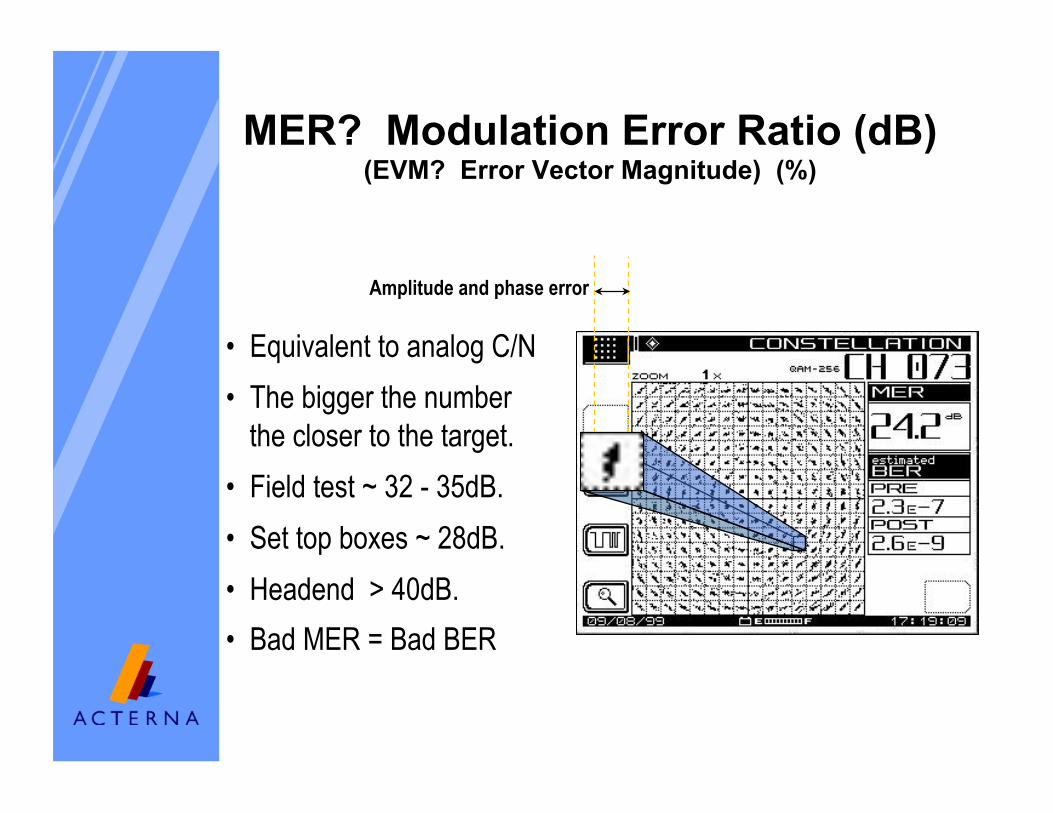
MER? Modulation Error Ratio (dB) (EVM? Error Vector Magnitude) (%)
• Equivalent to analog C/N • The bigger the number
the closer to the target. • Field test ~ 32 - 35dB. • Set top boxes ~ 28dB. • Headend > 40dB. • Bad MER = Bad BER
Amplitude and phase error
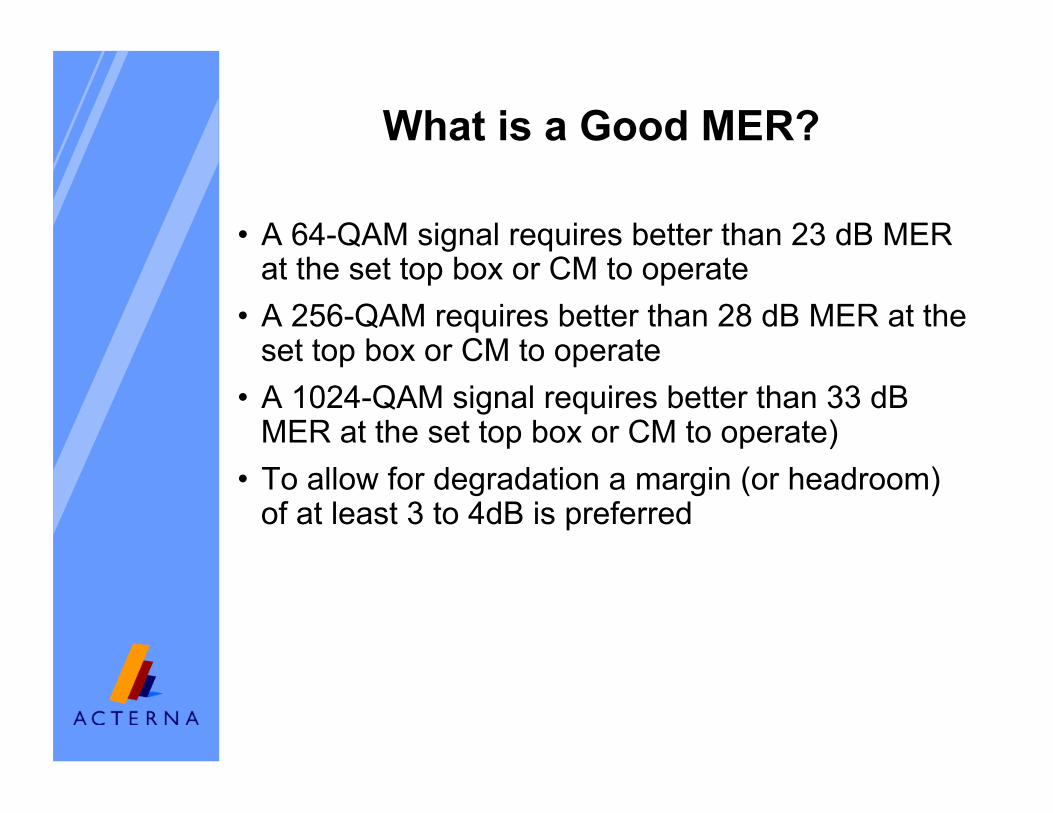
What is a Good MER?
• A 64-QAM signal requires better than 23 dB MER at the set top box or CM to operate
• A 256-QAM requires better than 28 dB MER at the set top box or CM to operate
• A 1024-QAM signal requires better than 33 dB MER at the set top box or CM to operate)
• To allow for degradation a margin (or headroom) of at least 3 to 4dB is preferred

Error Vector Magnitude
Q
I
Transmitted Symbol
Target Symbol
Error Vector
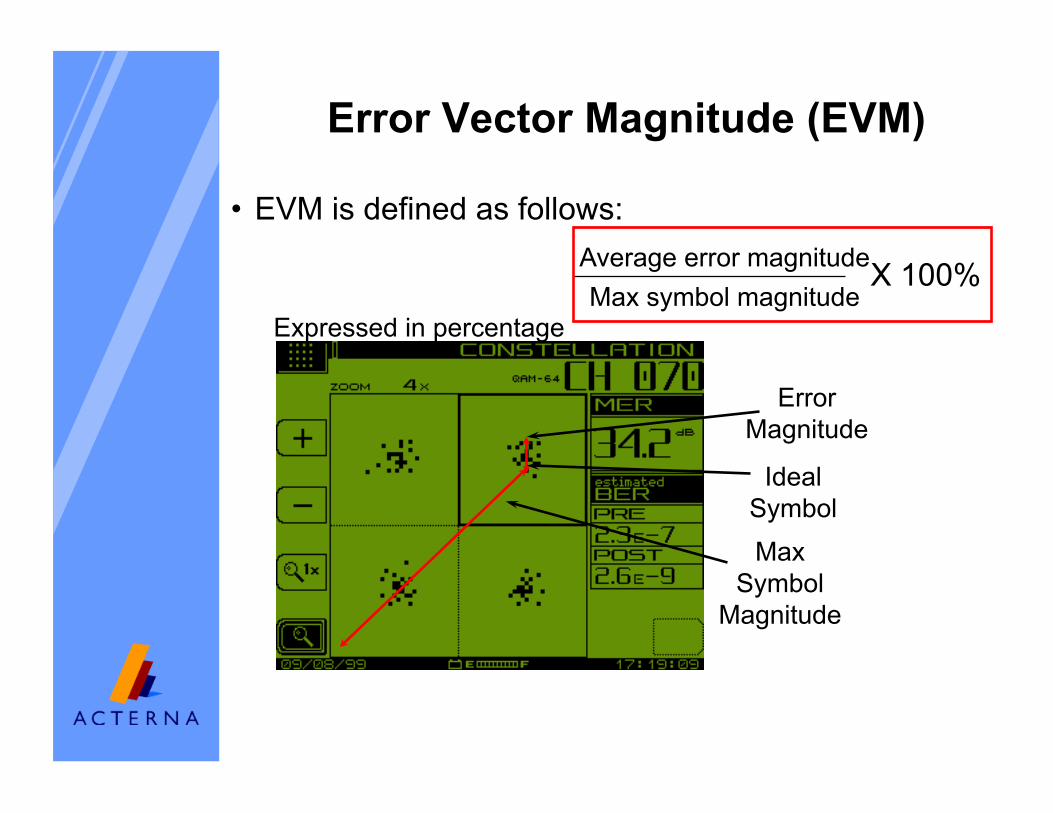
Error Magnitude
Ideal Symbol Max
Symbol Magnitude
Average error magnitude Max symbol magnitude
X 100%
Error Vector Magnitude (EVM)
• EVM is defined as follows:
Expressed in percentage

BER Introduction
• Bit Error Rate is a major indicator of system health
• As data is transmitted some of the bits may not be received correctly
• The more bits that are incorrect, the more the signal will be affected
• It’s important to know what portion of the bits are in error
• Need to know how much margin the system has before failure
• The harder FEC is working, the closer the system is to failure (“The Cliff”)
BER
• Good signal: BER 10-10
• Threshold for visible degradation: BER 10-6
• FEC can improve BER from 10-4 to 10-10
– BER before FEC: correctable + uncorrectable errors
– BER after FEC: uncorrectable errors
• Bit Error Tester (BERT)
– Inject known signal

BER Example • A 256QAM channel transmits at a symbol rate of 5M
symbols per second • Bit rate = 8 bits per symbol X 5M symbol per second
=40M bits per second • Error Incident = Bit rate X BER = Errors Per Second

Pre and Post FEC BER • FEC - Corrected Errors
Estimated uncorrected Errors • Pre FEC = corrected + uncorrected errors
• Post FEC = uncorrected errors
• Pre and Post FEC BER indicate how hard the FEC is working to correct errors
Pre FEC BER (before correction)
Post FEC BER (after correction)
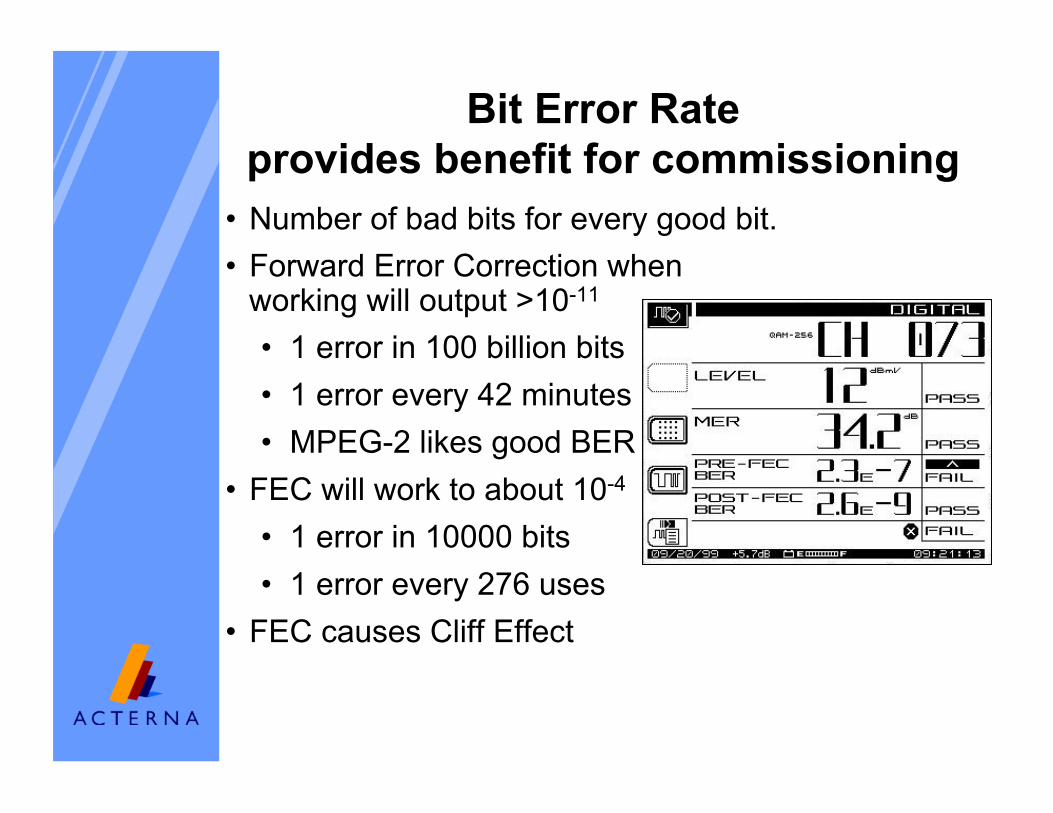
Bit Error Rate provides benefit for commissioning
• Number of bad bits for every good bit. • Forward Error Correction when
working will output >10-11
• 1 error in 100 billion bits • 1 error every 42 minutes • MPEG-2 likes good BER
• FEC will work to about 10-4
• 1 error in 10000 bits • 1 error every 276 uses
• FEC causes Cliff Effect

FEC causes Cliff Effect
1.10-1
1.10-9
4.10-4
2 23.5 40
4QAM 16QAM 64QAM 256QAM
MER
BER • A small variation
in MER (+/- 1 dB) will cause a large variation in BER measurement.
• Using BER for trouble-shooting and fault location is not repeatable and very inaccurate.
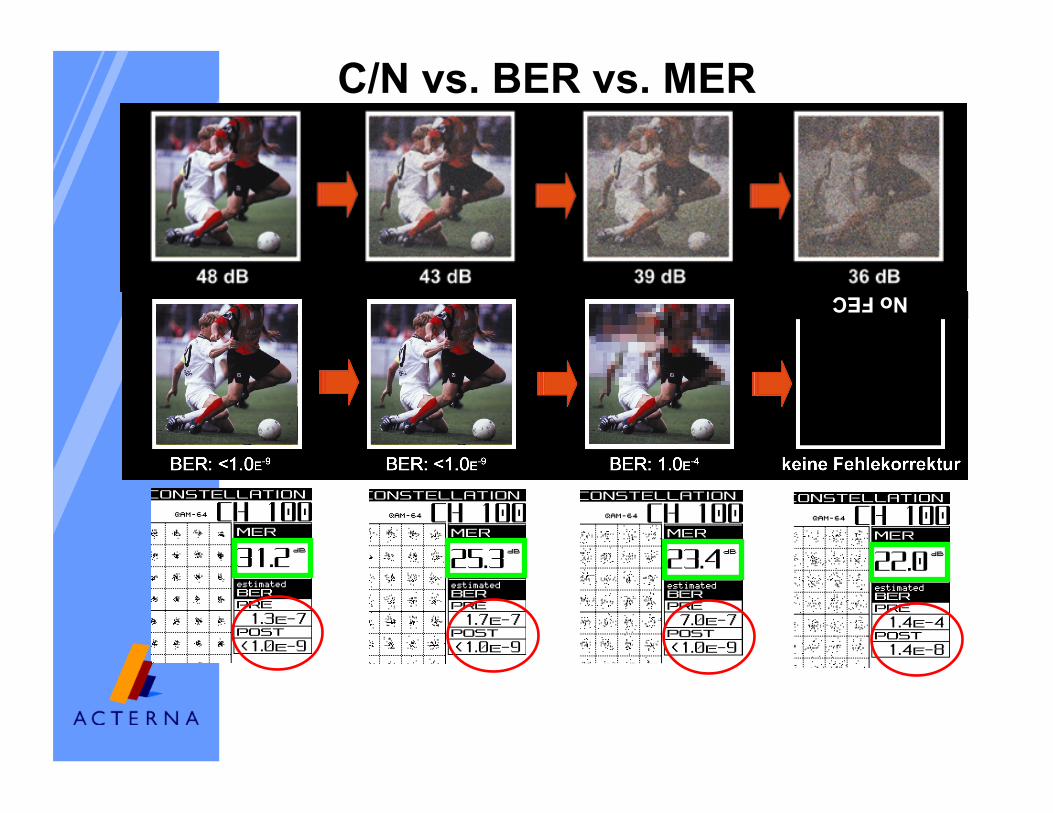
C/N vs. BER vs. MER
No FEC
Constellations
Constellation Basics • The constellation display shows both I and Q
• A symbol is the smallest piece of information transmitted - plotted as a point representing a digital bit(s)
• It is the digital equivalent of a Vectorscope display
• Useful for determining modulation problems:
– Amplitude Imbalance
– Quadrature Error
– Phase Error
– Modulation Error Ratio

Quadrature Amplitude Modulation
RF-Out 64-QAM
4 Level Linear
Attenuator
0/180°
0/180°
Σ
I-Channel
Q-Channel
RF-In
0°
90°
(010)
(011) Bit stream in (011)(010)
(0) (10)
(0) (11)
4 Level Linear
Attenuator
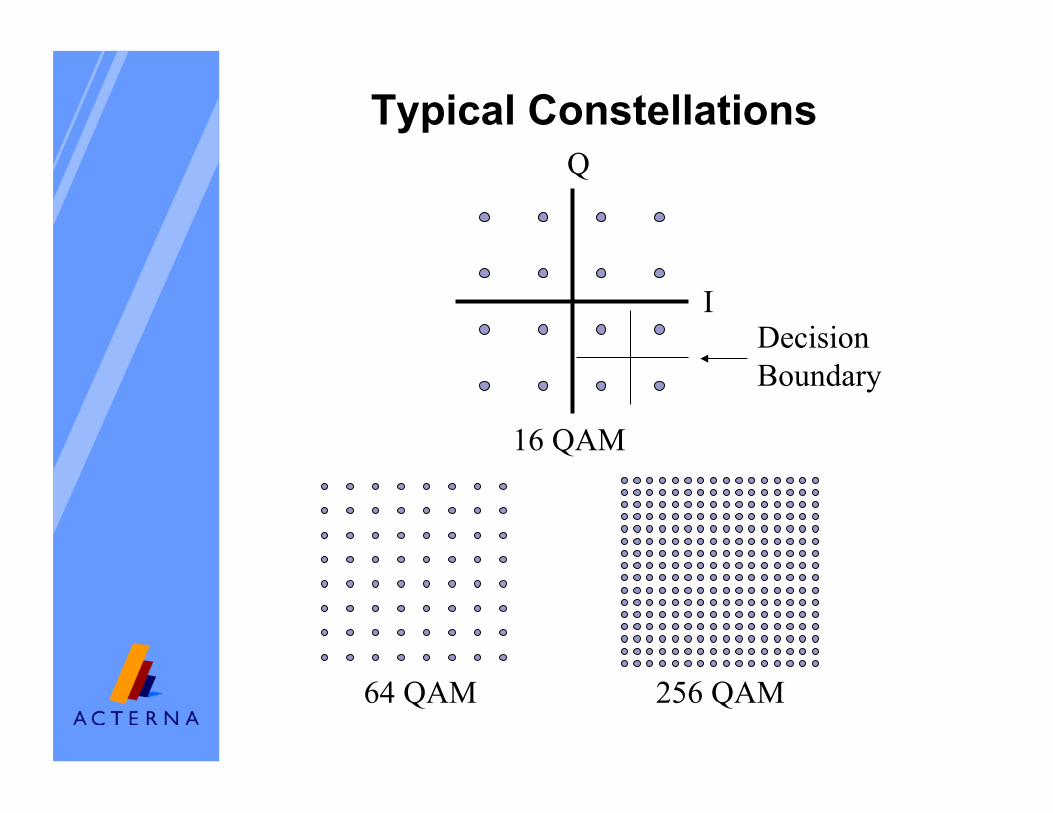
Typical Constellations
I
Q
Decision Boundary
16 QAM
64 QAM 256 QAM
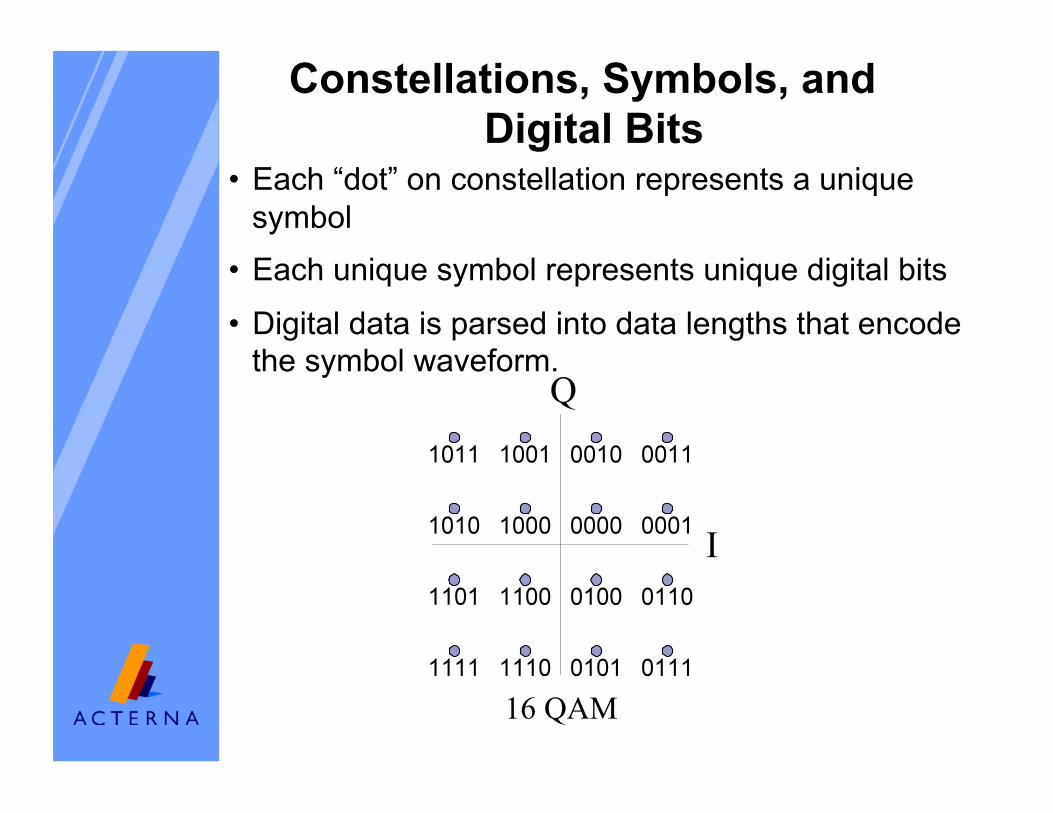
Constellations, Symbols, and Digital Bits
16 QAM
• Each “dot” on constellation represents a unique symbol
• Each unique symbol represents unique digital bits
• Digital data is parsed into data lengths that encode the symbol waveform.
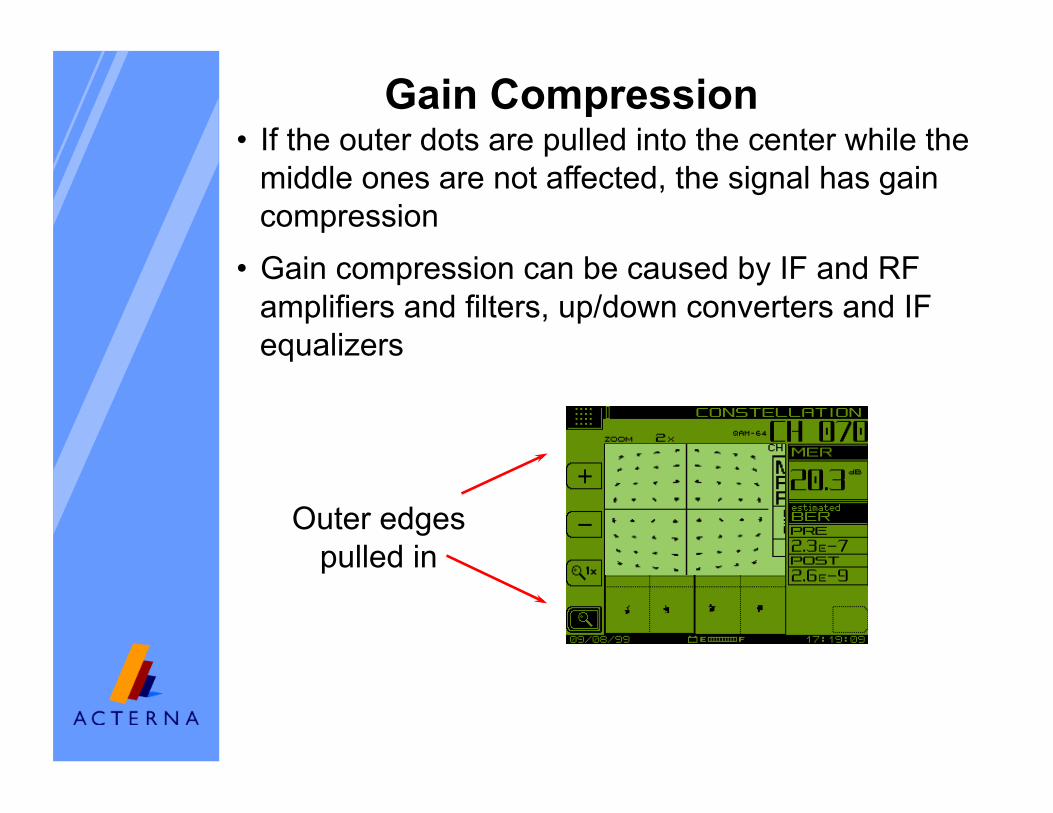
Gain Compression • If the outer dots are pulled into the center while the
middle ones are not affected, the signal has gain compression
• Gain compression can be caused by IF and RF amplifiers and filters, up/down converters and IF equalizers
Outer edges pulled in

Dots are spread out
showing error
System Noise • A constellation displaying significant noise
• Dots are spread out indicating high noise and most likely significant errors
– An error occurs when a dot is plotted across a boundary and is placed in the wrong location
• Meter will not lock if too much noise present

Phase Noise • Display appears to rotate at the extremes • HE down/up converters can cause phase noise • Random phase errors cause decreased
transmission margin • Caused by transmitter symbol clock jitter • Bad LO in meter can cause phase noise
Constellation
Constellation with Phase Noise Zoomed Constellation with Phase Noise
Rotation Rotation
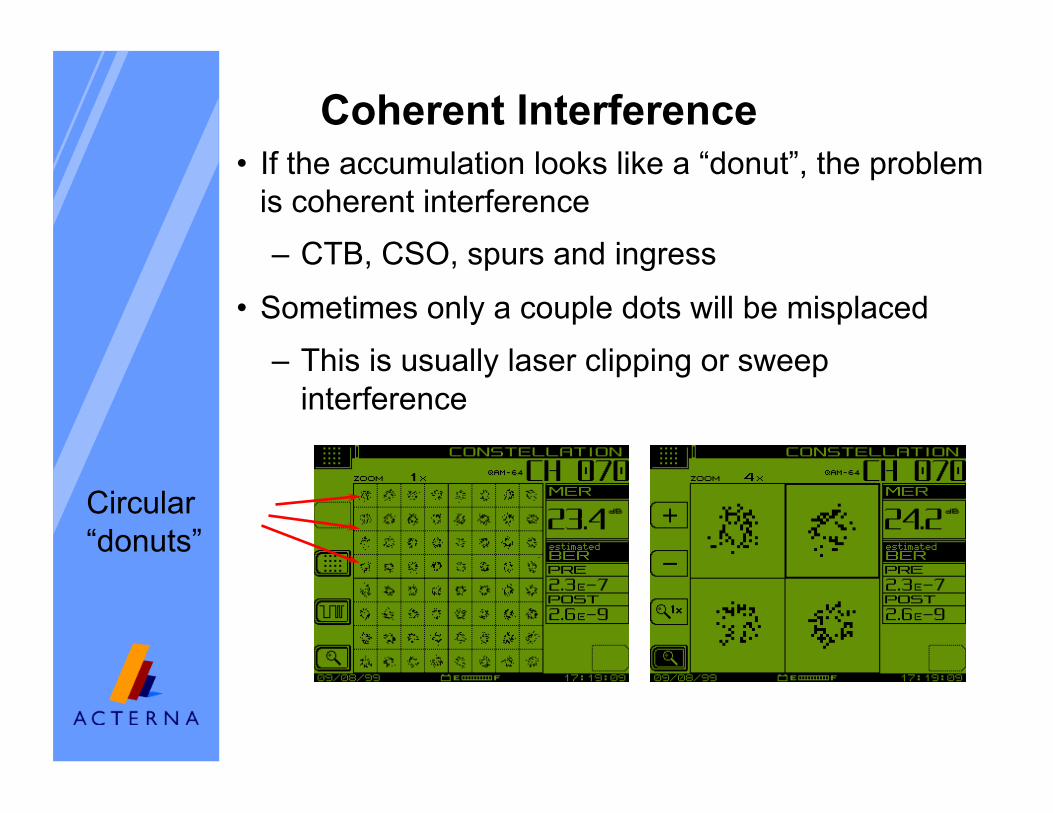
Coherent Interference • If the accumulation looks like a “donut”, the problem
is coherent interference – CTB, CSO, spurs and ingress
• Sometimes only a couple dots will be misplaced
– This is usually laser clipping or sweep interference
Circular “donuts”

Ingress Under the Carrier
• Interference will cause poor MER • Noise • Discreet Signal
• Ingress • Bad Modulator • CSO/CTB (TV)
• CSO/CTB Digital
QAM Ingress (Ingress Under the Carrier) • Meter knows how much error is in signal from
measuring Constellation points • Meter uses this error to plot Ingress Under the
Carrier

CSO and CTB under QAM 256 carrier
• Using ingress under the carrier, the SDA can uncover CSO and CTB that are not visible using standard spectrum analysis.

CSO under QAM 256 carrier
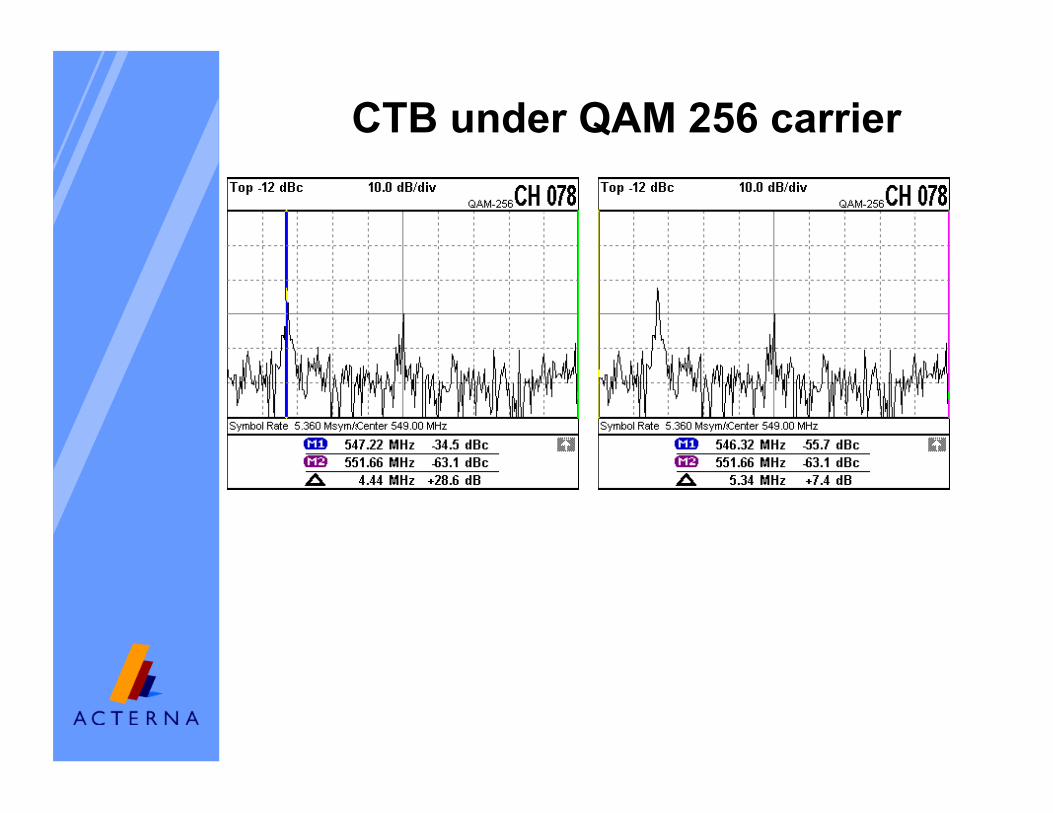
CTB under QAM 256 carrier

Group Delay • Definition: Group delay is the measure of the slope of the
phase shift with frequency.
• Effects: If there are group delay variations in the network, then signals of one frequency can make it through the network faster than signals at another frequency.
• For analog signals this typically can cause misregistration of the chrominance to luminance since the chrominance subcarrier is 3.58MHz higher than the luminance carrier. The visible effect is that the colors are not within the outline of the subject.
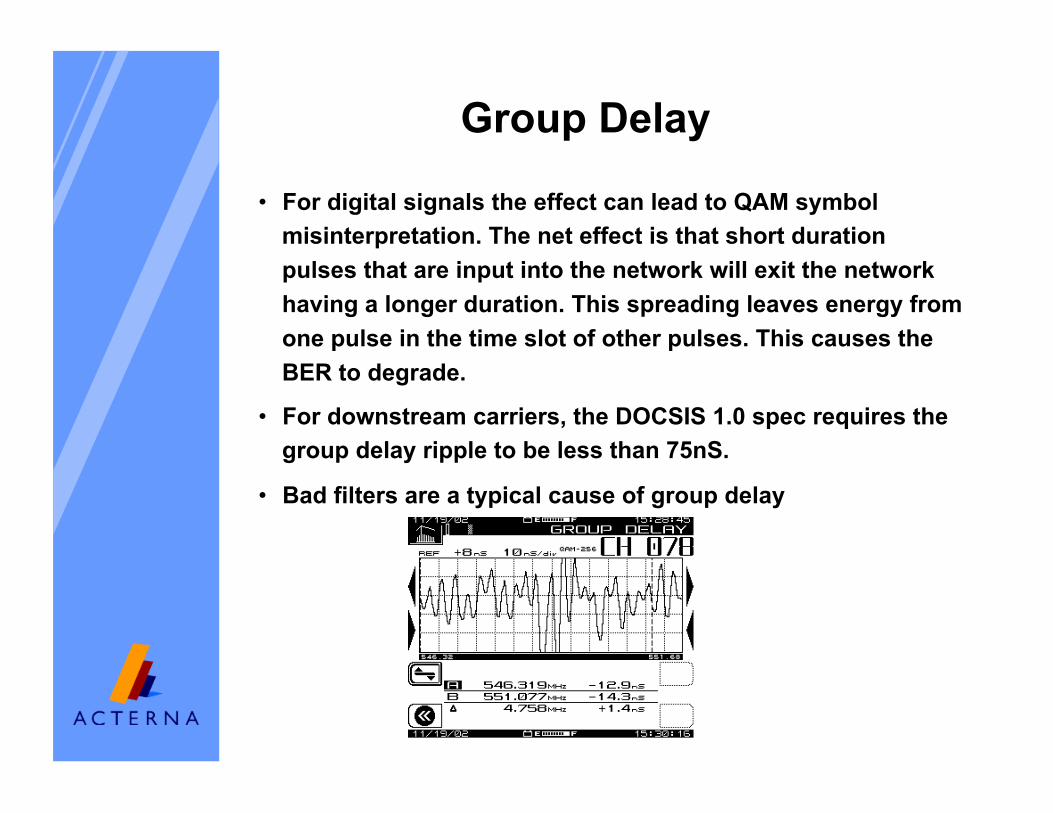
Group Delay
• For digital signals the effect can lead to QAM symbol misinterpretation. The net effect is that short duration pulses that are input into the network will exit the network having a longer duration. This spreading leaves energy from one pulse in the time slot of other pulses. This causes the BER to degrade.
• For downstream carriers, the DOCSIS 1.0 spec requires the group delay ripple to be less than 75nS.
• Bad filters are a typical cause of group delay
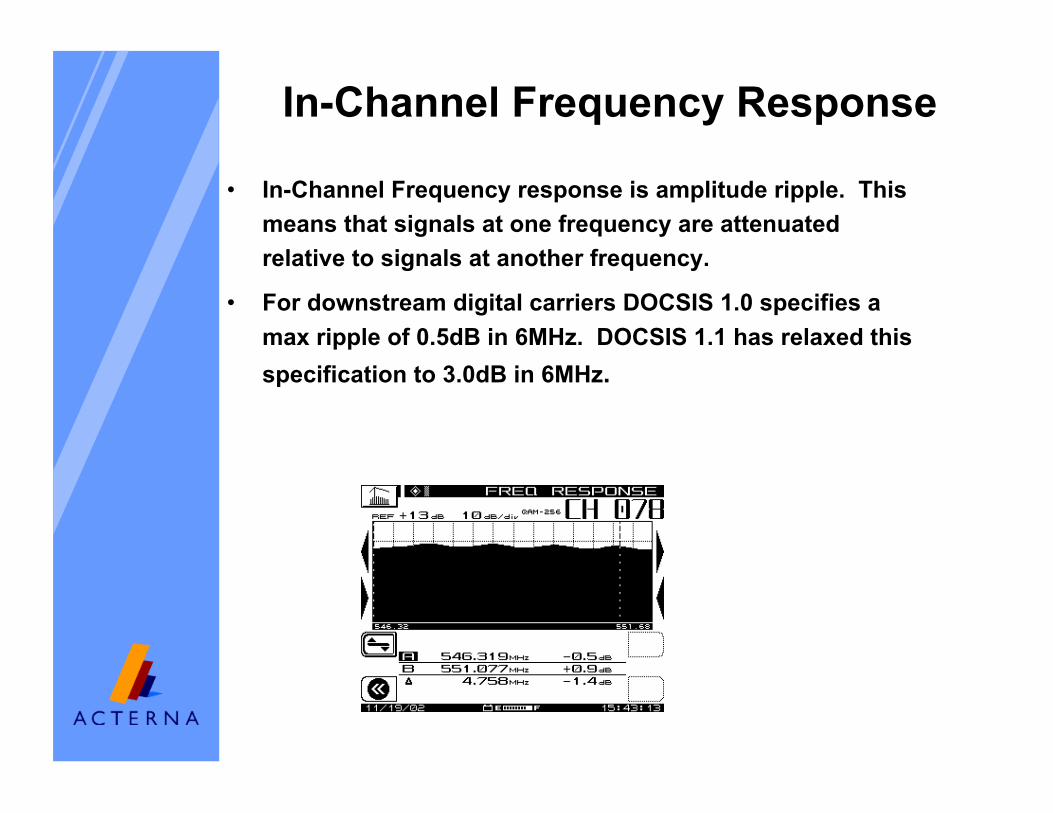
In-Channel Frequency Response
• In-Channel Frequency response is amplitude ripple. This means that signals at one frequency are attenuated relative to signals at another frequency.
• For downstream digital carriers DOCSIS 1.0 specifies a max ripple of 0.5dB in 6MHz. DOCSIS 1.1 has relaxed this specification to 3.0dB in 6MHz.

Equalizer Stress • Digital demodulation receivers utilize adaptive equalizers to negate the
effects of signals arriving other than the desired signal.
• Signals can arrive ahead of or after the desired signal. In a cable system, the majority of signals are reflections and micro-reflections that arrive after the desired signal.
• Cable modems and digital set top boxes must be able to handle pre and post signals at levels defined by DVB standards. If the equalizer is pushed beyond those limits, errors will occur.
• By using the Velocity of Propagation, the distance to the source of the reflection can sometimes be located. If the reflections occur before the next upstream amplifier, they are simply amplified and passed downstream thereby eliminating the ability to perform fault detection based on reflection time.
• Equalizer stress is used more as a figure of merit for the margin available to the set top box or cable modem.
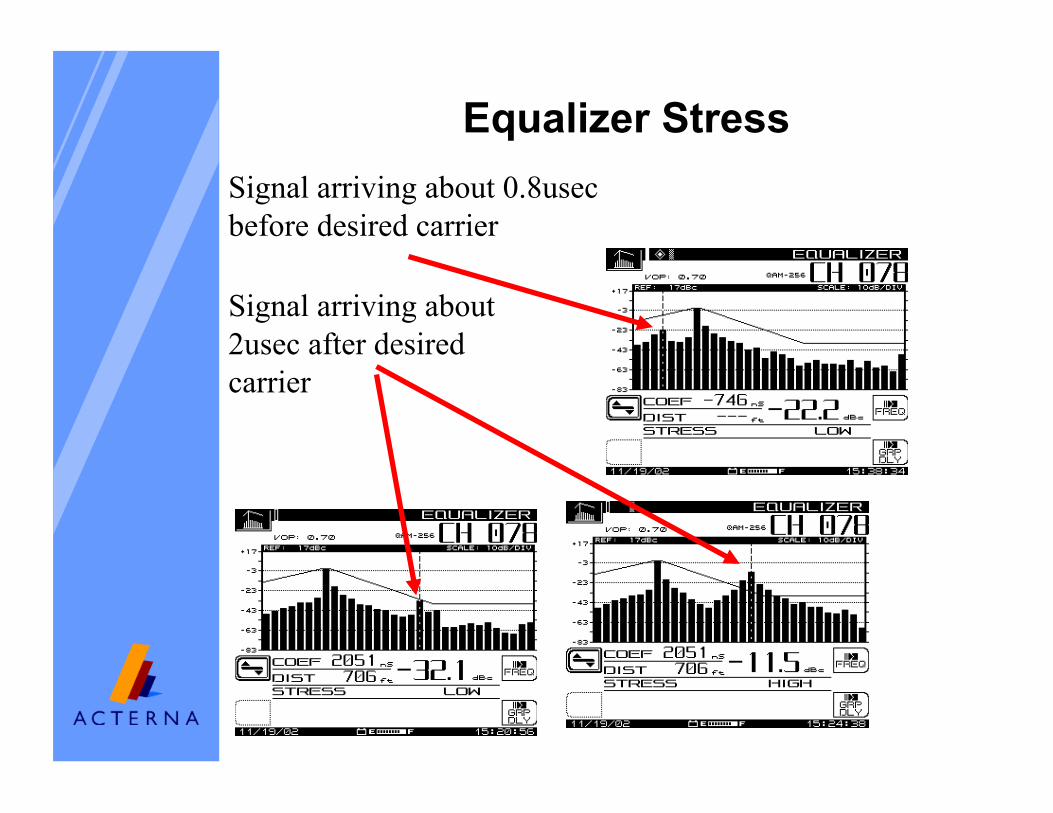
Equalizer Stress Signal arriving about 0.8usec before desired carrier
Signal arriving about 2usec after desired carrier
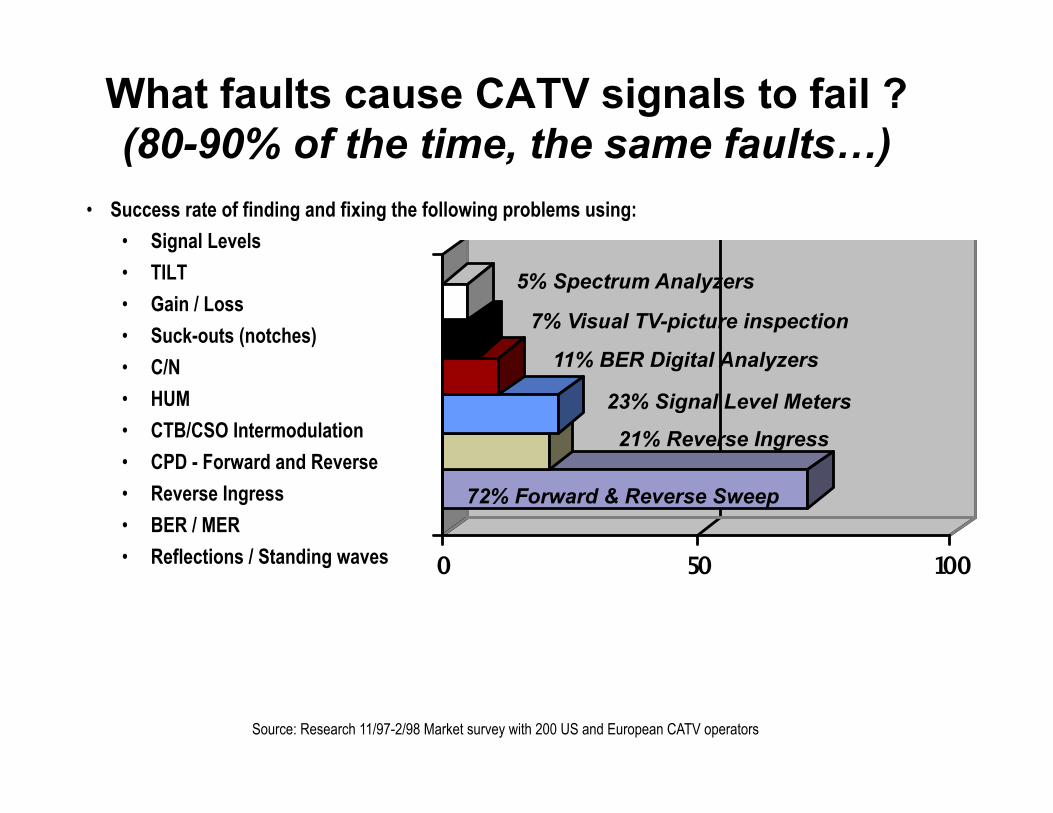
• Success rate of finding and fixing the following problems using: • Signal Levels • TILT • Gain / Loss • Suck-outs (notches) • C/N • HUM • CTB/CSO Intermodulation • CPD - Forward and Reverse • Reverse Ingress • BER / MER • Reflections / Standing waves
What faults cause CATV signals to fail ? (80-90% of the time, the same faults…)
Source: Research 11/97-2/98 Market survey with 200 US and European CATV operators
21% Reverse Ingress
23% Signal Level Meters
11% BER Digital Analyzers
72% Forward & Reverse Sweep
5% Spectrum Analyzers
7% Visual TV-picture inspection

Sweep is the best way to prepare the network for 256 QAM
• Standing waves, suck-outs, intermodulation distortion and non-linear performance effect digital performance
NODE 1
Bad Forward Sweep Trace

Reflections causes by bad terminations
• Reflections or standing waves caused by any defective, miss-matching devise • Damages cable, connectors ground block, splitters, etc.
• A sweep signal is transmitted by the SDA 5500 over coaxial cable (the medium). A portion of the transmitted sweep signal on the cable will be reflected back to the transmitter if the load is not a perfect 75Ohm impedance match. The reflected energy will be the same frequency as the incident (sweep) signal but different in phase. The resulting signal (incident + reflected) will appear as standing waves on a frequency sweep (see figure). The reflection is such that the peaks of the individual cycles can be translated to distance to the fault (impedance mismatch) through the following equation:
D = 491*Vop/f Where D=distance to fault, Vop=velocity of propagation of the cable, and f = frequency of 1
cycle of the standing wave.
Bad Forward Sweep Trace - Standing waves
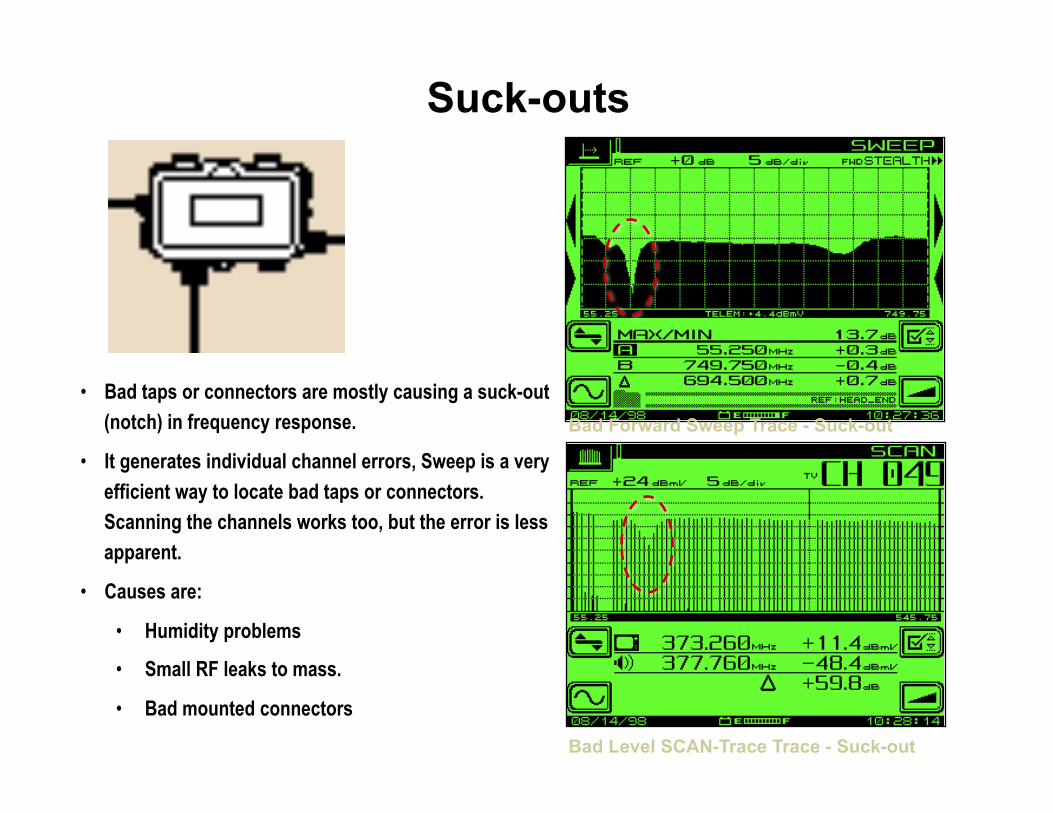
Suck-outs
• Bad taps or connectors are mostly causing a suck-out (notch) in frequency response.
• It generates individual channel errors, Sweep is a very efficient way to locate bad taps or connectors. Scanning the channels works too, but the error is less apparent.
• Causes are:
• Humidity problems
• Small RF leaks to mass.
• Bad mounted connectors
Bad Forward Sweep Trace - Suck-out
Bad Level SCAN-Trace Trace - Suck-out

Terms
• QAM - Quadrature Amplitude Modulation
• Symbols - Collection of Bits
• Symbol Rate - Transmission Speed
• I & Q - Components of QAM data
• Constellation - Graph of QAM Data
• MER - Modulation Error Ratio
• BER - Bit Error Rate
• FEC - Forward Error Correction
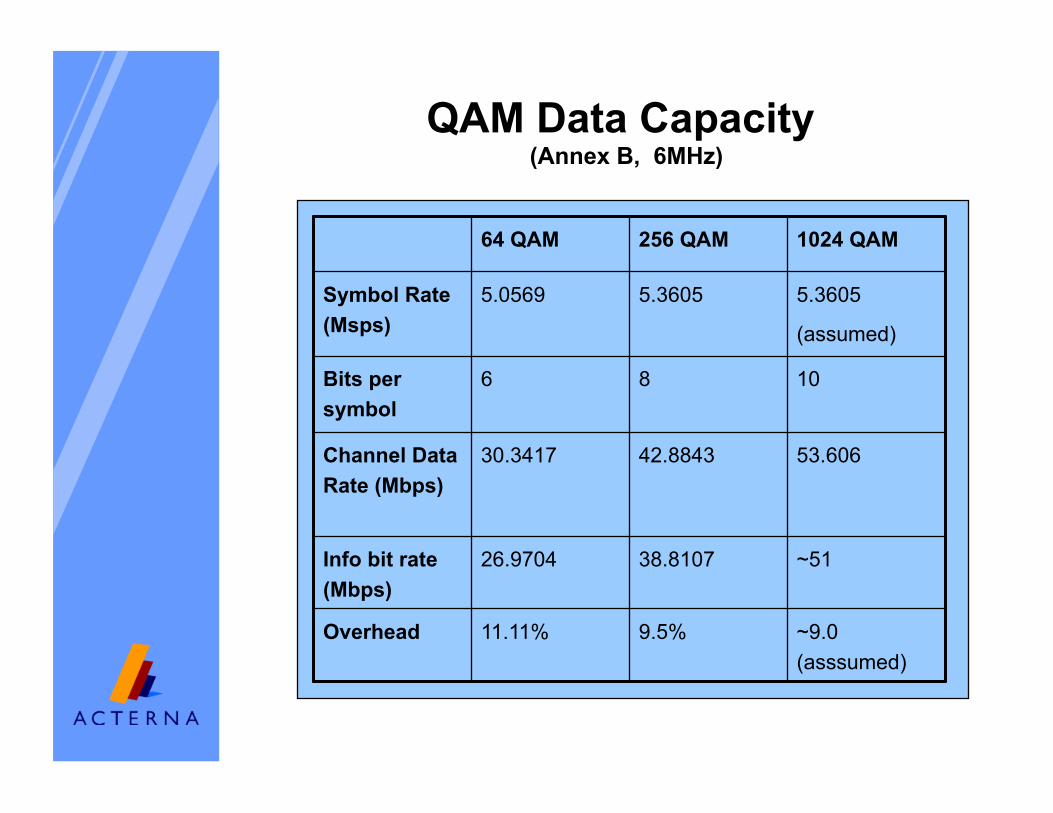
QAM Data Capacity (Annex B, 6MHz)
64 QAM 256 QAM 1024 QAM
Symbol Rate (Msps)
5.0569 5.3605 5.3605
(assumed)
Bits per symbol
6 8 10
Channel Data Rate (Mbps)
30.3417 42.8843 53.606
Info bit rate(Mbps)
26.9704 38.8107 ~51
Overhead 11.11% 9.5% ~9.0 (asssumed)