Q4FY21 Result & Investor Presentation
57
Q4FY21 Result & Investor Presentation 29 th May, 2021
Transcript of Q4FY21 Result & Investor Presentation
Q4FY21 Result & Investor Presentation29th May, 2021

Safe Harbor
2
This presentation and the accompanying slides (the “Presentation”), which have been prepared by Shaily Engineering Plastics Limited (the “Company”), havebeen prepared solely for information purposes and do not constitute any offer, recommendation or invitation to purchase or subscribe for any securities, andshall not form the basis or be relied on in connection with any contract or binding commitment whatsoever. No offering of securities of the Company will bemade except by means of a statutory offering document containing detailed information about the Company.
This Presentation has been prepared by the Company based on information and data which the Company considers reliable, but the Company makes norepresentation or warranty, express or implied, whatsoever, and no reliance shall be placed on, the truth, accuracy, completeness, fairness andreasonableness of the contents of this Presentation. This Presentation may not be all inclusive and may not contain all of the information that you mayconsider material. Any liability in respect of the contents of, or any omission from, this Presentation is expressly excluded.
Certain matters discussed in this Presentation may contain statements regarding the Company’s market opportunity and business prospects that areindividually and collectively forward-looking statements. Such forward-looking statements are not guarantees of future performance and are subject toknown and unknown risks, uncertainties and assumptions that are difficult to predict. These risks and uncertainties include, but are not limited to, theperformance of the Indian economy and of the economies of various international markets, the performance of the industry in India and world-wide,competition, the company’s ability to successfully implement its strategy, the Company’s future levels of growth and expansion, technologicalimplementation, changes and advancements, changes in revenue, income or cash flows, the Company’s market preferences and its exposure to market risks,as well as other risks. The Company’s actual results, levels of activity, performance or achievements could differ materially and adversely from resultsexpressed in or implied by this Presentation. The Company assumes no obligation to update any forward-looking information contained in this Presentation.Any forward-looking statements and projections made by third parties included in this Presentation are not adopted by the Company and the Company is notresponsible for such third party statements and projections.

Overview

About the Company
4
Enriching Lives Through Plastics
Shaily was established in 1987 with just two moulding machines.Today, its facilities have grown significantly to include more than140 machines, and Shaily plastics can be found across the globe inproducts as diverse as medical devices, home furnishing, Toys,Personal Care and automotive components in plastic and we haverecently forayed into steel furniture.
6 Facilities in Gujarat
5 for Plastic1 for Steel Furniture
Over1,500 employees across 6 plants
RevenueRs. 361 CroresFY 2020-21
140+injection moulding machines
De-risked Business Model
Long-standing global relationships with marquee clients
Founded in
1987

Vision Mission & Our Values
5
▪ To provide end-to-end solutions in plastics
▪ Deliver superior quality to our customers; higher profitability and value to our shareholders; and sustainability for future generations
Our Vision and Mission
Our Values
Always follow through on targets and
commitments
Never bypass
systems and
processes
Be passionate,
determined,
proactive and
ready to take on
challenges
Deliver customer
delight through
excellence in
performance
Build a positive team and family
spirit – One Shaily
Treat everyone
with courtesy
and respect
Doing it right the
first time

Our Core Capabilities
6
• Tool design• Mold flow• Process design• Automation• Polymer Selection
NPD
• Precision molding• Decoration &
Printing• Assembly• Automation
Manufacturing
• Regulatory compliance• Robust QA/QC processes• Testing protocol• Continuous improvement
Quality
• Social compliance• Renewable energy• Recycled /
biodegradable plastics
Sustainability

Our Journey from FY15 to FY21 has created a strong base
7
Accelerated existing Consumer Business by
adding New Customers & New Segments
Increased utilization levels of Healthcare
business
De-risked Business Model
Created Financial Flexibility and Strong Balance Sheet to address large Business
opportunities
We have developed a Strong base for growth:
SHAILY IS FUTURE READY
Financial HealthBusinessHealthcareConsumer Business

Our Strong base of last few years makes us Future Ready…
8
Accelerated existing business with Homes Furnishing major1
• Strengthened our relationship with Swedish Home Furnishings major• Revenues increased from Rs. 120cr in FY15 to over Rs. 200cr in FY21• Added 30 SKUs taking the total count of products manufactured to 48 SKUs• Ventured in Carbon Steel Business for the Homes Furnishing Major
Deepening foray in IP related products and Healthcare2
• Healthcare is now the 2nd largest revenue contributing segment • Added 12 Drug Delivery devices in commercial production• Consolidation of Healthcare units to achieve faster breakeven and higher efficiencies• Built high scale to be able to achieve 2-3x revenue growth in 3-5 years
De-risked Business Model 3
• Focused on new business segments and customers to de-risk the business model • Ventured in Toys category with the addition of Toys major Spin Master• Investment made in Carbon Steel Business to diversify concentration beyond Plastics• By entering into Carbon Steel business, cemented relationship with existing customers
and have got into Multi Material Products (combination of Plastic & Steel)
4
• Funded capex of Rs. 150cr to set up Healthcare business, expansion of new SKUs for Homes Furnishing major and carbon steel business from internal cash flows and Debt
• Despite investment in capex Debt/Equity at comfortable levels; below 1x• A Strong Balance sheet is FUTURE READY to take advantage of ‘MAKE IN INDIA’
Created Financial Flexibility and Strong Balance Sheet to address large Business opportunities

Business Segments
9
Home Furnishings Business
Toys Business
Consumer Steel Furniture
Carbon Steel Furniture
Automotive &Engineering
Automotive Components
Engineering Plastics
Healthcare
Drug Delivery Devices
Pharma Packaging
Personal Care
High Volume Molding, Decoration & Assembly
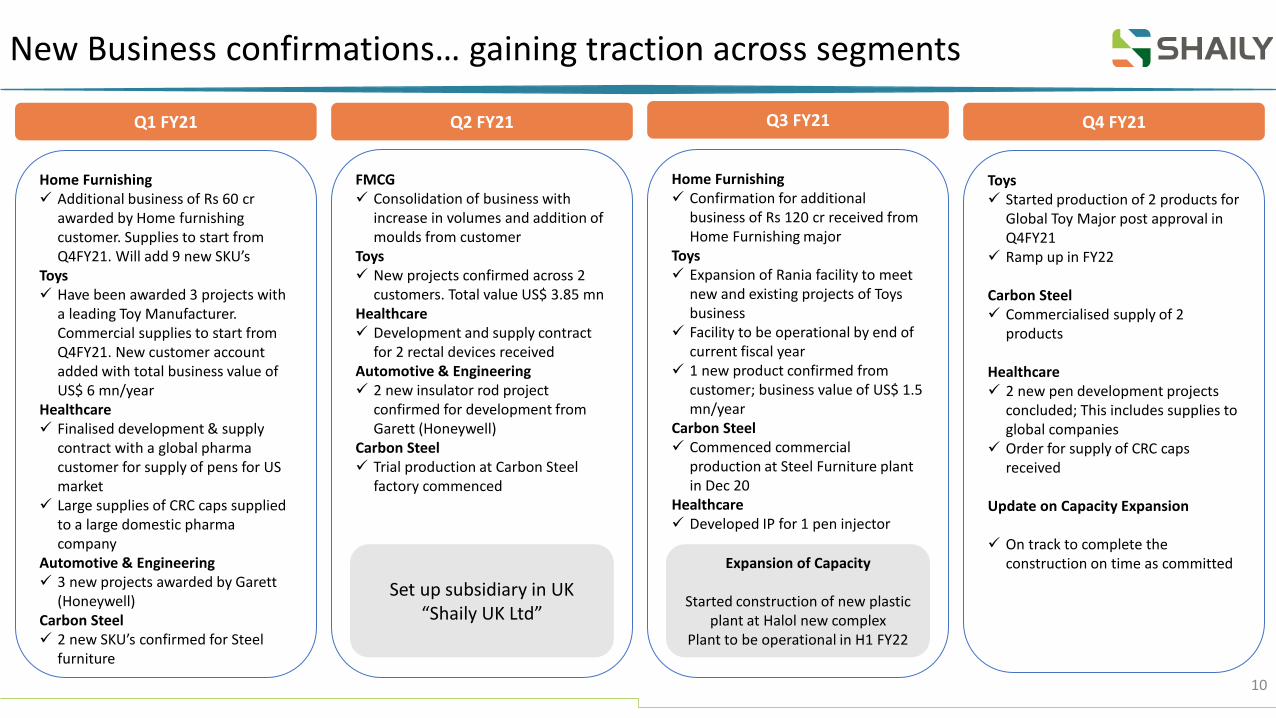
New Business confirmations… gaining traction across segments
Q1 FY21
Home Furnishing✓ Confirmation for additional
business of Rs 120 cr received from Home Furnishing major
Toys✓ Expansion of Rania facility to meet
new and existing projects of Toys business
✓ Facility to be operational by end of current fiscal year
✓ 1 new product confirmed from customer; business value of US$ 1.5 mn/year
Carbon Steel✓ Commenced commercial
production at Steel Furniture plant in Dec 20
Healthcare✓ Developed IP for 1 pen injector
Home Furnishing✓ Additional business of Rs 60 cr
awarded by Home furnishing customer. Supplies to start from Q4FY21. Will add 9 new SKU’s
Toys✓ Have been awarded 3 projects with
a leading Toy Manufacturer. Commercial supplies to start from Q4FY21. New customer account added with total business value of US$ 6 mn/year
Healthcare✓ Finalised development & supply
contract with a global pharma customer for supply of pens for US market
✓ Large supplies of CRC caps supplied to a large domestic pharma company
Automotive & Engineering✓ 3 new projects awarded by Garett
(Honeywell)Carbon Steel✓ 2 new SKU’s confirmed for Steel
furniture
FMCG✓ Consolidation of business with
increase in volumes and addition of moulds from customer
Toys✓ New projects confirmed across 2
customers. Total value US$ 3.85 mnHealthcare✓ Development and supply contract
for 2 rectal devices receivedAutomotive & Engineering✓ 2 new insulator rod project
confirmed for development from Garett (Honeywell)
Carbon Steel✓ Trial production at Carbon Steel
factory commenced
Q2 FY21 Q3 FY21
Set up subsidiary in UK“Shaily UK Ltd”
Toys✓ Started production of 2 products for
Global Toy Major post approval in Q4FY21
✓ Ramp up in FY22
Carbon Steel✓ Commercialised supply of 2
products
Healthcare✓ 2 new pen development projects
concluded; This includes supplies to global companies
✓ Order for supply of CRC caps received
Update on Capacity Expansion
✓ On track to complete the construction on time as committed
Q4 FY21
Expansion of Capacity
Started construction of new plastic plant at Halol new complex
Plant to be operational in H1 FY22
10

Quality Certifications
11
IATF 16949-2016 ISO 9001 : 2015 ISO 13485 : 2016 ISO 15378 : 2015 MDSAP

Certifications
12
AEO T2 Certificate Intertek
Security Certifications
Star Export HouseRD Recognition Letter
Other CertificationsSocial Compliances Certifications
SA-8000 2014
I-WAY GMP
Other Social Compliances Certifications

Enriching Lives … Through Sustainable Performance
13
The PLEX Council AwardTop Exporter Of Engineering
Components For ElevenConsecutive Years:
2005 to 2019
Award for BPC
Piramal All India KaizenCompetition 2017-18 For
Automation Of Kaizen
Top Exporter Award(1St Position) For Exports Out
Of Rct, Vadodara By ContainerCorporation Of India LtdAt Concor Awards, 2017
GOLD WinnerFor Outstanding Export OfFinished Plastic Goods By
Plastindia Foundation

Awards from Customers
14
Top Exporter of Engineering Components.
Award won consistently from 2005 –2019
Awarded for design of the Sanofi AllStar Pen
Award for two years of supplying Shellpakwith 100% product quality

Consumer SegmentHome Furnishings Business
Toys Business
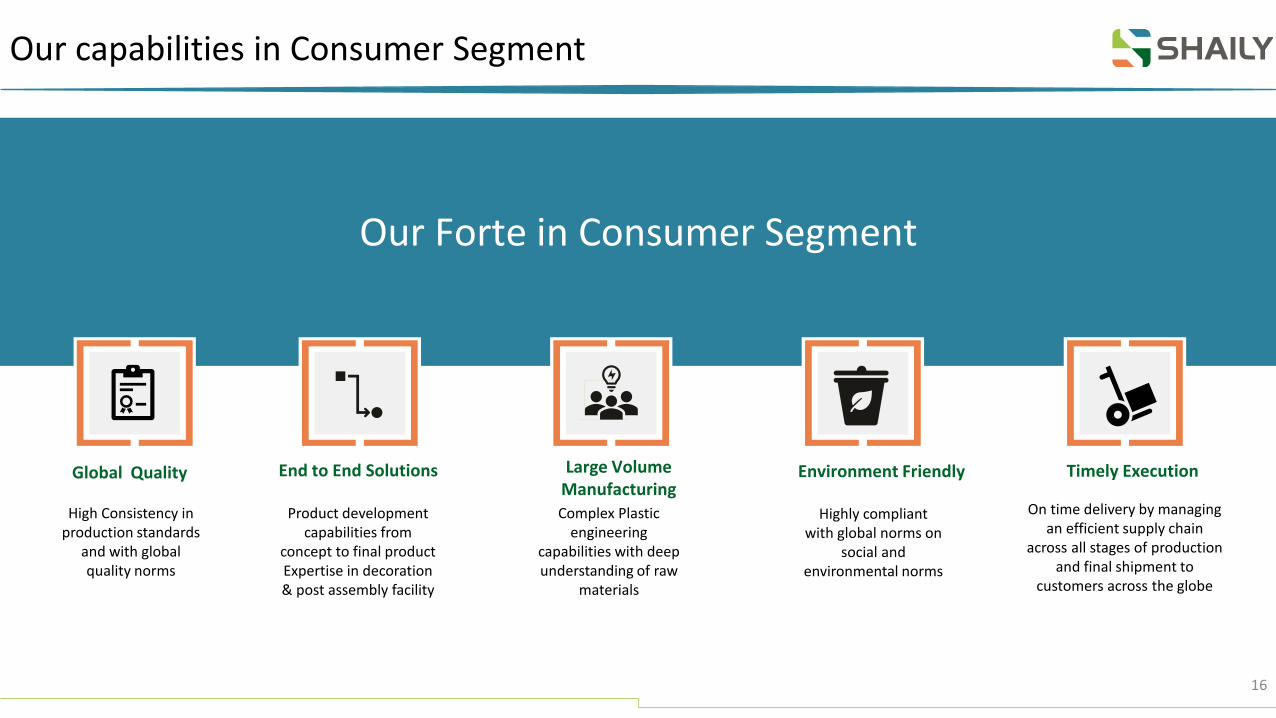
Our capabilities in Consumer Segment
16
Our Forte in Consumer Segment
On time delivery by managing an efficient supply chain
across all stages of production and final shipment to
customers across the globe
Timely Execution
Highly compliant with global norms on
social and environmental norms
Environment Friendly
High Consistency in production standards
and with global quality norms
Global Quality
Complex Plastic engineering
capabilities with deep understanding of raw
materials
Large Volume Manufacturing
Product development capabilities from
concept to final productExpertise in decoration & post assembly facility
End to End Solutions
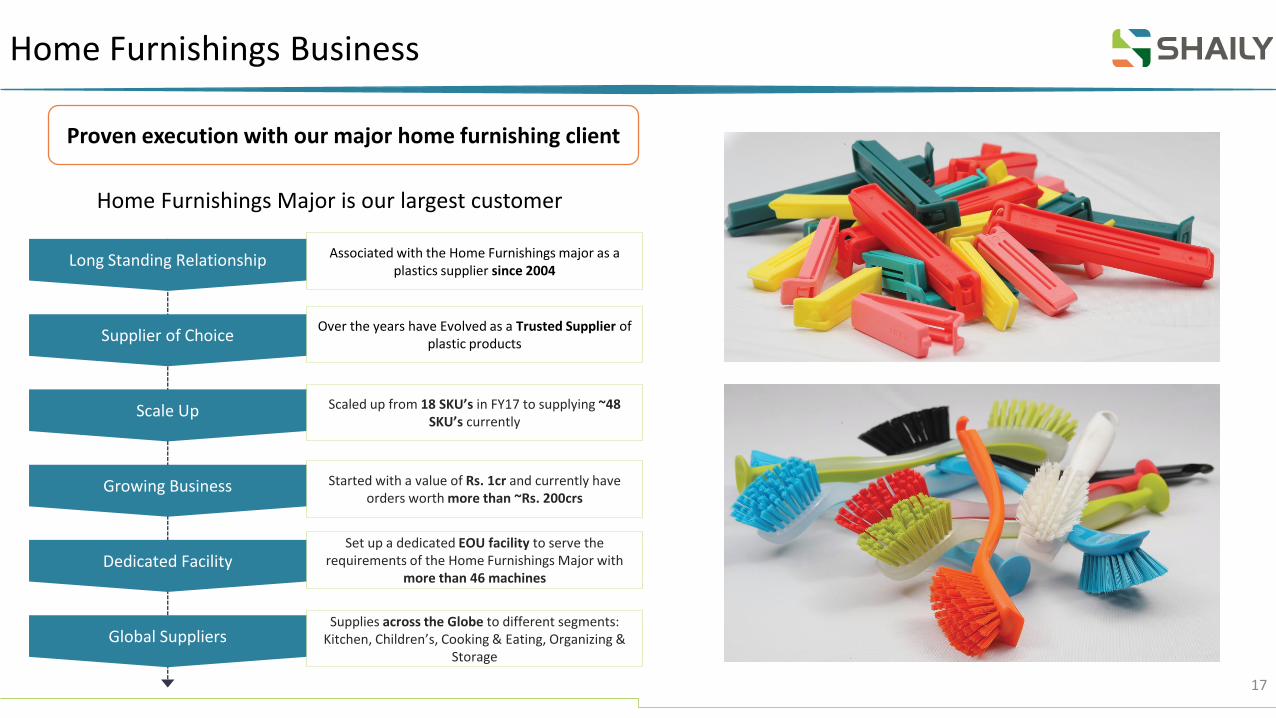
Home Furnishings Business
17
Long Standing Relationship
Supplier of Choice
Home Furnishings Major is our largest customer
Proven execution with our major home furnishing client
Scale Up
Growing Business
Dedicated Facility
Global Suppliers
Over the years have Evolved as a Trusted Supplier of plastic products
Associated with the Home Furnishings major as a plastics supplier since 2004
Scaled up from 18 SKU’s in FY17 to supplying ~48 SKU’s currently
Started with a value of Rs. 1cr and currently have orders worth more than ~Rs. 200crs
Set up a dedicated EOU facility to serve the requirements of the Home Furnishings Major with
more than 46 machines
Supplies across the Globe to different segments: Kitchen, Children’s, Cooking & Eating, Organizing &
Storage

Toys Business
18
About Spin Master
Added Spin Master as our 1st client in Toys Business. Spin Master is a leading global,
diversified, multi-platform and highly innovative children's entertainment company and is
regarded amongst the top toy companies in the world
Business Potential
The Toys segment possesses huge growth opportunities
Order Flow
❑ Shaily received first order from Spin Masterduring Q1FY20
❑ Initial shipments were made in Q3FY20
❑ We expect to further ramp up this business inFY22
The Global Toys market is expected to gain strong momentum in the coming decade
Quality
Shaily manufactured Children's Products comply with the highest international standards
Toys Segment Scope of growth in Toy Industry
Opportunity for Shaily
❑ Increasing children’s programs and TVchannels are expected to drive demand fortoys
❑ Baby toys becoming smarter designedspecifically for learning purposes
❑ Global toy companies are anticipated todiversify outsourcing to India, seen as thealternative manufacturing hub
❑ Products quality comply with the highestinternational standards, making us supplierof choice across the globe
Trend
The top toy companies are focusing on developing new products, mergers and acquisitions, as well as
partnering with local or regional players, to optimise their offerings.

Personal Care

Personal Care Business – Our Capabilities
20
Ultrasonic WeldingUltrasonic welding service available on a range of
polymers and can be incorporated in line with injection molding
Vacuum MetalisingTop quality metal finish to plastics through an
automated metalising facility
PaintingSpecialized paint lines suitable for many types of
polymers
Hot Stamping & Hot FoilingSpecial ink or foil finish available in the hot stamping
facility. This operation includes robotic control to speed up the handling process
High Speed Rotary Pad PrintingHigh-tech printing machines provide a full-colour finish
to a wide variety of polymers. For optimum print quality, the machines are located in a temperature and
humidity controlled environment
Screen PrintingSemi-automated, high-quality, single or multi-color screen printing onto cylindrical or flat components
Our Personal Care Clients & Services
21Disclaimer: The Brand Names and respective Logos mentioned are the property of their respective owners and are used here for identification purposes only
Servicing global FMCG majors such as Unilever and P&G since
early 90s
Products Manufactured
• Primary Packaging for cosmetics
• Primary Packaging for Vicks• Razor handles for Gillette• Trigger Sprays & Pumps

Healthcare SegmentPharma Devices
Pharma Packaging

Our capabilities in Healthcare Segment
23
Our Forte in Healthcare Segment
Quality & ComplianceDrug Delivery Devices- Contract
Manufactring- IP Related Product
Development
Dedicated FacilityIn-House Research &
Development Division
Primary Packaging

Drug Delivery Devices
24
Manufacturing of complex precision components and assembliesrequiring stringent quality and tight tolerances
One of the leading Injection Molding Companies in Medical Devices field Globally
We have the expertise in assistingclients with Compliance & Regulatoryfilings
Our vision is to design, develop andmanufacture high quality & costeffective healthcare devices in order toincrease our customers’competitiveness
Ventured into devices segment in early 2000 and today are oneof the few suppliers globally. Manufacture products like DPI’s,Pen Injectors, and Primary Packaging
Our Value Proposition
Comprehensive Design Review
Collaborative Tool Design & Manufacturing
Innovative Assembly Solutions
Efficient Supply Chain

Drug Delivery Devices
25
2 step Autoinjector withcustomization options
Shaily Tristan Autoinjector
0-80 IU Insulin Reusable/ Disposable, Single doseand Multidose AlternateTherapies ( Semaglutide,Liraglutide )
ShailyPen Harmony
0-60 IU Insulin Reusable/ Disposable, Settable foralternate therapies – 3dose, 2 dose and singledose GLP-1- Liraglutide,Abaloparatide )
ShailyPen Protean
0-80 IU Insulin Reusable/ Disposable, Single doseand Multidose AlternateTherapies
ShailyPen Maxim
for hGh, FSH, PTH andGLP-1 Therapies
ShailyPen Axiom
Shaily offers a comprehensive range of technologies, solutions and services for patient-centric and cost-effective self-medication injection systems

Drug Delivery Devices – New Order
26
First Non-European INSULIN PENS
❑ Equipped world’s first Insulin Pen that is made up of 100% plasticcomponents
❑ Pens were designed to meet UL & FDA approvals
❑ Pens are ISO 11608 1,2&3 certified
❑ Shaily is one of the very few manufacturers of Insulin pens in the Worldtoday
❑ Shaily in association with IDC designed & engineered an insulin pen forWockhardt
❑ Post Wockhardt success, Shaily started manufacturing Insulin pens for Sanofi
❑ These are marketed by Sanofi as “AllStar pens”
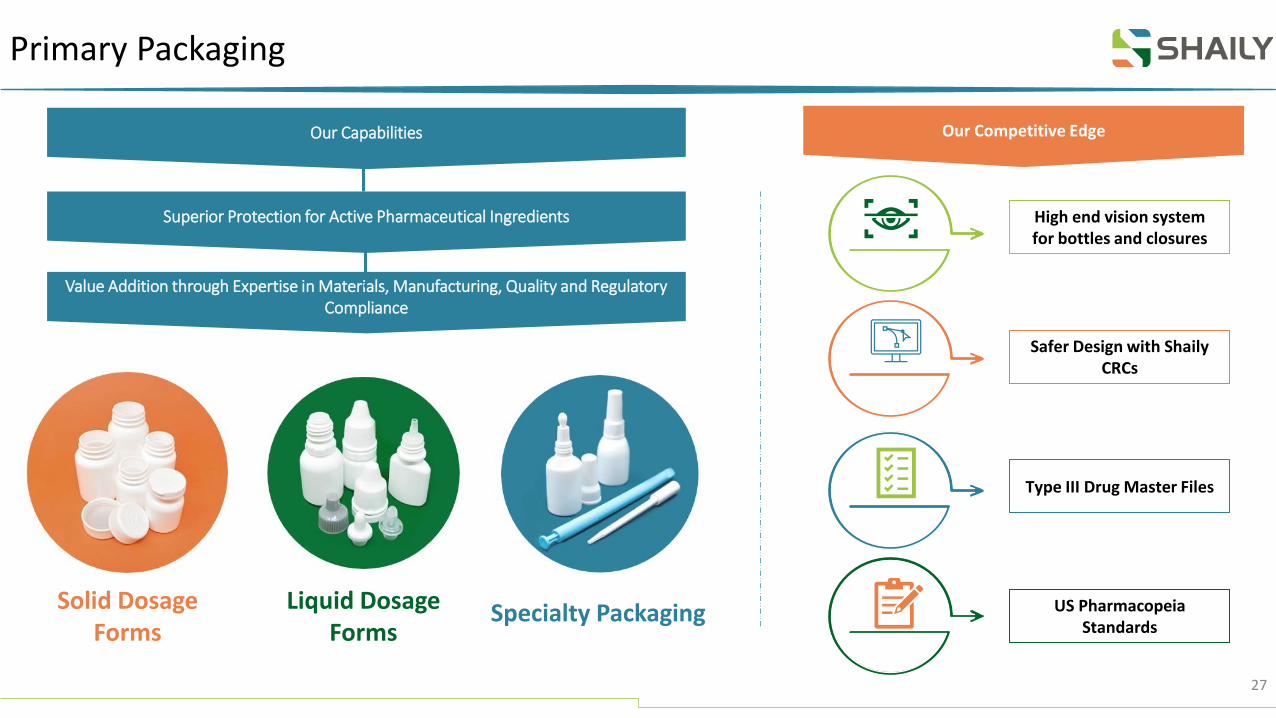
Primary Packaging
27
Our Capabilities Our Competitive Edge
Superior Protection for Active Pharmaceutical Ingredients
Solid Dosage Forms
Liquid DosageForms
Specialty Packaging
Value Addition through Expertise in Materials, Manufacturing, Quality and Regulatory Compliance
High end vision systemfor bottles and closures
Safer Design with Shaily CRCs
Type III Drug Master Files
US Pharmacopeia Standards

Our Healthcare Clients
28Disclaimer: The Brand Names and respective Logos mentioned are the property of their respective owners and are used here for identification purposes only

Healthcare segment – Way Forward
29
Industry Growth
Building Strong Relationship
Growth Drivers
Developing our R&D
End-Market
Increasing demand for pharmaceutical devices & packaging productsdue to rising geriatric population, growing chronic diseases,increasing number of diabetic patients, etc.
Expansion of the generic market, technological advancement &strict government regulations for conventional packaging aremajor factors that drive market growth
Our key partners for device development in the UK & Taiwancontinue to build upon their capabilities to ensure that they canaid Shaily in the successful & sustainable development of nextgeneration platforms.
Our ability to develop IP & our own pen injector platformsare finally paying offWe have a total of 5 pen injector platforms for variousmolecules today and are working towards developing an autoinjector
Capabilities include supplies to ophthalmic brands, skin care brands & CRC and specialized packaging applications
Automotive &Engineering

Automotive & Engineering Business
31
At Shaily our efforts in the automotive segment is geared towards light weighting the vehicle
AutomotiveApplications in the turbo chargers of high-end luxury
cars
Engineering PlasticsManufacturing high value-added products from ultra-
high-performance engineering plastics
Unique Molding ProcessProprietary molding process to manufacture
components from Torlon and PEEK
ToolingYears of expertise in designing and developing
moulds, with a focus on mould flow analysis and design for manufacture
Assembly SolutionsComplete molding and assembly solutions with manual, semi-automated and fully automated processes to reduce cost and promote quality
Metal to Plastic ConversionOutstanding solutions to replace metal with high
strength plastic, resulting in greater productivity and cost savings

Our Automotive & Engineering Plastics Clients
32Disclaimer: The Brand Names and respective Logos mentioned are the property of their respective owners and are used here for identification purposes only

Steel FurnitureCarbon Steel Furniture

Building New Capabilities and Diversity in Orderbook
34
Newly Added Business Segment
❑ Received confirmation for manufacture & supply of Carbon Steelproducts from Swedish Home Furnishings Major in Q1FY19
❑ Signifies immense faith placed by the customer in our capabilitiesand execution skills
Facility Commissioned at Halol, Gujarat
❑ Investment of Rs. 55 Crs.
❑ Phase 1 plant is built in 70,000 sq ft area (total land ofthe facility is 8L sq ft
❑ 600 tons of RM steel processed / annum
❑ Started commercial production in Q3FY21
Order Details
❑ Order for 6 new products which has scope to grow in future
❑ Estimated sales value of the order is over Rs. 100 Crs.
New Carbon Steel Facility at Halol
Glimpse of our Carbon Steel Products

Our Manufacturing Capabilities, Key Differentiators
& Growth Drivers

State-of-the-Art Manufacturing Facilities
36
GUJARATHalol
Rania
6 Facilities with over 140 molding machines ranging from 35 tons to 1,000 tons
Halol (New)
❖ Carbon Steel❖ New Plastic Facility under construction
Rania
❖ Export Oriented Unit❖ Pharma (Dedicated ISO Class 8 clean
room manufacturing facility)❖ Others
Halol (Existing)
❖ Automotive & Engineering
Disclaimer: Maps not to scale. All data, information, and maps are provided "as is" without warranty or any representation of accuracy, timeliness or completeness.

We are focused on Sustainable Development
37
We believe in Businessoperations that have apositive impact on thePlanet and People
Lean Sigma forms asignificant part of ourstrategy resulting inimprovement acrossBusiness landscape
In 2017, we were able to usemore than 50% of our energyrequirement from Renewablesources
We have also been successful in beingable to convert products manufacturedfromvirgin materials to both recycled plasticsas well as bioplastics
Our Goal is to constantly improve ourProcesses in a way that results inreduction in power, water and othernatural essential resources
SOCIALLY AND ENVIRONMENT RESPONSIBILITY IS OUR DNA

Board of Directors
38
Mr. Amit Sanghvi
Managing Director
Ms. Tilottama Sanghvi
Whole Time Director
Mr. Ranjit Singh
Independent Director
Ms. Varsha Purandare
Independent Director
Mr. Mahendra Sanghvi
Executive Chairman
Mr. Laxman Sanghvi
Executive Director
Mr. Milin Mehta
Independent Director
Dr. Shailesh Ayyangar
Independent Director

Strong Credit Rating
39
Sustainable healthy operating margin along with
strengthening leverage and debt coverage
indicators
Growth in Total operating income on the back of
increased volumes & higher exports
Long and established track record in the plastic
injection molding business along with experienced
Promoters
New business confirmations from existing clients
along with addition of marquee clients across
diversified industries
Sustainable healthy operating margin along with
strengthening leverage and debt coverage
indicators
UPGRADED Bank Facilities
to CARE A- and CARE A2+
with Stable Outlook
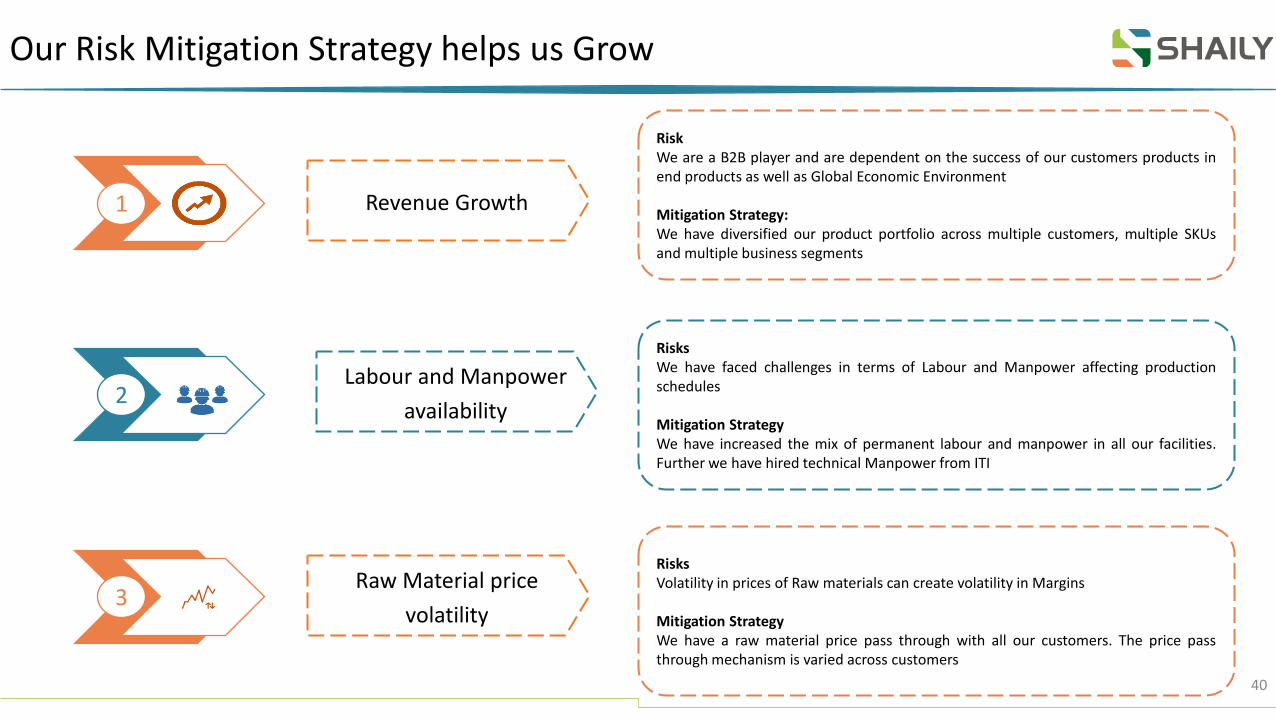
Our Risk Mitigation Strategy helps us Grow
40
Revenue Growth
Labour and Manpower
availability
Raw Material price
volatility
RiskWe are a B2B player and are dependent on the success of our customers products inend products as well as Global Economic Environment
Mitigation Strategy:We have diversified our product portfolio across multiple customers, multiple SKUsand multiple business segments
RisksWe have faced challenges in terms of Labour and Manpower affecting productionschedules
Mitigation StrategyWe have increased the mix of permanent labour and manpower in all our facilities.Further we have hired technical Manpower from ITI
RisksVolatility in prices of Raw materials can create volatility in Margins
Mitigation StrategyWe have a raw material price pass through with all our customers. The price passthrough mechanism is varied across customers
1
2
3

Our Way Forward is… Clear !
41
Revenue Uptick
Sustained uptick in Revenue based on New business confirmations, addition of new clients and increased
contribution from New business segment
Sustainable EBITDA Margin
EBITDA margin should be sustainable on annual basis on back of higher utilizations in existing
facilities and increasing contribution from Healthcare segment
Vast Experience and Capabilities
Varied manufacturing experience across multiple segments, long standing Global relationships,
complex engineering capabilities and consistent delivery, we are a highly competent Manufacturer
Increased Healthcare Revenue
Expect 2-3x revenue growth from Healthcare segment on back of faster penetration within
existing and new clients as well as large pipeline of products
Uptick in Profitability
Limited investment in capex, faster capacity utilization in Carbon Steel business and Healthcare business to lead to an uptick in Return ratios and
profitability
Benefit under Make in INDIA
Global majors to increasingly outsource manufacturing to India and create alternate
manufacturing hubs

Key Financial Highlights

Witnessed strong Revenue recovery in FY21
(Rs. Cr.)
46.6
98.7
105.5109.8
Q1FY21 Q4FY21Q2FY21 Q3FY21
+112%
+7%+4.0%
Commercialization of orders, bagged in FY20, led to recovery and sustained uptick in Revenues in FY21
43

Key Financial Highlights – Q4FY21
Revenue Gross Margin % EBITDA(Rs. Cr.) (Rs. Cr.)
79.6
105.5 109.8
Q4FY20 Q3FY21 Q4FY21
+38% 44.938.9
42.4
Q4FY21Q4FY20 Q3FY21
15.018.9
22.1
Q4FY20 Q3FY21 Q4FY21
+47%
EBITDA Margin % PAT Cash PAT #
18.8 17.920.1
Q3FY21Q4FY20 Q4FY21
7.08.0
9.7
Q4FY20 Q3FY21 Q4FY21
+39%
11.612.8
15.3
Q4FY20 Q3FY21 Q4FY21
+32%
(Rs. Cr.)
#Cash PAT includes PAT & Depreciation 44

Key Financial Highlights – FY21
Revenue Gross Margin % EBITDA(Rs. Cr.) (Rs. Cr.)
336.0360.6
FY21FY20
+7%41.1 40.3
FY20 FY21
-2%
59.1 62.1
FY20 FY21
+5%
EBITDA Margin % PAT Cash PAT #
17.6 17.2
FY21FY20
-2%
23.622.0
FY20 FY21
-7%41.5 41.5
FY20 FY21
0%(Rs. Cr.)
#Cash PAT includes PAT & Depreciation45

Utilization & Volume
Machine Utilization – Across Plants (%)
Volume of Polymers Processed (MT)
6470
Q4FY21Q4FY20 Q3FY21
56*
3,267
4,444 4,356
Q4FY20 Q3FY21 Q4FY21
13,29314,602
FY20 FY21
64
FY21FY20
58*
* Owing to additional capacity in place at Rania & Halol, utilization rate has come down, it will ramp up in the coming quarters
46

Operational Trends
6774
69 64
FY17 FY18
58*
FY21FY19 FY20
Machine Utilization (%)
Volumes of Polymers Processed (MT)
10,054
13,039 13,258 13,29314,602
FY19FY17 FY20FY18 FY21
* Owing to additional capacity in place at Rania & Halol, utilization rate has come down, it will ramp up in the coming quarters
47

Revenue Analysis - Domestic Vs. Exports
FY20 FY21
74%
26%
Sales
Export Domestic
69%
31%
Sales
Export Domestic
48

Profit & Loss Statements
49* Other Expenses include Power & Fuel costs ^ Cash PAT = PAT + Depreciation
Particulars (Rs. Cr.) Q4FY21 Q4FY20 YoY % Q3FY21 QoQ % FY21 FY20 YoY %
Revenue 109.8 79.6 37.9% 105.5 4.0% 360.6 336.0 7.3%
Raw Material 63.2 43.9 64.5 215.3 197.9
Employee Expenses 10.1 6.9 9.0 34.2 26.0
Other Expenses* 16.8 13.6 13.2 51.6 54.1
Other Income 2.4 -0.2 0.0 2.6 1.0
EBITDA 22.1 15.0 47.4% 18.9 16.8% 62.1 59.1 5.2%
EBITDA Margin 20.1% 18.8% 17.9% 17.2% 17.6%
Depreciation 5.6 4.7 4.8 19.5 17.9
Finance Cost 3.3 2.8 3.4 12.7 10.5
PBT 13.2 7.6 74.3% 10.7 22.7% 29.9 30.7 -2.7%
PBT Margin 12.0% 9.5% 10.2% 8.3% 9.1%
Tax 3.5 0.6 2.7 7.9 7.1
PAT 9.7 7.0 39.3% 8.0 20.9% 22.0 23.6 -6.7%
PAT Margin 8.8% 8.7% 7.6% 6.1% 7.0%
Cash PAT^ 15.3 11.6 31.8% 12.8 19.8% 41.5 41.5 0.1%
Cash PAT Margin 14.0% 14.6% 12.1% 11.5% 12.3%

Balance Sheet
50
Particulars in (Rs. Cr.) Mar-21 Mar-20
Assets
Non-current Assets 290.2 220.9
Fixed Assets
Property Plant & Equipment 220.9 154.9
Capital WIP 23.1 37.2
Intangible Assets 13.3 10.9
Financial Assets
Investments 0.0 0.2
Loans & Advances 0.5 0.5
Other Non-current Assets 28.5 14.0
Income Tax assets (net) 4.0 3.2
Current Assets 176.8 160.6
Inventories 66.9 49.7
Financial Assets
Trade Receivables 69.5 61.0
Cash & cash equivalents 1.0 7.0
Loans & Advances 7.1 16.9
Other Current Assets 32.4 26.0
Total Assets 467.0 381.5
Particulars (Rs. Cr.) Mar-21 Mar-20
Equity & Liabilities
Equity 181.9 159.4
Share Capital 8.3 8.3
Other Equity 173.5 151.1
Non-Current Liabilities 142.7 81.3
Financial Liabilities
Borrowings 128.4 72.1
Deferred Tax Liabilities (Net) 10.3 7.3
Other Non-Current Liabilities 2.5 0.4
Provisions 1.6 1.5
Current Liabilities 142.5 140.8
Financial Liabilities
Borrowings 44.9 50.6
Trade Payables 46.6 51.2
Other Financial Labilities 40.2 24.6
Other Current Liabilities 10.0 13.8
Provisions 0.9 0.7
Total Equity & Liabilities 467.0 381.5
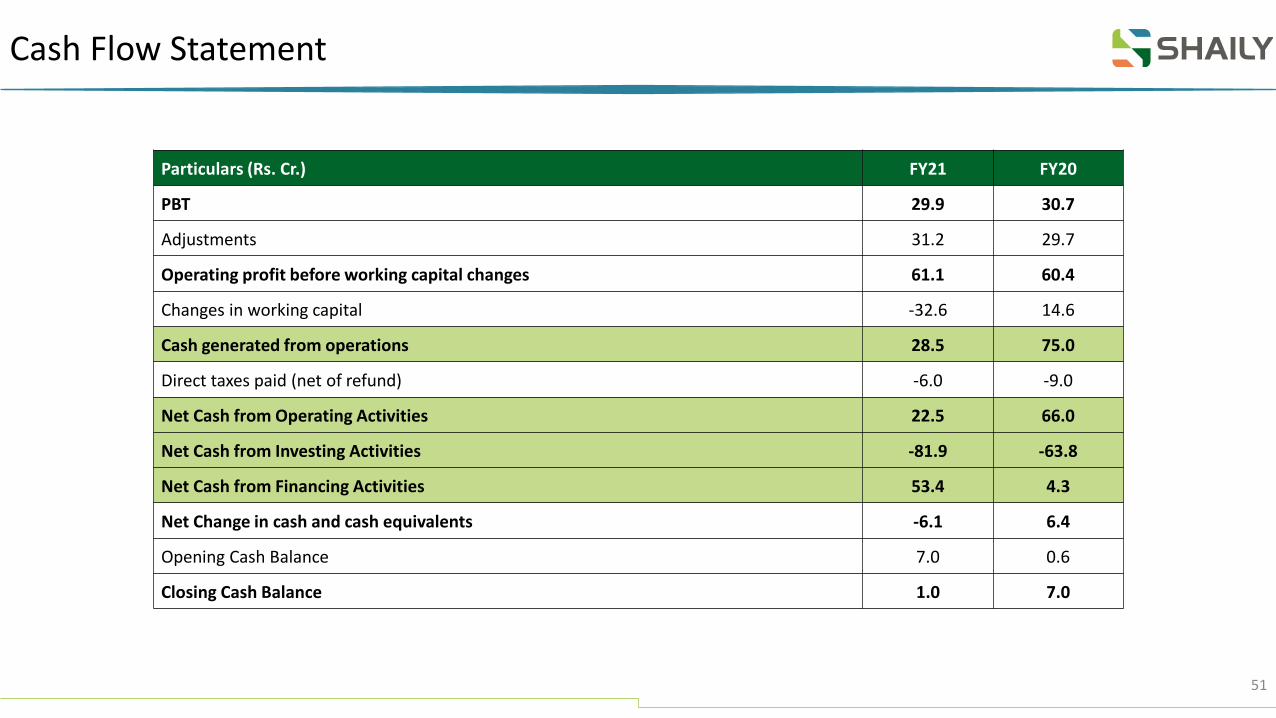
Cash Flow Statement
51
Particulars (Rs. Cr.) FY21 FY20
PBT 29.9 30.7
Adjustments 31.2 29.7
Operating profit before working capital changes 61.1 60.4
Changes in working capital -32.6 14.6
Cash generated from operations 28.5 75.0
Direct taxes paid (net of refund) -6.0 -9.0
Net Cash from Operating Activities 22.5 66.0
Net Cash from Investing Activities -81.9 -63.8
Net Cash from Financing Activities 53.4 4.3
Net Change in cash and cash equivalents -6.1 6.4
Opening Cash Balance 7.0 0.6
Closing Cash Balance 1.0 7.0
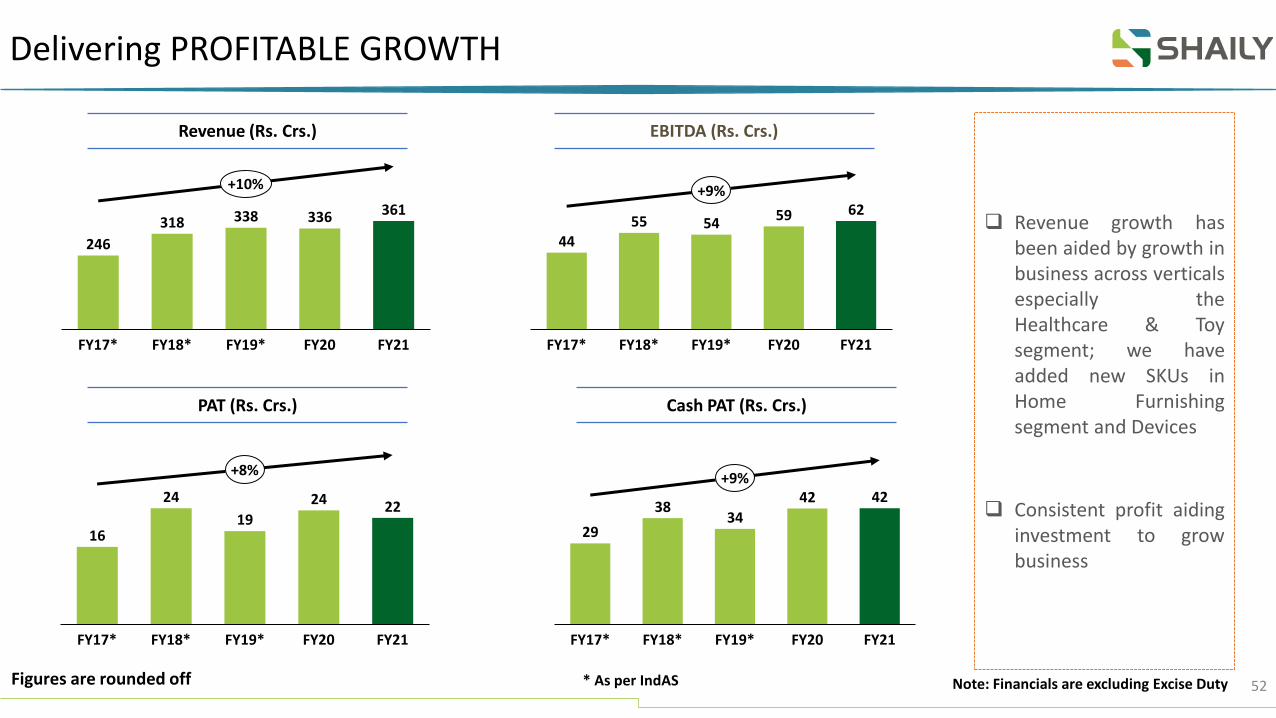
Delivering PROFITABLE GROWTH
Note: Financials are excluding Excise Duty* As per IndAS
246
318 338 336 361
FY18*FY17* FY21FY19* FY20
+10%
4455 54
59 62
FY20FY17* FY21FY18* FY19*
+9%
16
24
19
24 22
FY19*FY17* FY18* FY20 FY21
+8%
29
3834
42 42
FY21FY20FY19*FY17* FY18*
+9%
Figures are rounded off
❑ Revenue growth hasbeen aided by growth inbusiness across verticalsespecially theHealthcare & Toysegment; we haveadded new SKUs inHome Furnishingsegment and Devices
❑ Consistent profit aidinginvestment to growbusiness
Revenue (Rs. Crs.) EBITDA (Rs. Crs.)
PAT (Rs. Crs.) Cash PAT (Rs. Crs.)
52

With sustainable MARGIN Profile and disciplined use of capital…
53
17.9%17.4%
16.1%
17.6% 17.2%
9.4%
10.8%
8.9% 9.1%8.3%
6.5%
7.5%
5.7%
7.0% 6.1%
0%
2%
4%
6%
8%
10%
12%
14%
16%
18%
20%
FY17 FY18 FY19 FY20 FY21
EBITDA% PBT% PAT%
Margins (%)
❑ Better Product mix and economies of scale on account of raw materials have led to improvement in margin profile from FY16 to FY21
❑ FY19 margin was profile impacted on account of labor shortage, power disruptions and change in ordering policy from a key client
❑ Witnessed improvement in margin from FY20 onwards on back of higher contribution from Healthcare segment and plant utilization

DISCIPLINED use of Capital
*As per IndAS
15.0
19.2
14.2
15.8
12.9
FY20*FY17* FY18* FY19* FY21*
17.7
19.6
16.917.8
15.7
FY20*FY18*FY17* FY19* FY21*
ROCE (%) ROE (%)
54

Growth Along With Low Leverage
0.2 0.2
0.3
0.5
0.7
FY20*FY18*FY17* FY19* FY21*
0.6
0.9 0.9 0.9
1.1
FY19*FY17* FY18* FY20* FY21*
1.61.9
2.22.4
3.2
FY19*FY17* FY20*FY18* FY21*
❑ The growth in Business has been achieved with disciplined use of capital
❑ The internal accruals also been utilized towards scheduled repayments of Long-term loans, which have positively impacted the credit rating therefore the borrowing costs
Total Debt : Equity (x) Long Term Debt : Equity (x) Total Debt : EBITDA (x)
*As per IndAS#Annualised 55

Strong Focus on Improving Our Key Metrics
87
73
8881
60
FY19*FY17* FY18* FY20* FY21*
2.5
3.0
2.32.2
1.6
FY19*FY17* FY18* FY21*FY20*
❑ The Fixed Asset Turnover has been inching up despite continuous capex (barring FY19) on back of improving utilization levels to cater to the new business wins across multiple segments of Home Furnishing, FMCG, Pharma
❑ Cash flow generation has been healthy resulting in capex spends from internal accruals
Fixed Asset Turnover (X) FCFF to EBITDA (%)
*As per IndAS56

Contact
57
Company : Investor Relations Advisors :
Shaily Engineering Plastics Ltd. CIN – L51900GJ1980PLC065554
Mr. Sanjay Shah, Chief Strategy [email protected]
www.shaily.com
Strategic Growth Advisors Pvt. Ltd.CIN - U74140MH2010PTC204285
Mr. Shogun Jain/ Ms. Akashi [email protected] / [email protected]+91 77383 77756 / +91 96198 96128www.sgapl.net

![Financial Results with Investor Update & Limited Review for Dec 31, 2014 (Standalone) [Result]](https://static.fdocuments.net/doc/165x107/577cb13b1a28aba7118b936c/financial-results-with-investor-update-limited-review-for-dec-31-2014-standalone.jpg)

![Financial Results with Investor Update & Limited Review for Sept 30, 2014 (Standalone) [Result]](https://static.fdocuments.net/doc/165x107/577cb13b1a28aba7118b936b/financial-results-with-investor-update-limited-review-for-sept-30-2014-standalone.jpg)


![Financial Results, Investor Update & Limited Review for June 30, 2014 (Standalone) [Result]](https://static.fdocuments.net/doc/165x107/577cb13b1a28aba7118b936a/financial-results-investor-update-limited-review-for-june-30-2014-standalone.jpg)

![Financial Results, Results Press Release, Investor Presentation & Limited Review Report for Sept 30, 2015 [Result]](https://static.fdocuments.net/doc/165x107/577cb0d71a28aba7118b4e98/financial-results-results-press-release-investor-presentation-limited-review.jpg)


![Financial Results, Results Press Release, Fact Sheet, Investor Presentation & Auditors Report for June 30, 2015. [Result]](https://static.fdocuments.net/doc/165x107/577cb2851a28aba7118c0dfe/financial-results-results-press-release-fact-sheet-investor-presentation.jpg)
![Financial Results, Investor Update & Limited Review Report for Sept 30, 2015 (Standalone) [Result]](https://static.fdocuments.net/doc/165x107/577ca7241a28abea748c40ae/financial-results-investor-update-limited-review-report-for-sept-30-2015.jpg)