Q4/FY 2019 results - Deutsche Bank · Q4 2019 results 30 January 2020 Deutsche Bank Investor...
48
Q4/FY 2019 results 30 January 2020 Deutsche Bank
Transcript of Q4/FY 2019 results - Deutsche Bank · Q4 2019 results 30 January 2020 Deutsche Bank Investor...
Q4/FY 2019 results30 January 2020
Deutsche Bank
Q4 2019 results 30 January 2020
Deutsche BankInvestor Relations
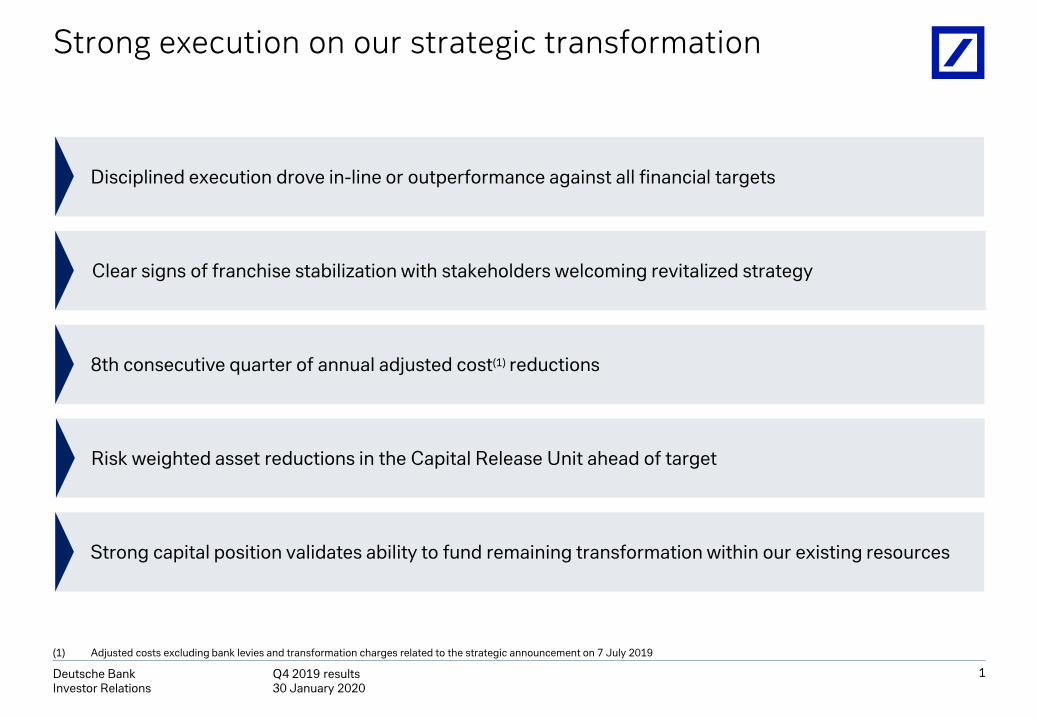
8th consecutive quarter of annual adjusted cost(1) reductions
Strong capital position validates ability to fund remaining transformation within our existing resources
Clear signs of franchise stabilization with stakeholders welcoming revitalized strategy
Disciplined execution drove in-line or outperformance against all financial targets
Strong execution on our strategic transformation
(1) Adjusted costs excluding bank levies and transformation charges related to the strategic announcement on 7 July 2019
1
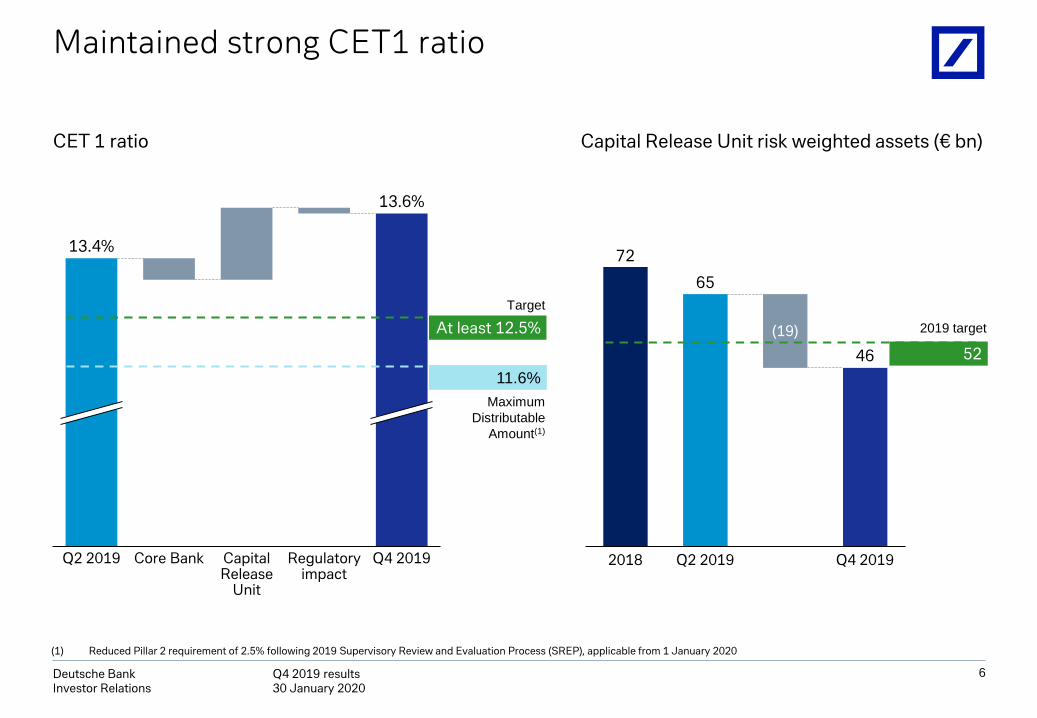
Risk weighted asset reductions in the Capital Release Unit ahead of target
Q4 2019 results 30 January 2020
Deutsche BankInvestor Relations
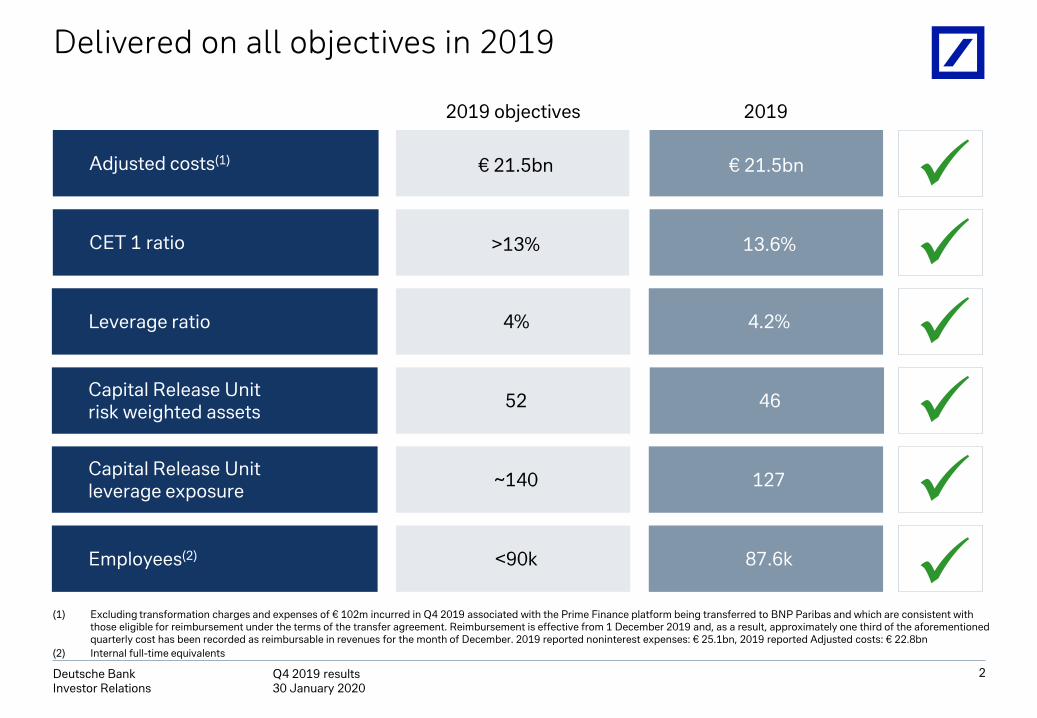
Delivered on all objectives in 2019
2
Adjusted costs(1)
CET 1 ratio
€ 21.5bn
13.6%
€ 21.5bn
>13%
Leverage ratio 4% 4.2%
20192019 objectives
(1) Excluding transformation charges and expenses of € 102m incurred in Q4 2019 associated with the Prime Finance platform being transferred to BNP Paribas and which are consistent with those eligible for reimbursement under the terms of the transfer agreement. Reimbursement is effective from 1 December 2019 and, as a result, approximately one third of the aforementioned quarterly cost has been recorded as reimbursable in revenues for the month of December. 2019 reported noninterest expenses: € 25.1bn, 2019 reported Adjusted costs: € 22.8bn
(2) Internal full-time equivalents
Capital Release Unitrisk weighted assets 52 46 Capital Release Unitleverage exposure ~140 127
Employees(2) <90k 87.6k
Q4 2019 results 30 January 2020
Deutsche BankInvestor Relations
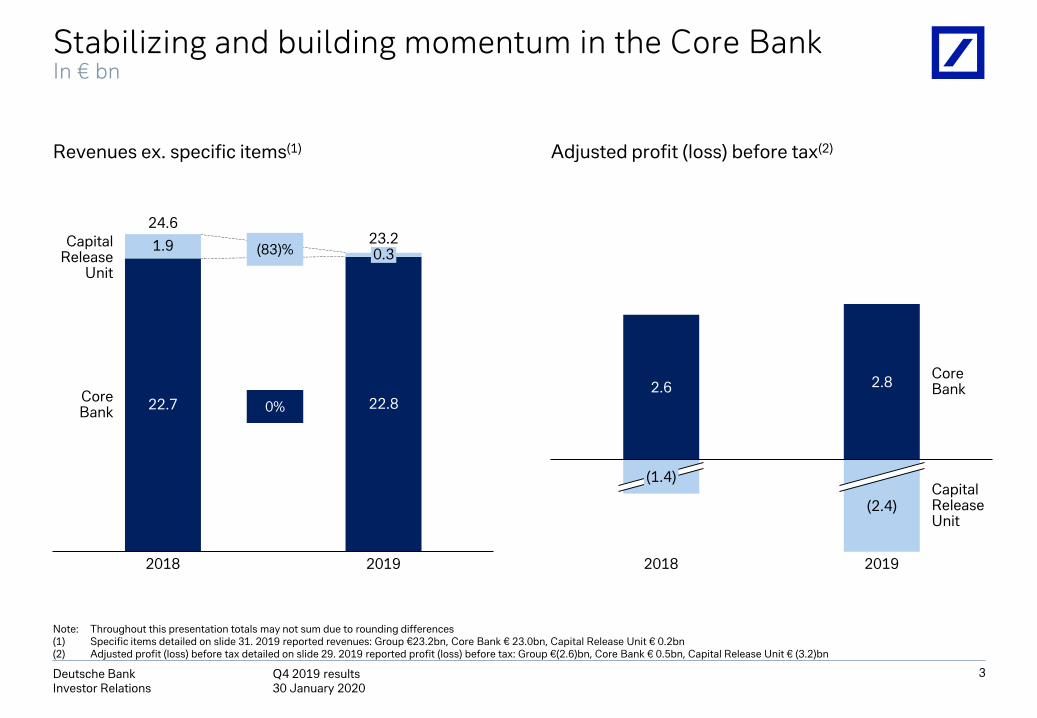
Stabilizing and building momentum in the Core BankIn € bn
Revenues ex. specific items(1) Adjusted profit (loss) before tax(2)
2019
0.3
CoreBank
1.9
22.7
2018
CapitalRelease
Unit
22.8
24.623.2
(1.4)
2.6 2.8
2018
(2.4)
2019
CapitalReleaseUnit
CoreBank
0%
(83)%
Note: Throughout this presentation totals may not sum due to rounding differences(1) Specific items detailed on slide 31. 2019 reported revenues: Group €23.2bn, Core Bank € 23.0bn, Capital Release Unit € 0.2bn (2) Adjusted profit (loss) before tax detailed on slide 29. 2019 reported profit (loss) before tax: Group €(2.6)bn, Core Bank € 0.5bn, Capital Release Unit € (3.2)bn
3
Q4 2019 results 30 January 2020
Deutsche BankInvestor Relations
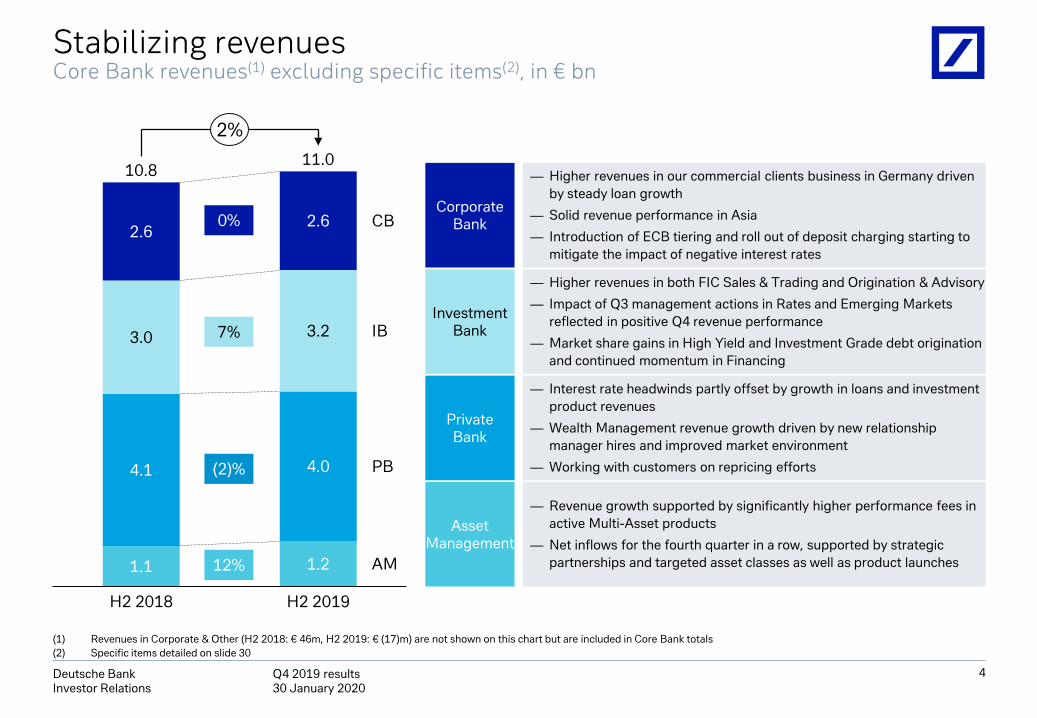
Stabilizing revenuesCore Bank revenues(1) excluding specific items(2), in € bn
(1) Revenues in Corporate & Other (H2 2018: € 46m, H2 2019: € (17)m) are not shown on this chart but are included in Core Bank totals (2) Specific items detailed on slide 30
Asset Management
— Revenue growth supported by significantly higher performance fees in active Multi-Asset products
— Net inflows for the fourth quarter in a row, supported by strategic partnerships and targeted asset classes as well as product launches
PrivateBank
— Interest rate headwinds partly offset by growth in loans and investment product revenues
— Wealth Management revenue growth driven by new relationship manager hires and improved market environment
— Working with customers on repricing efforts
Corporate Bank
— Higher revenues in our commercial clients business in Germany driven by steady loan growth
— Solid revenue performance in Asia
— Introduction of ECB tiering and roll out of deposit charging starting to mitigate the impact of negative interest rates
Investment Bank
— Higher revenues in both FIC Sales & Trading and Origination & Advisory
— Impact of Q3 management actions in Rates and Emerging Markets reflected in positive Q4 revenue performance
— Market share gains in High Yield and Investment Grade debt originationand continued momentum in Financing
4
AM
3.0
2.6
4.1
H2 2018
1.1
2.6
3.2
4.0
1.2
H2 2019
CB
IB
PB
10.811.0
2%
0%
7%
(2)%
12%
Q4 2019 results 30 January 2020
Deutsche BankInvestor Relations
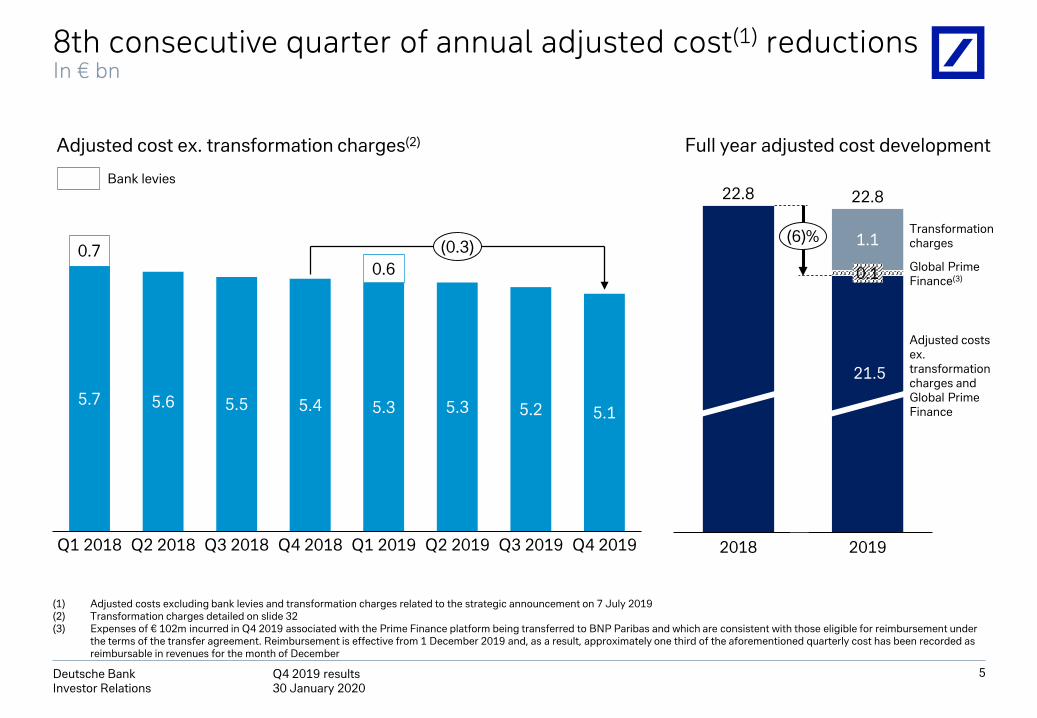
8th consecutive quarter of annual adjusted cost(1) reductionsIn € bn
5
Full year adjusted cost development
1.1
22.8
2018 2019
22.8
(6)%
Q2 2018
5.2
Q2 2019
5.4
Q3 2018
0.7
5.7
Q4 2018Q1 2018
5.55.6
0.6
5.3
Q1 2019 Q3 2019
5.3 5.1
Q4 2019
(0.3)
0.1 Global Prime Finance(3)
Transformation charges
21.5
Adjusted cost ex. transformation charges(2)
Adjusted costs ex. transformation charges and Global Prime Finance
Bank levies
(1) Adjusted costs excluding bank levies and transformation charges related to the strategic announcement on 7 July 2019(2) Transformation charges detailed on slide 32(3) Expenses of € 102m incurred in Q4 2019 associated with the Prime Finance platform being transferred to BNP Paribas and which are consistent with those eligible for reimbursement under
the terms of the transfer agreement. Reimbursement is effective from 1 December 2019 and, as a result, approximately one third of the aforementioned quarterly cost has been recorded as reimbursable in revenues for the month of December
Q4 2019 results 30 January 2020
Deutsche BankInvestor Relations
Maintained strong CET1 ratio
6
Q2 2019 Core Bank Capital Release
Unit
Regulatory impact
Q4 2019
13.4%
13.6%
(1) Reduced Pillar 2 requirement of 2.5% following 2019 Supervisory Review and Evaluation Process (SREP), applicable from 1 January 2020
Capital Release Unit risk weighted assets (€ bn)
72
65
Q4 20192018 Q2 2019
(19)
46
CET 1 ratio
Maximum Distributable
Amount(1)
11.6%
At least 12.5%Target
52
2019 target
Q4 2019 results 30 January 2020
Deutsche BankInvestor Relations
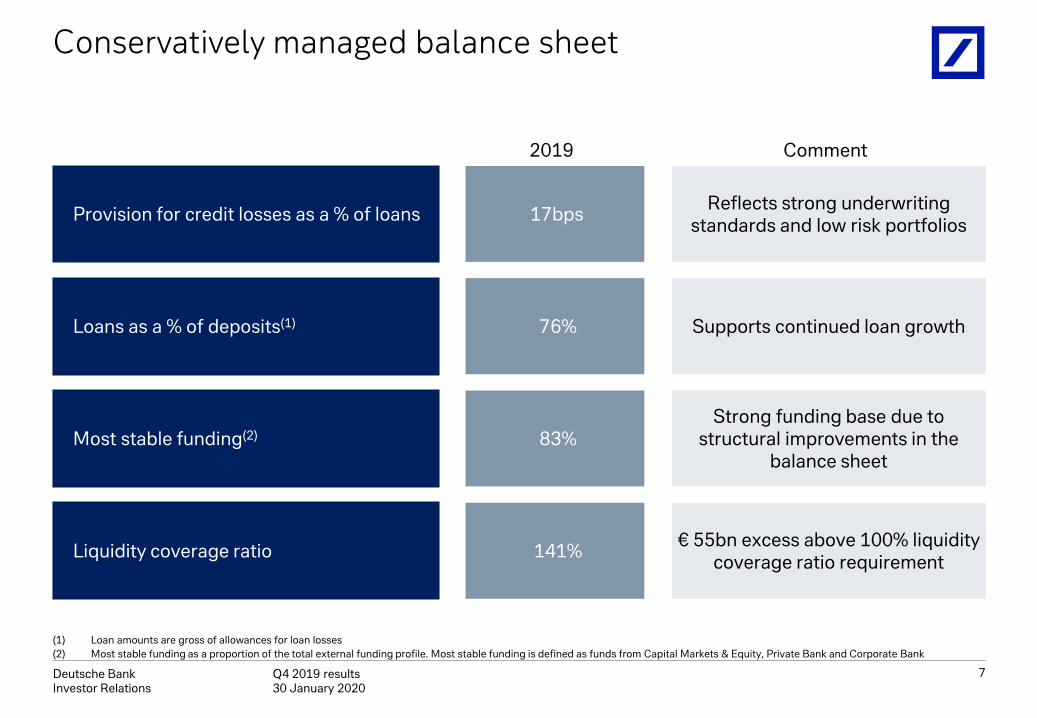
Conservatively managed balance sheet
7
Most stable funding(2)Strong funding base due to
structural improvements in the balance sheet
141%
Loans as a % of deposits(1) 76% Supports continued loan growth
Provision for credit losses as a % of loans 17bps Reflects strong underwriting standards and low risk portfolios
Comment2019
(1) Loan amounts are gross of allowances for loan losses(2) Most stable funding as a proportion of the total external funding profile. Most stable funding is defined as funds from Capital Markets & Equity, Private Bank and Corporate Bank
Liquidity coverage ratio
83%
€ 55bn excess above 100% liquidity coverage ratio requirement
Q4 2019 results 30 January 2020
Deutsche BankInvestor Relations
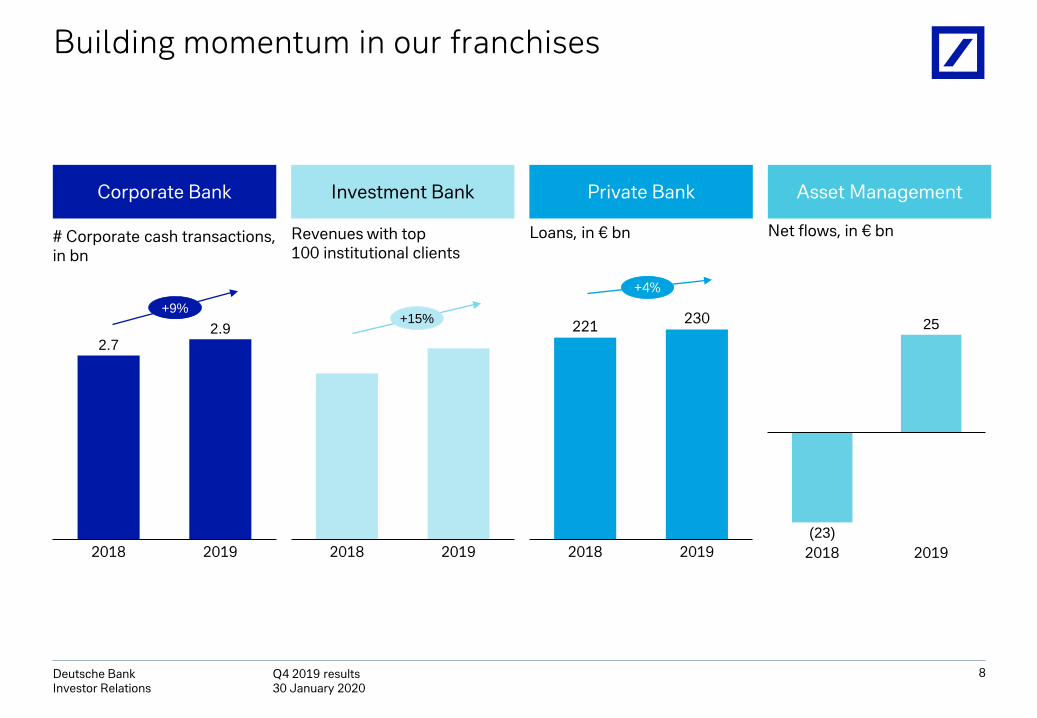
Building momentum in our franchises
8
Corporate Bank Investment Bank Private Bank Asset Management
Revenues with top 100 institutional clients
2018 2019
+15%
2018 2019
221 230
+4%
Loans, in € bn
(23)
25
2018 2019
Net flows, in € bn
2.72.9
2018 2019
# Corporate cash transactions, in bn
+9%
Q4 2019 results 30 January 2020
Deutsche BankInvestor Relations
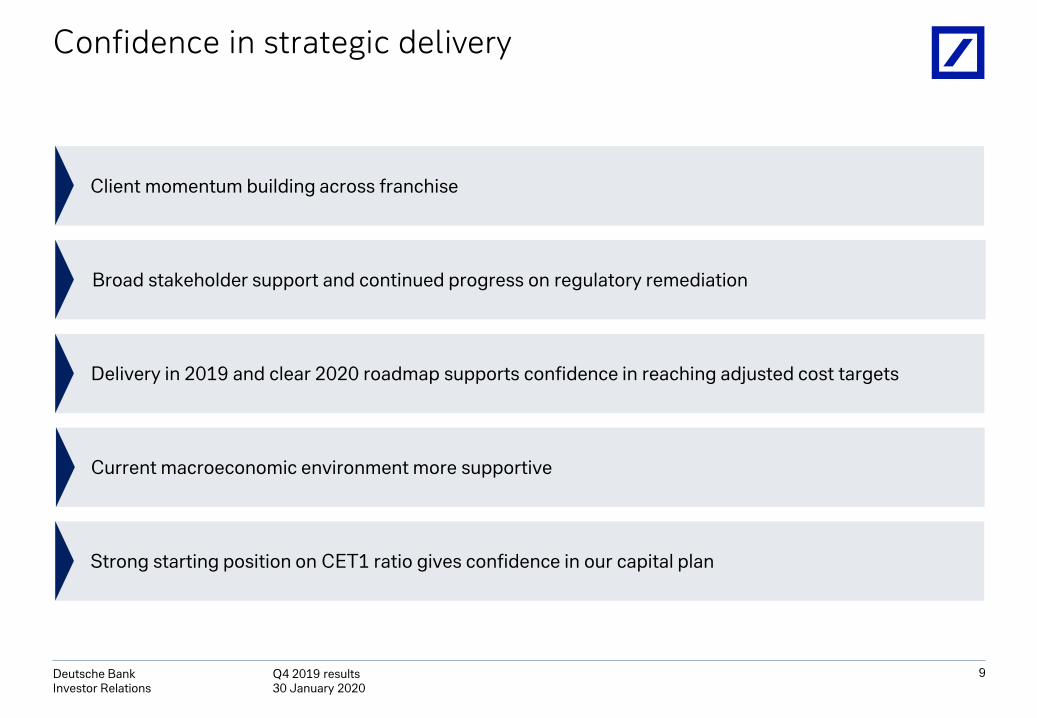
Delivery in 2019 and clear 2020 roadmap supports confidence in reaching adjusted cost targets
Broad stakeholder support and continued progress on regulatory remediation
Current macroeconomic environment more supportive
Strong starting position on CET1 ratio gives confidence in our capital plan
Client momentum building across franchise
Confidence in strategic delivery
9
Q4 2019 results 30 January 2020
Deutsche BankInvestor Relations
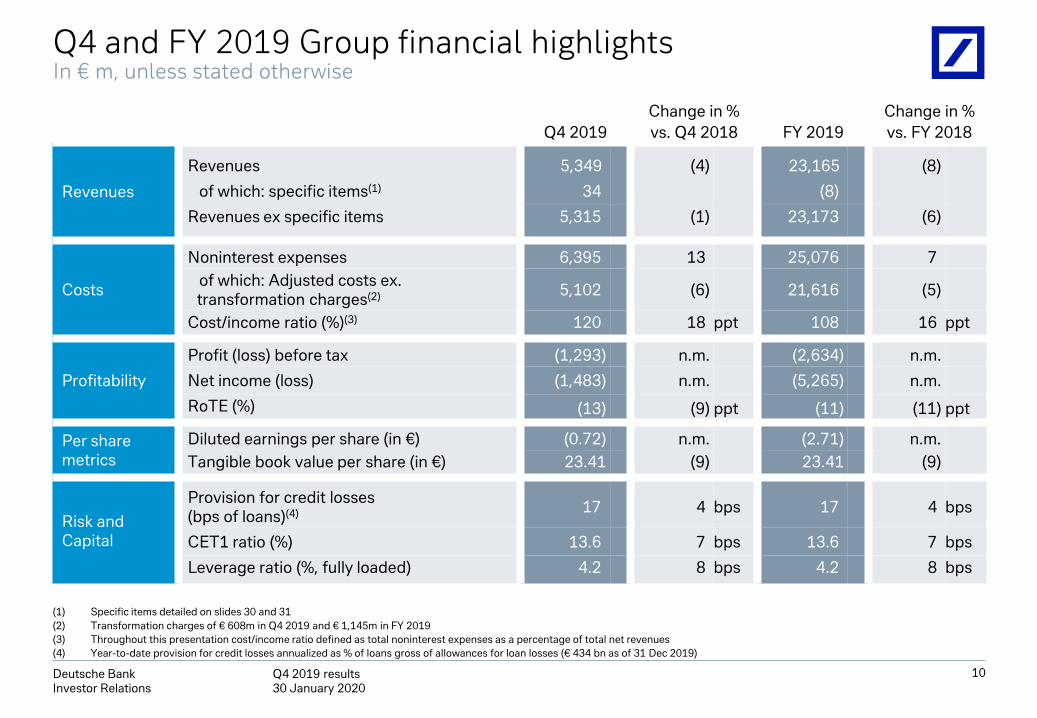
Q4 and FY 2019 Group financial highlightsIn € m, unless stated otherwise
10
Change in % Change in %Q4 2019 vs. Q4 2018 FY 2019 vs. FY 2018
Revenues
Revenues 5,349. (4) 23,165. (8)
of which: specific items(1) 34( (8)(
Revenues ex specific items 5,315( (1) 23,173( (6)
Costs
Noninterest expenses 6,395( 13. 25,076( 7.of which: Adjusted costs ex. transformation charges(2) 5,102( (6) 21,616( (5)
Cost/income ratio (%)(3) 120( 18. ppt 108( 16. ppt
Profitability
Profit (loss) before tax (1,293) n.m. (2,634) n.m.
Net income (loss) (1,483) n.m. (5,265) n.m.
RoTE (%) (13) (9) ppt (11) (11) ppt
Per sharemetrics
Diluted earnings per share (in €) (0.72) n.m. (2.71) n.m.Tangible book value per share (in €) 23.41 (9) 23.41 (9)
Risk and Capital
Provision for credit losses(bps of loans)(4) 17( 4. bps 17( 4. bps
CET1 ratio (%) 13.6( 7. bps 13.6( 7. bps
Leverage ratio (%, fully loaded) 4.2( 8. bps 4.2( 8. bps
(1) Specific items detailed on slides 30 and 31(2) Transformation charges of € 608m in Q4 2019 and € 1,145m in FY 2019(3) Throughout this presentation cost/income ratio defined as total noninterest expenses as a percentage of total net revenues(4) Year-to-date provision for credit losses annualized as % of loans gross of allowances for loan losses (€ 434 bn as of 31 Dec 2019)
Q4 2019 results 30 January 2020
Deutsche BankInvestor Relations
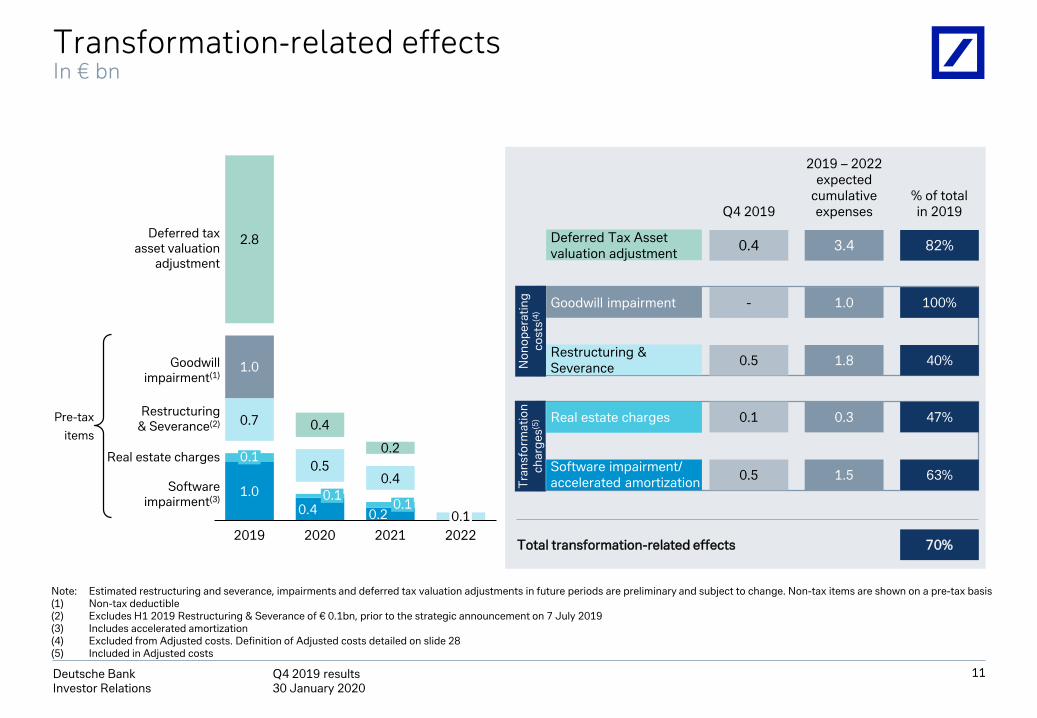
Transformation-related effectsIn € bn
11
1.00.4 0.2
0.7
0.50.4
1.0
0.4
0.2
2.8
2022
0.1
20190.1
2020 2021
0.10.1
Deferred tax asset valuation
adjustment
Goodwill impairment(1)
Software impairment(3)
Real estate charges
Restructuring & Severance(2)
Deferred Tax Asset valuation adjustment
Goodwill impairment
Software impairment/ accelerated amortization
Real estate charges
82%
100%
47%
40%
% of total in 2019
Note: Estimated restructuring and severance, impairments and deferred tax valuation adjustments in future periods are preliminary and subject to change. Non-tax items are shown on a pre-tax basis(1) Non-tax deductible (2) Excludes H1 2019 Restructuring & Severance of € 0.1bn, prior to the strategic announcement on 7 July 2019(3) Includes accelerated amortization(4) Excluded from Adjusted costs. Definition of Adjusted costs detailed on slide 28(5) Included in Adjusted costs
Total transformation-related effects 70%
3.4
1.0
0.3
1.8
2019 – 2022 expected
cumulative expenses
0.4
-
0.5
0.1
Q4 2019
Restructuring & Severance 0.5
1.5 63%
Non
oper
atin
gco
sts(4
)T
rans
form
atio
n ch
arge
s(5)Pre-tax
items
Q4 2019 results 30 January 2020
Deutsche BankInvestor Relations
Revenues
Revenues ex. specific items
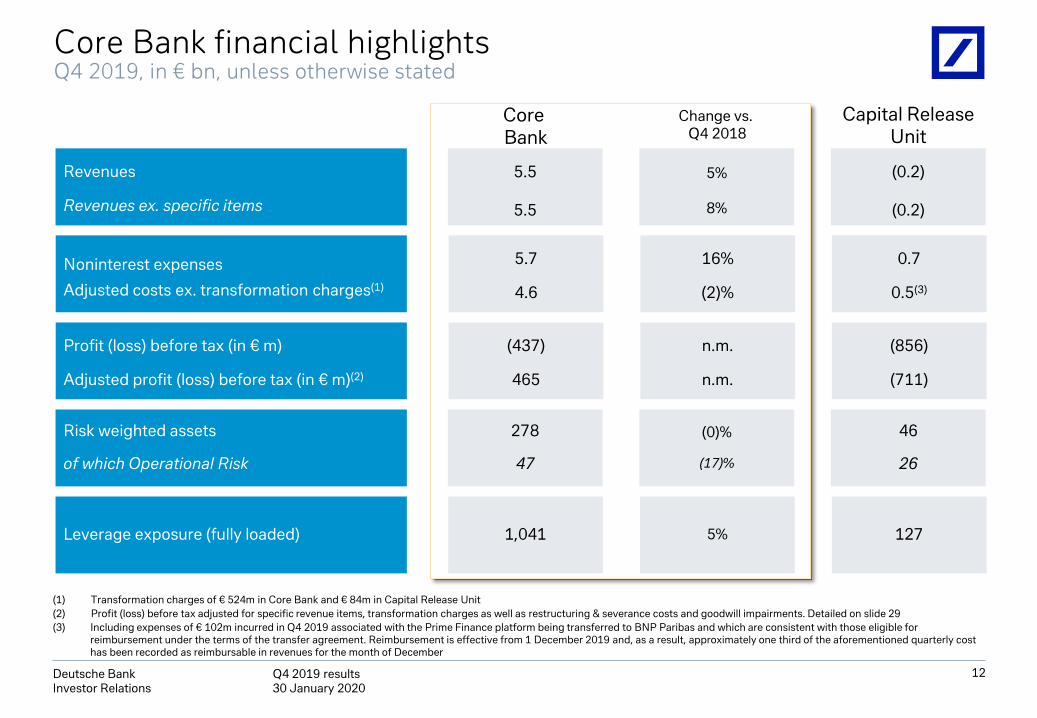
Core Bank financial highlightsQ4 2019, in € bn, unless otherwise stated
Risk weighted assets
of which Operational Risk
Leverage exposure (fully loaded)
Capital ReleaseUnit
Core Bank
Change vs. Q4 2018
12
(1) Transformation charges of € 524m in Core Bank and € 84m in Capital Release Unit(2) Profit (loss) before tax adjusted for specific revenue items, transformation charges as well as restructuring & severance costs and goodwill impairments. Detailed on slide 29(3) Including expenses of € 102m incurred in Q4 2019 associated with the Prime Finance platform being transferred to BNP Paribas and which are consistent with those eligible for
reimbursement under the terms of the transfer agreement. Reimbursement is effective from 1 December 2019 and, as a result, approximately one third of the aforementioned quarterly cost has been recorded as reimbursable in revenues for the month of December
(0.2)
(0.2)
46
26
127
(0)%
(17)%
5%
(856)
(711)
5.5
5.5
278
47
1,041
5%
8%
(437)
465
n.m.
n.m.
Profit (loss) before tax (in € m)
Adjusted profit (loss) before tax (in € m)(2)
0.7
0.5(3)
5.7
4.6
16%
(2)%
Noninterest expenses
Adjusted costs ex. transformation charges(1)
Q4 2019 results 30 January 2020
Deutsche BankInvestor Relations
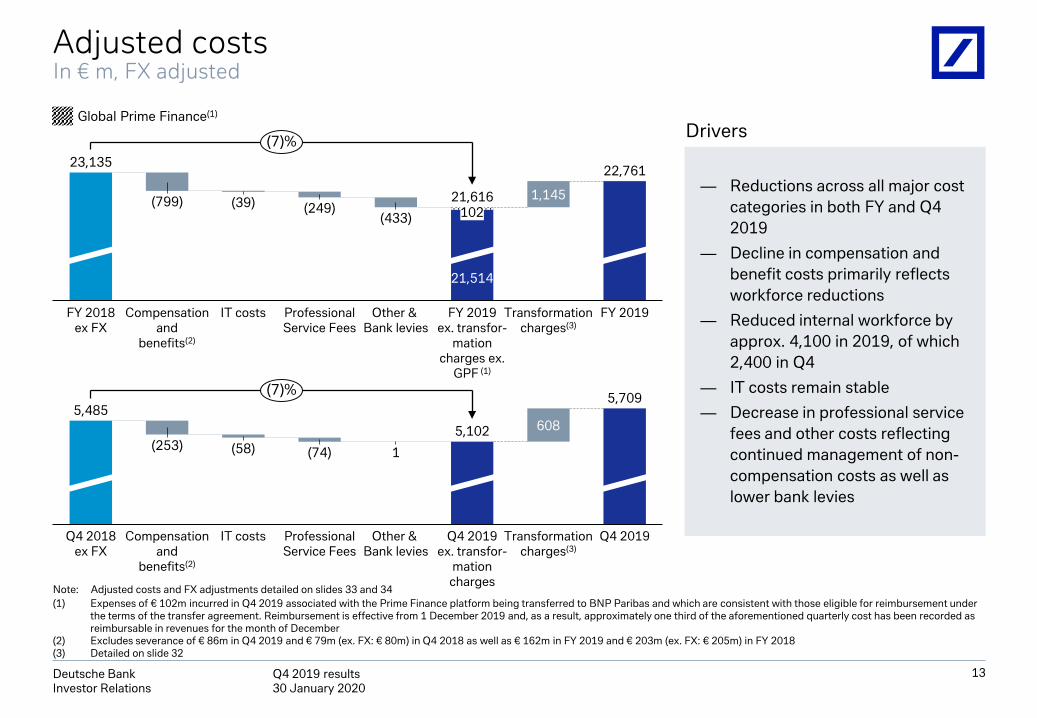
Adjusted costsIn € m, FX adjusted
— Reductions across all major cost categories in both FY and Q4 2019
— Decline in compensation and benefit costs primarily reflects workforce reductions
— Reduced internal workforce byapprox. 4,100 in 2019, of which2,400 in Q4
— IT costs remain stable
— Decrease in professional service fees and other costs reflecting continued management of non-compensation costs as well as lower bank levies
Drivers
Note: Adjusted costs and FX adjustments detailed on slides 33 and 34(1) Expenses of € 102m incurred in Q4 2019 associated with the Prime Finance platform being transferred to BNP Paribas and which are consistent with those eligible for reimbursement under
the terms of the transfer agreement. Reimbursement is effective from 1 December 2019 and, as a result, approximately one third of the aforementioned quarterly cost has been recorded as reimbursable in revenues for the month of December
(2) Excludes severance of € 86m in Q4 2019 and € 79m (ex. FX: € 80m) in Q4 2018 as well as € 162m in FY 2019 and € 203m (ex. FX: € 205m) in FY 2018(3) Detailed on slide 32
13
1,145(39)
Compensationand
benefits(2)
(799)
FY 2019 ex. transfor-
mationcharges ex.
GPF (1)
FY 2019ProfessionalService Fees
(249)
IT costs Other & Bank levies
FY 2018ex FX
23,135
21,616
22,761
Transformationcharges(3)
(433)
(7)%
608
1(253)5,102
Other & Bank levies
Q4 2019 ex. transfor-
mationcharges
Transformationcharges(3)
Q4 2019Q4 2018ex FX
Compensationand
benefits(2)
(58)
5,709
IT costs
5,485
ProfessionalService Fees
(74)
(7)%
Global Prime Finance(1)
102
21,514
Q4 2019 results 30 January 2020
Deutsche BankInvestor Relations
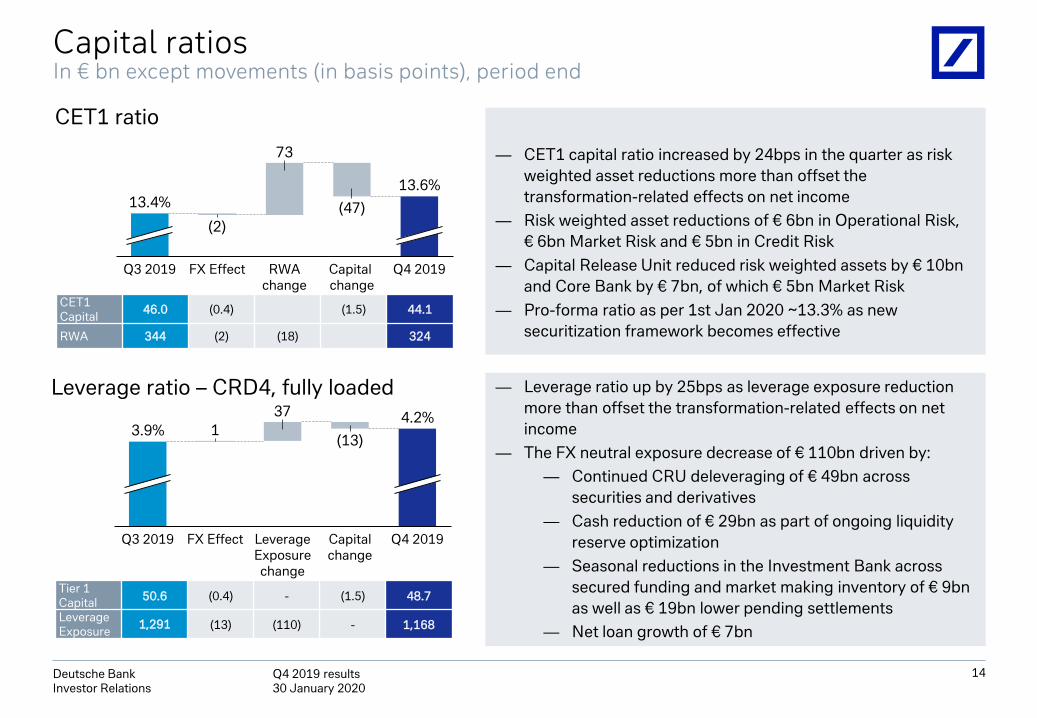
Capital ratiosIn € bn except movements (in basis points), period end
14
CET1 ratio
Leverage ratio – CRD4, fully loaded
— CET1 capital ratio increased by 24bps in the quarter as risk weighted asset reductions more than offset the transformation-related effects on net income
— Risk weighted asset reductions of € 6bn in Operational Risk, € 6bn Market Risk and € 5bn in Credit Risk
— Capital Release Unit reduced risk weighted assets by € 10bn and Core Bank by € 7bn, of which € 5bn Market Risk
— Pro-forma ratio as per 1st Jan 2020 ~13.3% as new securitization framework becomes effective
— Leverage ratio up by 25bps as leverage exposure reduction more than offset the transformation-related effects on net income
— The FX neutral exposure decrease of € 110bn driven by: — Continued CRU deleveraging of € 49bn across
securities and derivatives— Cash reduction of € 29bn as part of ongoing liquidity
reserve optimization— Seasonal reductions in the Investment Bank across
secured funding and market making inventory of € 9bn as well as € 19bn lower pending settlements
— Net loan growth of € 7bn
Tier 1Capital 50.6 (0.4) - (1.5) 48.7
LeverageExposure 1,291 (13) (110) - 1,168
137
Capital change
Q3 2019 FX Effect Leverage Exposure change
(13)
Q4 2019
3.9%4.2%
73
FX Effect
13.4%
Q3 2019
(2)
RWA change
(47)
Capital change
Q4 2019
13.6%
CET1Capital 46.0 (0.4) (1.5) 44.1
RWA 344 (2) (18) 324
Q4 2019 results 30 January 2020
Deutsche BankInvestor Relations
15
Segment results
Q4 2019 results 30 January 2020
Deutsche BankInvestor Relations
16
Change in Change in
Q4 2019% vs.
Q4 2018 FY 2019% vs.
FY 2018
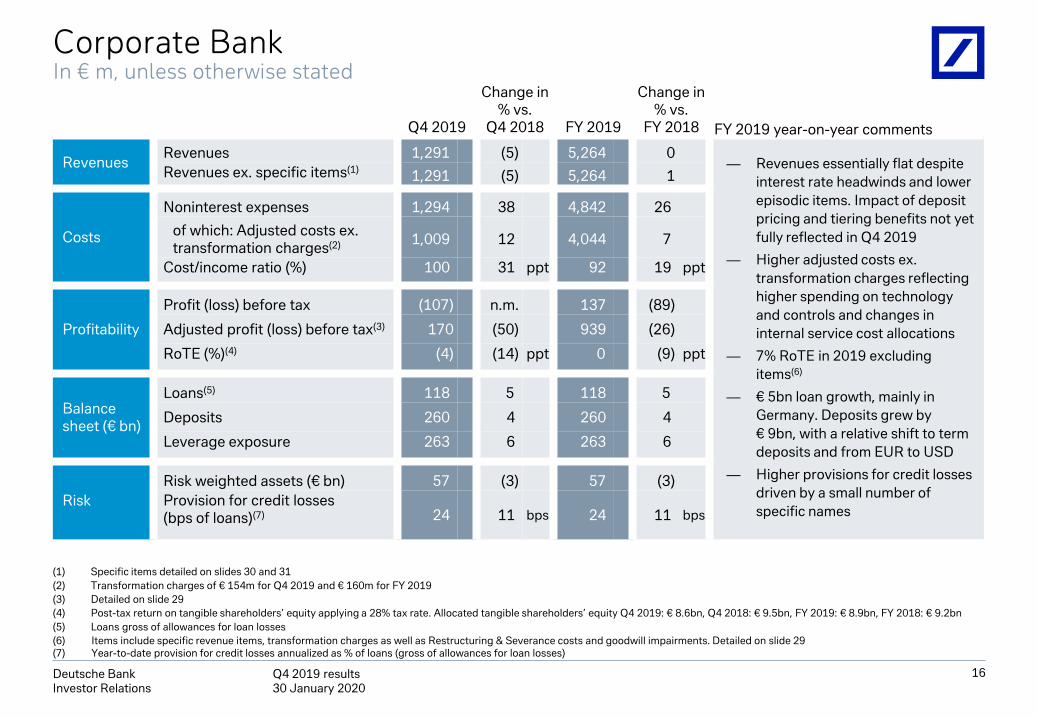
RevenuesRevenues 1,291. (5) 5,264. 0
— Revenues essentially flat despite interest rate headwinds and lower episodic items. Impact of deposit pricing and tiering benefits not yet fully reflected in Q4 2019
— Higher adjusted costs ex. transformation charges reflecting higher spending on technology and controls and changes in internal service cost allocations
— 7% RoTE in 2019 excluding items(6)
— € 5bn loan growth, mainly in Germany. Deposits grew by € 9bn, with a relative shift to term deposits and from EUR to USD
— Higher provisions for credit losses driven by a small number of specific names
Revenues ex. specific items(1) 1,291. (5) 5,264. 1
Costs
Noninterest expenses 1,294. 38. 4,842. 26.
of which: Adjusted costs ex.transformation charges(2) 1,009. 12. 4,044. 7.
Cost/income ratio (%) 100. 31. ppt 92. 19. ppt
Profitability
Profit (loss) before tax (107) n.m. 137. (89)
Adjusted profit (loss) before tax(3) 170 (50) 939. (26)
RoTE (%)(4) (4) (14) ppt 0) (9) ppt
Balance sheet (€ bn)
Loans(5) 118. 5( 118. 5(
Deposits 260. 4. 260. 4.
Leverage exposure 263. 6. 263. 6.
RiskRisk weighted assets (€ bn) 57. (3) 57. (3)Provision for credit losses(bps of loans)(7) 24. 11. bps 24. 11. bps
Corporate Bank In € m, unless otherwise stated
FY 2019 year-on-year comments
(1) Specific items detailed on slides 30 and 31(2) Transformation charges of € 154m for Q4 2019 and € 160m for FY 2019(3) Detailed on slide 29(4) Post-tax return on tangible shareholders’ equity applying a 28% tax rate. Allocated tangible shareholders’ equity Q4 2019: € 8.6bn, Q4 2018: € 9.5bn, FY 2019: € 8.9bn, FY 2018: € 9.2bn(5) Loans gross of allowances for loan losses (6) Items include specific revenue items, transformation charges as well as Restructuring & Severance costs and goodwill impairments. Detailed on slide 29(7) Year-to-date provision for credit losses annualized as % of loans (gross of allowances for loan losses)
Q4 2019 results 30 January 2020
Deutsche BankInvestor Relations
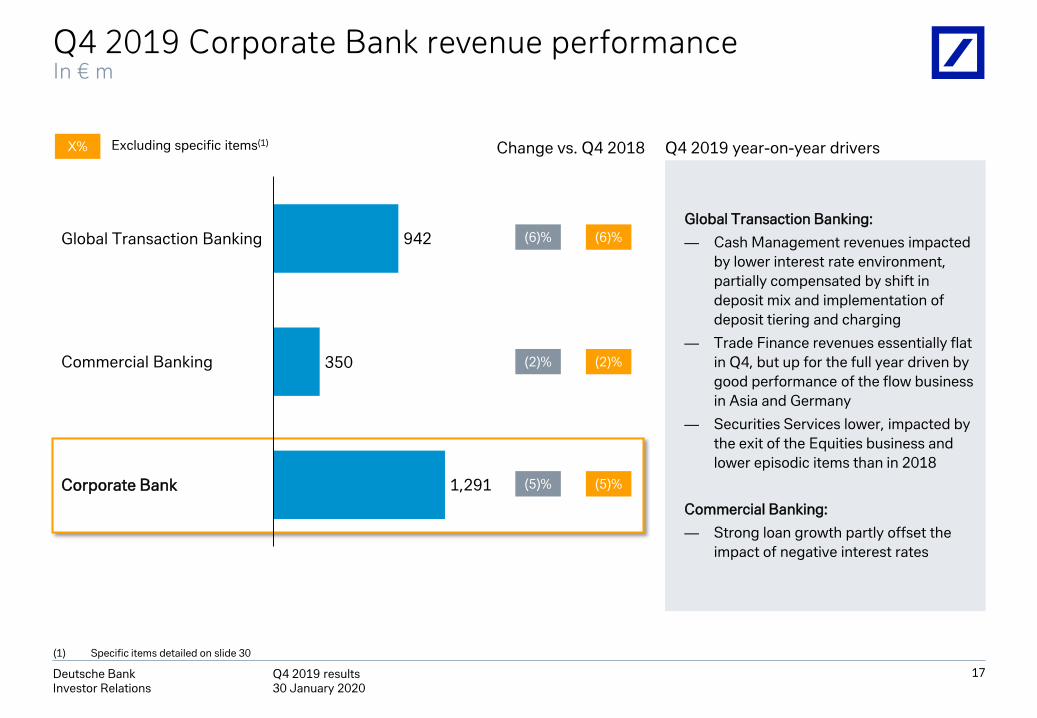
Q4 2019 Corporate Bank revenue performance In € m
942
350
1,291 Corporate Bank
Global Transaction Banking
Commercial Banking
Q4 2019 year-on-year driversChange vs. Q4 2018
Global Transaction Banking:
— Cash Management revenues impacted by lower interest rate environment, partially compensated by shift in deposit mix and implementation of deposit tiering and charging
— Trade Finance revenues essentially flat in Q4, but up for the full year driven by good performance of the flow business in Asia and Germany
— Securities Services lower, impacted by the exit of the Equities business and lower episodic items than in 2018
Commercial Banking:
— Strong loan growth partly offset the impact of negative interest rates
(1) Specific items detailed on slide 30
17
X% Excluding specific items(1)
(6)% (6)%
X%
(2)% (2)%
(5)% (5)%
Q4 2019 results 30 January 2020
Deutsche BankInvestor Relations
18
Change in Change in
Q4 2019% vs.
Q4 2018 FY 2019% vs.
FY 2018
Revenues
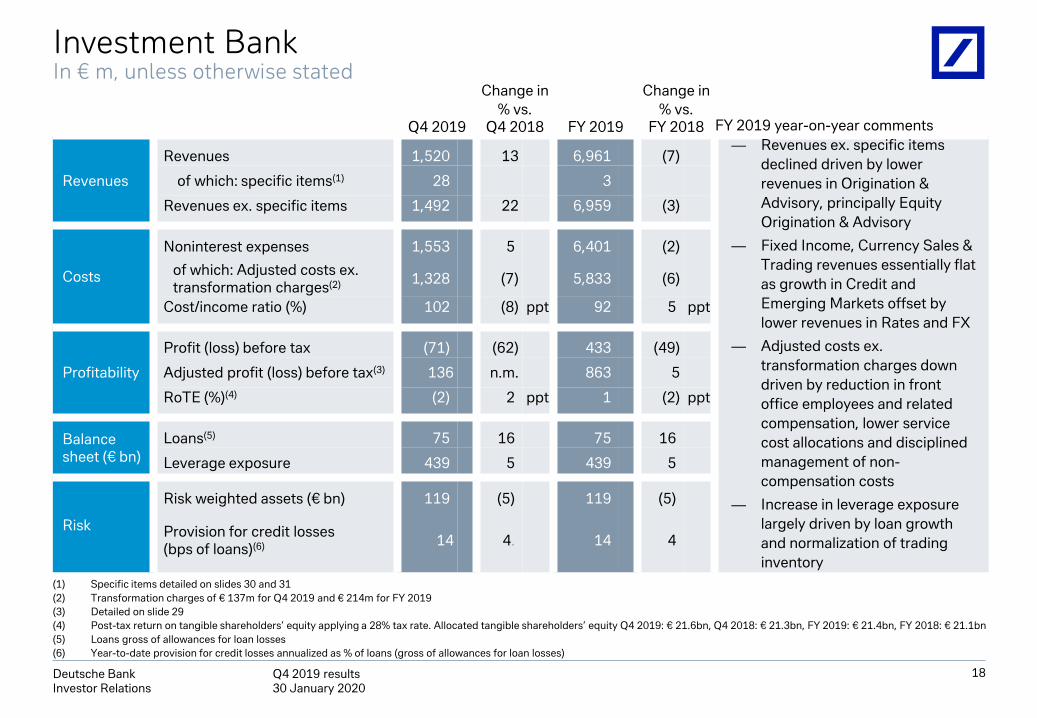
Revenues 1,520. 13 6,961. (7)— Revenues ex. specific items
declined driven by lower revenues in Origination & Advisory, principally Equity Origination & Advisory
— Fixed Income, Currency Sales & Trading revenues essentially flat as growth in Credit and Emerging Markets offset by lower revenues in Rates and FX
— Adjusted costs ex. transformation charges down driven by reduction in front office employees and related compensation, lower service cost allocations and disciplined management of non-compensation costs
— Increase in leverage exposure largely driven by loan growth and normalization of trading inventory
of which: specific items(1) 28. 3.
Revenues ex. specific items 1,492. 22 6,959. (3)
Costs
Noninterest expenses 1,553. 5. 6,401. (2)
of which: Adjusted costs ex.transformation charges(2) 1,328. (7) 5,833. (6)
Cost/income ratio (%) 102. (8) ppt 92. 5. ppt
Profitability
Profit (loss) before tax (71). (62) 433. (49)
Adjusted profit (loss) before tax(3) 136 n.m. 863. 5
RoTE (%)(4) (2). 2. ppt 1. (2) ppt
Balance sheet (€ bn)
Loans(5) 75. 16. 75. 16.
Leverage exposure 439. 5. 439. 5.
Risk
Risk weighted assets (€ bn) 119. (5). 119. (5).
Provision for credit losses(bps of loans)(6) 14 4.. 14. 4.
Investment Bank In € m, unless otherwise stated
(1) Specific items detailed on slides 30 and 31(2) Transformation charges of € 137m for Q4 2019 and € 214m for FY 2019(3) Detailed on slide 29(4) Post-tax return on tangible shareholders’ equity applying a 28% tax rate. Allocated tangible shareholders’ equity Q4 2019: € 21.6bn, Q4 2018: € 21.3bn, FY 2019: € 21.4bn, FY 2018: € 21.1bn(5) Loans gross of allowances for loan losses (6) Year-to-date provision for credit losses annualized as % of loans (gross of allowances for loan losses)
FY 2019 year-on-year comments
Q4 2019 results 30 January 2020
Deutsche BankInvestor Relations
Q4 2019 Investment Bank revenue performance In € m
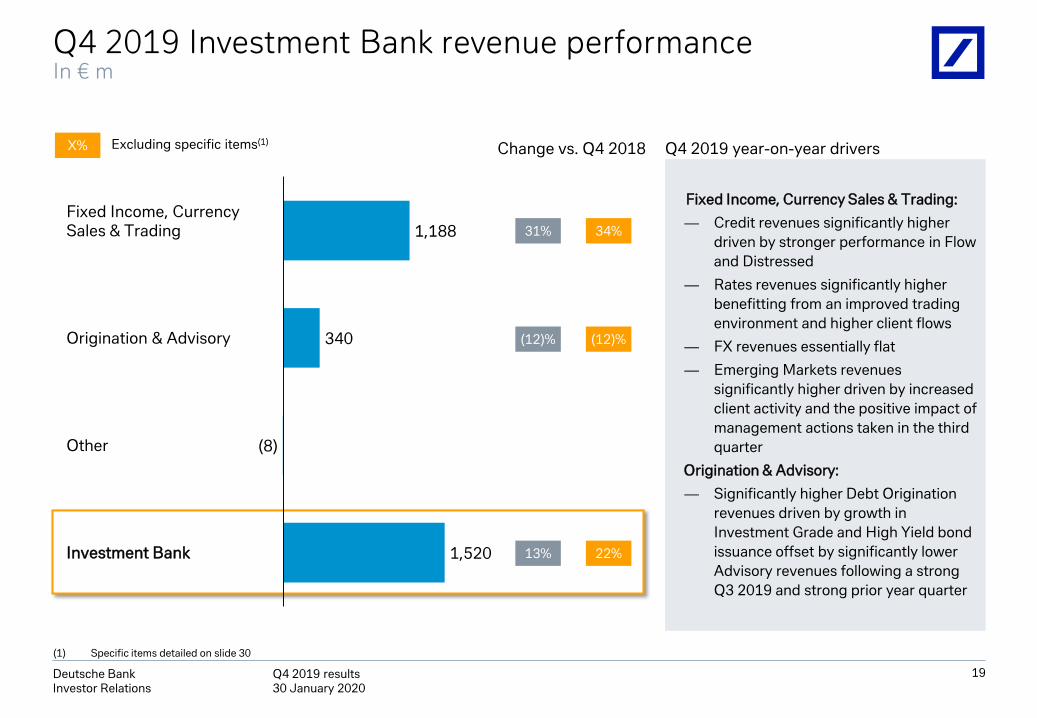
1,188
340
(8)
1,520
Fixed Income, Currency Sales & Trading
Origination & Advisory
Investment Bank
Other
Q4 2019 year-on-year driversChange vs. Q4 2018
Fixed Income, Currency Sales & Trading:
— Credit revenues significantly higher driven by stronger performance in Flow and Distressed
— Rates revenues significantly higher benefitting from an improved trading environment and higher client flows
— FX revenues essentially flat
— Emerging Markets revenues significantly higher driven by increased client activity and the positive impact of management actions taken in the third quarter
Origination & Advisory:
— Significantly higher Debt Origination revenues driven by growth in Investment Grade and High Yield bond issuance offset by significantly lower Advisory revenues following a strong Q3 2019 and strong prior year quarter
(1) Specific items detailed on slide 30
19
X% Excluding specific items(1)
31% 34%
(12)% (12)%
X%
13% 22%
Q4 2019 results 30 January 2020
Deutsche BankInvestor Relations
Change in Change in
Q4 2019% vs.
Q4 2018 FY 2019% vs.
FY 2018
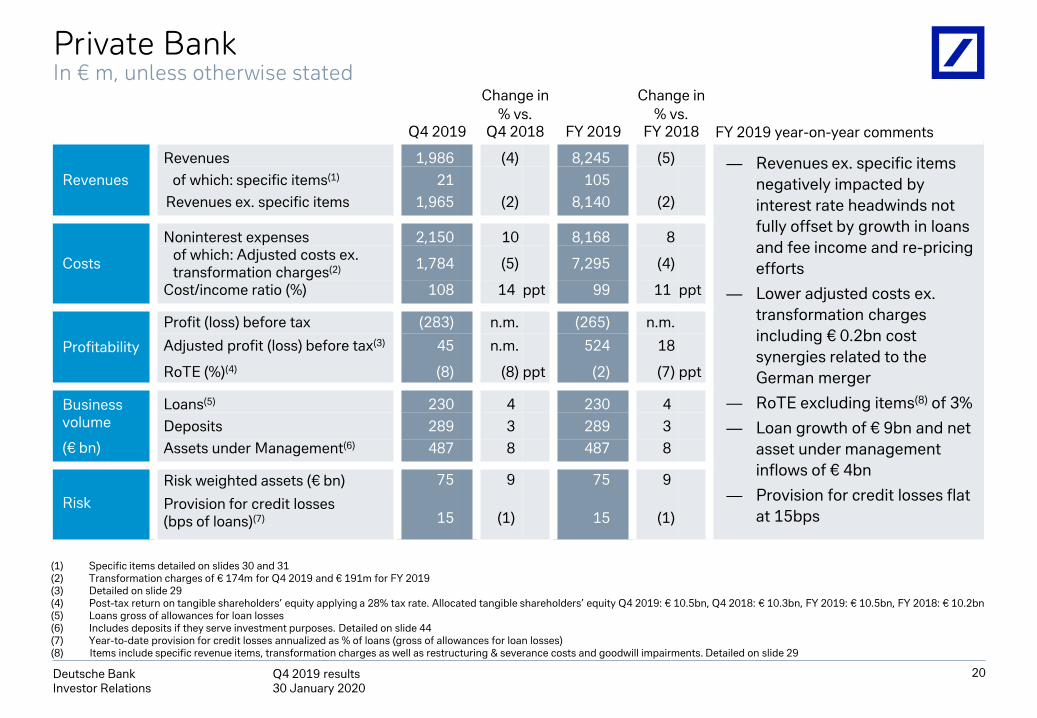
RevenuesRevenues 1,986 (4) 8,245 (5) — Revenues ex. specific items
negatively impacted by interest rate headwinds not fully offset by growth in loans and fee income and re-pricing efforts
— Lower adjusted costs ex. transformation charges including € 0.2bn cost synergies related to the German merger
— RoTE excluding items(8) of 3%
— Loan growth of € 9bn and net asset under management inflows of € 4bn
— Provision for credit losses flatat 15bps
of which: specific items(1) 21 105Revenues ex. specific items 1,965 (2) 8,140 (2)
Costs
Noninterest expenses 2,150 10 8,168 8of which: Adjusted costs ex. transformation charges(2) 1,784 (5) 7,295 (4)
Cost/income ratio (%) 108 14. ppt 99 11. ppt
Profitability
Profit (loss) before tax (283) n.m. (265) n.m.
Adjusted profit (loss) before tax(3) 45 n.m. 524 18
RoTE (%)(4) (8) (8) ppt (2) (7) ppt
Business volume
(€ bn)
Loans(5) 230 4. 230 4.Deposits 289 3. 289 3.Assets under Management(6) 487 8. 487 8.
RiskRisk weighted assets (€ bn) 75 9. 75 9.
Provision for credit losses(bps of loans)(7) 15 (1). 15 (1)
20
Private Bank In € m, unless otherwise stated
FY 2019 year-on-year comments
(1) Specific items detailed on slides 30 and 31(2) Transformation charges of € 174m for Q4 2019 and € 191m for FY 2019(3) Detailed on slide 29(4) Post-tax return on tangible shareholders’ equity applying a 28% tax rate. Allocated tangible shareholders’ equity Q4 2019: € 10.5bn, Q4 2018: € 10.3bn, FY 2019: € 10.5bn, FY 2018: € 10.2bn(5) Loans gross of allowances for loan losses(6) Includes deposits if they serve investment purposes. Detailed on slide 44(7) Year-to-date provision for credit losses annualized as % of loans (gross of allowances for loan losses) (8) Items include specific revenue items, transformation charges as well as restructuring & severance costs and goodwill impairments. Detailed on slide 29
Q4 2019 results 30 January 2020
Deutsche BankInvestor Relations
Q4 2019 Private Bank revenue performance In € m
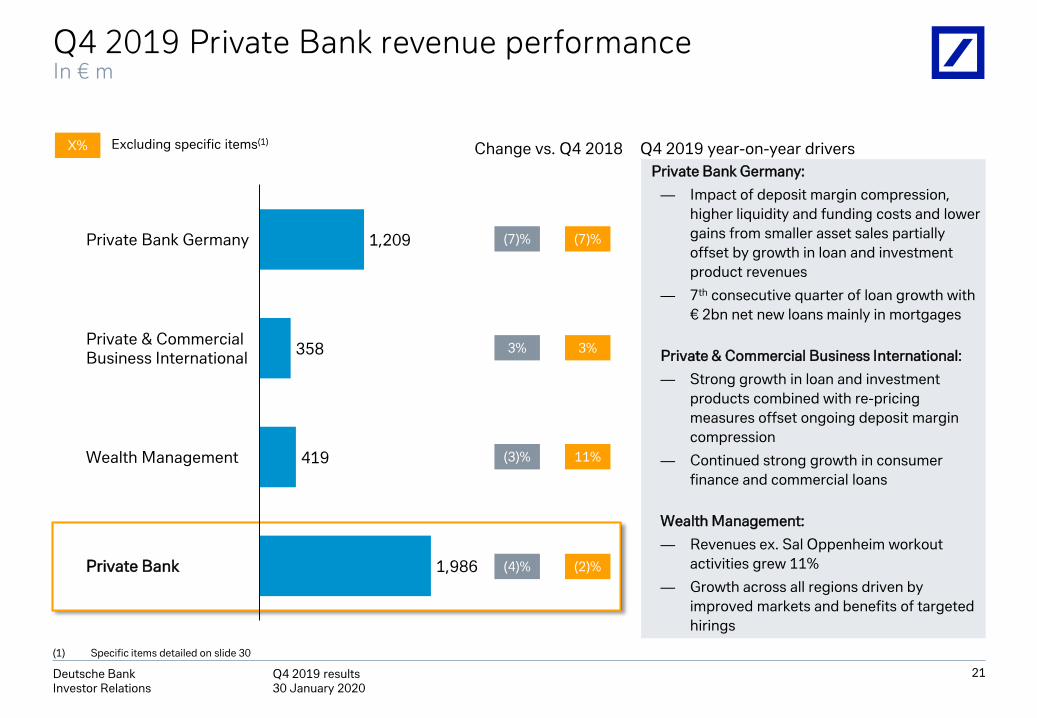
1,209
358
419
1,986
Wealth Management
Private Bank Germany
Private & CommercialBusiness International
Private Bank
(1) Specific items detailed on slide 30
Private Bank Germany:
— Impact of deposit margin compression, higher liquidity and funding costs and lower gains from smaller asset sales partially offset by growth in loan and investment product revenues
— 7th consecutive quarter of loan growth with € 2bn net new loans mainly in mortgages
Private & Commercial Business International:
— Strong growth in loan and investment products combined with re-pricing measures offset ongoing deposit margin compression
— Continued strong growth in consumer finance and commercial loans
Wealth Management:
— Revenues ex. Sal Oppenheim workout activities grew 11%
— Growth across all regions driven by improved markets and benefits of targeted hirings
Q4 2019 year-on-year driversChange vs. Q4 2018Excluding specific items(1)
21
X%
(7)% (7)%
3% 3%
(3)% 11%
(4)% (2)%
Q4 2019 results 30 January 2020
Deutsche BankInvestor Relations
22
Change in Change in
Q4 2019% vs.
Q4 2018 FY 2019% vs.
FY 2018
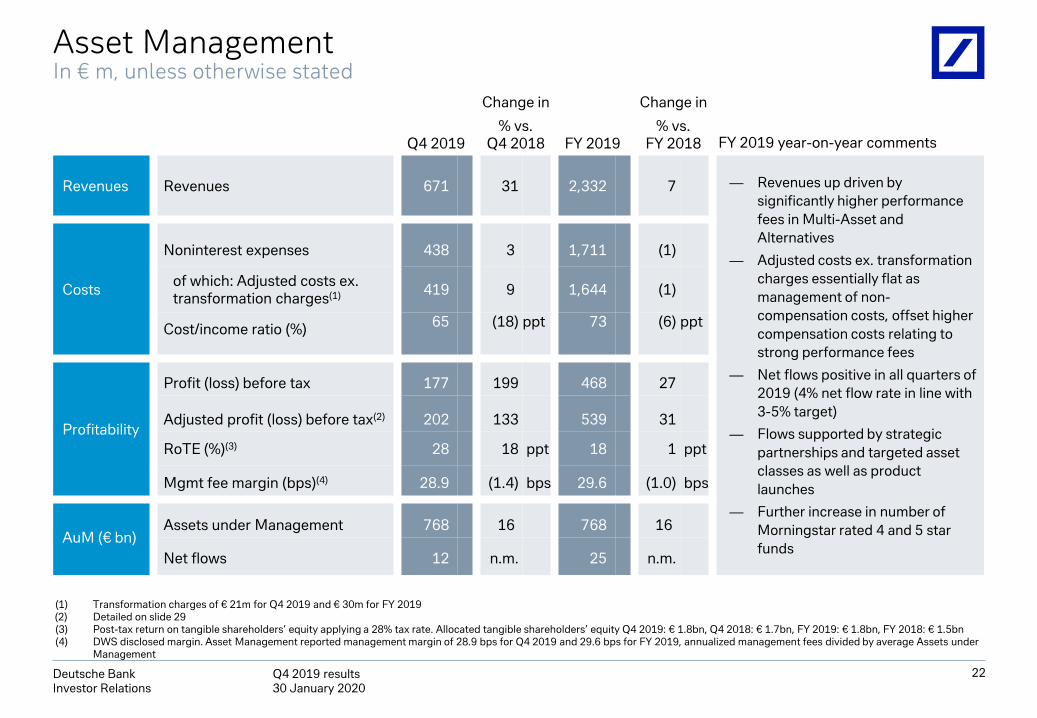
Revenues Revenues 671) 31 2,332) 7
Costs
Noninterest expenses 438) 3. 1,711) (1)
of which: Adjusted costs ex.transformation charges(1) 419) 9. 1,644) (1)
Cost/income ratio (%) 65) (18) ppt 73) (6) ppt
Profitability
Profit (loss) before tax 177) 199 468) 27
Adjusted profit (loss) before tax(2) 202) 133 539) 31
RoTE (%)(3) 28) 18 ppt 18) 1 ppt
Mgmt fee margin (bps)(4) 28.9) (1.4) bps 29.6) (1.0) bps
AuM (€ bn)Assets under Management 768) 16. 768) 16.
Net flows 12) n.m. 25) n.m.
Asset ManagementIn € m, unless otherwise stated
(1) Transformation charges of € 21m for Q4 2019 and € 30m for FY 2019(2) Detailed on slide 29(3) Post-tax return on tangible shareholders’ equity applying a 28% tax rate. Allocated tangible shareholders’ equity Q4 2019: € 1.8bn, Q4 2018: € 1.7bn, FY 2019: € 1.8bn, FY 2018: € 1.5bn(4) DWS disclosed margin. Asset Management reported management margin of 28.9 bps for Q4 2019 and 29.6 bps for FY 2019, annualized management fees divided by average Assets under
Management
FY 2019 year-on-year comments
— Revenues up driven by significantly higher performance fees in Multi-Asset and Alternatives
— Adjusted costs ex. transformation charges essentially flat as management of non-compensation costs, offset higher compensation costs relating to strong performance fees
— Net flows positive in all quarters of 2019 (4% net flow rate in line with 3-5% target)
— Flows supported by strategic partnerships and targeted asset classes as well as product launches
— Further increase in number of Morningstar rated 4 and 5 star funds
Q4 2019 results 30 January 2020
Deutsche BankInvestor Relations
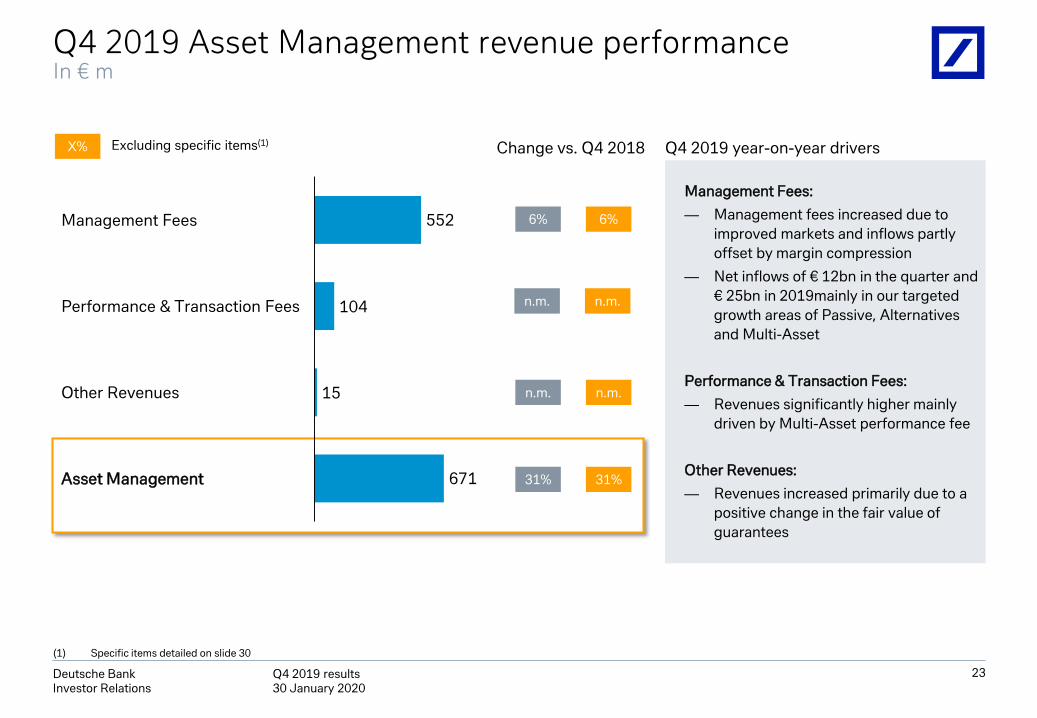
Q4 2019 Asset Management revenue performance In € m
552
104
15
671
Performance & Transaction Fees
Management Fees
Other Revenues
Asset Management
Q4 2019 year-on-year driversChange vs. Q4 2018
Management Fees:
— Management fees increased due to improved markets and inflows partly offset by margin compression
— Net inflows of € 12bn in the quarter and € 25bn in 2019mainly in our targeted growth areas of Passive, Alternatives and Multi-Asset
Performance & Transaction Fees:
— Revenues significantly higher mainly driven by Multi-Asset performance fee
Other Revenues:
— Revenues increased primarily due to a positive change in the fair value of guarantees
(1) Specific items detailed on slide 30
23
X% Excluding specific items(1)
6% 6%
X%
n.m. n.m.
31% 31%
n.m. n.m.
Q4 2019 results 30 January 2020
Deutsche BankInvestor Relations
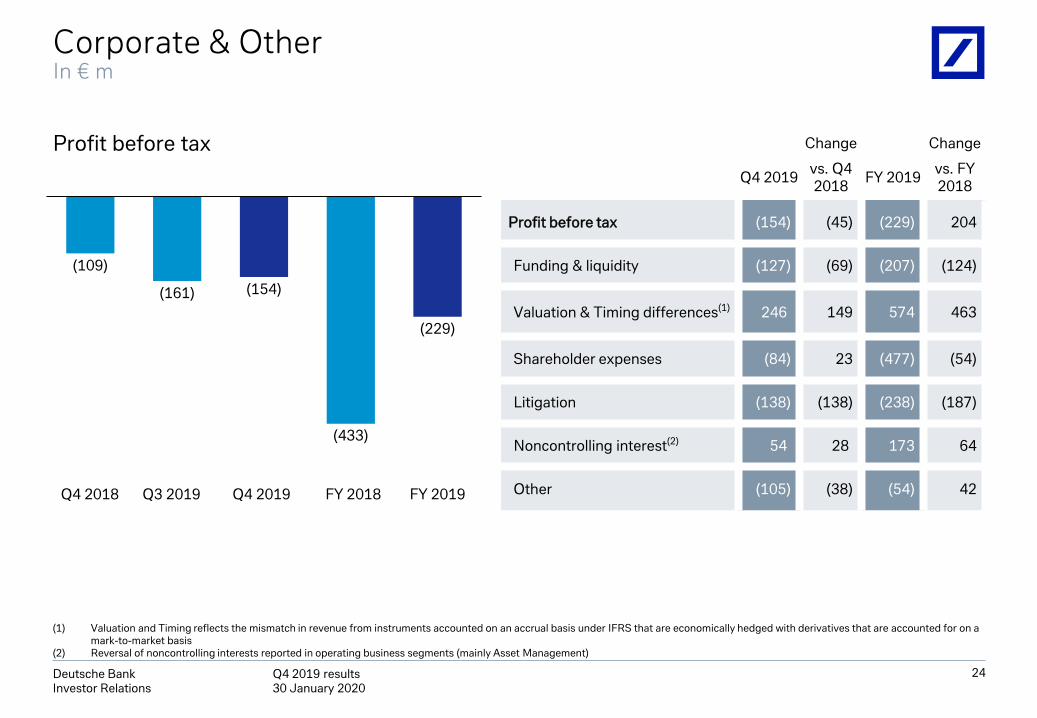
Corporate & OtherIn € m
Q4 2018 Q3 2019 Q4 2019
(1) Valuation and Timing reflects the mismatch in revenue from instruments accounted on an accrual basis under IFRS that are economically hedged with derivatives that are accounted for on a mark-to-market basis
(2) Reversal of noncontrolling interests reported in operating business segments (mainly Asset Management)
(109)
(161) (154)
(433)
(229)
Profit before tax
24
Change Change
Q4 2019 vs. Q4 2018 FY 2019 vs. FY
2018
Profit before tax (154) (45) (229) 204
Funding & liquidity (127) (69) (207) (124)
Valuation & Timing differences(1) 246. 149 574 463
Shareholder expenses (84) 23 (477) (54)
Litigation (138) (138) (238) (187)
Noncontrolling interest(2) 54. 28. 173 64
Other (105) (38) (54) 42 FY 2018 FY 2019
Q4 2019 results 30 January 2020
Deutsche BankInvestor Relations
25
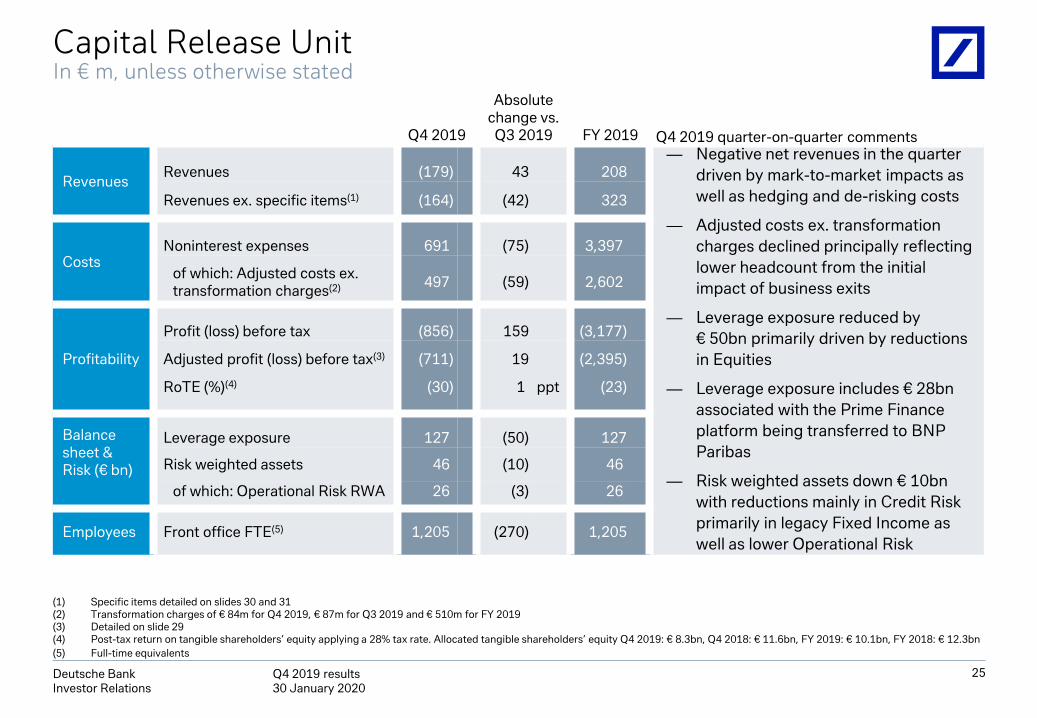
Q4 2019
Absolutechange vs. Q3 2019 FY 2019
RevenuesRevenues (179) 43 208
— Negative net revenues in the quarter driven by mark-to-market impacts as well as hedging and de-risking costs
— Adjusted costs ex. transformation charges declined principally reflecting lower headcount from the initial impact of business exits
— Leverage exposure reduced by € 50bn primarily driven by reductions in Equities
— Leverage exposure includes € 28bn associated with the Prime Finance platform being transferred to BNP Paribas
— Risk weighted assets down € 10bn with reductions mainly in Credit Risk primarily in legacy Fixed Income as well as lower Operational Risk
Revenues ex. specific items(1) (164) (42) 323
CostsNoninterest expenses 691. (75) 3,397.
of which: Adjusted costs ex.transformation charges(2) 497. (59) 2,602.
Profitability
Profit (loss) before tax (856) 159 (3,177)
Adjusted profit (loss) before tax(3) ((711) 19 (2,395)
RoTE (%)(4) (30) 1. ppt (23)
Balance sheet & Risk (€ bn)
Leverage exposure 127. (50) 127
Risk weighted assets 46. (10) 46.
of which: Operational Risk RWA 26. (3) 26.
Employees Front office FTE(5) 1,205. (270) 1,205
Capital Release UnitIn € m, unless otherwise stated
Q4 2019 quarter-on-quarter comments
(1) Specific items detailed on slides 30 and 31(2) Transformation charges of € 84m for Q4 2019, € 87m for Q3 2019 and € 510m for FY 2019(3) Detailed on slide 29(4) Post-tax return on tangible shareholders’ equity applying a 28% tax rate. Allocated tangible shareholders’ equity Q4 2019: € 8.3bn, Q4 2018: € 11.6bn, FY 2019: € 10.1bn, FY 2018: € 12.3bn(5) Full-time equivalents
Q4 2019 results 30 January 2020
Deutsche BankInvestor Relations
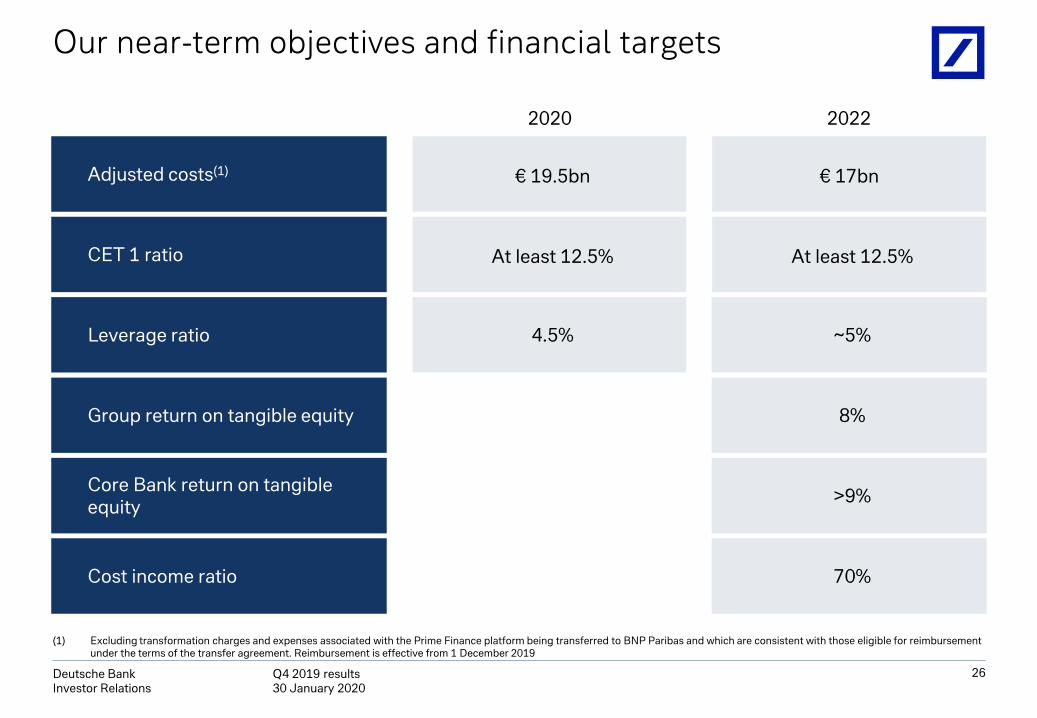
Our near-term objectives and financial targets
26
Adjusted costs(1)
CET 1 ratio
€ 17bn
At least 12.5%
€ 19.5bn
At least 12.5%
Leverage ratio 4.5% ~5%
20222020
Group return on tangible equity
Cost income ratio
Core Bank return on tangible equity
8%
>9%
70%
(1) Excluding transformation charges and expenses associated with the Prime Finance platform being transferred to BNP Paribas and which are consistent with those eligible for reimbursement under the terms of the transfer agreement. Reimbursement is effective from 1 December 2019
Q4 2019 results 30 January 2020
Deutsche BankInvestor Relations
27
Appendix
Q4 2019 results 30 January 2020
Deutsche BankInvestor Relations
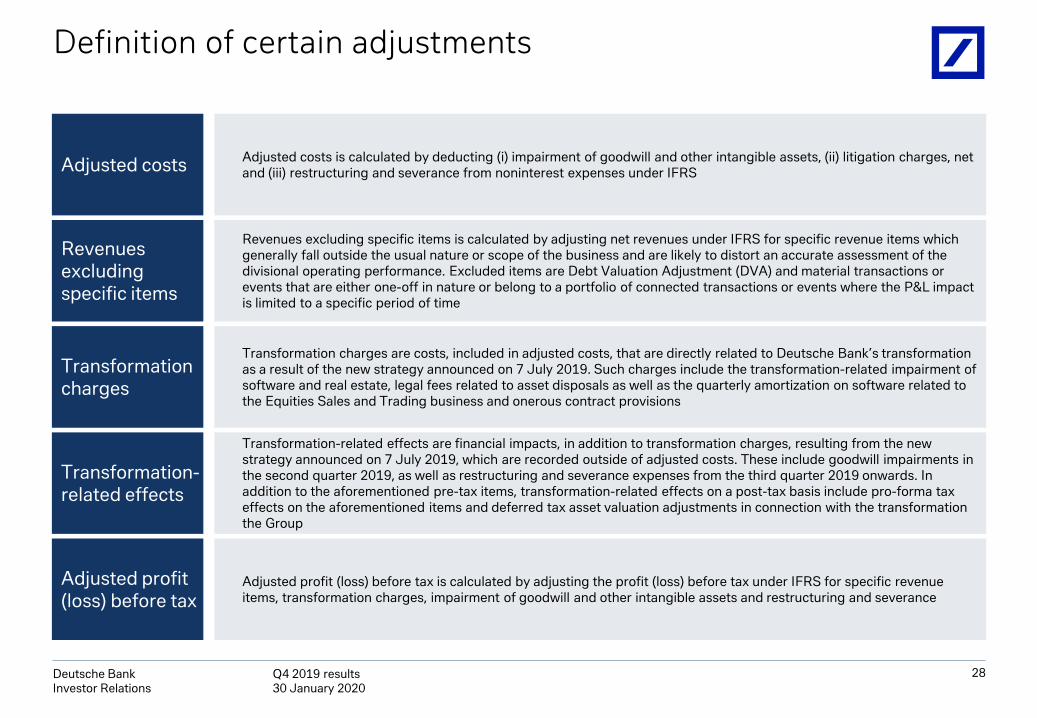
Definition of certain adjustments
28
Adjusted costs
Revenues excluding specific items
Transformation charges
Transformation-related effects
Adjusted profit (loss) before tax
Adjusted costs is calculated by deducting (i) impairment of goodwill and other intangible assets, (ii) litigation charges, net and (iii) restructuring and severance from noninterest expenses under IFRS
Revenues excluding specific items is calculated by adjusting net revenues under IFRS for specific revenue items which generally fall outside the usual nature or scope of the business and are likely to distort an accurate assessment of the divisional operating performance. Excluded items are Debt Valuation Adjustment (DVA) and material transactions or events that are either one-off in nature or belong to a portfolio of connected transactions or events where the P&L impact is limited to a specific period of time
Transformation charges are costs, included in adjusted costs, that are directly related to Deutsche Bank’s transformation as a result of the new strategy announced on 7 July 2019. Such charges include the transformation-related impairment of software and real estate, legal fees related to asset disposals as well as the quarterly amortization on software related to the Equities Sales and Trading business and onerous contract provisions
Transformation-related effects are financial impacts, in addition to transformation charges, resulting from the new strategy announced on 7 July 2019, which are recorded outside of adjusted costs. These include goodwill impairments in the second quarter 2019, as well as restructuring and severance expenses from the third quarter 2019 onwards. In addition to the aforementioned pre-tax items, transformation-related effects on a post-tax basis include pro-forma tax effects on the aforementioned items and deferred tax asset valuation adjustments in connection with the transformation the Group
Adjusted profit (loss) before tax is calculated by adjusting the profit (loss) before tax under IFRS for specific revenue items, transformation charges, impairment of goodwill and other intangible assets and restructuring and severance
Q4 2019 results 30 January 2020
Deutsche BankInvestor Relations
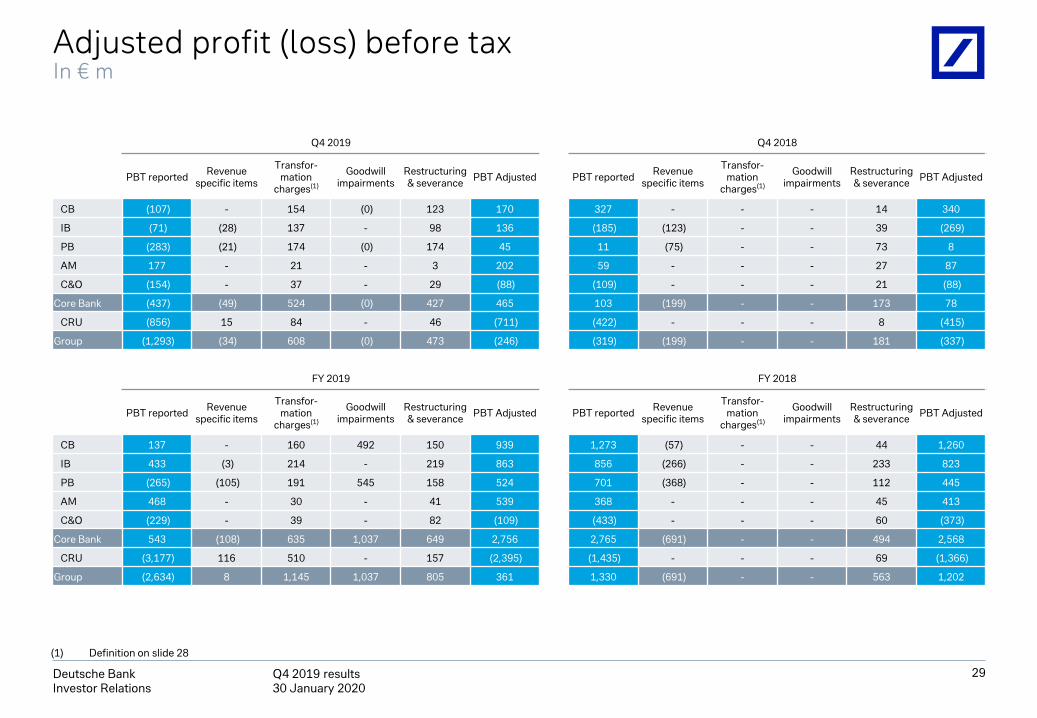
Adjusted profit (loss) before taxIn € m
29
(1) Definition on slide 28
Q4 2019 Q4 2018
PBT reported Revenue specific items
Transfor-mation
charges(1)
Goodwill impairments
Restructuring & severance PBT Adjusted PBT reported Revenue
specific items
Transfor-mation
charges(1)
Goodwill impairments
Restructuring & severance PBT Adjusted
CB (107) - 154 (0) 123 170 327 - - - 14 340
IB (71) (28) 137 - 98 136 (185) (123) - - 39 (269)
PB (283) (21) 174 (0) 174 45 11 (75) - - 73 8
AM 177 - 21 - 3 202 59 - - - 27 87
C&O (154) - 37 - 29 (88) (109) - - - 21 (88)
Core Bank (437) (49) 524 (0) 427 465 103 (199) - - 173 78
CRU (856) 15 84 - 46 (711) (422) - - - 8 (415)
Group (1,293) (34) 608 (0) 473 (246) (319) (199) - - 181 (337)
FY 2019 FY 2018
PBT reported Revenue specific items
Transfor-mation
charges(1)
Goodwill impairments
Restructuring & severance PBT Adjusted PBT reported Revenue
specific items
Transfor-mation
charges(1)
Goodwill impairments
Restructuring & severance PBT Adjusted
CB 137 - 160 492 150 939 1,273 (57) - - 44 1,260
IB 433 (3) 214 - 219 863 856 (266) - - 233 823
PB (265) (105) 191 545 158 524 701 (368) - - 112 445
AM 468 - 30 - 41 539 368 - - - 45 413
C&O (229) - 39 - 82 (109) (433) - - - 60 (373)
Core Bank 543 (108) 635 1,037 649 2,756 2,765 (691) - - 494 2,568
CRU (3,177) 116 510 - 157 (2,395) (1,435) - - - 69 (1,366)
Group (2,634) 8 1,145 1,037 805 361 1,330 (691) - - 563 1,202
Q4 2019 results 30 January 2020
Deutsche BankInvestor Relations
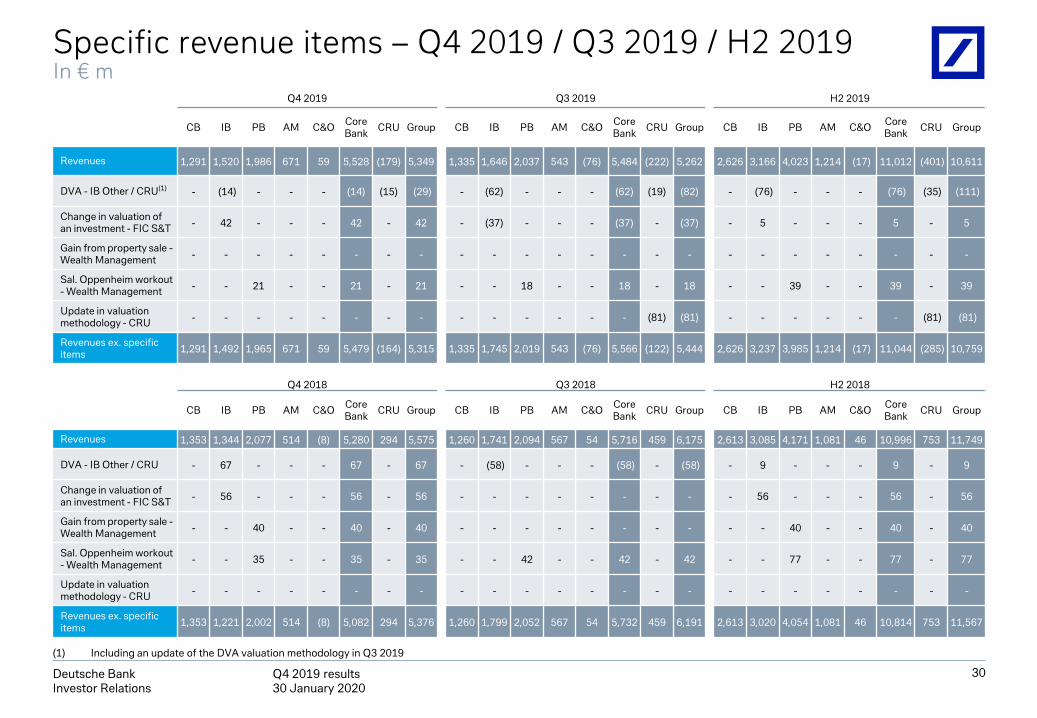
Q4 2019 Q3 2019 H2 2019
CB IB PB AM C&O Core Bank CRU Group CB IB PB AM C&O Core
Bank CRU Group CB IB PB AM C&O Core Bank CRU Group
Revenues 1,291 1,520 1,986 671 59 5,528 (179) 5,349 1,335 1,646 2,037 543 (76) 5,484 (222) 5,262 2,626 3,166 4,023 1,214 (17) 11,012 (401) 10,611
DVA - IB Other / CRU(1) - (14) - - - (14) (15) (29) - (62) - - - (62) (19) (82) - (76) - - - (76) (35) (111)
Change in valuation of an investment - FIC S&T - 42 - - - 42 - 42 - (37) - - - (37) - (37) - 5 - - - 5 - 5
Gain from property sale -Wealth Management - - - - - - - - - - - - - - - - - - - - - - - -
Sal. Oppenheim workout - Wealth Management - - 21 - - 21 - 21 - - 18 - - 18 - 18 - - 39 - - 39 - 39
Update in valuationmethodology - CRU - - - - - - - - - - - - - - (81) (81) - - - - - - (81) (81)
Revenues ex. specific items 1,291 1,492 1,965 671 59 5,479 (164) 5,315 1,335 1,745 2,019 543 (76) 5,566 (122) 5,444 2,626 3,237 3,985 1,214 (17) 11,044 (285) 10,759
Q4 2018 Q3 2018 H2 2018
CB IB PB AM C&O Core Bank CRU Group CB IB PB AM C&O Core
Bank CRU Group CB IB PB AM C&O Core Bank CRU Group
Revenues 1,353 1,344 2,077 514 (8) 5,280 294 5,575 1,260 1,741 2,094 567 54 5,716 459 6,175 2,613 3,085 4,171 1,081 46 10,996 753 11,749
DVA - IB Other / CRU - 67 - - - 67 - 67 - (58) - - - (58) - (58) - 9 - - - 9 - 9
Change in valuation of an investment - FIC S&T - 56 - - - 56 - 56 - - - - - - - - - 56 - - - 56 - 56
Gain from property sale -Wealth Management - - 40 - - 40 - 40 - - - - - - - - - - 40 - - 40 - 40
Sal. Oppenheim workout - Wealth Management - - 35 - - 35 - 35 - - 42 - - 42 - 42 - - 77 - - 77 - 77
Update in valuationmethodology - CRU - - - - - - - - - - - - - - - - - - - - - - - -
Revenues ex. specific items 1,353 1,221 2,002 514 (8) 5,082 294 5,376 1,260 1,799 2,052 567 54 5,732 459 6,191 2,613 3,020 4,054 1,081 46 10,814 753 11,567
Specific revenue items – Q4 2019 / Q3 2019 / H2 2019In € m
30
(1) Including an update of the DVA valuation methodology in Q3 2019
Q4 2019 results 30 January 2020
Deutsche BankInvestor Relations
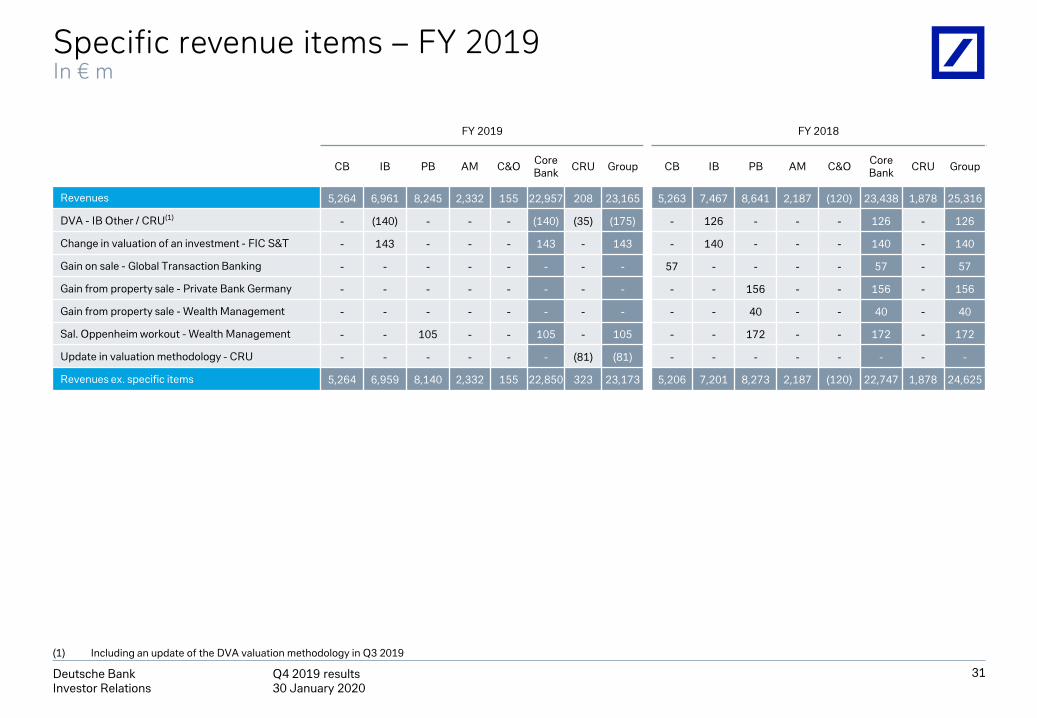
Specific revenue items – FY 2019In € m
FY 2019 FY 2018
CB IB PB AM C&O Core Bank CRU Group CB IB PB AM C&O Core
Bank CRU Group
Revenues 5,264 6,961 8,245 2,332 155 22,957 208 23,165 5,263 7,467 8,641 2,187 (120) 23,438 1,878 25,316
DVA - IB Other / CRU(1) - (140) - - - (140) (35) (175) - 126 - - - 126 - 126
Change in valuation of an investment - FIC S&T - 143 - - - 143 - 143 - 140 - - - 140 - 140
Gain on sale - Global Transaction Banking - - - - - - - - 57 - - - - 57 - 57
Gain from property sale - Private Bank Germany - - - - - - - - - - 156 - - 156 - 156
Gain from property sale - Wealth Management - - - - - - - - - - 40 - - 40 - 40
Sal. Oppenheim workout - Wealth Management - - 105 - - 105 - 105 - - 172 - - 172 - 172
Update in valuation methodology - CRU - - - - - - (81) (81) - - - - - - - -
Revenues ex. specific items 5,264 6,959 8,140 2,332 155 22,850 323 23,173 5,206 7,201 8,273 2,187 (120) 22,747 1,878 24,625
31
(1) Including an update of the DVA valuation methodology in Q3 2019
Q4 2019 results 30 January 2020
Deutsche BankInvestor Relations
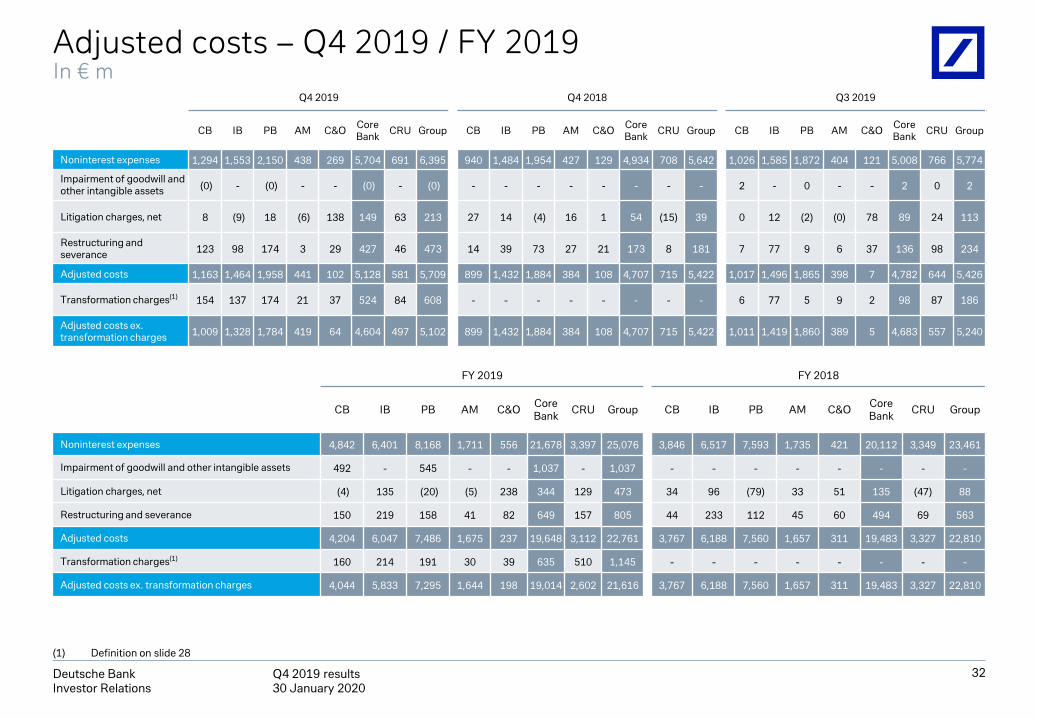
Adjusted costs – Q4 2019 / FY 2019In € m
Q4 2019 Q4 2018 Q3 2019
CB IB PB AM C&O Core Bank CRU Group CB IB PB AM C&O Core
Bank CRU Group CB IB PB AM C&O Core Bank CRU Group
Noninterest expenses 1,294 1,553 2,150 438 269 5,704 691 6,395 940 1,484 1,954 427 129 4,934 708 5,642 1,026 1,585 1,872 404 121 5,008 766 5,774
Impairment of goodwill andother intangible assets (0) - (0) - - (0) - (0) - - - - - - - - 2 - 0 - - 2 0 2
Litigation charges, net 8 (9) 18 (6) 138 149 63 213 27 14 (4) 16 1 54 (15) 39 0 12 (2) (0) 78 89 24 113
Restructuring and severance 123 98 174 3 29 427 46 473 14 39 73 27 21 173 8 181 7 77 9 6 37 136 98 234
Adjusted costs 1,163 1,464 1,958 441 102 5,128 581 5,709 899 1,432 1,884 384 108 4,707 715 5,422 1,017 1,496 1,865 398 7 4,782 644 5,426
Transformation charges(1) 154 137 174 21 37 524 84 608 - - - - - - - - 6 77 5 9 2 98 87 186
Adjusted costs ex. transformation charges 1,009 1,328 1,784 419 64 4,604 497 5,102 899 1,432 1,884 384 108 4,707 715 5,422 1,011 1,419 1,860 389 5 4,683 557 5,240
32
(1) Definition on slide 28
FY 2019 FY 2018
CB IB PB AM C&O Core Bank CRU Group CB IB PB AM C&O Core
Bank CRU Group
Noninterest expenses 4,842 6,401 8,168 1,711 556 21,678 3,397 25,076 3,846 6,517 7,593 1,735 421 20,112 3,349 23,461
Impairment of goodwill and other intangible assets 492 - 545 - - 1,037 - 1,037 - - - - - - - -
Litigation charges, net (4) 135 (20) (5) 238 344 129 473 34 96 (79) 33 51 135 (47) 88
Restructuring and severance 150 219 158 41 82 649 157 805 44 233 112 45 60 494 69 563
Adjusted costs 4,204 6,047 7,486 1,675 237 19,648 3,112 22,761 3,767 6,188 7,560 1,657 311 19,483 3,327 22,810
Transformation charges(1) 160 214 191 30 39 635 510 1,145 - - - - - - - -
Adjusted costs ex. transformation charges 4,044 5,833 7,295 1,644 198 19,014 2,602 21,616 3,767 6,188 7,560 1,657 311 19,483 3,327 22,810
Q4 2019 results 30 January 2020
Deutsche BankInvestor Relations
Q4 2019
Q4 2018 YoY
Q4 2018
ex FX(1)
YoYex FX
FY 2019
FY2018 YoY
FY 2018
ex FX(1)
YoYex FX
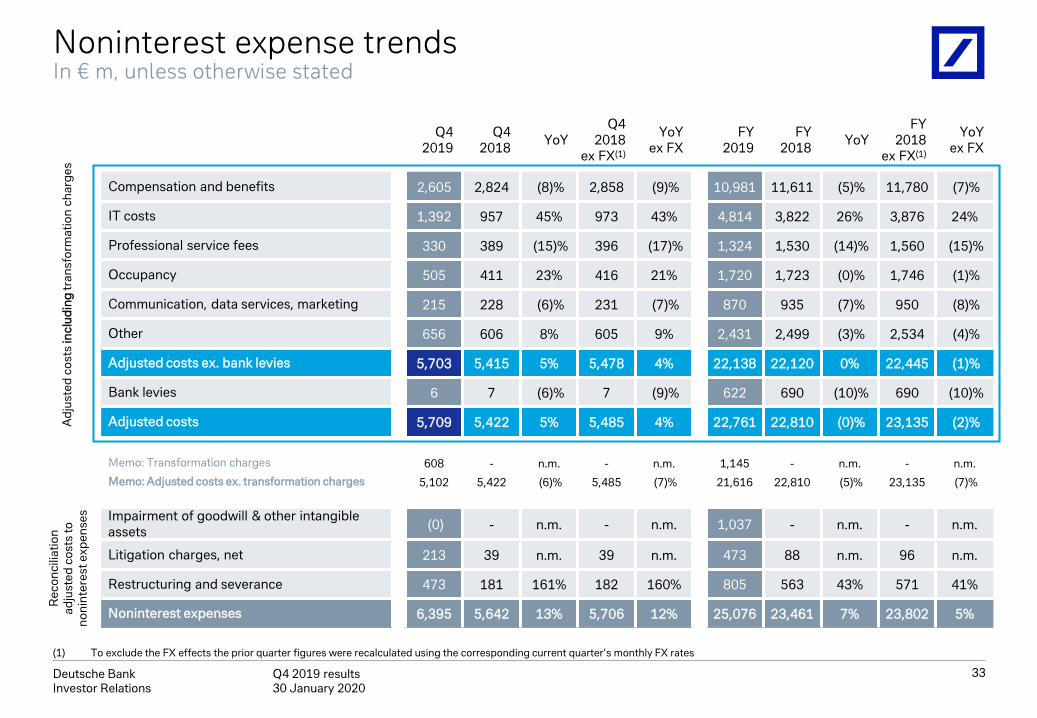
Compensation and benefits 2,605 2,824 (8)% 2,858 (9)% 10,981 11,611 (5)% 11,780 (7)%
IT costs 1,392 957 45% 973 43% 4,814 3,822 26% 3,876 24%
Professional service fees 330 389 (15)% 396 (17)% 1,324 1,530 (14)% 1,560 (15)%
Occupancy 505 411 23% 416 21% 1,720 1,723 (0)% 1,746 (1)%
Communication, data services, marketing 215 228 (6)% 231 (7)% 870 935 (7)% 950 (8)%
Other 656 606 8% 605 9% 2,431 2,499 (3)% 2,534 (4)%
Adjusted costs ex. bank levies 5,703 5,415 5% 5,478 4% 22,138 22,120 0% 22,445 (1)%
Bank levies 6 7 (6)% 7 (9)% 622 690 (10)% 690 (10)%
Adjusted costs 5,709 5,422 5% 5,485 4% 22,761 22,810 (0)% 23,135 (2)%
Memo: Transformation charges 608 - n.m. - n.m. 1,145 - n.m. - n.m.
Memo: Adjusted costs ex. transformation charges 5,102 5,422 (6)% 5,485 (7)% 21,616 22,810 (5)% 23,135 (7)%
Impairment of goodwill & other intangible assets (0) - n.m. - n.m. 1,037 - n.m. - n.m.
Litigation charges, net 213 39 n.m. 39 n.m. 473 88 n.m. 96 n.m.
Restructuring and severance 473 181 161% 182 160% 805 563 43% 571 41%
Noninterest expenses 6,395 5,642 13% 5,706 12% 25,076 23,461 7% 23,802 5%
Noninterest expense trends In € m, unless otherwise stated
(1) To exclude the FX effects the prior quarter figures were recalculated using the corresponding current quarter’s monthly FX rates
Rec
onci
liatio
nad
just
edco
sts
tono
nint
eres
texp
ense
s
33
Adj
uste
dco
sts
incl
udin
gtr
ansf
orm
atio
nch
arge
s
Q4 2019 results 30 January 2020
Deutsche BankInvestor Relations
Q4 2019
Q4 2018 YoY
Q4 2018
ex FX(1)
YoYex FX
FY2019
FY 2018 YoY
FY 2018
ex FX(1)
YoYex FX
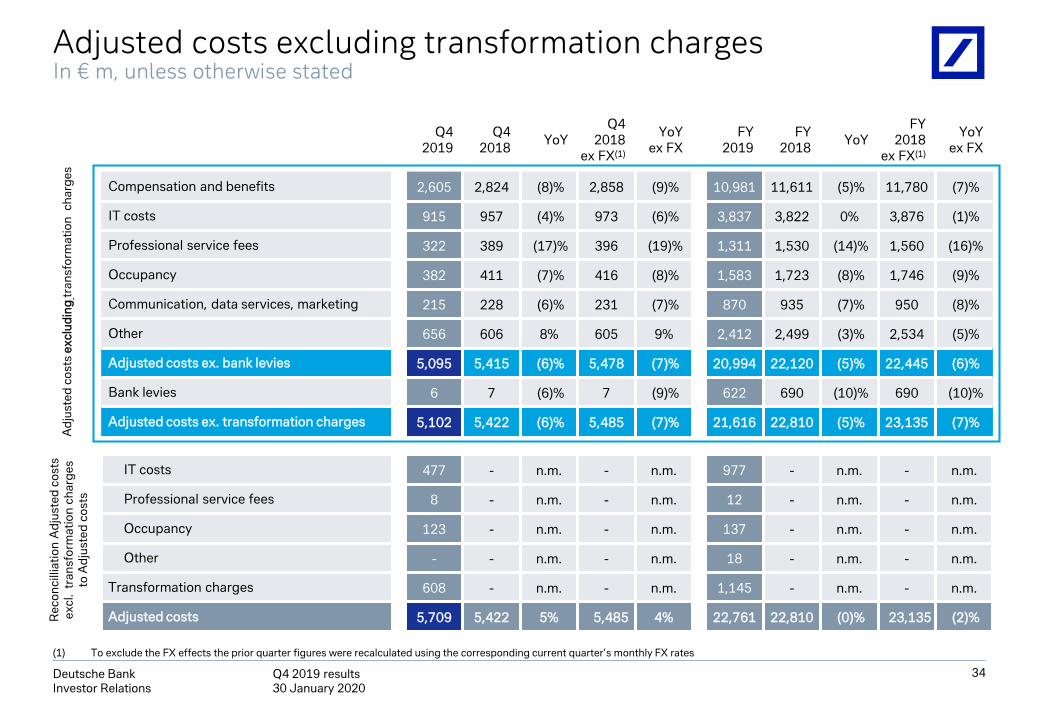
Compensation and benefits 2,605 2,824 (8)% 2,858 (9)% 10,981 11,611 (5)% 11,780 (7)%
IT costs 915 957 (4)% 973 (6)% 3,837 3,822 0% 3,876 (1)%
Professional service fees 322 389 (17)% 396 (19)% 1,311 1,530 (14)% 1,560 (16)%
Occupancy 382 411 (7)% 416 (8)% 1,583 1,723 (8)% 1,746 (9)%
Communication, data services, marketing 215 228 (6)% 231 (7)% 870 935 (7)% 950 (8)%
Other 656 606 8% 605 9% 2,412 2,499 (3)% 2,534 (5)%
Adjusted costs ex. bank levies 5,095 5,415 (6)% 5,478 (7)% 20,994 22,120 (5)% 22,445 (6)%
Bank levies 6 7 (6)% 7 (9)% 622 690 (10)% 690 (10)%
Adjusted costs ex. transformation charges 5,102 5,422 (6)% 5,485 (7)% 21,616 22,810 (5)% 23,135 (7)%
IT costs 477 - n.m. - n.m. 977 - n.m. - n.m.
Professional service fees 8 - n.m. - n.m. 12 - n.m. - n.m.
Occupancy 123 - n.m. - n.m. 137 - n.m. - n.m.
Other - - n.m. - n.m. 18 - n.m. - n.m.
Transformation charges 608 - n.m. - n.m. 1,145 - n.m. - n.m.
Adjusted costs 5,709 5,422 5% 5,485 4% 22,761 22,810 (0)% 23,135 (2)%
Adjusted costs excluding transformation chargesIn € m, unless otherwise stated
(1) To exclude the FX effects the prior quarter figures were recalculated using the corresponding current quarter’s monthly FX rates
34
Adj
uste
dco
sts
excl
udin
gtr
ansf
orm
atio
nch
arge
sR
econ
cilli
atio
nA
djus
ted
cost
sex
cl.
tran
sfor
mat
ion
char
ges
toA
djus
ted
cost
s
Q4 2019 results 30 January 2020
Deutsche BankInvestor Relations
62%
45%
85%
68%61%
10%18%
35%
5% 16%
24%
20% 20%9% 6%
14%
PrivateBank
AssetManagement
0%
CorporateBank
0%
0%
Investment Bank
1%
Group
Other(1)
US$
GB Pound
Euro56%
7%
87%
42%50%
9%
47%
1%
23%19%
17%32%
29% 19%
18% 14%8% 5% 12%
CorporateBank
Group
GB Pound
AssetManagement
Investment Bank
4%
PrivateBank
Other(1)
US$
Euro
35
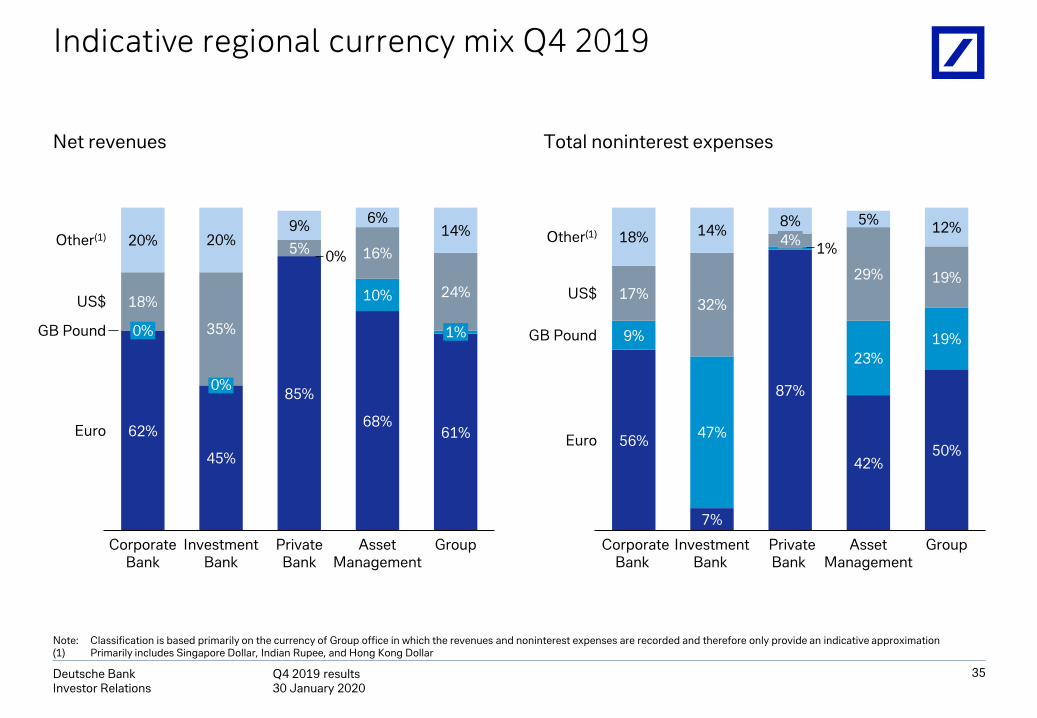
Indicative regional currency mix Q4 2019
Net revenues Total noninterest expenses
Note: Classification is based primarily on the currency of Group office in which the revenues and noninterest expenses are recorded and therefore only provide an indicative approximation(1) Primarily includes Singapore Dollar, Indian Rupee, and Hong Kong Dollar
Q4 2019 results 30 January 2020
Deutsche BankInvestor Relations
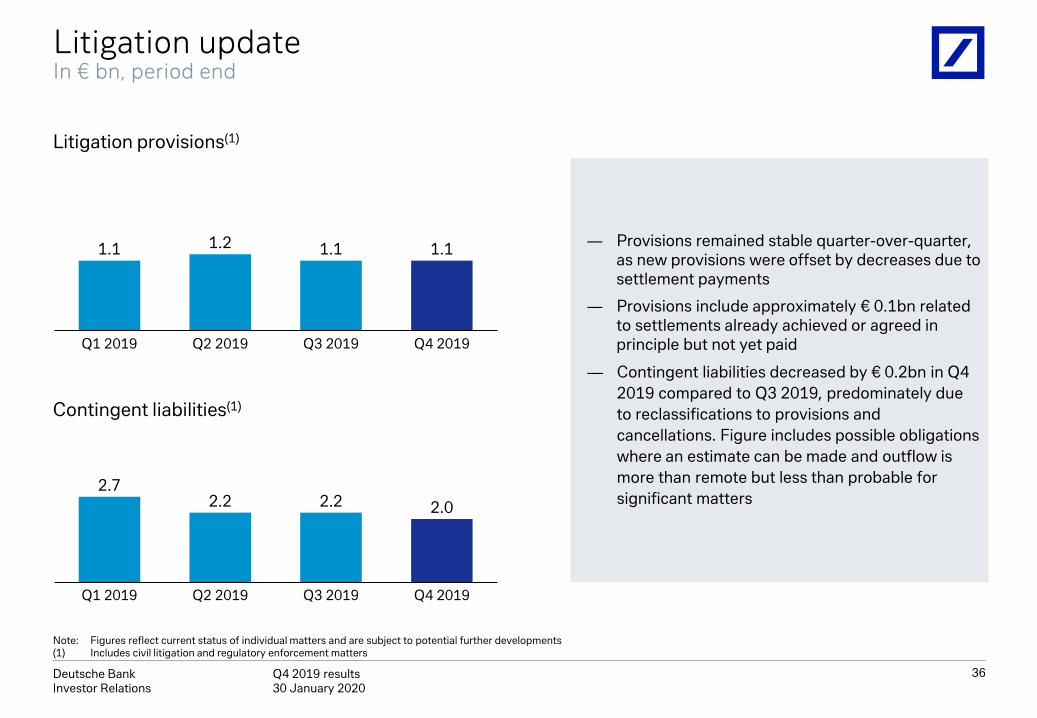
Note: Figures reflect current status of individual matters and are subject to potential further developments(1) Includes civil litigation and regulatory enforcement matters
Litigation updateIn € bn, period end
36
― Provisions remained stable quarter-over-quarter, as new provisions were offset by decreases due to settlement payments
― Provisions include approximately € 0.1bn related to settlements already achieved or agreed in principle but not yet paid
— Contingent liabilities decreased by € 0.2bn in Q4 2019 compared to Q3 2019, predominately due to reclassifications to provisions and cancellations. Figure includes possible obligations where an estimate can be made and outflow is more than remote but less than probable for significant matters
Litigation provisions(1)
Contingent liabilities(1)
1.1 1.2 1.1 1.1
Q1 2019 Q2 2019 Q3 2019 Q4 2019
2.72.2 2.2 2.0
Q3 2019Q1 2019 Q2 2019 Q4 2019
Q4 2019 results 30 January 2020
Deutsche BankInvestor Relations
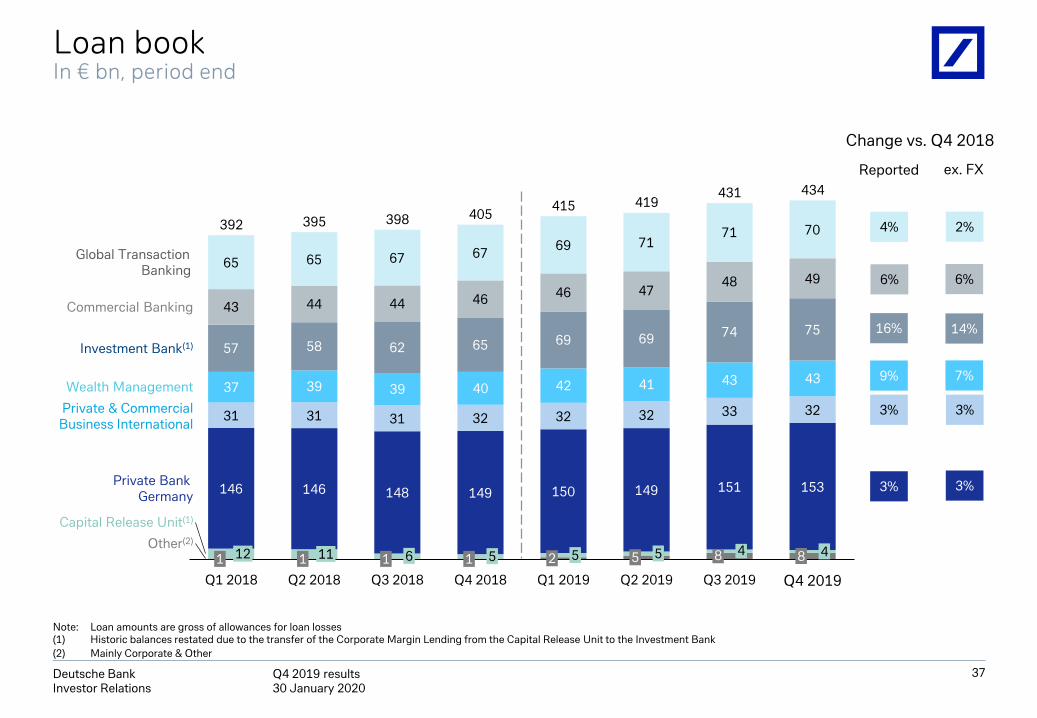
Loan bookIn € bn, period end
146 146 148 149 150 149 151 153
31 31 31 32 32 32 33 32
57 58 62 65 69 69 74 75
43 44 44 46 46 4748 49
65 65 67 67 69 7171 70
405
Wealth Management 37
1 12
39
Q1 2018
511 5
Q3 2018
39
6
415
51
Private & CommercialBusiness International
40
1
Investment Bank(1)
42
Q4 2018
2
Q1 2019
4341
5
Q2 2019
43
48
Q3 2019
48
Q4 2019Q2 2018
Commercial Banking
Private Bank Germany
Capital Release Unit(1)
1Other(2)
Global Transaction Banking
395 398419
431 434
392 4%
16%
9%
3%
3%
6%
Change vs. Q4 2018
Reported
37
ex. FX
2%
14%
7%
3%
3%
6%
Note: Loan amounts are gross of allowances for loan losses(1) Historic balances restated due to the transfer of the Corporate Margin Lending from the Capital Release Unit to the Investment Bank(2) Mainly Corporate & Other
Q4 2019 results 30 January 2020
Deutsche BankInvestor Relations
38
Private Bank Corporate BankInvestment BankOtherCapital Release Unit
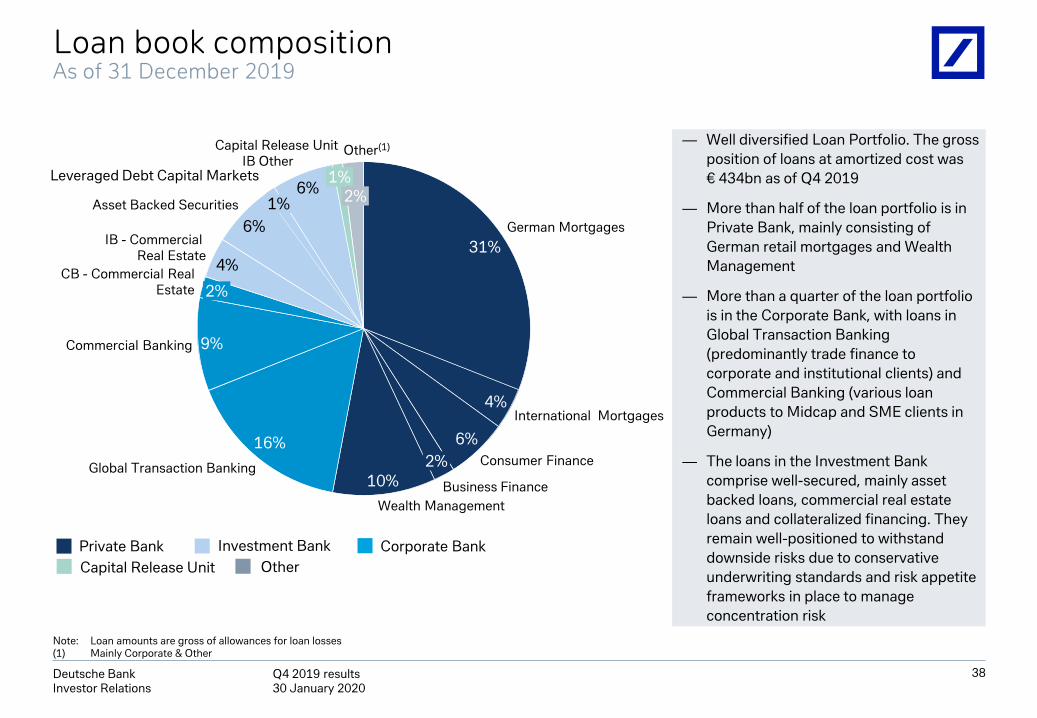
— Well diversified Loan Portfolio. The gross position of loans at amortized cost was€ 434bn as of Q4 2019
— More than half of the loan portfolio is in Private Bank, mainly consisting of German retail mortgages and Wealth Management
— More than a quarter of the loan portfolio is in the Corporate Bank, with loans in Global Transaction Banking (predominantly trade finance to corporate and institutional clients) and Commercial Banking (various loan products to Midcap and SME clients in Germany)
— The loans in the Investment Bank comprise well-secured, mainly asset backed loans, commercial real estate loans and collateralized financing. They remain well-positioned to withstand downside risks due to conservative underwriting standards and risk appetite frameworks in place to manage concentration risk
Note: Loan amounts are gross of allowances for loan losses(1) Mainly Corporate & Other
31%
4%
6%
10%
16%
9%
4%
6%
6%
Commercial Banking
German Mortgages
International Mortgages
Consumer FinanceGlobal Transaction Banking
Wealth Management
2%
Business Finance
2%
Capital Release Unit
CB - Commercial RealEstate
IB - Commercial Real Estate
Asset Backed Securities 1%
Leveraged Debt Capital MarketsIB Other
1%2%
Other(1)
Loan book compositionAs of 31 December 2019
Q4 2019 results 30 January 2020
Deutsche BankInvestor Relations
Provision for credit losses and stage 3 loans
114 10763 54
119
8744
60 76
104
45
44 20
38
26
9
Q4 Q4Q2
7
(18)
Q1
(8)
Q3(14)
252
140 161 175
247
Investment BankPrivate Bank
Corporate Bank Capital Release Unit
4.4 4.5 4.4 4.5 4.5
1.5 1.5 1.8 1.7 1.9
1.0 0.8
2.0 2.3 2.2 2.3 2.2
Q2
0.50.6
Q4 Q1
0.5 0.7
9.6
0.70.6
Q3
0.50.6
Q4
9.4 9.8 9.8 9.7
Purchased or Originated Credit Impaired (POCI)
PB (ex-POCI)
IB (ex-POCI)
CB (ex-POCI)
CRU (ex-POCI)
Group Stage 3 at amortized cost %(2)
2.3% 2.3% 2.3% 2.3% 2.2%
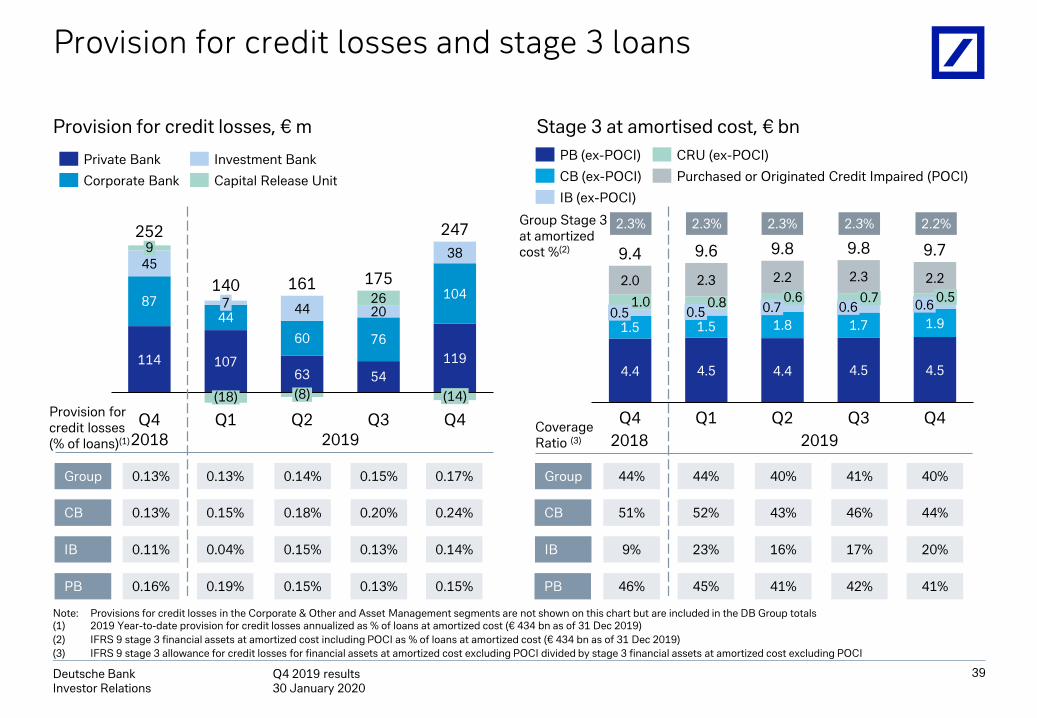
Provision for credit losses, € m Stage 3 at amortised cost, € bn
Provision for credit losses(% of loans)(1)2018 2019
Coverage Ratio (3)
Group 0.13% 0.13% 0.14% 0.15% 0.17% Group 44% 44% 40% 41% 40%
2018 2019
CB 51% 52% 43% 46% 44%CB 0.13% 0.15% 0.18% 0.20% 0.24%
PB 46% 45% 41% 42% 41%PB 0.16% 0.19% 0.15% 0.13% 0.15%
39
Note: Provisions for credit losses in the Corporate & Other and Asset Management segments are not shown on this chart but are included in the DB Group totals(1) 2019 Year-to-date provision for credit losses annualized as % of loans at amortized cost (€ 434 bn as of 31 Dec 2019)(2) IFRS 9 stage 3 financial assets at amortized cost including POCI as % of loans at amortized cost (€ 434 bn as of 31 Dec 2019)(3) IFRS 9 stage 3 allowance for credit losses for financial assets at amortized cost excluding POCI divided by stage 3 financial assets at amortized cost excluding POCI
IB 9% 23% 16% 17% 20%IB 0.11% 0.04% 0.15% 0.13% 0.14%
Q4 2019 results 30 January 2020
Deutsche BankInvestor Relations
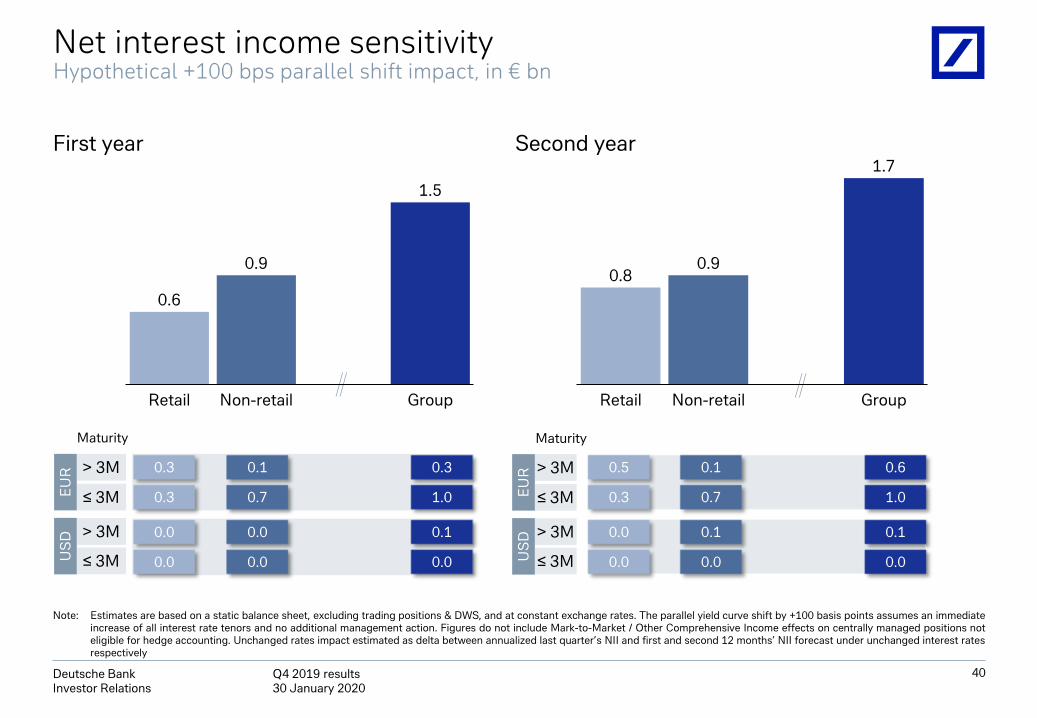
Net interest income sensitivityHypothetical +100 bps parallel shift impact, in € bn
40
Note: Estimates are based on a static balance sheet, excluding trading positions & DWS, and at constant exchange rates. The parallel yield curve shift by +100 basis points assumes an immediateincrease of all interest rate tenors and no additional management action. Figures do not include Mark-to-Market / Other Comprehensive Income effects on centrally managed positions noteligible for hedge accounting. Unchanged rates impact estimated as delta between annualized last quarter’s NII and first and second 12 months’ NII forecast under unchanged interest ratesrespectively
> 3M
≤ 3M
> 3M
≤ 3M
0.3
0.3
0.1
0.7
0.3
1.0
0.0
0.0
0.0
0.0
0.1
0.0
EU
RU
SD
0.5
0.3
0.1
0.7
0.6
1.0
0.0
0.0
0.1
0.0
0.1
0.0
> 3M
≤ 3M
> 3M
≤ 3M
EU
RU
SD
First year Second year
Maturity Maturity
Retail Non-retail
0.8
Group
0.9
1.7
0.9
Retail
1.5
Non-retail Group
0.6
Q4 2019 results 30 January 2020
Deutsche BankInvestor Relations
Level 3 assets In € bn, as of 31 December 2019
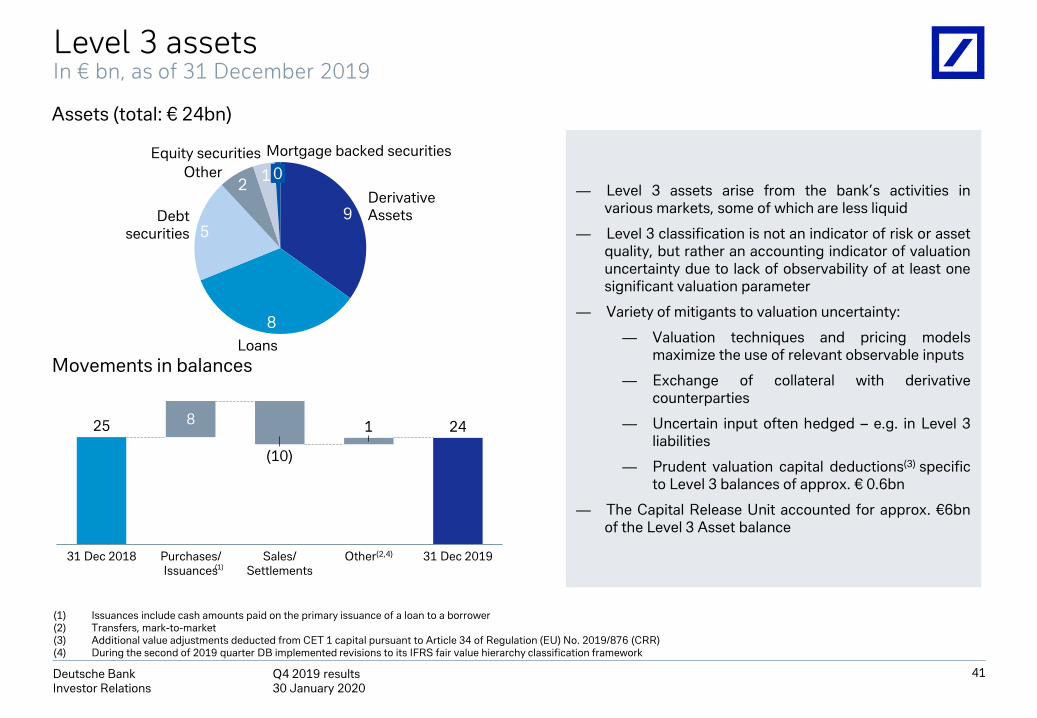
— Level 3 assets arise from the bank’s activities invarious markets, some of which are less liquid
— Level 3 classification is not an indicator of risk or assetquality, but rather an accounting indicator of valuationuncertainty due to lack of observability of at least onesignificant valuation parameter
— Variety of mitigants to valuation uncertainty:
— Valuation techniques and pricing modelsmaximize the use of relevant observable inputs
— Exchange of collateral with derivativecounterparties
— Uncertain input often hedged – e.g. in Level 3liabilities
— Prudent valuation capital deductions(3) specificto Level 3 balances of approx. € 0.6bn
— The Capital Release Unit accounted for approx. €6bnof the Level 3 Asset balance
9DerivativeAssets
8
Debtsecurities
2Other
Loans
5
1Equity securities Mortgage backed securities
0
Assets (total: € 24bn)
41
[8]
Movements in balances
31 Dec 2018
(10)
8
Purchases/ Issuances
Sales/ Settlements
1
Other(2,4) 31 Dec 2019
25 24
(1)
(1) Issuances include cash amounts paid on the primary issuance of a loan to a borrower(2) Transfers, mark-to-market (3) Additional value adjustments deducted from CET 1 capital pursuant to Article 34 of Regulation (EU) No. 2019/876 (CRR)(4) During the second of 2019 quarter DB implemented revisions to its IFRS fair value hierarchy classification framework
Q4 2019 results 30 January 2020
Deutsche BankInvestor Relations
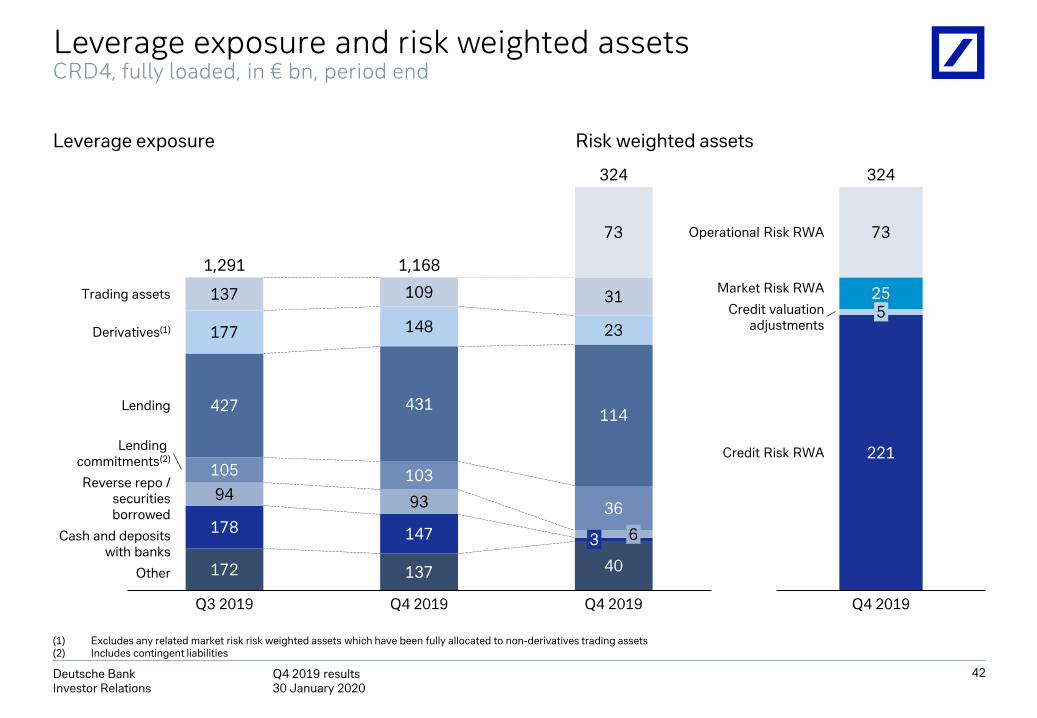
Leverage exposure and risk weighted assetsCRD4, fully loaded, in € bn, period end
42
250
221
73
Market Risk RWA
525
Q4 2019
Operational Risk RWA
Credit valuationadjustments
Credit Risk RWA
324
3
177
137
427
105
Q3 2019
148
431
93
137
109
Lending commitments(2)
31
1,291
23
114
73
36
Q4 2019
6
40
Trading assets
Derivatives(1)
172
Lending
Reverse repo /securitiesborrowed
178Cash and depositswith banks
Other
147
103
Q4 2019
94
1,168
324
(1) Excludes any related market risk risk weighted assets which have been fully allocated to non-derivatives trading assets(2) Includes contingent liabilities
Leverage exposure Risk weighted assets
Q4 2019 results 30 January 2020
Deutsche BankInvestor Relations
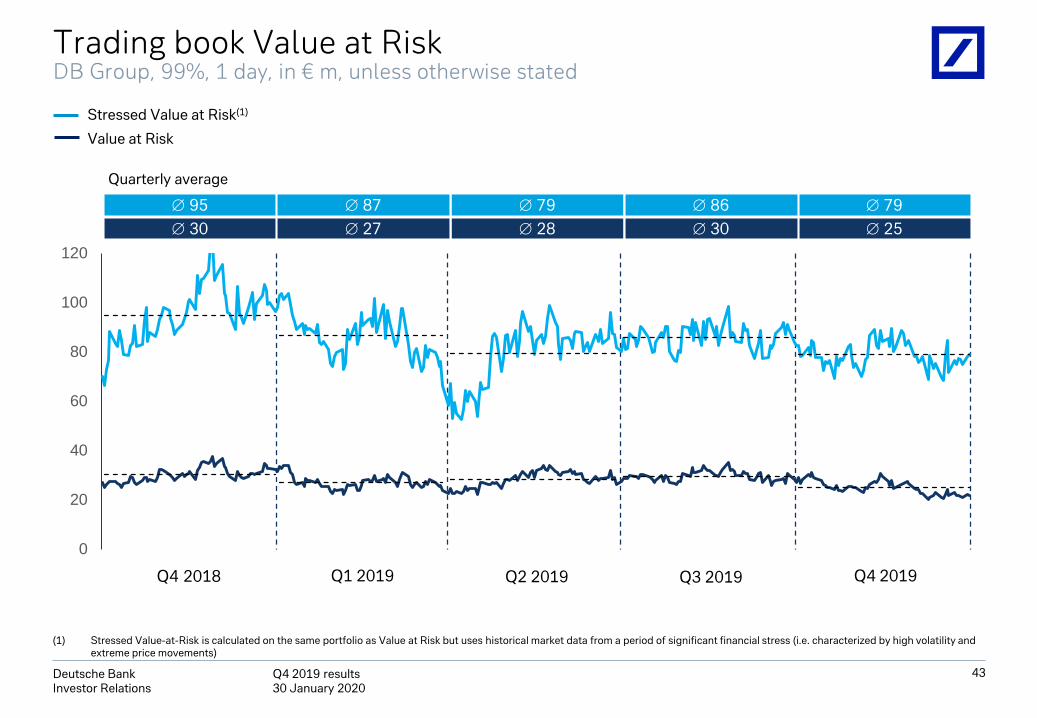
Stressed Value at Risk(1)
Value at Risk
Q2 2019Q4 2018 Q1 2019
(1) Stressed Value-at-Risk is calculated on the same portfolio as Value at Risk but uses historical market data from a period of significant financial stress (i.e. characterized by high volatility and extreme price movements)
Quarterly average
Q3 2019
0
20
40
60
80
100
120
Q4 2019
∅ 79∅ 25
∅ 79∅ 95 ∅ 87∅ 28∅ 30 ∅ 27
∅ 86∅ 30
43
Trading book Value at RiskDB Group, 99%, 1 day, in € m, unless otherwise stated
Q4 2019 results 30 January 2020
Deutsche BankInvestor Relations
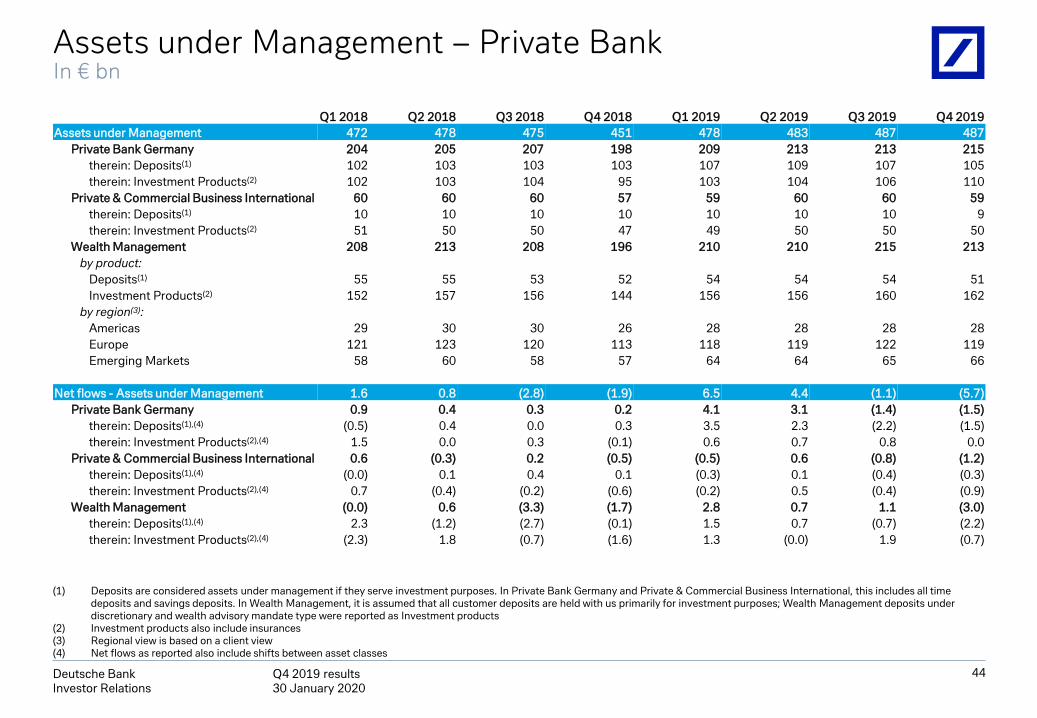
Assets under Management – Private BankIn € bn
(1) Deposits are considered assets under management if they serve investment purposes. In Private Bank Germany and Private & Commercial Business International, this includes all time deposits and savings deposits. In Wealth Management, it is assumed that all customer deposits are held with us primarily for investment purposes; Wealth Management deposits under discretionary and wealth advisory mandate type were reported as Investment products
(2) Investment products also include insurances (3) Regional view is based on a client view(4) Net flows as reported also include shifts between asset classes
44
Q1 2018 Q2 2018 Q3 2018 Q4 2018 Q1 2019 Q2 2019 Q3 2019 Q4 2019Assets under Management 472 478 475 451 478 483 487 487
Private Bank Germany 204 205 207 198 209 213 213 215therein: Deposits(1) 102 103 103 103 107 109 107 105therein: Investment Products(2) 102 103 104 95 103 104 106 110
Private & Commercial Business International 60 60 60 57 59 60 60 59therein: Deposits(1) 10 10 10 10 10 10 10 9therein: Investment Products(2) 51 50 50 47 49 50 50 50
Wealth Management 208 213 208 196 210 210 215 213by product:
Deposits(1) 55 55 53 52 54 54 54 51Investment Products(2) 152 157 156 144 156 156 160 162
by region(3):Americas 29 30 30 26 28 28 28 28Europe 121 123 120 113 118 119 122 119Emerging Markets 58 60 58 57 64 64 65 66
Net flows - Assets under Management 1.6 0.8 (2.8) (1.9) 6.5 4.4 (1.1) (5.7)Private Bank Germany 0.9 0.4 0.3 0.2 4.1 3.1 (1.4) (1.5)
therein: Deposits(1),(4) (0.5) 0.4 0.0 0.3 3.5 2.3 (2.2) (1.5)therein: Investment Products(2),(4) 1.5 0.0 0.3 (0.1) 0.6 0.7 0.8 0.0
Private & Commercial Business International 0.6 (0.3) 0.2 (0.5) (0.5) 0.6 (0.8) (1.2)therein: Deposits(1),(4) (0.0) 0.1 0.4 0.1 (0.3) 0.1 (0.4) (0.3)therein: Investment Products(2),(4) 0.7 (0.4) (0.2) (0.6) (0.2) 0.5 (0.4) (0.9)
Wealth Management (0.0) 0.6 (3.3) (1.7) 2.8 0.7 1.1 (3.0)therein: Deposits(1),(4) 2.3 (1.2) (2.7) (0.1) 1.5 0.7 (0.7) (2.2)therein: Investment Products(2),(4) (2.3) 1.8 (0.7) (1.6) 1.3 (0.0) 1.9 (0.7)
Q4 2019 results 30 January 2020
Deutsche BankInvestor Relations
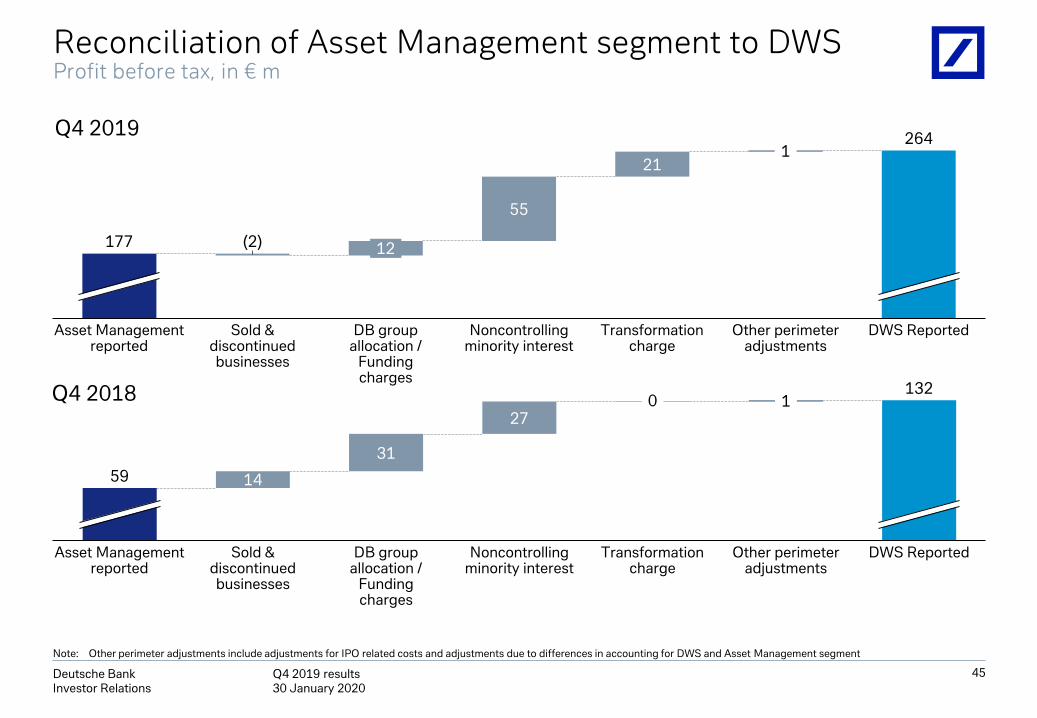
Reconciliation of Asset Management segment to DWSProfit before tax, in € m
45
55
21
Noncontrolling minority interest
Asset Management reported
(2)
Sold & discontinued businesses
12
DB group allocation /
Fundingcharges
Transformation charge
1
Other perimeter adjustments
DWS Reported
177
264
14
31
27
Other perimeter adjustments
Sold & discontinued businesses
Asset Management reported
DB group allocation /
Funding charges
Noncontrolling minority interest
0
Transformation charge
1
DWS Reported
59
132
Q4 2019
Q4 2018
Note: Other perimeter adjustments include adjustments for IPO related costs and adjustments due to differences in accounting for DWS and Asset Management segment
Q4 2019 results 30 January 2020
Deutsche BankInvestor Relations
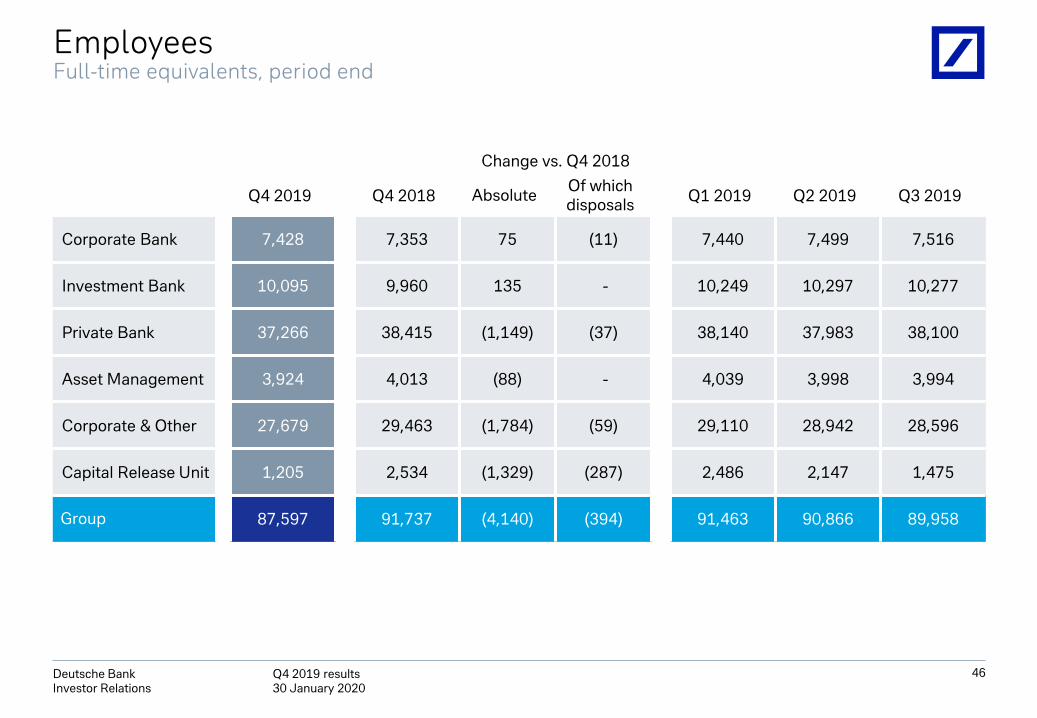
EmployeesFull-time equivalents, period end
Change vs. Q4 2018
Q4 2019 Q4 2018 Absolute Of which disposals Q1 2019 Q2 2019 Q3 2019
Corporate Bank 7,428 7,353 75 (11) 7,440 7,499 7,516
Investment Bank 10,095 9,960 135 - 10,249 10,297 10,277
Private Bank 37,266 38,415 (1,149) (37) 38,140 37,983 38,100
Asset Management 3,924 4,013 (88) - 4,039 3,998 3,994
Corporate & Other 27,679 29,463 (1,784) (59) 29,110 28,942 28,596
Capital Release Unit 1,205 2,534 (1,329) (287) 2,486 2,147 1,475
Group 87,597 91,737 (4,140) (394) 91,463 90,866 89,958
46
Q4 2019 results 30 January 2020
Deutsche BankInvestor Relations
Cautionary statements
47
The figures in this presentation are preliminary and unaudited. Our Annual Report 2019 and SEC Form 20-F arescheduled to be published on 20 March 2020.
This presentation contains forward-looking statements. Forward-looking statements are statements that are nothistorical facts; they include statements about our beliefs and expectations and the assumptions underlying them.These statements are based on plans, estimates and projections as they are currently available to the management ofDeutsche Bank. Forward-looking statements therefore speak only as of the date they are made, and we undertake noobligation to update publicly any of them in light of new information or future events.
By their very nature, forward-looking statements involve risks and uncertainties. A number of important factors couldtherefore cause actual results to differ materially from those contained in any forward-looking statement. Such factorsinclude the conditions in the financial markets in Germany, in Europe, in the United States and elsewhere from whichwe derive a substantial portion of our revenues and in which we hold a substantial portion of our assets, thedevelopment of asset prices and market volatility, potential defaults of borrowers or trading counterparties, theimplementation of our strategic initiatives, the reliability of our risk management policies, procedures and methods,and other risks referenced in our filings with the U.S. Securities and Exchange Commission. Such factors are describedin detail in our SEC Form 20-F of 22 March 2019 under the heading “Risk Factors.” Copies of this document arereadily available upon request or can be downloaded from www.db.com/ir.
This presentation also contains non-IFRS financial measures. For a reconciliation to directly comparable figuresreported under IFRS, to the extent such reconciliation is not provided in this presentation, refer to the Q4 2019Financial Data Supplement, which is accompanying this presentation and available at www.db.com/ir.