Q4 FY’18 - Jindal Steel and Power · uncertainties and the actual results could materially differ...
42
Q4 FY’18 Industry Update & Key Performance Highlights 9 th May, 2018
Transcript of Q4 FY’18 - Jindal Steel and Power · uncertainties and the actual results could materially differ...

Q4 FY’18
Industry Update &
Key Performance Highlights
9th May, 2018

This presentation may contain certain forward looking statements concerning JSPL’s future business prospects and business profitability, which are subject to a number of risks and uncertainties and the actual results could materially differ from those in such forward looking statements.
The risks and uncertainties relating to these statements include, but are not limited to, risks and uncertainties regarding fluctuations in earnings, our ability to manage growth, competition (both domestic and international), economic growth in India and the target countries for exports, ability to attract and retain highly skilled professionals, time and cost over runs on contracts, our ability to manage our international operations, government policies and actions with respect to investments, fiscal deficits, regulations, etc., interest and other fiscal costs generally prevailing in the economy. Past performance may not be indicative of future performance. We do not undertake to update our forward-looking statements.
This presentation is not intended, and does not, constitute or form part of any offer, invitation or the solicitation of an offer to purchase, otherwise acquire, subscribe for, sell or otherwise dispose of, any securities in JSPL or any of it’s subsidiary undertakings or any other invitation or inducement to engage in investment activities, neither shall this presentation nor the fact of it’s distribution form the basis of, or be relied on in connection with, any contract or investment decision. Few numbers in this presentation are purely indicative & provisional and could change later.
2
Q4 FY’18
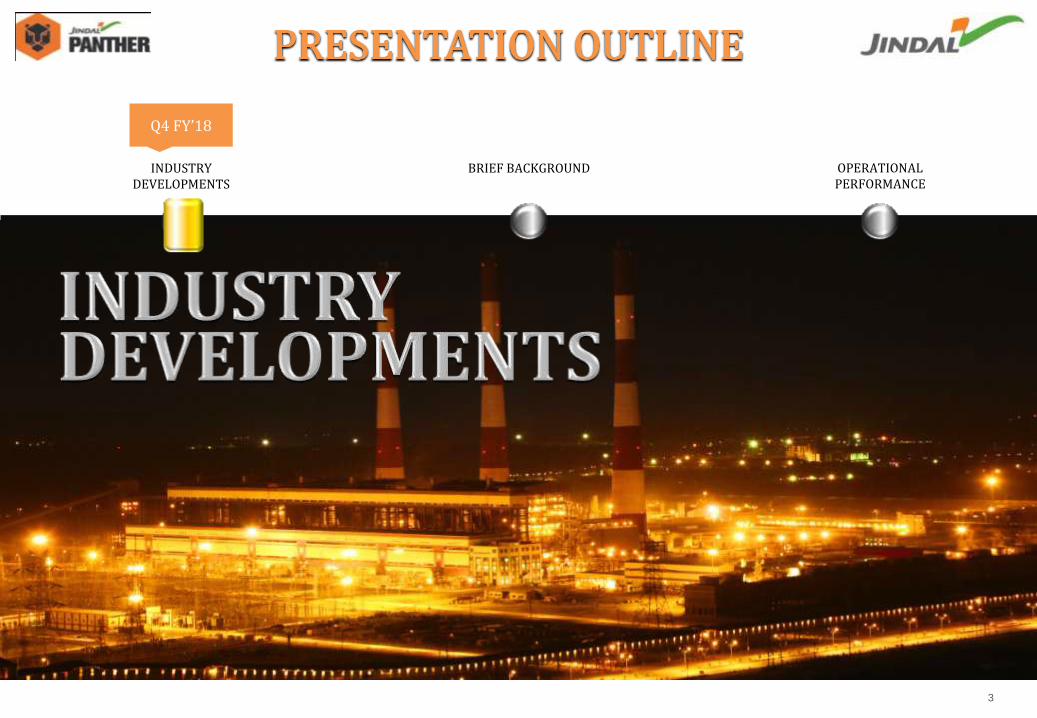
INDUSTRY DEVELOPMENTS
BRIEF BACKGROUND OPERATIONAL PERFORMANCE
3

11 11
8
4.85
Au
g-15
Sep
-15
Oct
-15
No
v-15
Dec
-15
Jan
-16
Feb
-16
Mar
-16
Ap
r-16
May
-16
Jun
-16
Jul-
16
Au
g-16
Sep
-16
Oct
-16
No
v-16
Dec
-16
Jan
-17
Feb
-17
Mar
-17
Ap
r-17
May
-17
Jun
-17
Jul-
17
Au
g-17
Sep
-17
Oct
-17
No
v-17
Dec
-17
Jan
-18
Feb
-18
Mar
-18
80%
77%
74% 73%
70% 69%
72%
73%
75%
CY 11 CY 12 CY 13 CY 14 CY 15 CY 16 CY 17 Feb '18 March '18
Steel demand recovered across key markets > Tail wind continue to push
Capacity cuts in China improve supply and demand balance >150 mt cuts according to long-term capacity reduction plan >35 mt cuts expected going forward due to stricter environmental policies >protectionism and capacity reduction lead to lower pressure from Chinese
Export
48%
> Chinese Export Down by 48% from its peak level > Global Steel Capacity Utilization improved in CY17
> Global economic momentum bodes well for steel demand growth
Strong Global Economy: >Global growth momentum strengthens and is on a broader footing . Solid U.S.
fundamental, firming recovery in EU, China re-acceleration, recovery in developing economies .
>Moderate rebound in oil prices, contained inflation >Most benign global economic environment since the financial crisis >Growth in India and ASEAN remains on a solid ground >Many developing countries are progressing with structural reforms
6%
711 672 681 766 766
826 828 835 856 882
CY14 CY15 CY16 CY17E CY18E
1,537 1,500 1,516 1,622 1,648
> Following the closure of outdated induction furnaces in FY17 , nominal growth rate for steel demand in China increased to 12.4% / 766 million tonnes > WSA expects 1.8% world demand growth for finished steel for CY 18
Global steel demand (Mt) China Rest of the world
Source: WSA/CISA/Broker Reports/JSPL Estimates
Better Economy & Steel Demand-Supply Balance
4
475
580
210 200
03
/Ap
r/1
7
24
/Ap
r/1
7
15
/May
/…
05
/Ju
n/1
7
26
/Ju
n/1
7
17
/Ju
l/1
7
07
/Au
g/1
7
28
/Au
g/1
7
18
/Sep
/17
09
/Oct
/17
30
/Oct
/17
20
/No
v/1
7
11
/Dec
/17
01
/Jan
/18
22
/Jan
/18
12
/Feb
/18
05
/Mar
/18
26
/Mar
/18
HRC Export China FOB RM Basket
$379
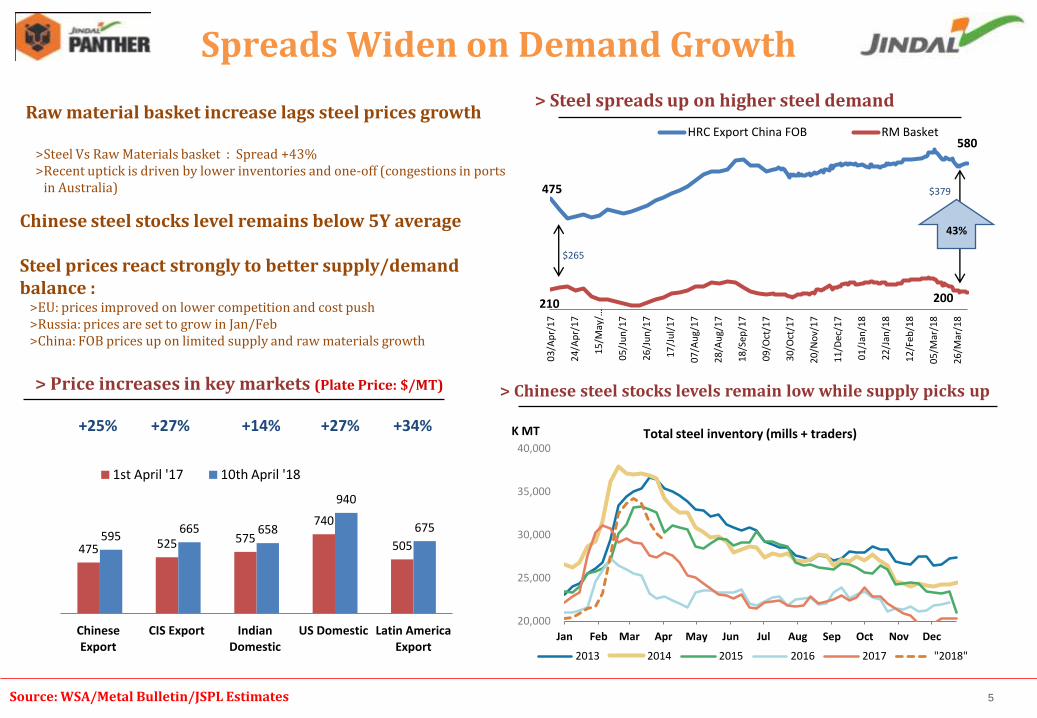
Raw material basket increase lags steel prices growth
>Steel Vs Raw Materials basket : Spread +43% >Recent uptick is driven by lower inventories and one-off (congestions in ports
in Australia)
> Chinese steel stocks levels remain low while supply picks up > Price increases in key markets (Plate Price: $/MT)
> Steel spreads up on higher steel demand
Chinese steel stocks level remains below 5Y average Steel prices react strongly to better supply/demand balance :
>EU: prices improved on lower competition and cost push >Russia: prices are set to grow in Jan/Feb >China: FOB prices up on limited supply and raw materials growth
475 525 575
740
505 595
665 658
940
675
Chinese Export
CIS Export Indian Domestic
US Domestic Latin America Export
1st April '17 10th April '18
+25% +27% +14% +27% +34%
43%
20,000
25,000
30,000
35,000
40,000
Jan Feb Mar Apr May Jun Jul Aug Sep Oct Nov Dec
K MT Total steel inventory (mills + traders)
2013 2014 2015 2016 2017 "2018"
$265
Source: WSA/Metal Bulletin/JSPL Estimates
Spreads Widen on Demand Growth
5

ASIA
CHINA
NAFTA EU (28)
CIS
GCC
INDIA
1.8%
0.7%
2018 2019
1616 Mt 1627 Mt
5.5%
6.0%
2018 2019
92 Mt 97.5 Mt
WORLD
3.0% 1.6%
2018 2019
145 Mt 147 Mt
2018 2019
166 Mt 167 Mt
2.0% 0.8%
2018 2019
25 Mt 26 Mt
3.9% 2.4%
2018 2019
54 Mt 55 Mt
2.3% 1.8%
0.0%
-2.0%
2018 2019
737 Mt 722 Mt
1.8%
-0.2%
2018 2019
1065 Mt 1063 Mt
Source: WSA
World: Short Range Demand Outlook
6

GCC Market: > There is a clear domestic supply gap over Consumption
>Crude Production grown up by a CAGR 11% (7 years)
>Consumption of Steel grown up by a CAGR 2.7% (7 years)
> Long Steel consumption (~75%) higher Vs Flat Steel
> Majority of Expansions by state-affiliated companies: • Like Sabic, ESI, Qasco etc.
> Pellet: • GIIC (Bahrain) and Vale (Oman) Cumulative Pellet
capacity of 20 Mt • Enough to satisfy much of the merchant demand
GCC: Bahrain, Kuwati, Oman, Qatar, Saudi Arabia & UAE
> GCC: Crude Production Vs Consumption
Middle East Market: >The Middle East market is heavily depended on the imports > Annual Net Imports of more then 20 Mt However net imports is declining over the last few years due to emergence of local supply
> Middle East : Net Import Middle East
7.5
11.6 12.1 13.1
15.3 14.9 15.2 15.5
22.0 23.3
25.2 26.8 27.3 26.9 26.3 26.6
2010 2011 2012 2013 2014 2015 2016 2017e
Crude Produciton Steel Consumption (Crude Eq)
2 3
2 2 4
6
10
34 34 34
27 29 29
32
32 31 32
25 24 22 22
2010 2011 2012 2013 2014 2015 2016
Exports (Semi & Finished Steel)
Imports (Semi & Finished Steel)
Net Imports
11 Mt
GCC Countries: Depend on Steel Imports
Source: WSA/SPL Estimates 7

Source: CRISIL Research
71.0 73.5 74.0 77.0 81.5 83.9 88.1 92.9 113
6.9%
3.5%
0.8%
3.9% 5.9%
2.9%
4.5 - 5.5% 5 - 6%
0.0%
1.0%
2.0%
3.0%
4.0%
5.0%
6.0%
7.0%
8.0%
-
20.0
40.0
60.0
80.0
100.0
120.0
2011-12 2012-13 2013-14 2014-15 2015-16 2016-17E 2017-18P 2018-19P 2021-22P
Steel consumption Y-o-Y Growth (RHS)
7-7.5%
(MT) CAGR 6 – 6.5% CAGR 3.4%
> Indian steel demand forecast Increased government spending to spur growth
>India’s per capita steel consumption is expected to increase to 175 Kg in 2025; potentially a 250Mt crude consumption opportunity, >GDP Per capita has gone up to ~$2000/Capita in March ’18 compared with $1,751.85 in March ’17, will likely to go further >Government pushing for more steel intensive manufacturing industries and Construction practices
Robust Outlook for Indian Steel Industry
Source: CRISIL/World Bank/JSPL Estimates 8

It is estimated that, on average, a 1% increase in infrastructure investment is associated with a 1.2% increase in GDP growth > Mega programme for Road Construction (Bharatmala) > Significant Railway reform & Spending > Emergence of New Infra Segments:
• Civil Aviation : Nextgen Airport for Bharat (NABH Nirman) & UDAN Scheme
• Impetus on Solar & Renewables Power • Metros in A & B Class city
>Gov initiated major reforms, project implementation becomes swifter
• Reduction of Stuck projects • Project running behind Declined (Current 25% Vs
56% in March 13 • Better Payment terms & Speedier Dispute
Resolution • Open & Transparent Bidding in various projects
> National Highway construction pace accelerated
• Current 26KM/day Vs 3-6KM/day during 2012-14
163 147
109
70 60
41 32
16 10
Power Gen Indian Railways
Road Power Distri
Metro Railways
Power Trans
Urban Infra
Airports Ports
> Estimated Infra Capex planned : Total $650 Billion in 5 years (2018 to 2023)
Fig in $ Billion
25% 23% 17% 11% 9% 6% 5% 2% 2%
> FDI in Infra Picks Up
Impetus on Infrastructure Spending
Source: GOI Announcements/JSPL Estimates 9

Fig in Mt Category Consumption
(FY’ 17) Growth (y-o-y)
Consumption (FY’18)
Growth (y-o-y)
Long Carbon
Steel
Bars & Rods 33.7 5.1% 34.4 2.2%
Structurals 7.8 4.3% 8.0 2.2%
Rly. Materials 1.05 13 % 1.23 17.3%
Flat Carbon
Steel
Plate 5.15 2.1% 5.13 (0.4)%
HRC/Skelp 13.68 9.8% 16.4 20%
CR Sheets/Coils 4.4 2.1% 3.3 (25)%
GP/GC 6.6 0.9% 7.6 14%
Finished Carbon Steel 76.96 4.2 % 81.8 6.3%
Domestic Carbon Steel Market Size Continue to Expand
Indian Steel Demand Outlook: India’s Finished Steel demand will Grow by 5.5% & 6% in 2018 & 2019 respectively
Indian Domestic Carbon Steel Demand
Source: WSA/JPC 10

INDUSTRY UPDATE
STEEL SECTOR
11
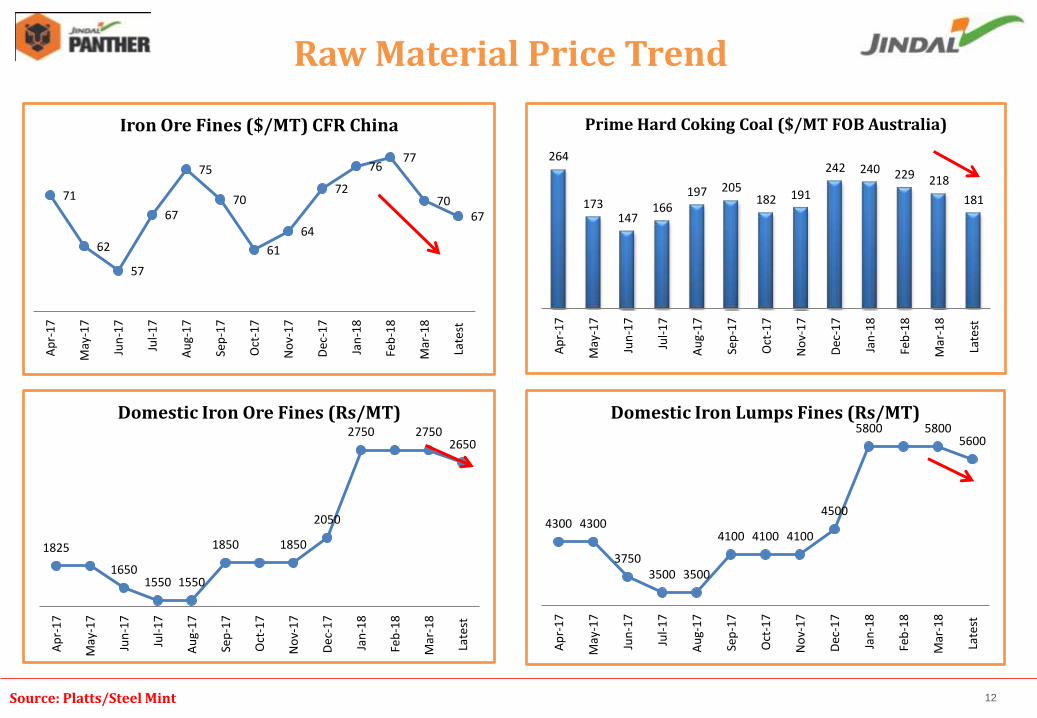
Source: Platts/Steel Mint 12
Raw Material Price Trend
71
62
57
67
75
70
61
64
72
76 77
70 67
Ap
r-1
7
May
-17
Jun
-17
Jul-
17
Au
g-1
7
Sep
-17
Oct
-17
No
v-1
7
Dec
-17
Jan
-18
Feb
-18
Mar
-18
Late
st
Iron Ore Fines ($/MT) CFR China
1825
1650 1550 1550
1850 1850
2050
2750 2750 2650
Ap
r-1
7
May
-17
Jun
-17
Jul-
17
Au
g-1
7
Sep
-17
Oct
-17
No
v-1
7
Dec
-17
Jan
-18
Feb
-18
Mar
-18
Late
st
Domestic Iron Ore Fines (Rs/MT)
4300 4300
3750 3500 3500
4100 4100 4100
4500
5800 5800 5600
Ap
r-1
7
May
-17
Jun
-17
Jul-
17
Au
g-1
7
Sep
-17
Oct
-17
No
v-1
7
Dec
-17
Jan
-18
Feb
-18
Mar
-18
Late
st
Domestic Iron Lumps Fines (Rs/MT)
264
173 147
166 197 205
182 191
242 240 229 218
181
Ap
r-1
7
May
-17
Jun
-17
Jul-
17
Au
g-1
7
Sep
-17
Oct
-17
No
v-1
7
Dec
-17
Jan
-18
Feb
-18
Mar
-18
Late
st
Prime Hard Coking Coal ($/MT FOB Australia)

INDUSTRY UPDATE
POWER SECTOR
13

Source: IEX
2.03
2.05 2.12 2.37
2.56
2.25 2.11
2.73
3.74
3.74
3.21
2.66
1.90 1.77
2.06
2.35
1.72
1.89
1.76 1.74
2.01
2.06
1.91 1.8
2.25
1.97
1.86
2.13 1.91
1.84
1.86 2.05
3.06
2.55
2.20 2.11
2.85 2.88
3.68 3.63
1.3
1.8
2.3
2.8
3.3
3.8
Jan Feb Mar Apr May Jun Jul Aug Sep Oct Nov Dec
RTC Power Exchange Prices – W3 Area – Ex-Bus (Rs./kWh)
2017 2016 2015 2018
* For equal comparison, Transmission charges/losses of Rs 0.34/Unit taken for all years.
14
Power Exchange Prices

197
45 34 25 22 21
192
45 32 25
12 21
Coal Hydro Wind Gas Solar Others
Installed Capacity GW (Mar 2018) Installed Capacity GW (Mar 2017)
Source: CEA 15
Installed Capacity in India as on Mar’18
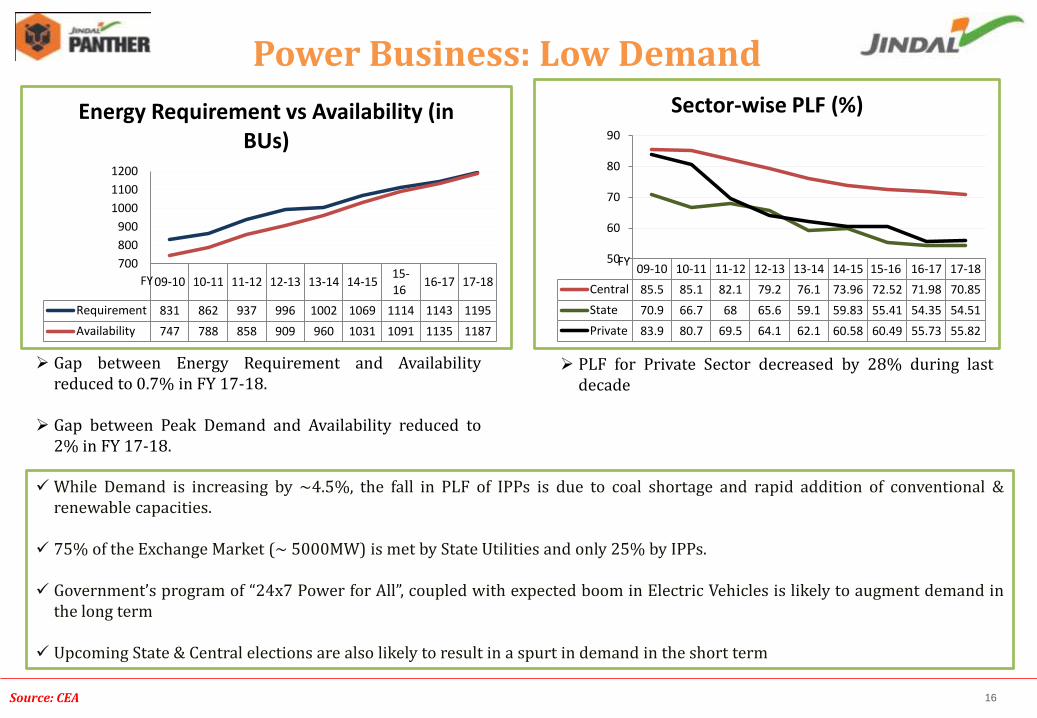
PLF for Private Sector decreased by 28% during last decade
Gap between Energy Requirement and Availability reduced to 0.7% in FY 17-18.
Gap between Peak Demand and Availability reduced to 2% in FY 17-18.
While Demand is increasing by ~4.5%, the fall in PLF of IPPs is due to coal shortage and rapid addition of conventional &
renewable capacities.
75% of the Exchange Market (~ 5000MW) is met by State Utilities and only 25% by IPPs.
Government’s program of “24x7 Power for All”, coupled with expected boom in Electric Vehicles is likely to augment demand in the long term
Upcoming State & Central elections are also likely to result in a spurt in demand in the short term
09-10 10-11 11-12 12-13 13-14 14-15 15-16
16-17 17-18
Requirement 831 862 937 996 1002 1069 1114 1143 1195
Availability 747 788 858 909 960 1031 1091 1135 1187
700
800
900
1000
1100
1200
Energy Requirement vs Availability (in BUs)
FY 09-10 10-11 11-12 12-13 13-14 14-15 15-16 16-17 17-18
Central 85.5 85.1 82.1 79.2 76.1 73.96 72.52 71.98 70.85
State 70.9 66.7 68 65.6 59.1 59.83 55.41 54.35 54.51
Private 83.9 80.7 69.5 64.1 62.1 60.58 60.49 55.73 55.82
50
60
70
80
90
Sector-wise PLF (%)
FY
Power Business: Low Demand
Source: CEA 16

Q4’FY18
INDUSTRY DEVELOPMENTS
BRIEF BACKGROUND OPERATIONAL PERFORMANCE
17

Ranked “25”
World Class Steel Makers in World
by
World Steel Dynamics - USA (June 2017)
Ahead of
∷ ∷ Hadeed (ranked 26) ∷ ∷ RINL (ranked : 27) ∷ ∷
Expanding Capacity
(score: 10/10)
Location in high growth market (score: 10/10)
Harnessing Tech
Revolution (score: 9/10)
Environment & Safety
(score: 9/10)
Labour Cost (score: 9/10)
Location Close to Customer (score: 810)
Pricing Power in home Market
(score: 7/10)
Size (score: 3/10)
Coking Coal Mines
(score: 3/10)
Iron Ore Mines
(score: 5/10)
Value Add product mix (score: 6/10)
Profitability (score: 5/10)
Balance Sheet (score: 3/10)
Downstream business &
Energy Cost
(score: 6/10)
Positives
Area for improvement
JSPL: Among Top World Class Steel Maker
18

Steel Power Global Ventures
Current Capacities – Domestic & Global
Business Segments
*Domestic **1000 MW Divestment announced
8.6 MTPA Steel* 3.11 MTPA* Iron ore 9 MTPA* Pellet Plant
IPP – 3400MW** CPP – 1634 MW
2 MTPA Steel Coal Mines
19

Capacity in deail
Iron Making
(9.95 MTPA)
BF 5.33 MTPA
DRI 3.12 MTPA
HBI 1.50 MTPA
Liquid Steel
(10.60 MTPA)
SMS 10.60 MTPA
Finished Steel
(6.55 MTPA)
WRM 0.60 MTPA
RUBM 0.75 MTPA
MLSM 0.60 MTPA
Plate Mill 2.20 MTPA
BRM 2.4 MTPA
Steel Capacities across Life Cycle
20

Capacity in deail
Raigarh (Chhattisgarh)
SMS 3.6MTPA
BF 2.125 MTPA
DRI 1.32 MTPA
Plate Mill 1.00 MTPA
RUBM 0.75 MTPA
MLSM 0.60 MTPA
CPP 824 MW
Angul
(Odisha)
SMS 2.5 MTPA
SMS 2.5 MTPA
DRI 1.8 MTPA
BF 3.2 MTPA
CGP 225,000 Nm3/Hr
Plate Mill 1.2 MTPA
BRM 1.4 MTPA
CPP 810 MW
Barbil
(Odisha)
Pellet Plant
9 MTPA
Patratu (Jharkhand)
WRM 0.60
MTPA
BRM 1.0 MTPA
Oman
SMS 2.0 MTPA
HBI 1.5 MTPA
BRM 1.4 MTPA
JPL
Tamnar 3400 MW
Mining
Iron Ore 3.11
MTPA
Coal Overseas
6.60 MTPA
Detailed plant wise capacities
Power Hot Metal Liquid Steel Finished Steel
*Plant capacities shown above are completed but not all are commissioned
21

FY ‘14 FY ‘18
Steel - India 3 MTPA 8.6 MTPA
Power 1,000 MW 3400 MW
Oman
~2.86x
3.4x
0 MTPA 2 MTPA Add
Pellet 4.5 MTPA 9 MTPA ~2x
All major capex completed – scale of organisation is approx. Three Times
Manifold Growth in the Last 5 Years
22

FY18 Capacity (1) Production in FY18 Upside
Potential
Steel – India Capacity
8.6 MTPA 4.02 MTPA 114%
Independent Power Capacity
3,400 MW 1237 MW 174%
Steel – Oman Capacity
2.0 MTPA 1.67 MTPA 20%
Pellet Capacity
9.0 MTPA 6.86 MTPA 31%
Upside potential remains to be exploited
…… potential for BIG LEAP
23

Particulars Q4FY18 Q3FY18 Q4FY17 %QoQ %YoY
Total Revenue 5,752 4,272 4,545 +35% +27%
EBITDA 1,519 921 914 +65% +66%
EBITDA % 26% 22% 20%
Depreciation 468 465 489 +1% -4%
Finance Cost 686 594 515 +16% +33%
PBT before Exceptional 364 (138) (81)
Exceptional Items 194 - -
Profit/(Loss) Before Tax 170 (138) (81)
Profit/(Loss) After Tax 145 (74) (116)
(Figures in Rs. Crores)
Particulars FY18 FY17 %YoY Total Revenue 17,523 15,494 +13%
EBITDA 3,973 2,902 +37%
EBITDA % 23% 19%
Depreciation 1,910 2,044 -7%
Finance Cost 2,391 2,324 +3%
PBT before Exceptional (328) (1,457)
Exceptional Items 344 -
Profit/(Loss) Before Tax (672) (1,457)
Profit/(Loss) After Tax (362) (986)
(Figures in Rs. Crores)
24
JSPL Standalone Key Financials
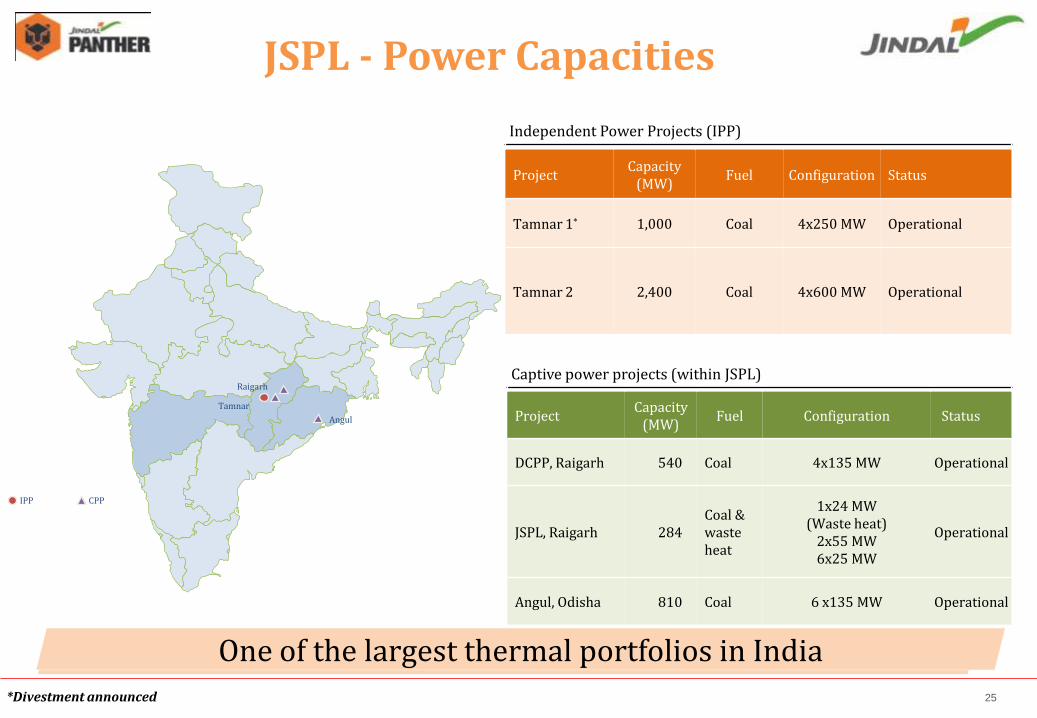
Angul
Tamnar
Raigarh Captive power projects (within JSPL)
Project Capacity
(MW) Fuel Configuration Status
DCPP, Raigarh 540 Coal 4x135 MW Operational
JSPL, Raigarh 284 Coal & waste heat
1x24 MW (Waste heat)
2x55 MW 6x25 MW
Operational
Angul, Odisha 810 Coal 6 x135 MW Operational
Independent Power Projects (IPP)
Project Capacity
(MW) Fuel Configuration Status
Tamnar 1* 1,000 Coal 4x250 MW Operational
Tamnar 2 2,400 Coal 4x600 MW Operational
IPP CPP
One of the largest thermal portfolios in India
JSPL - Power Capacities
*Divestment announced 25
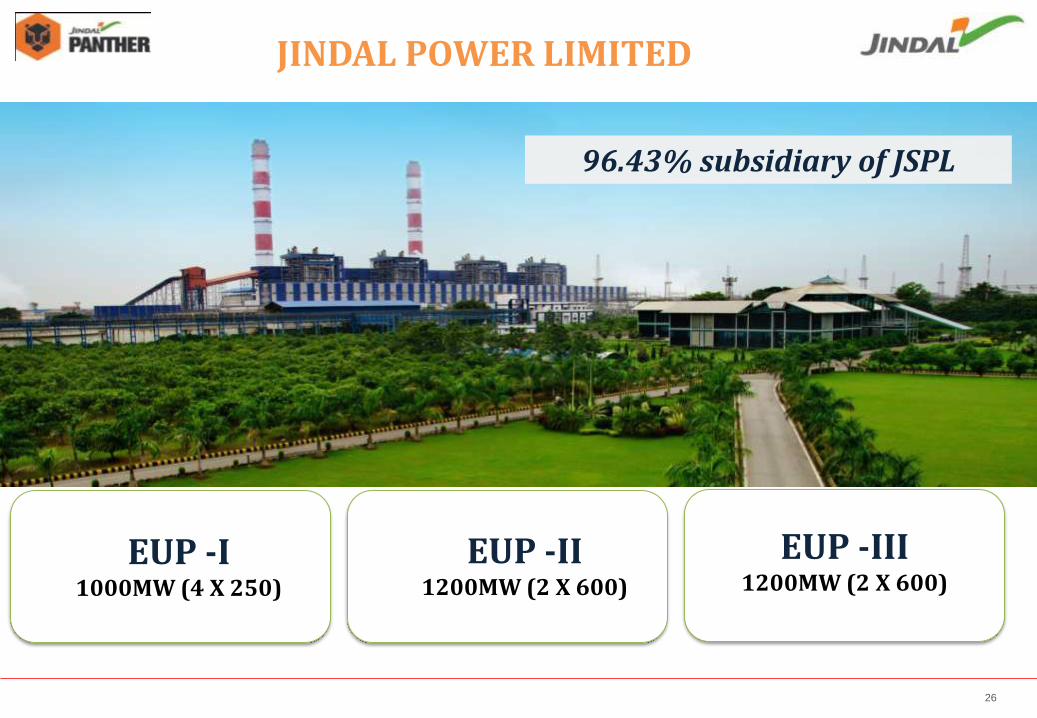
96.43% subsidiary of JSPL
JINDAL POWER LIMITED
EUP -I 1000MW (4 X 250)
EUP -II 1200MW (2 X 600)
EUP -III 1200MW (2 X 600)
26

Project Buyer Type
Period Quantum (MW) From To
Tamnar II
(Phase 1) Tamil Nadu
Long Term Feb-14 Sep-28 400
Tamnar I Medium Term Sep-17 Aug-19 200
Tamnar II
(Phase 1) KSEB
Long Term Jun-16 May-41 200
Tamnar II
(Phase 1) Long Term Oct-17 Sep-42 150
Tamnar II
(Phase 1) Chhattisgarh
Long Term After commercial operation of Unit and for complete life
of plant
60
Tamnar II
(Phase 2) Long Term 60
PPA Arrangements
Over 30% of total capacity tied up *
* Out of 3400 MW (IPP) 27
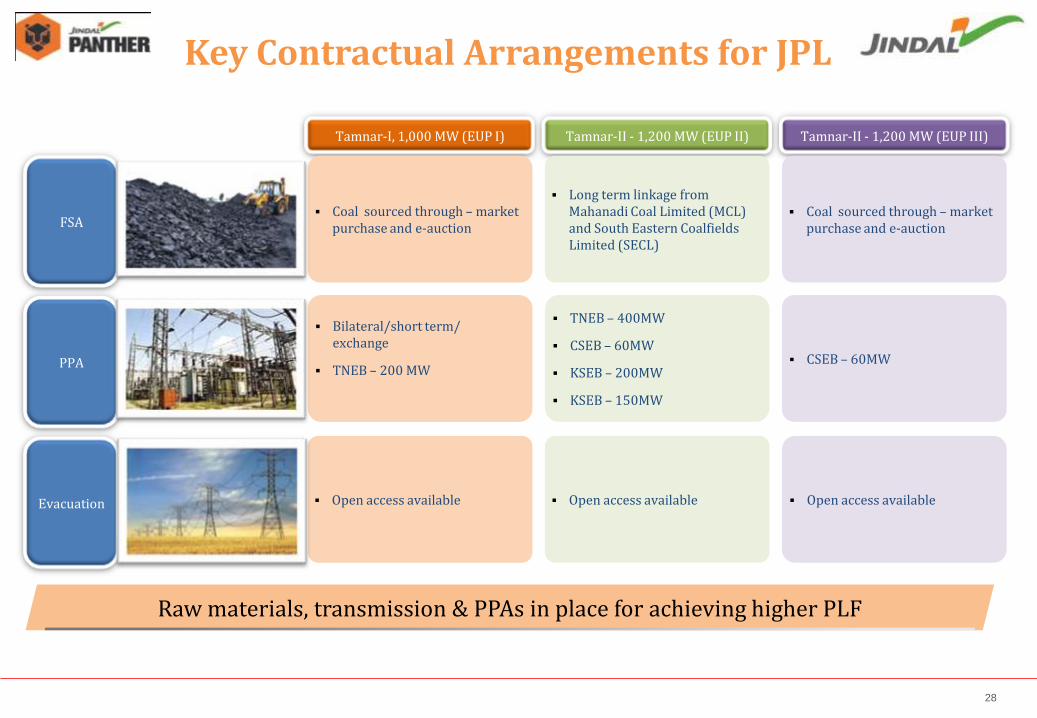
Tamnar-I, 1,000 MW (EUP I)
Coal sourced through – market purchase and e-auction
Bilateral/short term/ exchange
TNEB – 200 MW
Open access available
Tamnar-II - 1,200 MW (EUP II)
Long term linkage from Mahanadi Coal Limited (MCL) and South Eastern Coalfields Limited (SECL)
TNEB – 400MW
CSEB – 60MW
KSEB – 200MW
KSEB – 150MW
Open access available
Tamnar-II - 1,200 MW (EUP III)
Coal sourced through – market purchase and e-auction
CSEB – 60MW
Open access available
FSA
PPA
Evacuation
Raw materials, transmission & PPAs in place for achieving higher PLF
Key Contractual Arrangements for JPL
28

(Figures in Rs. Crores)
Particulars Q4FY18 Q3FY18 Q4FY17 %QoQ %YoY
Net Sales 952 1,172 863 -19% +10%
EBITDA 265 356 381 -26% -31%
EBITDA % 28% 30% 44%
Depreciation + Amortization 377 381 376 -1%
Interest 237 244 235 -3% +1%
Profit/(Loss) Before Tax (282) (198) (135)
Profit/(Loss) After Tax (272) (173) (84)
Cash Profit 98 186 241 -48% -60%
Generation (MU) 2,310 2,982 2,336 -23% -1%
29
Particulars FY18 FY17 %YoY
Net Sales 4,081 3,119 +31%
EBITDA 1,434 1,048 +37%
EBITDA % 35% 34%
Depreciation + Amortization 1,508 1,436 +5%
Interest 936 789 +19%
Profit/(Loss) Before Tax (733) (780)
Profit/(Loss) After Tax (673) (668)
Cash Profit 778 656 +19%
Generation (MU) 10,905 9,176 +19%
JPL Key Financials
(Figures in Rs. Crores)
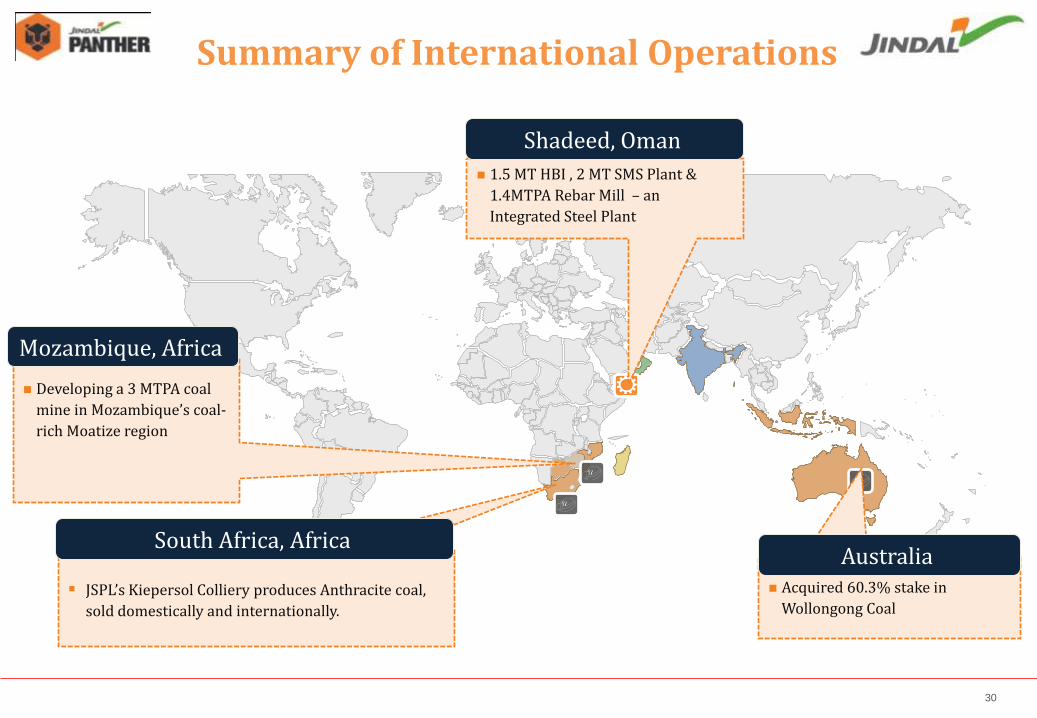
Developing a 3 MTPA coal
mine in Mozambique’s coal-
rich Moatize region
Mozambique, Africa
JSPL’s Kiepersol Colliery produces Anthracite coal,
sold domestically and internationally.
South Africa, Africa
Acquired 60.3% stake in
Wollongong Coal
Australia
1.5 MT HBI , 2 MT SMS Plant &
1.4MTPA Rebar Mill – an
Integrated Steel Plant
Shadeed, Oman
Summary of International Operations
30
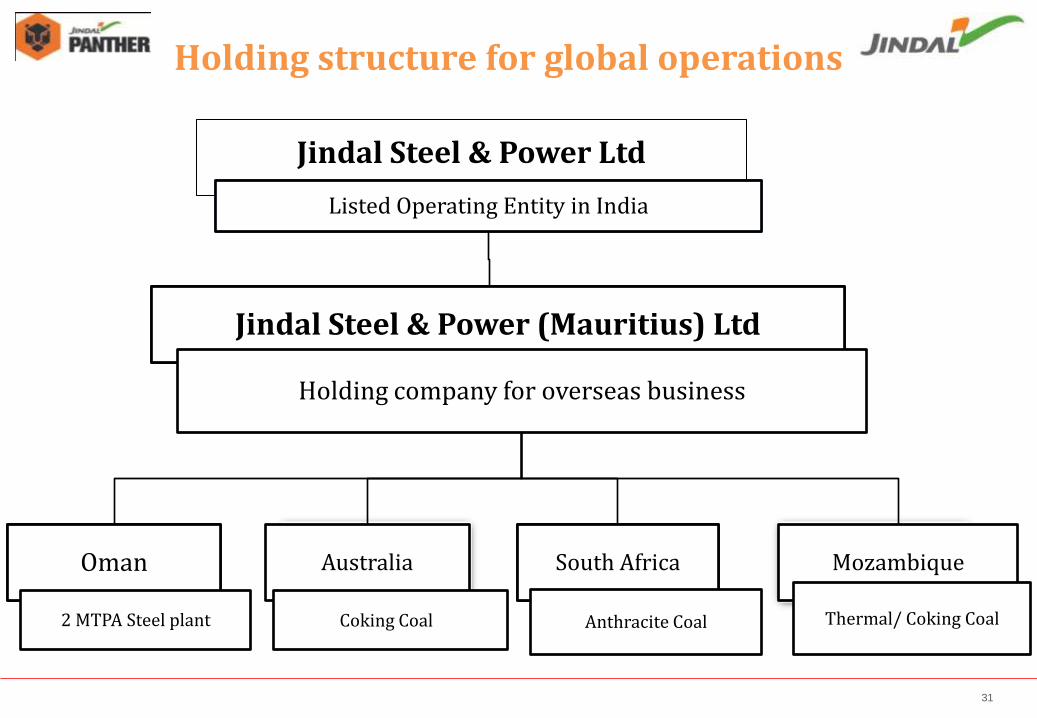
Oman
Holding structure for global operations
Jindal Steel & Power Ltd
Listed Operating Entity in India
Australia
Coking Coal
South Africa
Anthracite Coal
Mozambique
Thermal/ Coking Coal
Jindal Steel & Power (Mauritius) Ltd
Holding company for overseas business
2 MTPA Steel plant
31

32 - -
Particulars Q4FY18 Q3FY18 Q4FY17 %QoQ %YoY
Total Revenue 8,599 6,993 6,756 +23% +27%
EBITDA 2,136 1,607 1,552 +33% +38%
EBITDA % 25% 23% 23%
Depreciation 960 963 1006 -5%
Finance Cost 1,071 967 864 +11% +24%
PBT before Exceptional 106 (323) (309)
Exceptional Items 438 -- (253)
Profit/(Loss) Before Tax (332) (323) (56)
Profit/(Loss) After Tax (426) (277) (98)
(Figures in Rs. Crores)
Particulars FY18 FY17 %YoY
Total Revenue 27,841 22,696 +23%
EBITDA 6,469 4,709 +37%
EBITDA % 23% 21%
Depreciation 3,883 3,949 -2%
Finance Cost 3,866 3,441 +12%
PBT before Exceptional (1,277) (2,671)
Exceptional Items 587 372
Profit/(Loss) Before Tax (1,864) (3,043)
Profit/(Loss) After Tax (1,624) (2,540)
(Figures in Rs. Crores)
JSPL Consolidated Key Financials

Q4 FY’18
INDUSTRY DEVELOPMENTS
BRIEF BACKGROUND OPERATIONAL PERFORMANCE
33
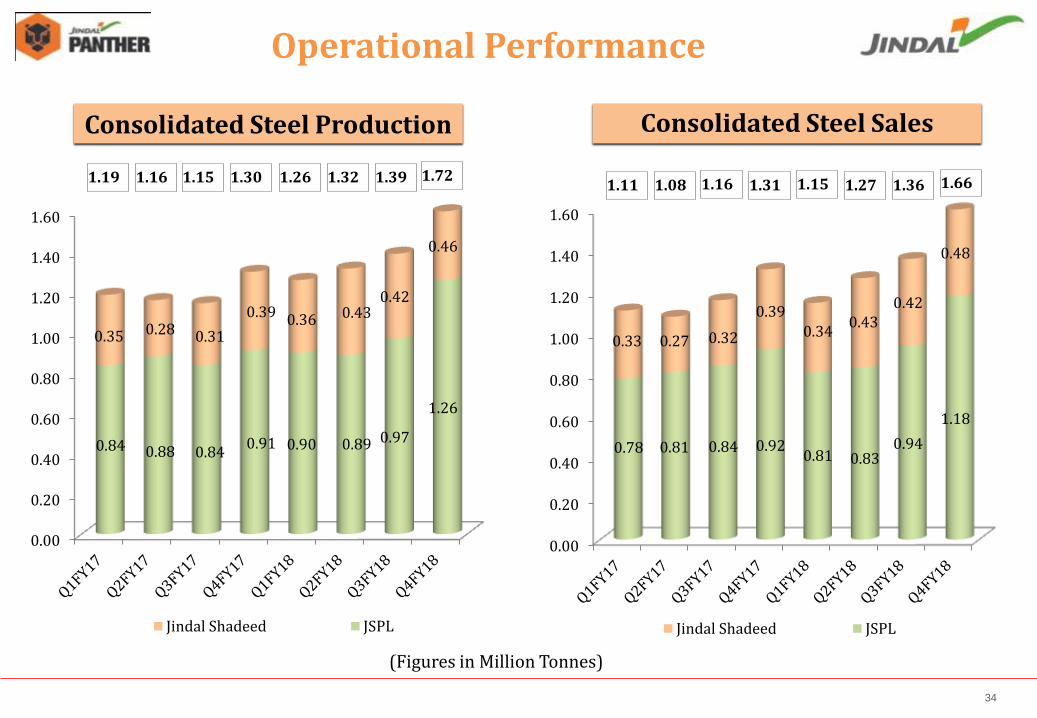
0.00
0.20
0.40
0.60
0.80
1.00
1.20
1.40
1.60
0.84 0.88 0.84 0.91 0.90 0.89 0.97
1.26
0.35 0.28 0.31
0.39 0.36 0.43 0.42
0.46
Jindal Shadeed JSPL
1.26 1.72 1.15 1.30
Consolidated Steel Production
(Figures in Million Tonnes)
1.32
Consolidated Steel Sales
0.00
0.20
0.40
0.60
0.80
1.00
1.20
1.40
1.60
0.78 0.81 0.84 0.92 0.81 0.83
0.94
1.18
0.33 0.27 0.32
0.39 0.34
0.43 0.42
0.48
Jindal Shadeed JSPL
1.15 1.66 1.16 1.31 1.27
34
1.39 1.36
Operational Performance
1.19 1.16 1.08 1.11

Highest Ever Crude Steel Production in 4QFY18 at 1.72MT
JSPL’s Standalone EBITDA increased by 66% Y-o-Y for Q4FY18
JSPL Standalone reported positive PAT at Rs 145 Cr in Q4FY18 after13 successive quarters
JSPL’s Consolidated EBITDA increased by 38% Y-o-Y for Q4FY18
Oman ‘s EBITDA increased by 107% during FY18
Commencement of mining operations in Australia
Increase in JPL Generation by 19% and in EBITDA by 37% Y-o-Y in FY18
35
Key Performance Highlights

• Conferred with 23 Nos, prizes during 55th Annual Mines Safety week celebration -2017, under the aegies of Directorate General of Mines Safety
Tensa
• JSPL Patratu awarded Golden Bird Excellence Safety Award 2017 (Platinum Category) towards achievement of workers’ safety at the workplace
Patratu
Oman • Sultan QABOOS award for industrial excellence &
Innovation – 2017-18 • Frost & Sullivan Award - 2017
Awards & Accolades
36

Key Customers & Adding…
37

ANGUL
38

RAIGARH
39

OMAN
40

For any information please contact: - Mr. Nishant Baranwal – Head, Investor Relations Tel : +91 11-41462198 Mobile:+91 8800690255 Email: - [email protected] Ms. Shweta Bagaria – Assistant Manager, Investor Relations Tel: +91-124-6612073 Mobile: +91 95995 53717 Email: [email protected]
41

THANK YOU
42