Q4 2018 results and business update4Q18... · 2019 Q4 2018 results and business update Amsterdam...
16
© Global Telecom Holding 2019 Q4 2018 results and business update Amsterdam – 25 February 2019 Vincenzo Nesci Gerbrand Nijman Chief Executive Officer Chief Financial Officer
Transcript of Q4 2018 results and business update4Q18... · 2019 Q4 2018 results and business update Amsterdam...
©G
lob
al T
elec
om
Ho
ldin
g 2
01
9 Q4 2018 results and business update
Amsterdam – 25 February 2019
Vincenzo Nesci Gerbrand Nijman
Chief Executive Officer Chief Financial Officer
2
©G
lob
al T
elec
om
Ho
ldin
g 2
01
9
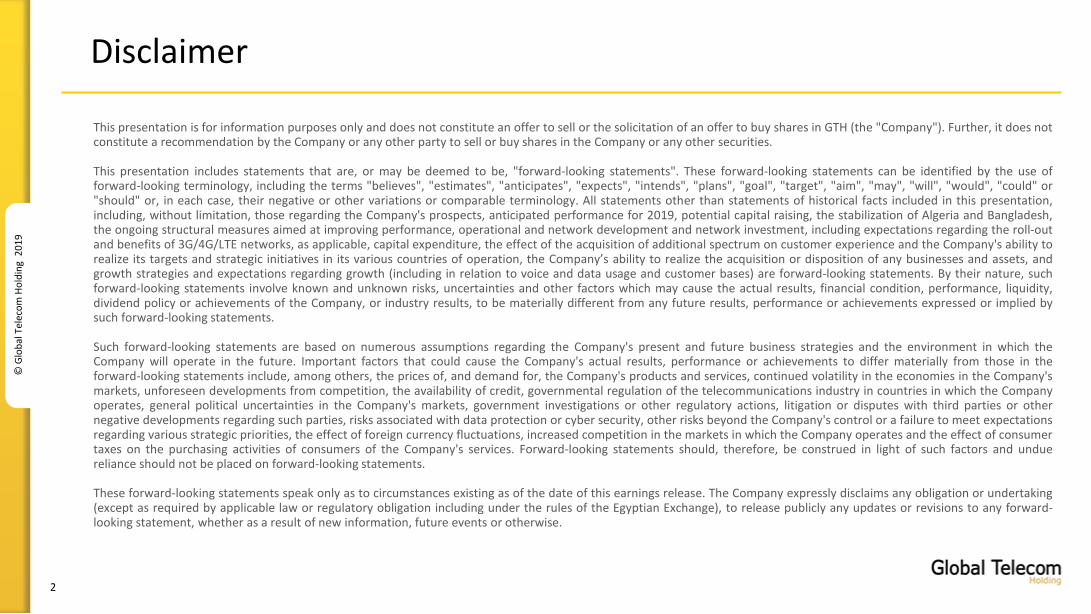
Disclaimer
This presentation is for information purposes only and does not constitute an offer to sell or the solicitation of an offer to buy shares in GTH (the "Company"). Further, it does notconstitute a recommendation by the Company or any other party to sell or buy shares in the Company or any other securities.
This presentation includes statements that are, or may be deemed to be, "forward-looking statements". These forward-looking statements can be identified by the use offorward-looking terminology, including the terms "believes", "estimates", "anticipates", "expects", "intends", "plans", "goal", "target", "aim", "may", "will", "would", "could" or"should" or, in each case, their negative or other variations or comparable terminology. All statements other than statements of historical facts included in this presentation,including, without limitation, those regarding the Company's prospects, anticipated performance for 2019, potential capital raising, the stabilization of Algeria and Bangladesh,the ongoing structural measures aimed at improving performance, operational and network development and network investment, including expectations regarding the roll-outand benefits of 3G/4G/LTE networks, as applicable, capital expenditure, the effect of the acquisition of additional spectrum on customer experience and the Company's ability torealize its targets and strategic initiatives in its various countries of operation, the Company’s ability to realize the acquisition or disposition of any businesses and assets, andgrowth strategies and expectations regarding growth (including in relation to voice and data usage and customer bases) are forward-looking statements. By their nature, suchforward-looking statements involve known and unknown risks, uncertainties and other factors which may cause the actual results, financial condition, performance, liquidity,dividend policy or achievements of the Company, or industry results, to be materially different from any future results, performance or achievements expressed or implied bysuch forward-looking statements.
Such forward-looking statements are based on numerous assumptions regarding the Company's present and future business strategies and the environment in which theCompany will operate in the future. Important factors that could cause the Company's actual results, performance or achievements to differ materially from those in theforward-looking statements include, among others, the prices of, and demand for, the Company's products and services, continued volatility in the economies in the Company'smarkets, unforeseen developments from competition, the availability of credit, governmental regulation of the telecommunications industry in countries in which the Companyoperates, general political uncertainties in the Company's markets, government investigations or other regulatory actions, litigation or disputes with third parties or othernegative developments regarding such parties, risks associated with data protection or cyber security, other risks beyond the Company's control or a failure to meet expectationsregarding various strategic priorities, the effect of foreign currency fluctuations, increased competition in the markets in which the Company operates and the effect of consumertaxes on the purchasing activities of consumers of the Company's services. Forward-looking statements should, therefore, be construed in light of such factors and unduereliance should not be placed on forward-looking statements.
These forward-looking statements speak only as to circumstances existing as of the date of this earnings release. The Company expressly disclaims any obligation or undertaking(except as required by applicable law or regulatory obligation including under the rules of the Egyptian Exchange), to release publicly any updates or revisions to any forward-looking statement, whether as a result of new information, future events or otherwise.
©G
lob
al T
elec
om
Ho
ldin
g 2
01
9 Q4 2018 financial highlights

4
©G
lob
al T
elec
om
Ho
ldin
g 2
01
9
Q4 2018 financial highlights
Total revenue(USD MILLION)
702
305 43.5%
+ 11.6% organic1 YoY- 3.1% reported YoY
104.4
Mobile customers(MILLION)
EBITDA(USD MILLION)
EBITDA margin (%)
+ 4.4% YoY
1 Revenue and EBITDA organic figures are non-IFRS financial measures that exclude the effect of foreign currency movements and other factors, such as businesses under liquidation, disposals, mergers and acquisitions
+ 16.0% organic1 YoY- 0.2% reported YoY
+ 1.2 p.p. YoY
• Total revenue increased organically by 11.6% YoY:
► Strong organic growth in Pakistan
► First time growth in 2 years in Bangladesh
► Decline in Algeria
• Continued strong organic growth in mobile data revenue of 70.2% YoY
• EBITDA increased organically by 16.0% YoY:
► Strong performance in Pakistan with 26.0% YoY and positive contribution from Algeria with 4.9% YoY
► Offsetting lower EBITDA in Bangladesh
▪ Increased EBITDA margin of 43.5%
• Customer base grew 4.4% YoY, driven by customer acquisition in all markets
5
©G
lob
al T
elec
om
Ho
ldin
g 2
01
9
Latest Corporate Developments
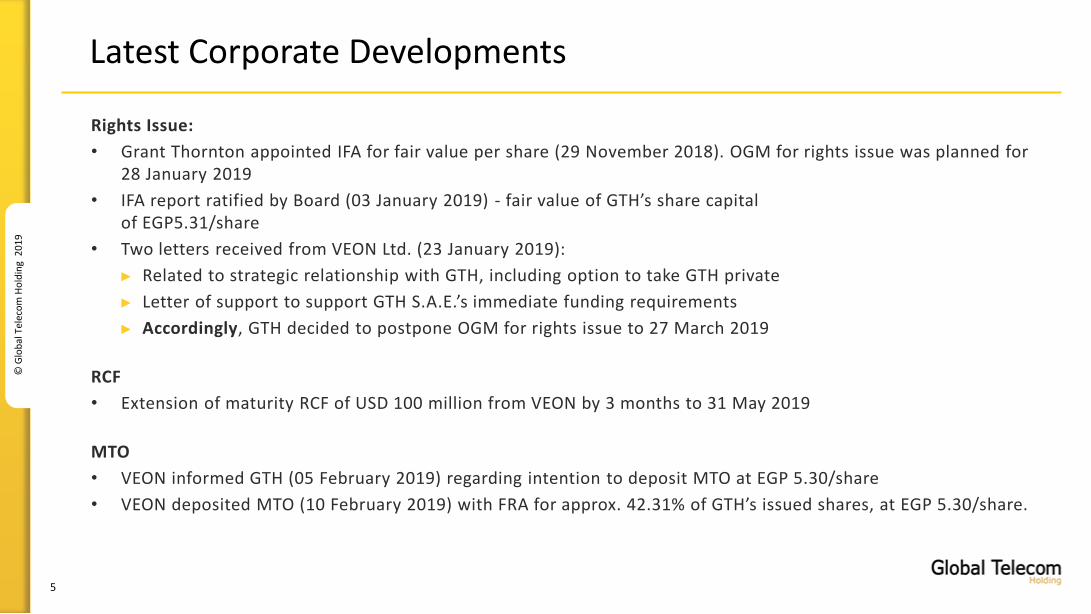
Rights Issue:
• Grant Thornton appointed IFA for fair value per share (29 November 2018). OGM for rights issue was planned for 28 January 2019
• IFA report ratified by Board (03 January 2019) - fair value of GTH’s share capital of EGP5.31/share
• Two letters received from VEON Ltd. (23 January 2019):
► Related to strategic relationship with GTH, including option to take GTH private
► Letter of support to support GTH S.A.E.’s immediate funding requirements
► Accordingly, GTH decided to postpone OGM for rights issue to 27 March 2019
RCF
• Extension of maturity RCF of USD 100 million from VEON by 3 months to 31 May 2019
MTO
• VEON informed GTH (05 February 2019) regarding intention to deposit MTO at EGP 5.30/share
• VEON deposited MTO (10 February 2019) with FRA for approx. 42.31% of GTH’s issued shares, at EGP 5.30/share.
6
©G
lob
al T
elec
om
Ho
ldin
g 2
01
9
Q4 2018 income statement
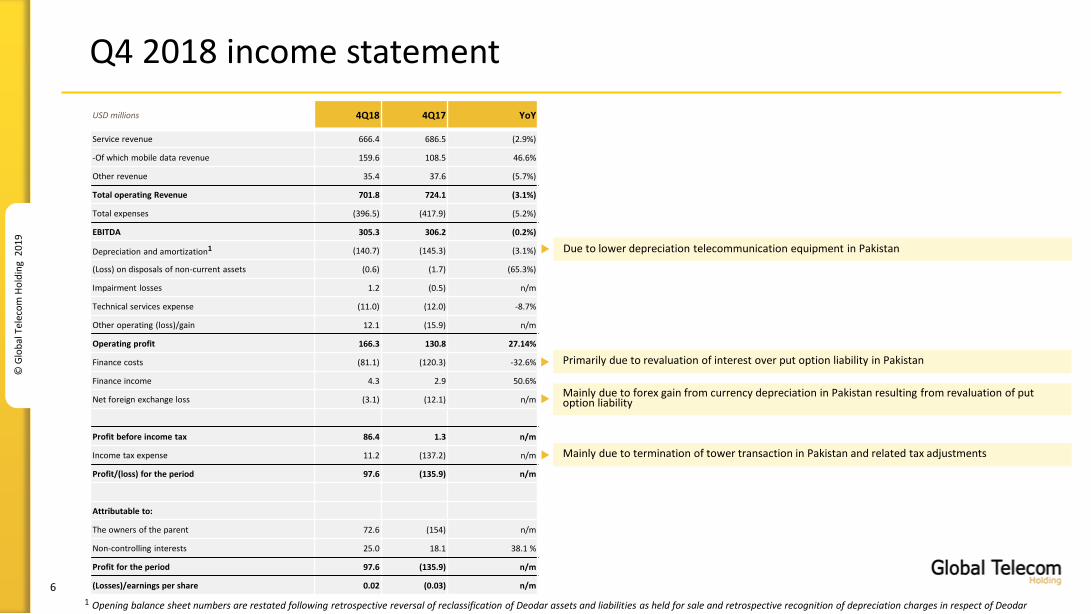
Primarily due to revaluation of interest over put option liability in Pakistan
Mainly due to forex gain from currency depreciation in Pakistan resulting from revaluation of put option liability
Mainly due to termination of tower transaction in Pakistan and related tax adjustments
Due to lower depreciation telecommunication equipment in Pakistan
USD millions 4Q18 4Q17 YoY
Service revenue 666.4 686.5 (2.9%)
-Of which mobile data revenue 159.6 108.5 46.6%
Other revenue 35.4 37.6 (5.7%)
Total operating Revenue 701.8 724.1 (3.1%)
Total expenses (396.5) (417.9) (5.2%)
EBITDA 305.3 306.2 (0.2%)
Depreciation and amortization1 (140.7) (145.3) (3.1%)
(Loss) on disposals of non-current assets (0.6) (1.7) (65.3%)
Impairment losses 1.2 (0.5) n/m
Technical services expense (11.0) (12.0) -8.7%
Other operating (loss)/gain 12.1 (15.9) n/m
Operating profit 166.3 130.8 27.14%
Finance costs (81.1) (120.3) -32.6%
Finance income 4.3 2.9 50.6%
Net foreign exchange loss (3.1) (12.1) n/m
Profit before income tax 86.4 1.3 n/m
Income tax expense 11.2 (137.2) n/m
Profit/(loss) for the period 97.6 (135.9) n/m
Attributable to:
The owners of the parent 72.6 (154) n/m
Non-controlling interests 25.0 18.1 38.1 %
Profit for the period 97.6 (135.9) n/m
(Losses)/earnings per share 0.02 (0.03) n/m
1 Opening balance sheet numbers are restated following retrospective reversal of reclassification of Deodar assets and liabilities as held for sale and retrospective recognition of depreciation charges in respect of Deodar
7
©G
lob
al T
elec
om
Ho
ldin
g 2
01
9
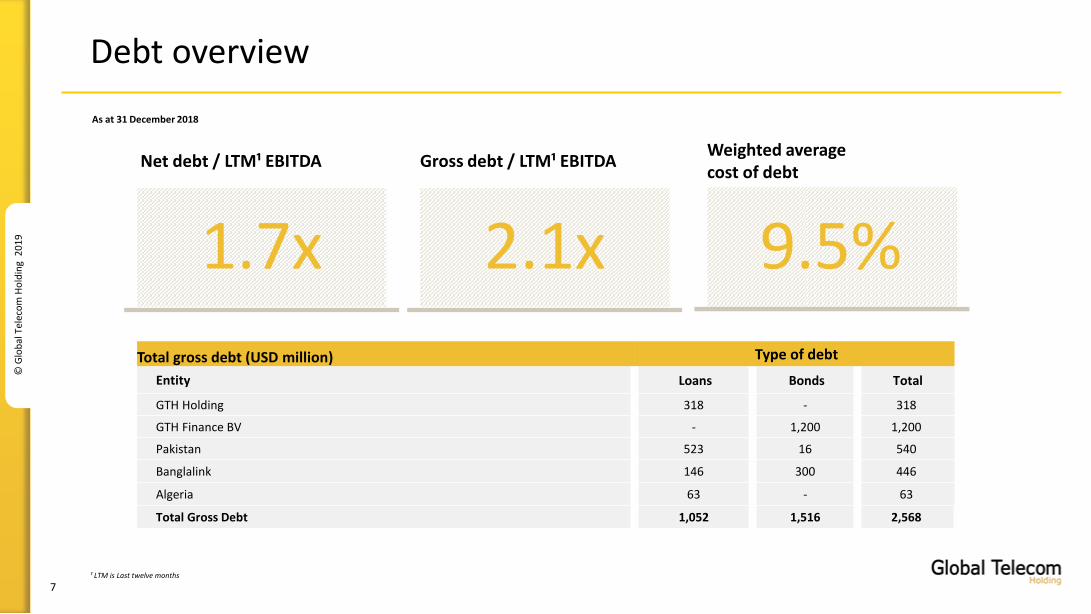
Debt overview
As at 31 December 2018
Net debt / LTM¹ EBITDA
1.7x 2.1x
Gross debt / LTM¹ EBITDA
9.5%
Weighted averagecost of debt
Total gross debt (USD million) Type of debt
Entity Loans Bonds Total
GTH Holding 318 - 318
GTH Finance BV - 1,200 1,200
Pakistan 523 16 540
Banglalink 146 300 446
Algeria 63 - 63
Total Gross Debt 1,052 1,516 2,568
¹ LTM is Last twelve months
©G
lob
al T
elec
om
Ho
ldin
g 2
01
9 Q4 2018 OpCo performance
9
©G
lob
al T
elec
om
Ho
ldin
g 2
01
9
EBITDA and EBITDA Margin(PKR BILLION AND %)
CAPEX excl. Licenses and LTM CAPEX/revenue(PKR BILLION AND %)
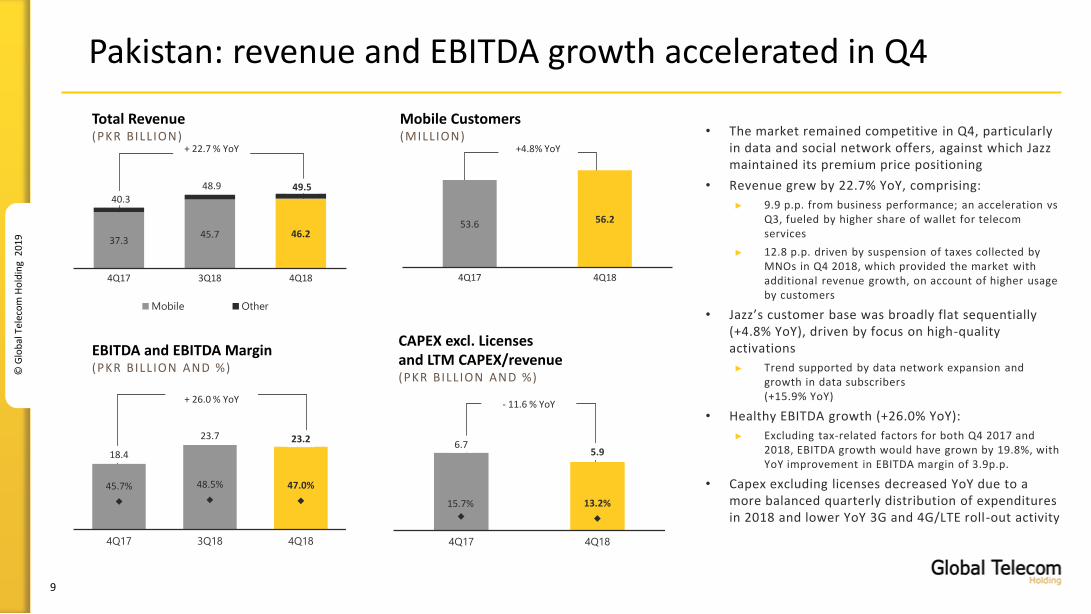
Pakistan: revenue and EBITDA growth accelerated in Q4
Mobile Customers (MILLION)
+ 22.7 % YoY
37.345.7 46.2
4Q17 3Q18 4Q18
Mobile Other
40.3
48.9 49.5
53.6 56.2
4Q17 4Q18
+4.8% YoY
18.4
23.7 23.2
45.7% 48.5% 47.0%
0
10
20
4Q17 3Q18 4Q18
+ 26.0 % YoY
6.75.9
15.7% 13.2%
0
4Q17 4Q18
- 11.6 % YoY
• The market remained competitive in Q4, particularly in data and social network offers, against which Jazz maintained its premium price positioning
• Revenue grew by 22.7% YoY, comprising:
► 9.9 p.p. from business performance; an acceleration vs Q3, fueled by higher share of wallet for telecom services
► 12.8 p.p. driven by suspension of taxes collected by MNOs in Q4 2018, which provided the market with additional revenue growth, on account of higher usage by customers
• Jazz’s customer base was broadly flat sequentially (+4.8% YoY), driven by focus on high-quality activations
► Trend supported by data network expansion and growth in data subscribers (+15.9% YoY)
• Healthy EBITDA growth (+26.0% YoY):
► Excluding tax-related factors for both Q4 2017 and 2018, EBITDA growth would have grown by 19.8%, with YoY improvement in EBITDA margin of 3.9p.p.
• Capex excluding licenses decreased YoY due to a more balanced quarterly distribution of expenditures in 2018 and lower YoY 3G and 4G/LTE roll-out activity
Total Revenue(PKR BILLION)

10
©G
lob
al T
elec
om
Ho
ldin
g 2
01
9 24.1 24.323.2
0.40.1
0.9
4Q17 3Q18 4Q18
Mobile Other
24.524.4
24.1
10.5 11.0 11.0
42.9% 44.9% 45.7%
0.0
10. 0
4Q17 3Q18 4Q18
EBITDA and EBITDA Margin(DZD BILLION AND %)
CAPEX excl. Licenses and LTM CAPEX/revenue(DZD BILLION AND %)
Algeria: sequential customer growth continues
Mobile Customers (MILLION)
- 1.7 % YoY + 5.7 % YoY
+4.9 % YoY
• Q4 2018 saw continued intense price competition, especially in channel-related incentives as competitors continued to respond to Djezzy’s customer base expansion
• Macroeconomic and regulatory challenges persisted:► Economic slowdown and high inflation, along with import
restrictions
► New direct taxation since 1 January 2018 and further increases from mid-July
► However, MTR symmetry was achieved in November 2018
• YoY rate of revenue decline slowed vs Q3 2018, also driven by favorable adjustments of DZD 0.7 bn in Q4 2018, mostly related to the reversal of a liability towards a vendor► Revenue trend from business performance, excluding these
adjustments, would have been -4.5% YoY, driven by ARPU decline (-7.4% YoY)
► Customer base growth accelerated both YoY (+5.7%) and QoQ(+1.3%) in response to the success of commercial offers
► Data revenue grew strongly (+67.1% YoY), leveraging our 4G/LTE network
• EBITDA increased YoY by 4.9%, mainly driven by favorable impact of one-off revenue and release of certain provisions in Q4 2018 (DZD 1.3 billion)► EBITDA trend from business performance was -7.7% YoY,
triggered by the full impact of new taxation in Q4, additional channel incentives and higher technology costs
• Capex excluding licenses increased YoY due to QoQacceleration in 4G/LTE roll-out
15.0 15.8
4Q17 4Q18
4.0
5.8
14.4% 13.3%
0
4Q17 4Q18
+46.6% YoY
Total Revenue(DZD BILLION)
11
©G
lob
al T
elec
om
Ho
ldin
g 2
01
9
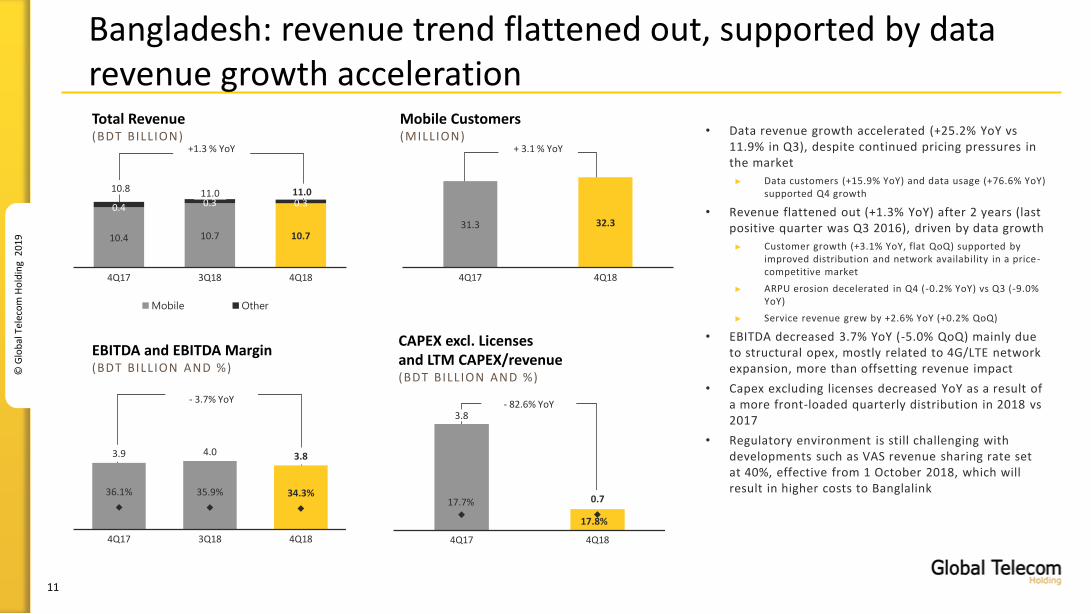
3.8
0.717.7%
17.8%0
4Q17 4Q18
EBITDA and EBITDA Margin(BDT BILLION AND %)
CAPEX excl. Licenses and LTM CAPEX/revenue(BDT BILLION AND %)
Bangladesh: revenue trend flattened out, supported by data revenue growth acceleration
Mobile Customers (MILLION)
+1.3 % YoY + 3.1 % YoY
- 3.7% YoY - 82.6% YoY
• Data revenue growth accelerated (+25.2% YoY vs 11.9% in Q3), despite continued pricing pressures in the market
► Data customers (+15.9% YoY) and data usage (+76.6% YoY) supported Q4 growth
• Revenue flattened out (+1.3% YoY) after 2 years (last positive quarter was Q3 2016), driven by data growth
► Customer growth (+3.1% YoY, flat QoQ) supported by improved distribution and network availability in a price-competitive market
► ARPU erosion decelerated in Q4 (-0.2% YoY) vs Q3 (-9.0% YoY)
► Service revenue grew by +2.6% YoY (+0.2% QoQ)
• EBITDA decreased 3.7% YoY (-5.0% QoQ) mainly due to structural opex, mostly related to 4G/LTE network expansion, more than offsetting revenue impact
• Capex excluding licenses decreased YoY as a result of a more front-loaded quarterly distribution in 2018 vs 2017
• Regulatory environment is still challenging with developments such as VAS revenue sharing rate set at 40%, effective from 1 October 2018, which will result in higher costs to Banglalink
10.4 10.7 10.7
0.4 0.3 0.3
4Q17 3Q18 4Q18
Mobile Other
10.8 11.0 11.0
31.3 32.3
4Q17 4Q18
3.9 4.0 3.8
36.1% 35.9% 34.3%
0.0
4Q17 3Q18 4Q18
Total Revenue(BDT BILLION)

©G
lob
al T
elec
om
Ho
ldin
g 2
01
9 Q&A
Vincenzo Nesci Gerbrand Nijman
Chief Executive Officer Chief Financial Officer
13
©G
lob
al T
elec
om
Ho
ldin
g 2
01
9
Further information
Investor Relations
Noha Agaiby
Cairo Registered Office Amsterdam Head Office2005C Nile City Towers - North Tower Claude Debussylaan 92
Cornish El Nile Ramlet Beaulac 1082 MD Amsterdam
Cairo 11221, Egypt The Netherlands
Tel: +202 2461 5120 Tel: +31202351900
Visit our websitewww.gtelecom.com

©G
lob
al T
elec
om
Ho
ldin
g 2
01
9 Appendix
15
©G
lob
al T
elec
om
Ho
ldin
g 2
01
9
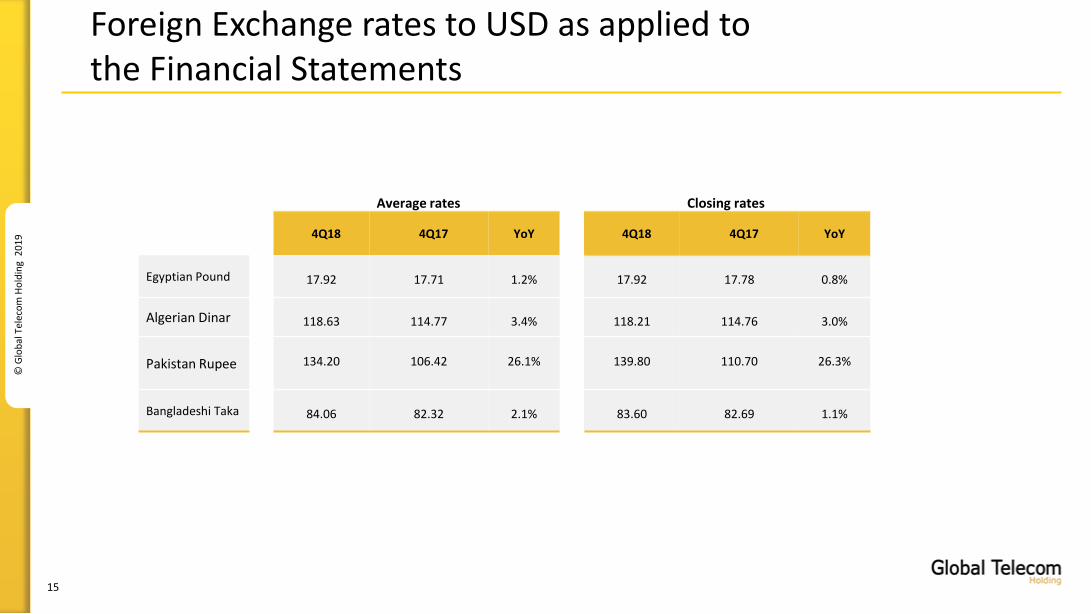
Foreign Exchange rates to USD as applied to the Financial Statements
Average rates Closing rates
4Q18 4Q17 YoY 4Q18 4Q17 YoY
Egyptian Pound 17.92 17.71 1.2% 17.92 17.78 0.8%
Algerian Dinar 118.63 114.77 3.4% 118.21 114.76 3.0%
Pakistan Rupee 134.20 106.42 26.1% 139.80 110.70 26.3%
Bangladeshi Taka 84.06 82.32 2.1% 83.60 82.69 1.1%
16
©G
lob
al T
elec
om
Ho
ldin
g 2
01
9
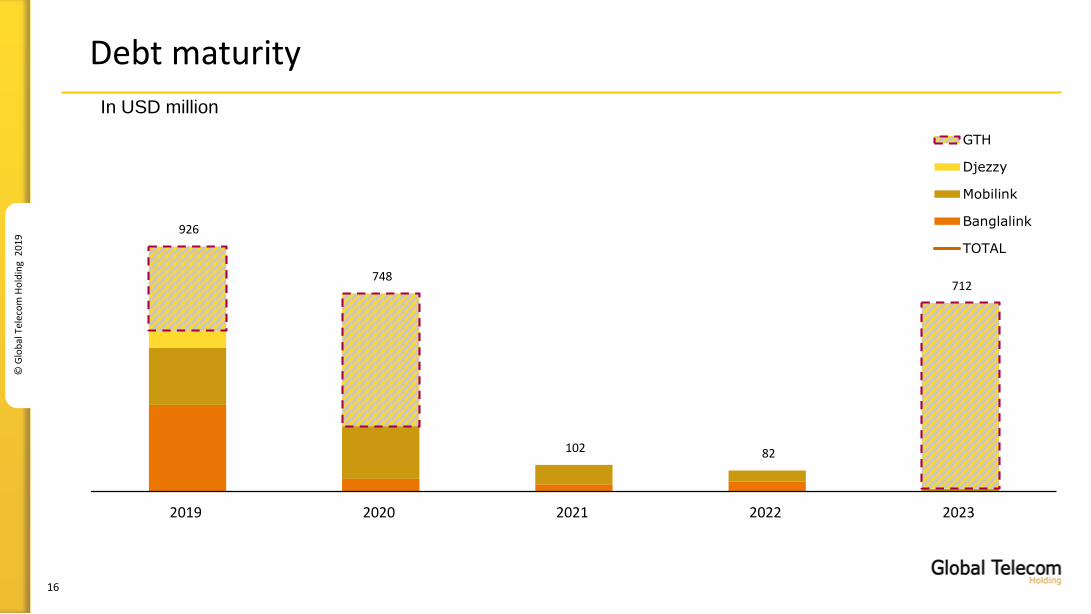
Debt maturity
926
748
102 82
712
2019 2020 2021 2022 2023
GTH
Djezzy
Mobilink
Banglalink
TOTAL
In USD million