Q4 2018 Earnings Presentation
17
Q4 2018 Earnings Presentation March 7, 2019
Transcript of Q4 2018 Earnings Presentation

Q4 2018 Earnings Presentation
March 7, 2019

2
This presentation contains summarized information concerning Mr. Cooper Group Inc. (the “Company”) and the Company’s business, operations, financial performance and
trends. No representation is made that the information in this presentation is complete. For additional financial, statistical and business related information, as well as
information regarding business and segment trends, see the Company’s most recent Annual Report on Form 10-K (“Form 10-K”) and Quarterly Reports on Form 10-Q filed
with the U.S. Securities and Exchange Commission (the “SEC”), as well other reports filed with the SEC from time to time. Such reports are or will be available in the Investors
section of the Company’s website (www.mrcoopergroup.com) and the SEC’s website (www.sec.gov).
Forward Looking Statements
This presentation contains forward-looking statements within the meaning of the Private Securities Litigation Reform Act of 1995. All statements other than statements of
historical or current fact included in this presentation that address activities, events, conditions or developments that we expect, believe or anticipate will or may occur in the
future are forward-looking statements. Forward-looking statements give our current expectations and projections relating to our financial condition, results of operations,
plans, objectives, future performance and business and these statements are not guarantees of future performance. Forward-looking statements may include the words
“anticipate,” “estimate,” “expect,” “project,” “intend,” “plan,” “believe,” “strategy,” “future,” “opportunity,” “may,” “should,” “will,” “would,” “will be,” “will continue,” “will likely
result,” and similar expressions. Such forward-looking statements involve risks and uncertainties that may cause actual events, results or performance to differ materially from
those indicated by such statements. Certain of these risks are identified and discussed in documents Mr. Cooper has filed or will file from time to time with the SEC. These risk
factors will be important to consider in determining future results and should be reviewed in their entirety. These forward-looking statements are expressed in good faith, and
Mr. Cooper believes there is a reasonable basis for them. However, the events, results or trends identified in these forward-looking statements may not occur or be achieved.
Forward-looking statements speak only as of the date they are made, and Mr. Cooper is not under any obligation, and expressly disclaims any obligation, to update, alter or
otherwise revise any forward-looking statement, except as required by law. Readers should carefully review the statements set forth in the reports that Mr. Cooper has filed or
will file from time to time with the SEC.
Basis of Presentation
For purpose of Mr. Cooper's financial statement presentation, Mr. Cooper Group Inc. was determined to be the accounting acquirer in the WMIH Corp. merger. “Predecessor”
financial information relates to Nationstar and “Successor” financial information relates to Mr. Cooper. The financial results for the three months ended December 31, 2018
reflect the results of the Successor. With respect to the three months ended September 30, 2018, the Company has presented the results on a “combined” basis by combining
the financial results of the Predecessor for the period from July 1, 2018 through July 31, 2018 and the financial results of the Successor for the period from August 1, 2018
through September 30, 2018. Although the separate financial results of the Predecessor for the period from July 1, 2018 through July 31, 2018 and the Successor for the
period from August 1, 2018 through September 30, 2018 are each separately presented under generally accepted accounting principles (“GAAP”) in the United States, the
combined results reported reflect non-GAAP financial measures, because a different basis of accounting was used with respect to the financial results for the Predecessor as
compared to the financial results of the Successor. The financial results for the three months ended June 30, 2018, March 31, 2018, and December 31, 2017 reflect the results
of the Predecessor.
Non-GAAP Measures
This presentation contains certain references to non-GAAP measures. Please refer to the Appendix for more information on non-GAAP measures.
Important Information
3
2008 2009 2010 2011 2012 2013 2014 2015 2016 2017 2018
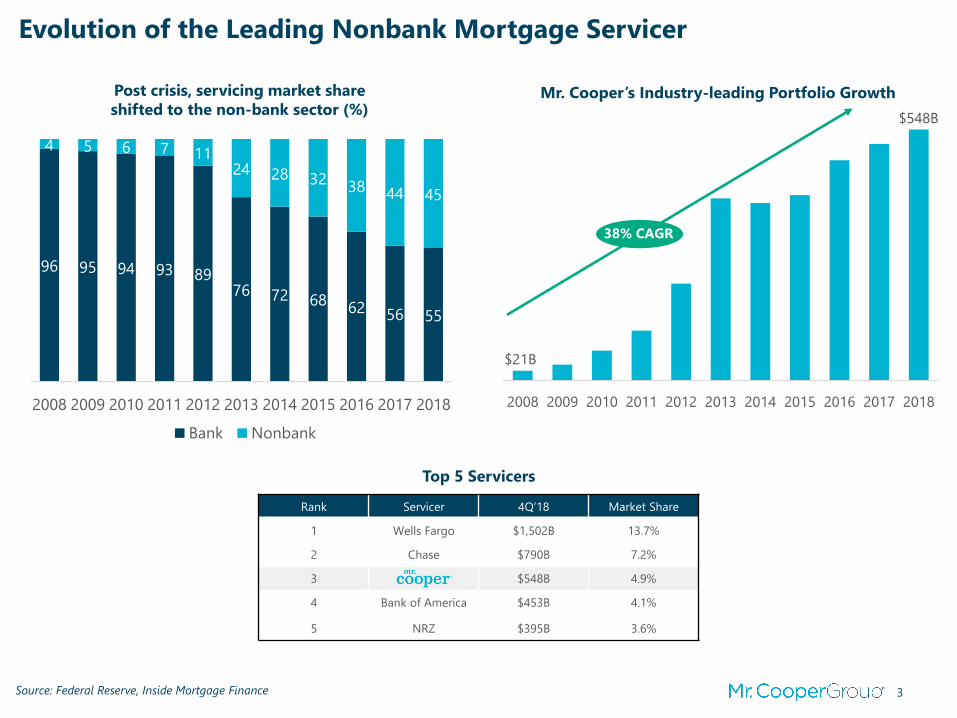
38% CAGR
Evolution of the Leading Nonbank Mortgage Servicer
Post crisis, servicing market share
shifted to the non-bank sector (%)Mr. Cooper’s Industry-leading Portfolio Growth
Source: Federal Reserve, Inside Mortgage Finance
Top 5 Servicers
Rank Servicer 4Q’18 Market Share
1 Wells Fargo $1,502B 13.7%
2 Chase $790B 7.2%
3 $548B 4.9%
4 Bank of America $453B 4.1%
5 NRZ $395B 3.6%
$21B
$548B
96 95 94 93 8976 72 68
62 56 55
4 5 6 7 1124 28 32
38 44 45
2008 2009 2010 2011 2012 2013 2014 2015 2016 2017 2018
Bank Nonbank
4
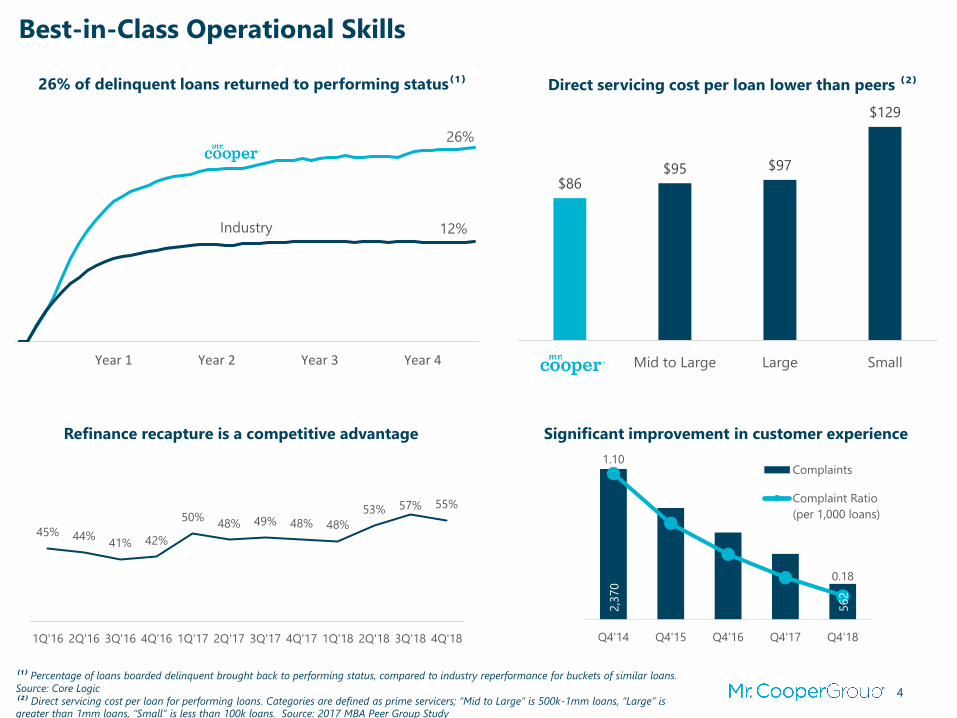
45% 44%41% 42%
50%48% 49% 48% 48%
53% 57% 55%
1Q'16 2Q'16 3Q'16 4Q'16 1Q'17 2Q'17 3Q'17 4Q'17 1Q'18 2Q'18 3Q'18 4Q'18
Year 1 Year 2 Year 3 Year 4
26%
12%Industry
$86$95 $97
$129
Mid to Large Large Small
Direct servicing cost per loan lower than peers ⁽²⁾ 26% of delinquent loans returned to performing status⁽¹⁾
⁽¹⁾ Percentage of loans boarded delinquent brought back to performing status, compared to industry reperformance for buckets of similar loans.
Source: Core Logic
⁽²⁾ Direct servicing cost per loan for performing loans. Categories are defined as prime servicers; “Mid to Large” is 500k-1mm loans, “Large” is
greater than 1mm loans, “Small” is less than 100k loans. Source: 2017 MBA Peer Group Study
Significant improvement in customer experience
2,3
70
562
1.10
0.18
0
500
1,000
1,500
2,000
2,500
Q4'14 Q4'15 Q4'16 Q4'17 Q4'18
Complaints
Complaint Ratio
(per 1,000 loans)
Refinance recapture is a competitive advantage
Best-in-Class Operational Skills

5
Project Titan
Integrate AMS,
PacU, & Seterus
Deleverage
Scale
Low costs
Loss mitigation
Compliance
Customer-centric culture
Risk management
Success Factors for Mortgage Servicers
Mr. Cooper Initiatives
The Next Phase in Mr. Cooper’s Evolution
6
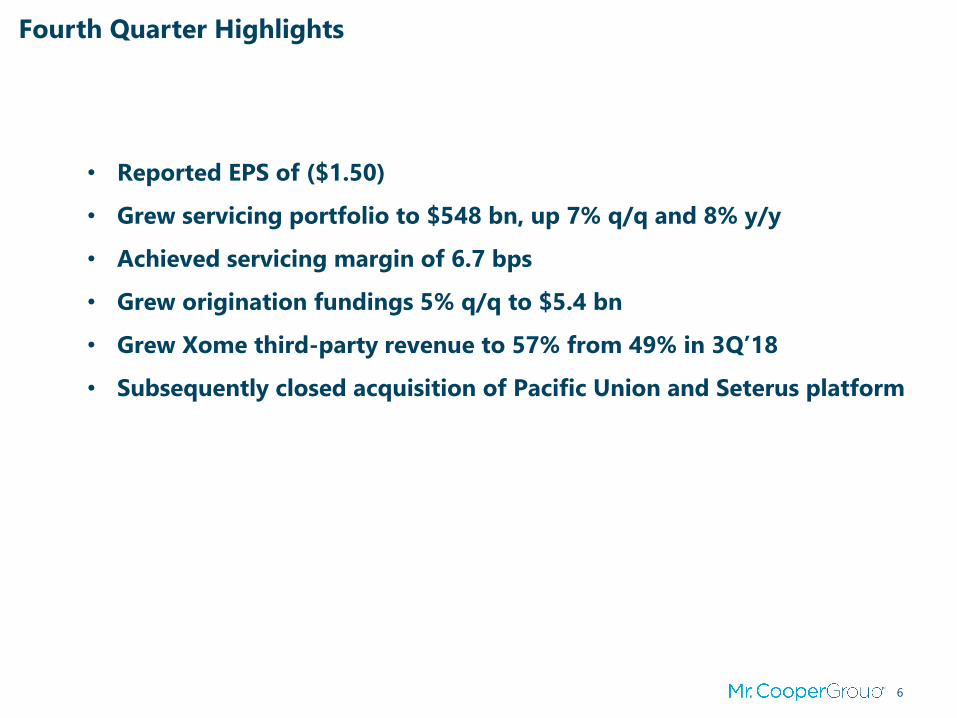
• Reported EPS of ($1.50)
• Grew servicing portfolio to $548 bn, up 7% q/q and 8% y/y
• Achieved servicing margin of 6.7 bps
• Grew origination fundings 5% q/q to $5.4 bn
• Grew Xome third-party revenue to 57% from 49% in 3Q’18
• Subsequently closed acquisition of Pacific Union and Seterus platform
Fourth Quarter Highlights

7
Summary 4Q 2018 Financial Results
⁽¹⁾Excluding the effect of the DTA valuation release, the GAAP tax rate would have been 22.4% for the five month successor period⁽²⁾Non-GAAP measure. Please see appendix for reconciliationsNote: 3Q’18 average diluted sharecount based on the successor period
$ mm's, except per share data 4Q'18 3Q'18 4Q'17
Servicing related, net $ 347 $ 330 $ 295
Mark-to-market (188) 49 0
Net gain on mortgage loans held for sale 93 127 142
Total revenues 252 506 437
Salaries, wages and benefits 198 208 185
General and administrative 234 309 181
Total expenses 432 517 366
Interest income 166 138 162
Interest expense (171) (175) (174)
Other income (expense) 7 6 (1)
Total other income (expense), net 2 (31) (13)
Pretax income (178)$ (42)$ 58$
Net income (loss) (136)$ 947$ 41$
Average diluted sharecount 90.8 92.0 98.7
Diluted EPS (1.50)$ 10.34$ 0.41$
4Q'18 Per share
3Q'18 TBV⁽²⁾ 1,958$ 21.29$
4Q'18 net (loss) (136) (1.50)
Intangible amortization 14 0.16
Intangible assets related to Xome (14) (0.15)
Goodwill related to AMS acquisition (10) (0.11)
Goodwill related to WMIH merger (10) (0.11)
Other 3 0.03
4Q'18 TBV⁽²⁾ 1,805$ 19.89$
Pretax income $(178)
Mark-to-market 188
Project Titan 10
AMS impact 7
IT development costs 1
Business shutdown costs 6
Merger-related costs 4
Intangible amortization 14
$52
Notional effect of
marginal tax rate⁽¹⁾ (2)
$50
$0.55

8
12.7%
10.7%12.1%
11.1%
9.1%
3%
8%
13%
18%
4Q'17 1Q'18 2Q'18 3Q'18 4Q'18
$381 $398
$473 $508
$548
2014 2015 2016 2017 2018
Subservicing MSR
95%
5%
94%
6%
74%
26%
62%
38% 41%
59%
Servicing Portfolio Growth Driven by 17% y/y Expansion in SubservicinginSubservicing
• Total portfolio grew 7% q/q, and 8% y/y
• Subservicing portfolio grew 7% q/q,
and 17% y/y, as part of the Company’s
strategy to mitigate exposure to interest
rate and credit volatility
• Pacific Union closed February 1, 2019,
adding approximately $23 bn UPB in MSRs
• Portfolio growth benefited from reduction
in CPR from 11.1% to 9.1%
Portfolio Walk
+7%$5
$56
$28
Q3'18 Originations Bulk/Flow Runoff/Transfers Q4'18
CPR Trend
+17%
+8%
+2%
$514B
$548B
Portfolio Trend
9
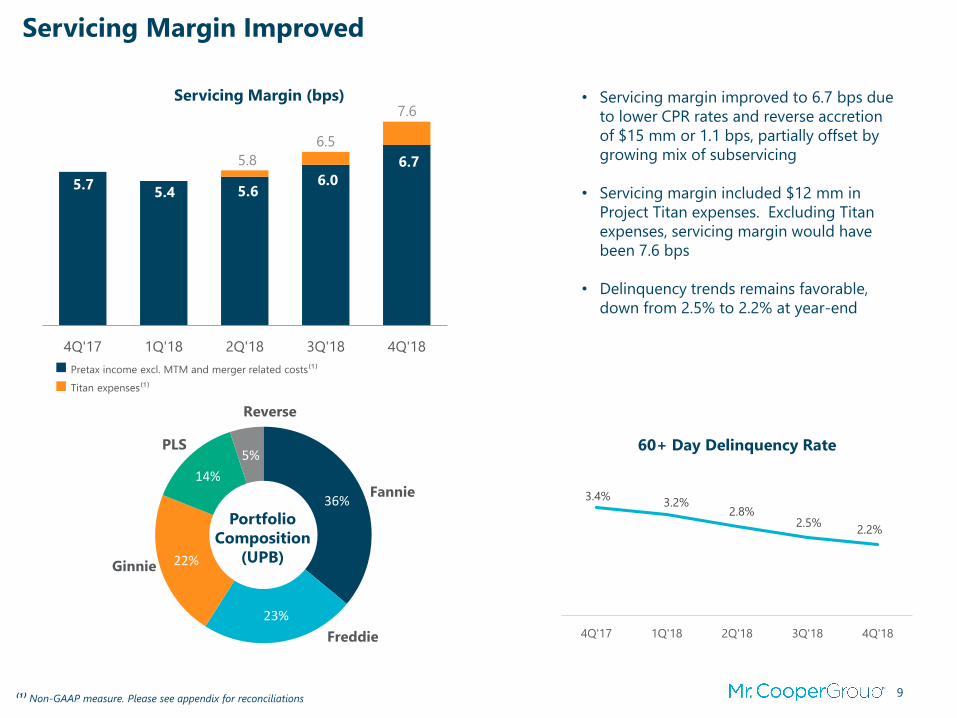
5.7 5.4 5.6
6.0
6.7
4Q'17 1Q'18 2Q'18 3Q'18 4Q'18
36%
23%
22%
14%
5%
Freddie
Reverse
PLS
Ginnie
Fannie 3.4%3.2%
2.8%2.5%
2.2%
4Q'17 1Q'18 2Q'18 3Q'18 4Q'18
Servicing Margin Improved
• Servicing margin improved to 6.7 bps due
to lower CPR rates and reverse accretion
of $15 mm or 1.1 bps, partially offset by
growing mix of subservicing
• Servicing margin included $12 mm in
Project Titan expenses. Excluding Titan
expenses, servicing margin would have
been 7.6 bps
• Delinquency trends remains favorable,
down from 2.5% to 2.2% at year-end
Servicing Margin (bps)
60+ Day Delinquency Rate
Portfolio
Composition
(UPB)
⁽¹⁾ Non-GAAP measure. Please see appendix for reconciliations
Pretax income excl. MTM and merger related costs⁽¹⁾
Titan expenses⁽¹⁾
7.6
6.5
5.8
10
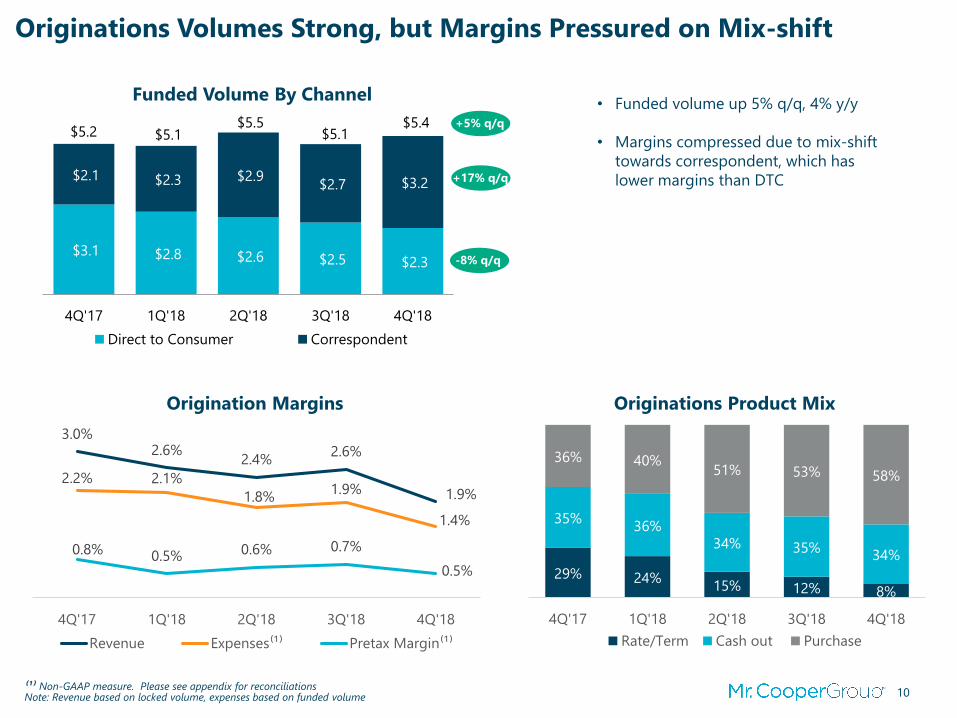
$3.1 $2.8 $2.6 $2.5 $2.3
$2.1 $2.3 $2.9 $2.7 $3.2
$5.2 $5.1 $5.5
$5.1 $5.4
4Q'17 1Q'18 2Q'18 3Q'18 4Q'18
Direct to Consumer Correspondent
3.0%2.6%
2.4%2.6%
1.9%2.2% 2.1%
1.8%1.9%
1.4%
0.8% 0.5% 0.6% 0.7%
0.5%
4Q'17 1Q'18 2Q'18 3Q'18 4Q'18
Revenue Expenses⁽¹⁾ Pretax Margin⁽¹⁾
29% 24%15% 12% 8%
35%36%
34% 35%34%
36% 40%51% 53% 58%
4Q'17 1Q'18 2Q'18 3Q'18 4Q'18
Rate/Term Cash out Purchase
Originations Volumes Strong, but Margins Pressured on Mix-shift
• Funded volume up 5% q/q, 4% y/y
• Margins compressed due to mix-shift
towards correspondent, which has
lower margins than DTC
Funded Volume By Channel
Origination Margins Originations Product Mix
-8% q/q
+5% q/q
+17% q/q
⁽¹⁾ Non-GAAP measure. Please see appendix for reconciliationsNote: Revenue based on locked volume, expenses based on funded volume
11
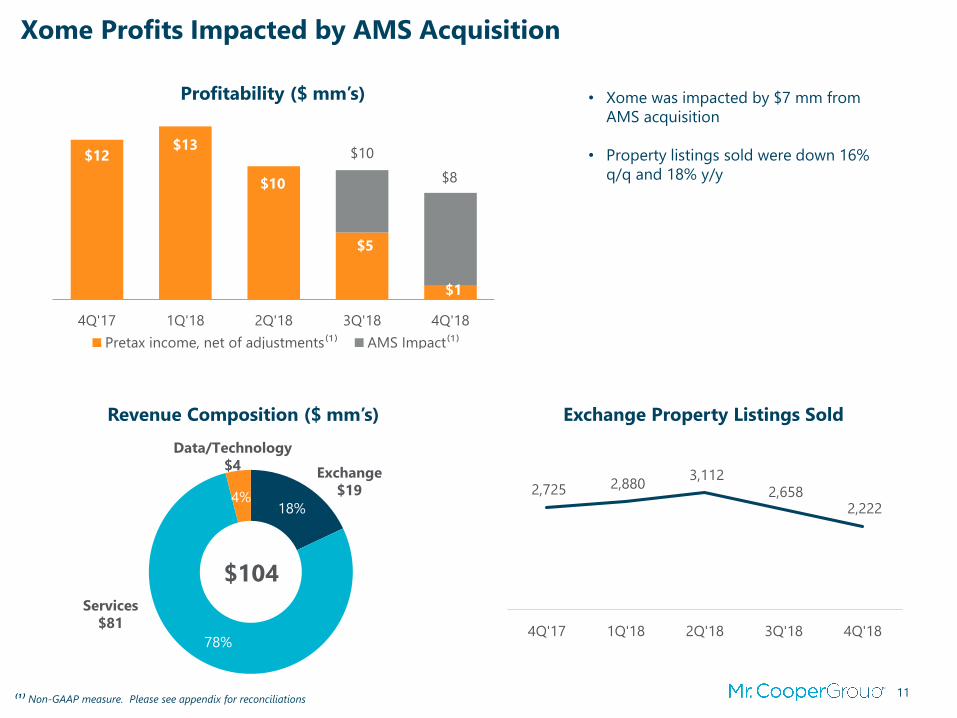
Profitability ($ mm’s)
$12 $13
$10
$5
$1
4Q'17 1Q'18 2Q'18 3Q'18 4Q'18
Pretax income, net of adjustments⁽¹⁾ AMS Impact⁽¹⁾
$8
$10
Xome Profits Impacted by AMS Acquisition
• Xome was impacted by $7 mm from
AMS acquisition
• Property listings sold were down 16%
q/q and 18% y/y
2,725 2,880 3,112
2,658 2,222
4Q'17 1Q'18 2Q'18 3Q'18 4Q'18
Revenue Composition ($ mm’s) Exchange Property Listings Sold
18%
78%
4%
Exchange
$19
Data/Technology
$4
Services
$81
$104
⁽¹⁾ Non-GAAP measure. Please see appendix for reconciliations

Appendix
13
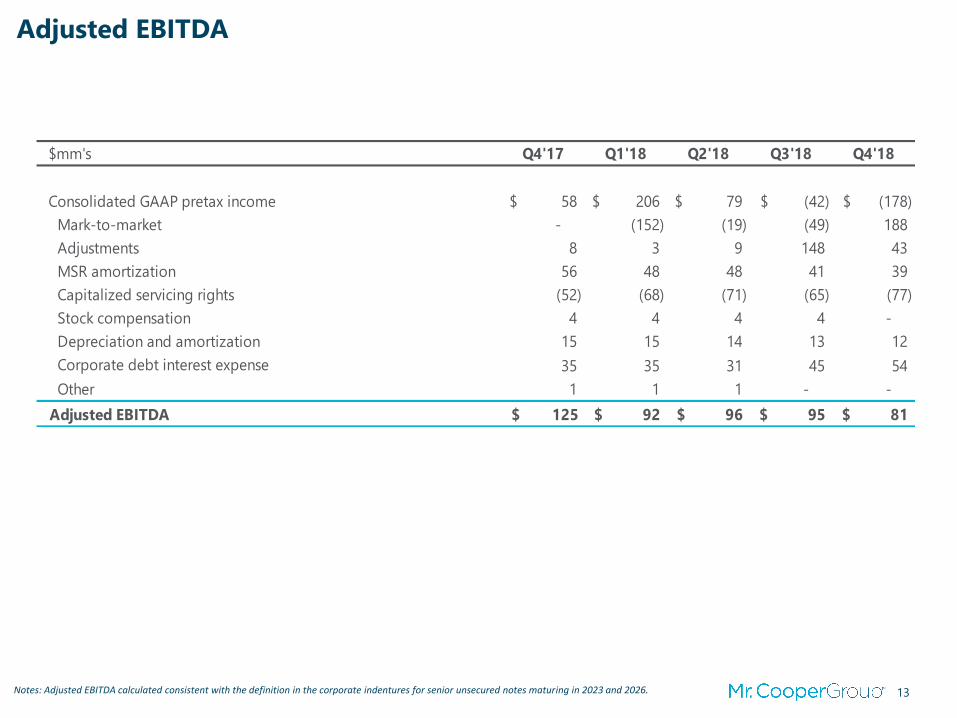
Adjusted EBITDA
Notes: Adjusted EBITDA calculated consistent with the definition in the corporate indentures for senior unsecured notes maturing in 2023 and 2026.
$mm's Q4'17 Q1'18 Q2'18 Q3'18 Q4'18
Consolidated GAAP pretax income 58$ 206$ 79$ (42)$ (178)$
Mark-to-market - (152) (19) (49) 188
Adjustments 8 3 9 148 43
MSR amortization 56 48 48 41 39
Capitalized servicing rights (52) (68) (71) (65) (77)
Stock compensation 4 4 4 4 -
Depreciation and amortization 15 15 14 13 12
Corporate debt interest expense 35 35 31 45 54
Other 1 1 1 - -
Adjusted EBITDA $ 125 $ 92 $ 96 $ 95 $ 81
14
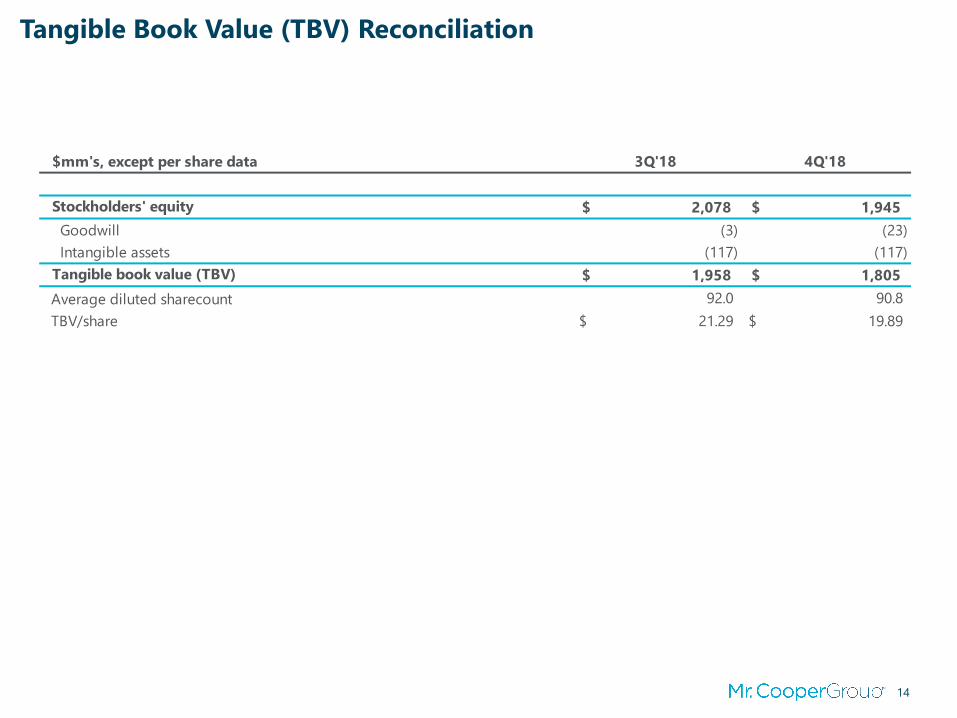
Tangible Book Value (TBV) Reconciliation
$mm's, except per share data 3Q'18 4Q'18
Stockholders' equity 2,078$ 1,945$
Goodwill (3) (23)
Intangible assets (117) (117)
Tangible book value (TBV) 1,958$ 1,805$
Average diluted sharecount 92.0 90.8
TBV/share 21.29$ 19.89$
15
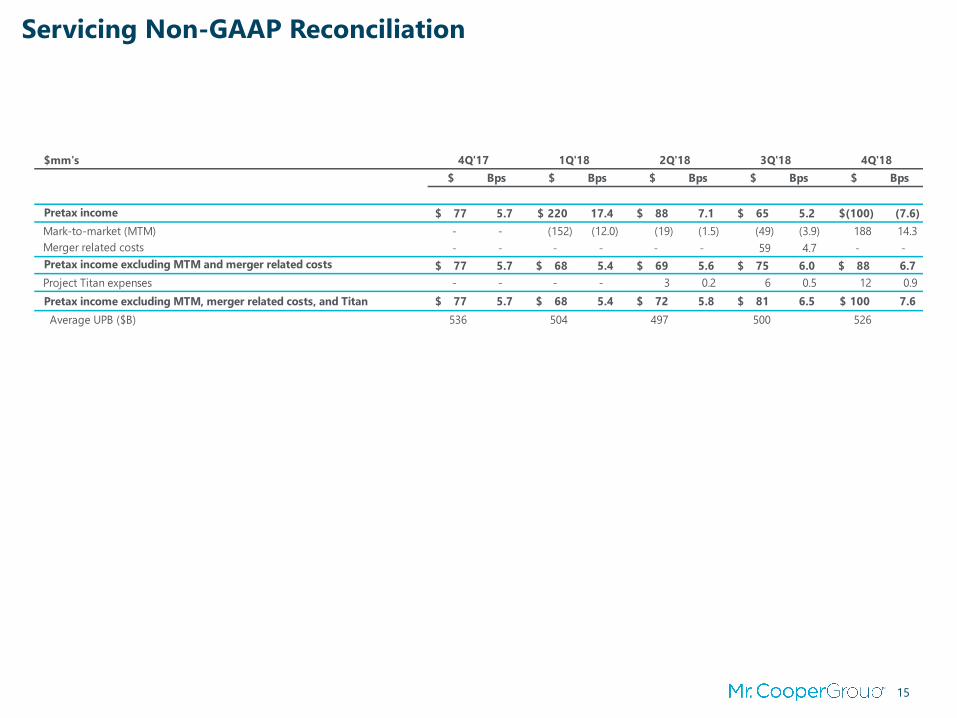
Servicing Non-GAAP Reconciliation
$mm's
$ Bps $ Bps $ Bps $ Bps $ Bps
Pretax income 77$ 5.7 220$ 17.4 88$ 7.1 65$ 5.2 (100)$ (7.6)
Mark-to-market (MTM) - - (152) (12.0) (19) (1.5) (49) (3.9) 188 14.3
Merger related costs - - - - - - 59 4.7 - -
Pretax income excluding MTM and merger related costs 77$ 5.7 68$ 5.4 69$ 5.6 75$ 6.0 88$ 6.7
Project Titan expenses - - - - 3 0.2 6 0.5 12 0.9
Pretax income excluding MTM, merger related costs, and Titan 77$ 5.7 68$ 5.4 72$ 5.8 81$ 6.5 100$ 7.6
Average UPB ($B) 536 504 497 500 526
4Q'17 1Q'18 2Q'18 3Q'18 4Q'18
16
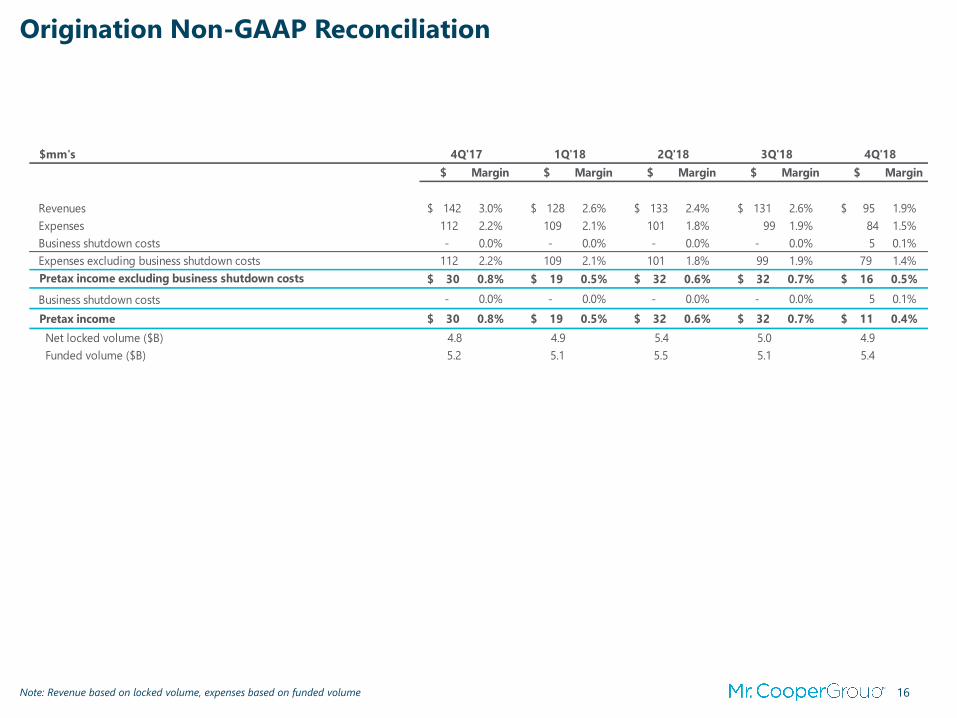
Origination Non-GAAP Reconciliation
Note: Revenue based on locked volume, expenses based on funded volume
$mm's
$ Margin $ Margin $ Margin $ Margin $ Margin
Revenues 142$ 3.0% 128$ 2.6% 133$ 2.4% 131$ 2.6% 95$ 1.9%
Expenses 112 2.2% 109 2.1% 101 1.8% 99 1.9% 84 1.5%
Business shutdown costs - 0.0% - 0.0% - 0.0% - 0.0% 5 0.1%
Expenses excluding business shutdown costs 112 2.2% 109 2.1% 101 1.8% 99 1.9% 79 1.4%
Pretax income excluding business shutdown costs 30$ 0.8% 19$ 0.5% 32$ 0.6% 32$ 0.7% 16$ 0.5%
Business shutdown costs - 0.0% - 0.0% - 0.0% - 0.0% 5 0.1%
Pretax income 30$ 0.8% 19$ 0.5% 32$ 0.6% 32$ 0.7% 11$ 0.4%
Net locked volume ($B) 4.8 4.9 5.4 5.0 4.9
Funded volume ($B) 5.2 5.1 5.5 5.1 5.4
4Q'17 1Q'18 2Q'18 3Q'18 4Q'18

17
Xome Non-GAAP Reconciliation
$mm's 4Q'17 1Q'18 2Q'18 3Q'18 4Q'18
Pretax income 12$ 22$ 10$ 4$ (2)$
Business shutdown costs - - - 1 1
Asset sales (1) (9) - - (1)
Intangible amortization 1 - - 0 3
Pretax income, net of adjustments 12$ 13$ 10$ 5$ 1$
AMS impact - - - 5 7
Pretax income, net of adjustments and AMS impact 12$ 13$ 10$ 10$ 8$