Q4 2017 Conference Call -...
25
1 | Q4 2017 / FY 2017 Conference Call | Veeco Instruments Inc © 2018 Q4 2017 Conference Call > Veeco Instruments Inc. > February 12, 2018
Transcript of Q4 2017 Conference Call -...

1 | Q4 2017 / FY 2017 Conference Call | Veeco Instruments Inc © 2018
Q4 2017
Conference Call
> Veeco Instruments Inc.
> February 12, 2018

2 | Q4 2017 / FY 2017 Conference Call | Veeco Instruments Inc © 2018
Safe Harbor
To the extent that this presentation discusses expectations or otherwise
makes statements about the future, such statements are forward-looking
and are subject to a number of risks and uncertainties that could cause
actual results to differ materially from the statements made.
These items include the risk factors discussed in the Business Description
and Management's Discussion and Analysis sections of Veeco's Annual
Report on Form 10-K for the year ended December 31, 2016 and
subsequent Quarterly Reports on form 10Q and current reports on Form
8-K. Veeco does not undertake any obligation to update any forward-
looking statements to reflect future events or circumstances after the date
of such statements.

3 | Q4 2017 / FY 2017 Conference Call | Veeco Instruments Inc. © 2018
CEO Introduction
John Peeler

4 | Q4 2017 / FY 2017 Conference Call | Veeco Instruments Inc. © 2018
19¢ Non-GAAP
EPS
$143M Revenue
Q4 2017 Highlights
> Bookings up 3rd consecutive quarter; backlog building
> Revenue up 9% from previous quarter
> Strongest quarter of the year in Non-GAAP operating income
> Non-GAAP EPS above high end of guided range
$179M Bookings
Q4 Results
Note: A reconciliation of GAAP to Non-GAAP financial measures may be found in Back-up & Reconciliation Tables
$10.5M Non-GAAP
Op Income
Executed well with positive momentum
5 | Q4 2017 / FY 2017 Conference Call | Veeco Instruments Inc. © 2018
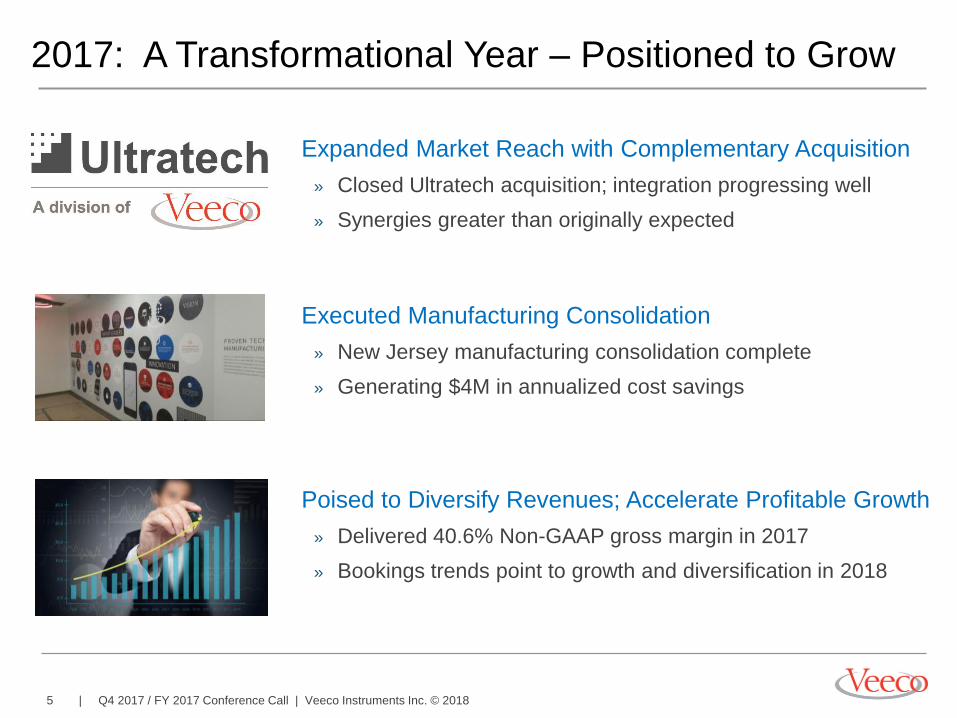
2017: A Transformational Year – Positioned to Grow
Expanded Market Reach with Complementary Acquisition
» Closed Ultratech acquisition; integration progressing well
» Synergies greater than originally expected
Executed Manufacturing Consolidation
» New Jersey manufacturing consolidation complete
» Generating $4M in annualized cost savings
Poised to Diversify Revenues; Accelerate Profitable Growth
» Delivered 40.6% Non-GAAP gross margin in 2017
» Bookings trends point to growth and diversification in 2018

6 | Q4 2017 / FY 2017 Conference Call | Veeco Instruments Inc. © 2018
CFO Financial Review
Sam Maheshwari

7 | Q4 2017 / FY 2017 Conference Call | Veeco Instruments Inc. © 2018
Q4 2017 Revenue by End Market and Geography
Bookings growth should lead to more diversified revenue mix
> Bookings grew to ~$179M
> Building backlog for 6 quarters in a row
> Growth in Front-End Semi and AP, will lead to
more diverse 2018
> China, Blue LED accounted for 13% of total
Veeco revenue
Mix By End Market By Geography
9% Advanced Packaging,
MEMS & RF Filters
24% Scientific &
Industrial 58% LED Lighting, Display &
Compound Semi
$143M
53% Rest of World
18% China
14% EMEA
15% United States
9% Front-End
Semi
> Geographically diverse revenue streams
> ROW driven by LED sales into South East
Asia, South Korea and Taiwan
Note: Amounts may not calculate precisely due to rounding
8 | Q4 2017 / FY 2017 Conference Call | Veeco Instruments Inc. © 2018
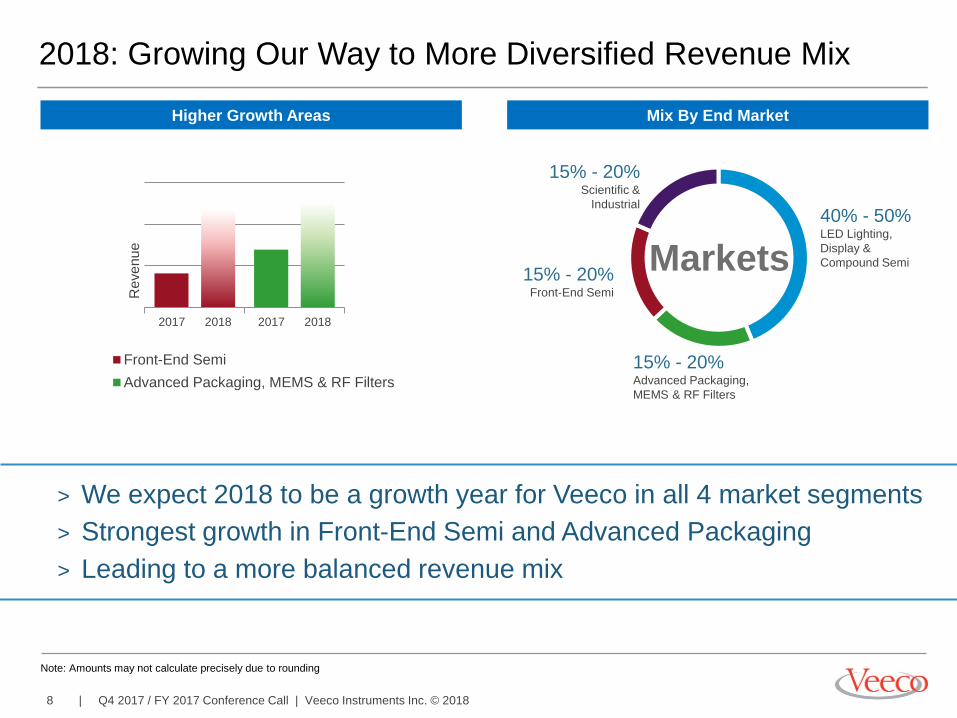
2018: Growing Our Way to More Diversified Revenue Mix
15% - 20% Advanced Packaging,
MEMS & RF Filters
15% - 20% Scientific &
Industrial
15% - 20% Front-End Semi
40% - 50% LED Lighting,
Display &
Compound Semi Markets
Mix By End Market Higher Growth Areas
Front-End Semi
Advanced Packaging, MEMS & RF Filters
> We expect 2018 to be a growth year for Veeco in all 4 market segments
> Strongest growth in Front-End Semi and Advanced Packaging
> Leading to a more balanced revenue mix
2017 2018 2017 2018
Note: Amounts may not calculate precisely due to rounding
Re
ve
nu
e
9 | Q4 2017 / FY 2017 Conference Call | Veeco Instruments Inc. © 2018
Non-GAAP GAAP
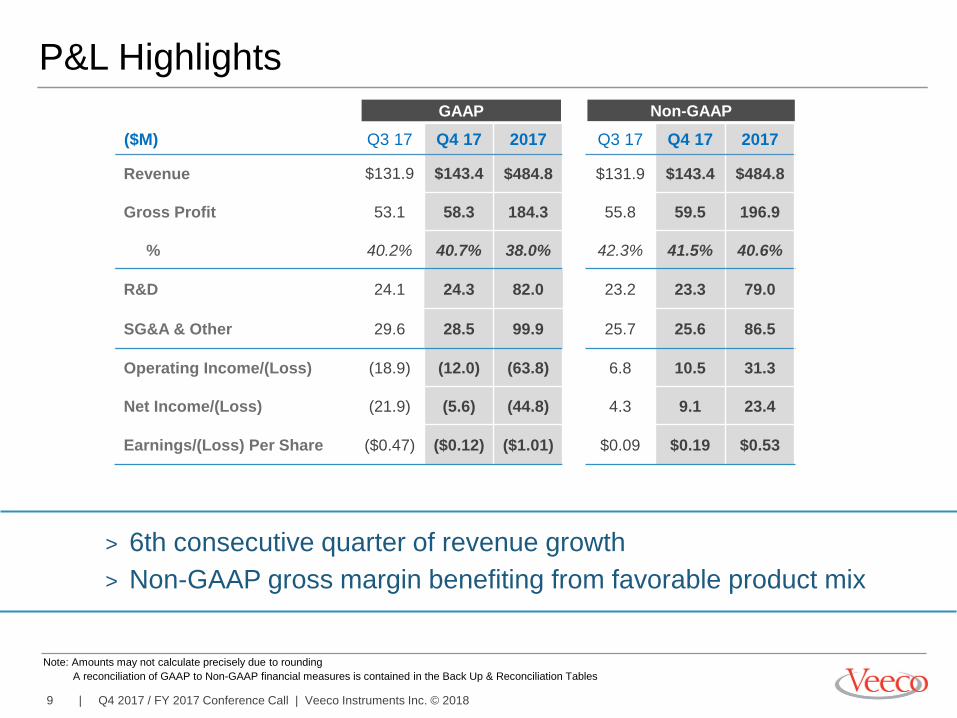
P&L Highlights
Note: Amounts may not calculate precisely due to rounding
A reconciliation of GAAP to Non-GAAP financial measures is contained in the Back Up & Reconciliation Tables
($M) Q3 17 Q4 17 2017 Q3 17 Q4 17 2017
Revenue $131.9 $143.4 $484.8 $131.9 $143.4 $484.8
Gross Profit 53.1 58.3 184.3 55.8 59.5 196.9
% 40.2% 40.7% 38.0% 42.3% 41.5% 40.6%
R&D 24.1 24.3 82.0 23.2 23.3 79.0
SG&A & Other 29.6 28.5 99.9 25.7 25.6 86.5
Operating Income/(Loss) (18.9) (12.0) (63.8) 6.8 10.5 31.3
Net Income/(Loss) (21.9) (5.6) (44.8) 4.3 9.1 23.4
Earnings/(Loss) Per Share ($0.47) ($0.12) ($1.01) $0.09 $0.19 $0.53
> 6th consecutive quarter of revenue growth
> Non-GAAP gross margin benefiting from favorable product mix
10 | Q4 2017 / FY 2017 Conference Call | Veeco Instruments Inc. © 2018
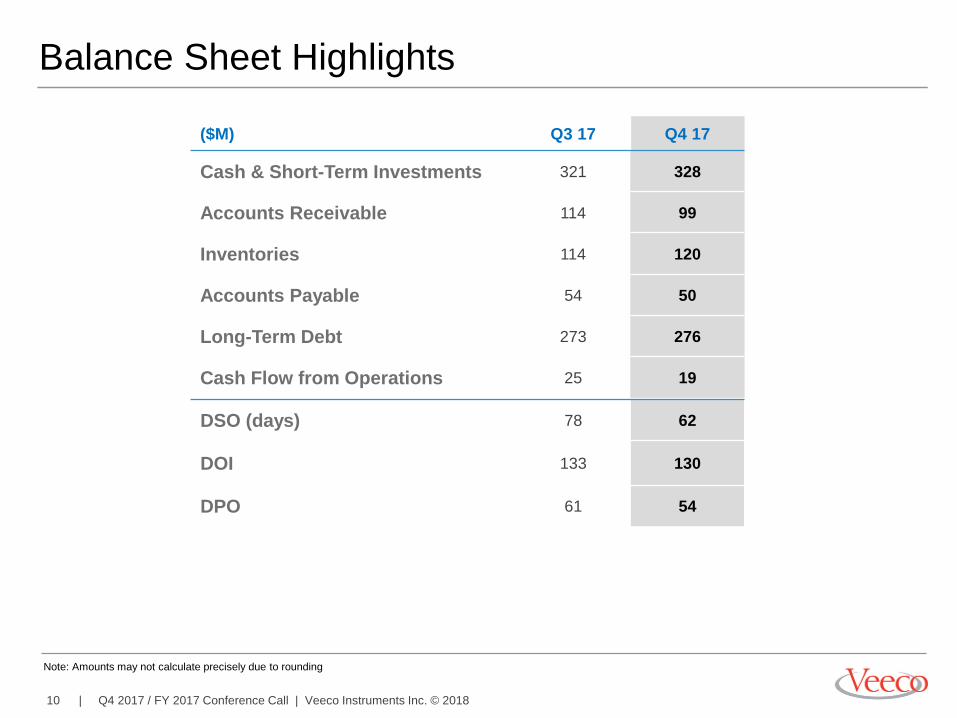
DSO (days) 78 62
DOI 133 130
DPO 61 54
($M) Q3 17 Q4 17
Cash & Short-Term Investments 321 328
Accounts Receivable 114 99
Inventories 114 120
Accounts Payable 54 50
Long-Term Debt 273 276
Cash Flow from Operations 25 19
Balance Sheet Highlights
Note: Amounts may not calculate precisely due to rounding
11 | Q4 2017 / FY 2017 Conference Call | Veeco Instruments Inc. © 2018
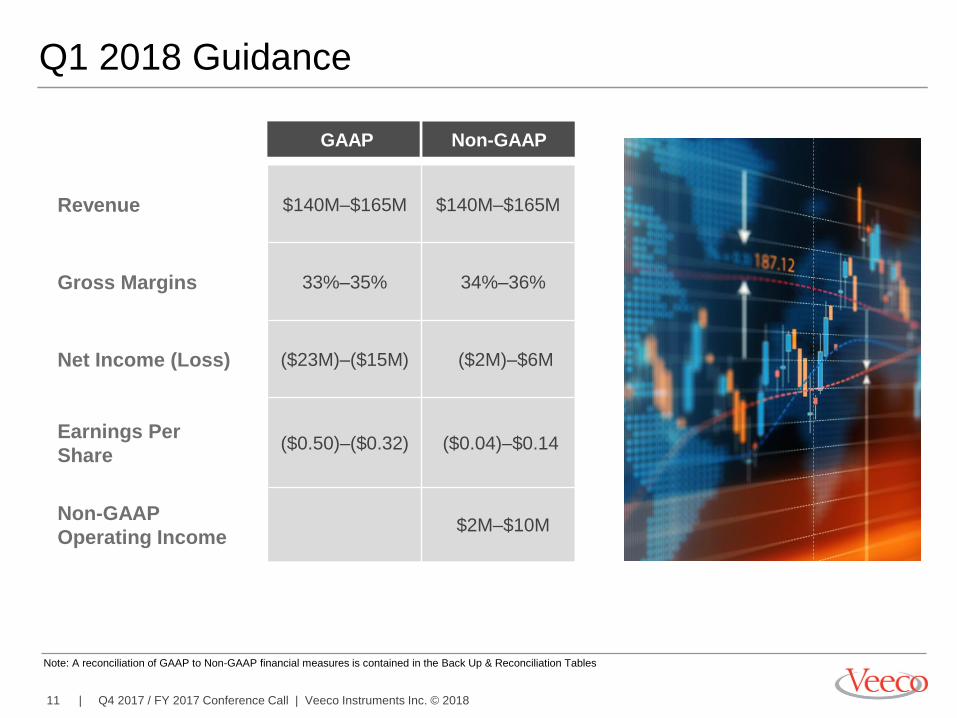
Q1 2018 Guidance
Revenue $140M–$165M $140M–$165M
Gross Margins 33%–35% 34%–36%
Net Income (Loss) ($23M)–($15M) ($2M)–$6M
Earnings Per
Share ($0.50)–($0.32) ($0.04)–$0.14
Non-GAAP
Operating Income $2M–$10M
Non-GAAP GAAP
Note: A reconciliation of GAAP to Non-GAAP financial measures is contained in the Back Up & Reconciliation Tables

12 | Q4 2017 / FY 2017 Conference Call | Veeco Instruments Inc. © 2018
Business Update
& Outlook
13 | Q4 2017 / FY 2017 Conference Call | Veeco Instruments Inc. © 2018
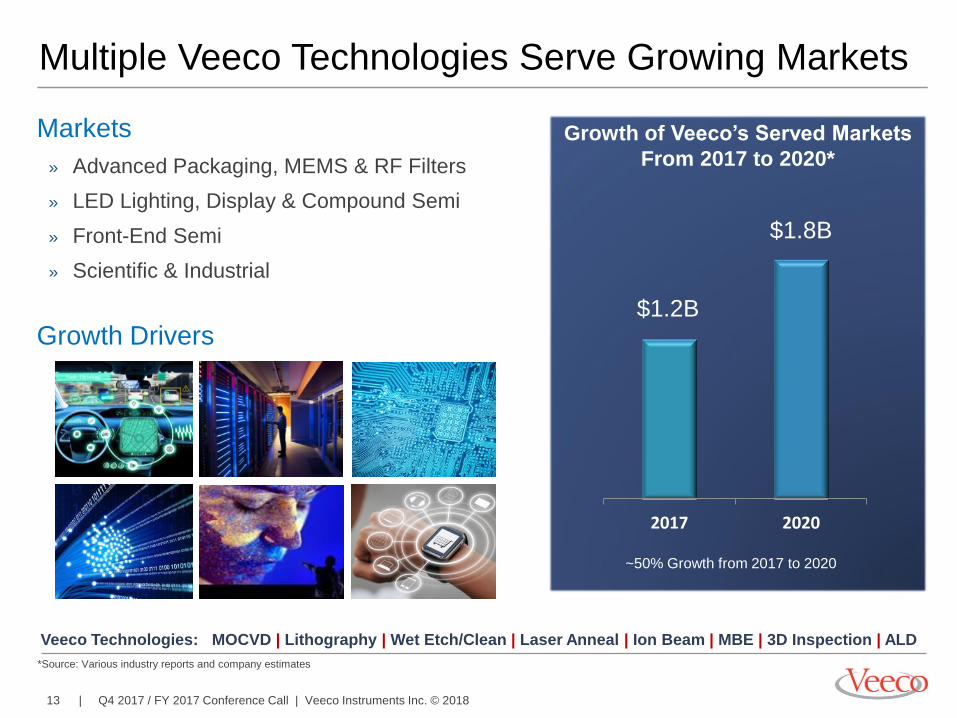
Multiple Veeco Technologies Serve Growing Markets
*Source: Various industry reports and company estimates
Veeco Technologies: MOCVD | Lithography | Wet Etch/Clean | Laser Anneal | Ion Beam | MBE | 3D Inspection | ALD
2017 2020
~50% Growth from 2017 to 2020
Growth of Veeco’s Served Markets
From 2017 to 2020*
$1.2B
$1.8B
Markets
» Advanced Packaging, MEMS & RF Filters
» LED Lighting, Display & Compound Semi
» Front-End Semi
» Scientific & Industrial
Growth Drivers
14 | Q4 2017 / FY 2017 Conference Call | Veeco Instruments Inc. © 2018
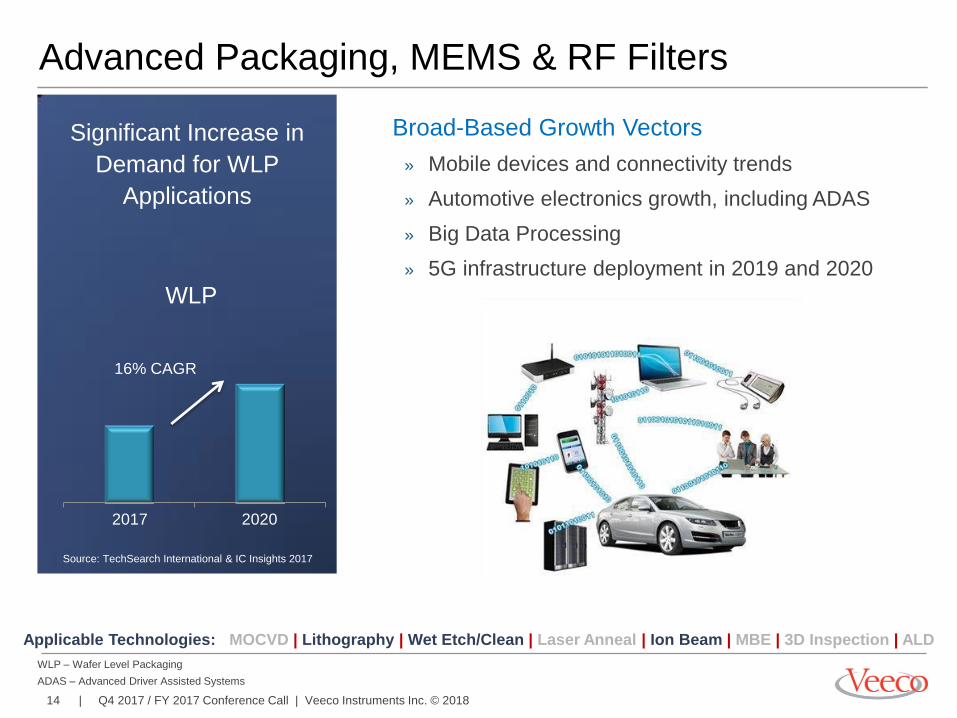
Advanced Packaging, MEMS & RF Filters
Source: TechSearch International & IC Insights 2017
Veeco Advanced Packaging
Revenue
2017
2020
16% CAGR
WLP
Significant Increase in
Demand for WLP
Applications
Reflects new customers or application penetrations 2016
WLP – Wafer Level Packaging
ADAS – Advanced Driver Assisted Systems
Applicable Technologies: MOCVD | Lithography | Wet Etch/Clean | Laser Anneal | Ion Beam | MBE | 3D Inspection | ALD
Broad-Based Growth Vectors
» Mobile devices and connectivity trends
» Automotive electronics growth, including ADAS
» Big Data Processing
» 5G infrastructure deployment in 2019 and 2020
15 | Q4 2017 / FY 2017 Conference Call | Veeco Instruments Inc. © 2018
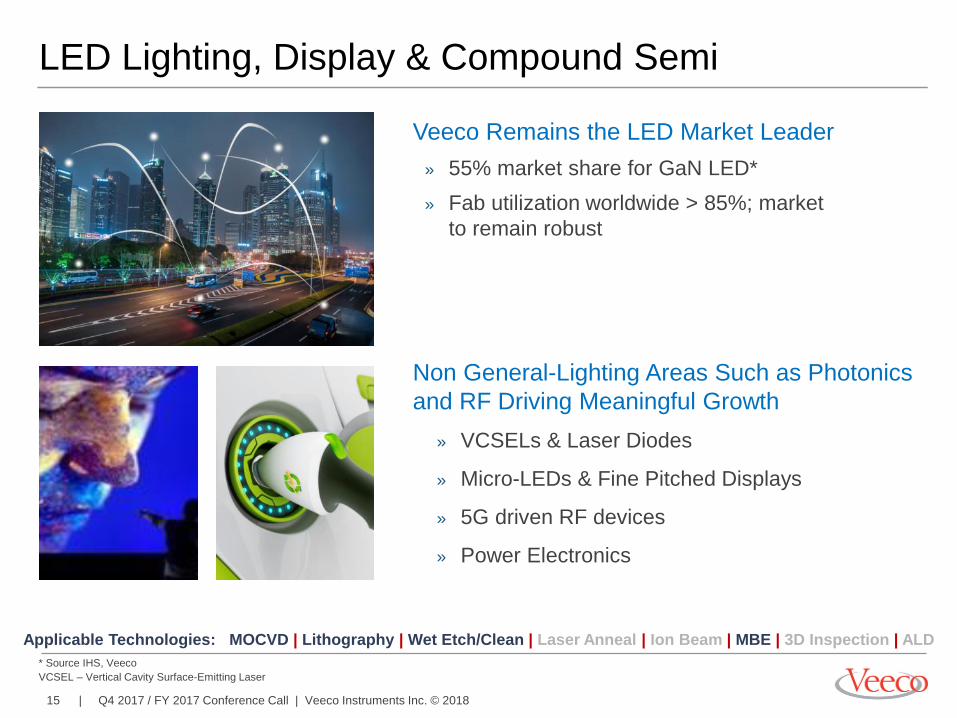
Non General-Lighting Areas Such as Photonics
and RF Driving Meaningful Growth
» VCSELs & Laser Diodes
» Micro-LEDs & Fine Pitched Displays
» 5G driven RF devices
» Power Electronics
LED Lighting, Display & Compound Semi
Veeco Remains the LED Market Leader
» 55% market share for GaN LED*
» Fab utilization worldwide > 85%; market
to remain robust
* Source IHS, Veeco
VCSEL – Vertical Cavity Surface-Emitting Laser
Applicable Technologies: MOCVD | Lithography | Wet Etch/Clean | Laser Anneal | Ion Beam | MBE | 3D Inspection | ALD

16 | Q4 2017 / FY 2017 Conference Call | Veeco Instruments Inc. © 2018
Front-End Semi
LSA – Laser Spike Anneal
EUV – Extreme Ultraviolet
LSA
» Demand from Taiwan and China
» 2017 market share was approx. 40%
» Melt being qualified for production at 7nm & 5nm
EUV Photomask
» Strong interest from photomask industry
» LDD-IBD ready for EUV adoption
STT-MRAM
» Well positioned for MRAM ramp with multiple
engagements across 3 major customers
3D Inspection
» Evaluations in process with multiple customers in
their fabs
Applicable Technologies: MOCVD | Lithography | Wet Etch/Clean | Laser Anneal | Ion Beam | MBE | 3D Inspection | ALD
STT MRAM – Spin Transfer Torque Magnetic Random Access Memory
LDD-IBD – Low Defect Density Ion Beam Deposition

17 | Q4 2017 / FY 2017 Conference Call | Veeco Instruments Inc. © 2018
Scientific & Industrial
Applicable Technologies: MOCVD | Lithography | Wet Etch/Clean | Laser Anneal | Ion Beam | MBE | 3D Inspection | ALD
Good Momentum in Optical Coating Systems
» Strong Bookings in 2017
» Broad-based market demand including industrial
lasers, optical components for telecom, and R&D
Data Storage
» Good momentum with 60% bookings growth in 2017
Launched Lancer™ Ion Beam Etch System
» A reduced-footprint, R&D-focused, ion-beam etch
platform for emerging MEMS and magnetic-sensor
applications
Lancer Ion Beam Etch System
18 | Q4 2017 / FY 2017 Conference Call | Veeco Instruments Inc. © 2018
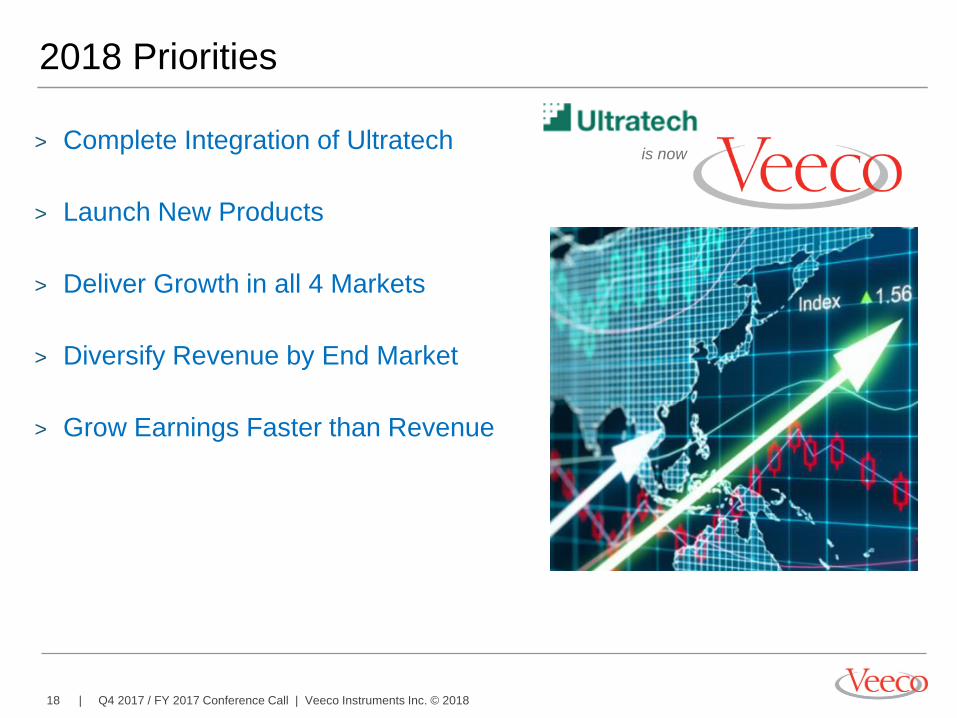
2018 Priorities
> Complete Integration of Ultratech
> Launch New Products
> Deliver Growth in all 4 Markets
> Diversify Revenue by End Market
> Grow Earnings Faster than Revenue
18
is now

19 | Q4 2017 / FY 2017 Conference Call | Veeco Instruments Inc. © 2018
Q&A
20 | Q4 2017 / FY 2017 Conference Call | Veeco Instruments Inc. © 2018
Back Up &
Reconciliation
Tables
21 | Q4 2017 / FY 2017 Conference Call | Veeco Instruments Inc. © 2018
Note on Reconciliation Tables
These tables include financial measures adjusted for the impact of certain items; these financial measures are
therefore not calculated in accordance with U.S. generally accepted accounting principles (“GAAP”). These Non-
GAAP financial measures exclude items such as: share-based compensation expense; charges relating to
restructuring initiatives; non-cash asset impairments; certain other non-operating gains and losses; and
acquisition-related items such as transaction costs, non-cash amortization of acquired intangible assets, and
incremental transaction-related compensation.
These Non-GAAP financial measures may be different from Non-GAAP financial measures used by other
companies. Non-GAAP financial measures should not be considered a substitute for, or superior to, measures of
financial performance prepared in accordance with GAAP. By excluding these items, Non-GAAP financial
measures are intended to facilitate meaningful comparisons to historical operating results, competitors' operating
results, and estimates made by securities analysts. Management is evaluated on key performance metrics
including Non-GAAP Operating Income, which is used to determine management incentive compensation as well
as to forecast future periods.
These Non-GAAP financial measures may be useful to investors in allowing for greater transparency of
supplemental information used by management in its financial and operational decision-making. In addition, similar
Non-GAAP financial measures have historically been reported to investors; the inclusion of comparable numbers
provides consistency in financial reporting. Investors are encouraged to review the reconciliation of the Non-GAAP
financial measures used in this news release to their most directly comparable GAAP financial measures.
22 | Q4 2017 / FY 2017 Conference Call | Veeco Instruments Inc. © 2018
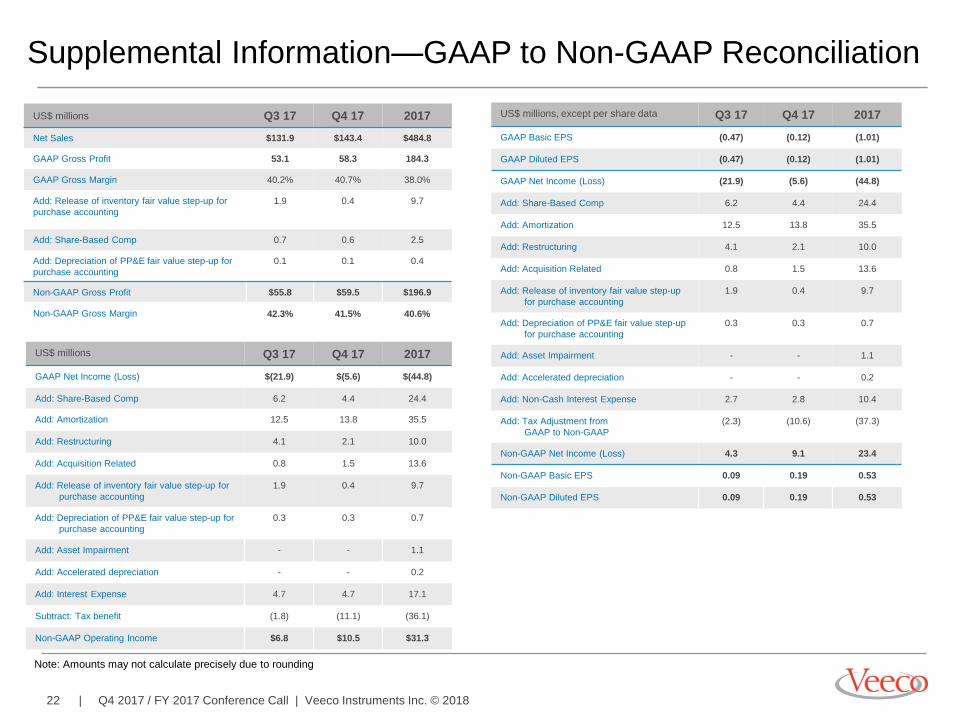
Supplemental Information—GAAP to Non-GAAP Reconciliation
Note: Amounts may not calculate precisely due to rounding
US$ millions Q3 17 Q4 17 2017
Net Sales $131.9 $143.4 $484.8
GAAP Gross Profit 53.1 58.3 184.3
GAAP Gross Margin 40.2% 40.7% 38.0%
Add: Release of inventory fair value step-up for
purchase accounting
1.9 0.4 9.7
Add: Share-Based Comp 0.7 0.6 2.5
Add: Depreciation of PP&E fair value step-up for
purchase accounting
0.1 0.1 0.4
Non-GAAP Gross Profit $55.8 $59.5 $196.9
Non-GAAP Gross Margin 42.3% 41.5% 40.6%
US$ millions, except per share data Q3 17 Q4 17 2017
GAAP Basic EPS (0.47) (0.12) (1.01)
GAAP Diluted EPS (0.47) (0.12) (1.01)
GAAP Net Income (Loss) (21.9) (5.6) (44.8)
Add: Share-Based Comp 6.2 4.4 24.4
Add: Amortization 12.5 13.8 35.5
Add: Restructuring 4.1 2.1 10.0
Add: Acquisition Related 0.8 1.5 13.6
Add: Release of inventory fair value step-up
for purchase accounting
1.9 0.4 9.7
Add: Depreciation of PP&E fair value step-up
for purchase accounting
0.3 0.3 0.7
Add: Asset Impairment - - 1.1
Add: Accelerated depreciation - - 0.2
Add: Non-Cash Interest Expense 2.7 2.8 10.4
Add: Tax Adjustment from
GAAP to Non-GAAP
(2.3) (10.6) (37.3)
Non-GAAP Net Income (Loss) 4.3 9.1 23.4
Non-GAAP Basic EPS 0.09 0.19 0.53
Non-GAAP Diluted EPS 0.09 0.19 0.53
US$ millions Q3 17 Q4 17 2017
GAAP Net Income (Loss) $(21.9) $(5.6) $(44.8)
Add: Share-Based Comp 6.2 4.4 24.4
Add: Amortization 12.5 13.8 35.5
Add: Restructuring 4.1 2.1 10.0
Add: Acquisition Related 0.8 1.5 13.6
Add: Release of inventory fair value step-up for
purchase accounting
1.9 0.4 9.7
Add: Depreciation of PP&E fair value step-up for
purchase accounting
0.3 0.3 0.7
Add: Asset Impairment - - 1.1
Add: Accelerated depreciation - - 0.2
Add: Interest Expense 4.7 4.7 17.1
Subtract: Tax benefit (1.8) (11.1) (36.1)
Non-GAAP Operating Income $6.8 $10.5 $31.3

23 | Q4 2017 / FY 2017 Conference Call | Veeco Instruments Inc. © 2018
Q4 2017 GAAP to Non-GAAP Reconciliation Non-GAAP Adjustments
In millions, except per share data GAAP
Share-Based
Compensation
Amortization Other Non-GAAP
Net Sales $143.4 $143.4
Gross Profit 58.3 0.6 0.5 59.5
Gross Margin 40.7% 41.5%
Research and Development 24.3 (1.0) 23.3
Selling, General, and Administrative and Other 28.5 (2.7) (0.2) 25.6
Net Income (Loss) $(5.6) 4.4 13.8 (3.5) $9.1
Income (Loss) Per Common Share:
Basic $(0.12) $0.19
Diluted (0.12) 0.19
Weighted Average Number of Shares:
Basic 47.0 47.1
Diluted 47.0 47.2
Other Non-GAAP Adjustments
Restructuring 2.1
Acquisition Related 1.5
Release of inventory fair value step-up associated with the
Ultratech purchase accounting 0.4
Depreciation of PP&E fair value step-up associated with the
Ultratech purchase accounting 0.3
Non-Cash Interest Expense 2.8
Non-GAAP Tax Adjustment (10.6)
Total Other (3.5)
Note: Amounts may not calculate precisely due to rounding
24 | Q4 2017 / FY 2017 Conference Call | Veeco Instruments Inc. © 2018
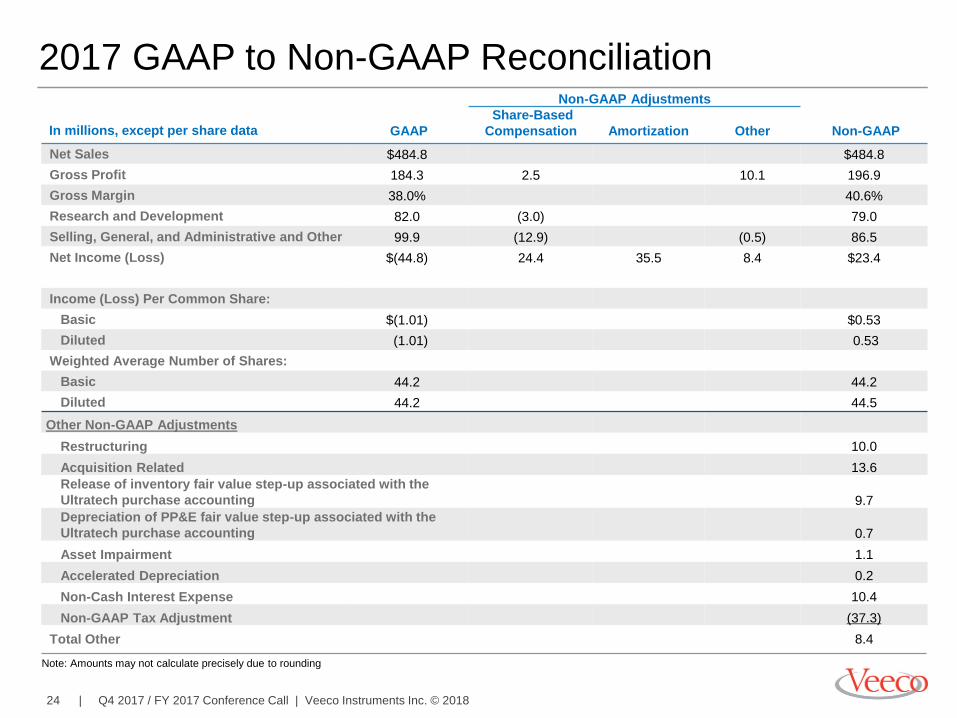
2017 GAAP to Non-GAAP Reconciliation Non-GAAP Adjustments
In millions, except per share data GAAP
Share-Based
Compensation
Amortization Other Non-GAAP
Net Sales $484.8 $484.8
Gross Profit 184.3 2.5 10.1 196.9
Gross Margin 38.0% 40.6%
Research and Development 82.0 (3.0) 79.0
Selling, General, and Administrative and Other 99.9 (12.9) (0.5) 86.5
Net Income (Loss) $(44.8) 24.4 35.5 8.4 $23.4
Income (Loss) Per Common Share:
Basic $(1.01) $0.53
Diluted (1.01) 0.53
Weighted Average Number of Shares:
Basic 44.2 44.2
Diluted 44.2 44.5
Other Non-GAAP Adjustments
Restructuring 10.0
Acquisition Related 13.6
Release of inventory fair value step-up associated with the
Ultratech purchase accounting 9.7
Depreciation of PP&E fair value step-up associated with the
Ultratech purchase accounting 0.7
Asset Impairment 1.1
Accelerated Depreciation 0.2
Non-Cash Interest Expense 10.4
Non-GAAP Tax Adjustment (37.3)
Total Other 8.4
Note: Amounts may not calculate precisely due to rounding
25 | Q4 2017 / FY 2017 Conference Call | Veeco Instruments Inc. © 2018
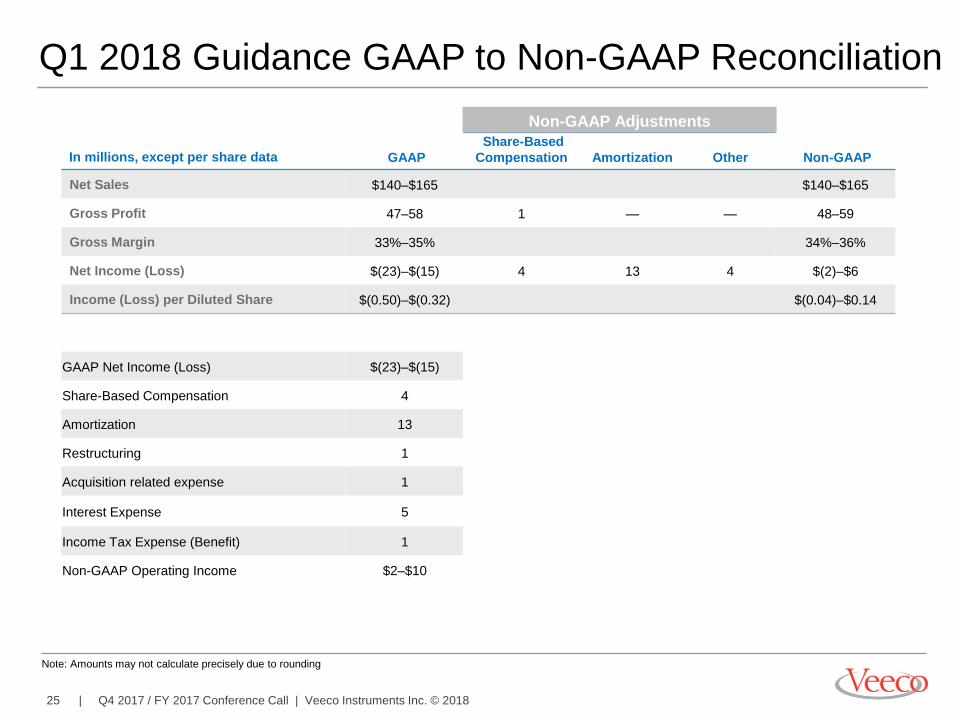
Q1 2018 Guidance GAAP to Non-GAAP Reconciliation
Non-GAAP Adjustments
In millions, except per share data GAAP
Share-Based
Compensation
Amortization Other Non-GAAP
Net Sales $140–$165 $140–$165
Gross Profit 47–58 1 — — 48–59
Gross Margin 33%–35% 34%–36%
Net Income (Loss) $(23)–$(15) 4 13 4 $(2)–$6
Income (Loss) per Diluted Share $(0.50)–$(0.32) $(0.04)–$0.14
GAAP Net Income (Loss) $(23)–$(15)
Share-Based Compensation 4
Amortization 13
Restructuring 1
Acquisition related expense 1
Interest Expense 5
Income Tax Expense (Benefit) 1
Non-GAAP Operating Income $2–$10
Non-GAAP Adjustments
Note: Amounts may not calculate precisely due to rounding