Q4 2010-11 Corporate and Analyst Presentation · 8 Slum Rehabilitation Projects as of 31 st March...
32
0
Transcript of Q4 2010-11 Corporate and Analyst Presentation · 8 Slum Rehabilitation Projects as of 31 st March...

0

1111
Company Overview
� HDIL Group
– HDIL listed on BSE/NSE in July 2007
– Over three Decades of expertise in the Real Estate Business
– Developed over 100 million sq. ft. area
� Company Profile
– A major player in Mumbai Realty with 90% land Reserves in the Mumbai Metropolitan Region (MMR)
– Total Land Reserves (including TDR) of *236.95 million sq. ft. (saleable area) as on 31st March, 2011
– Market Leader in Residential and SRA projects in the Mumbai Metropolitan Region (MMR)
– Currently executing the largest SRA project for rehabilitation of approx. 85,000 slum dwellers under expansion & modernization of Chhatrapati Shivaji International Airport, Mumbai
– Approx. 33,000 housing units under construction for MIAL Slum Rehabilitation Project
– Currently approx 92 million sq. ft. sale area of projects under construction
– 22 ongoing projects with a combination of Residential, Commercial & SRA
– Residential Portfolio of approx. 39 million sq.ft
– More than 13 million sq. ft. of Residential apartments sold
Strong track record of performance, consistent growth and profitabilityStrong track record of performance, consistent growth and profitability
* Company estimates
2
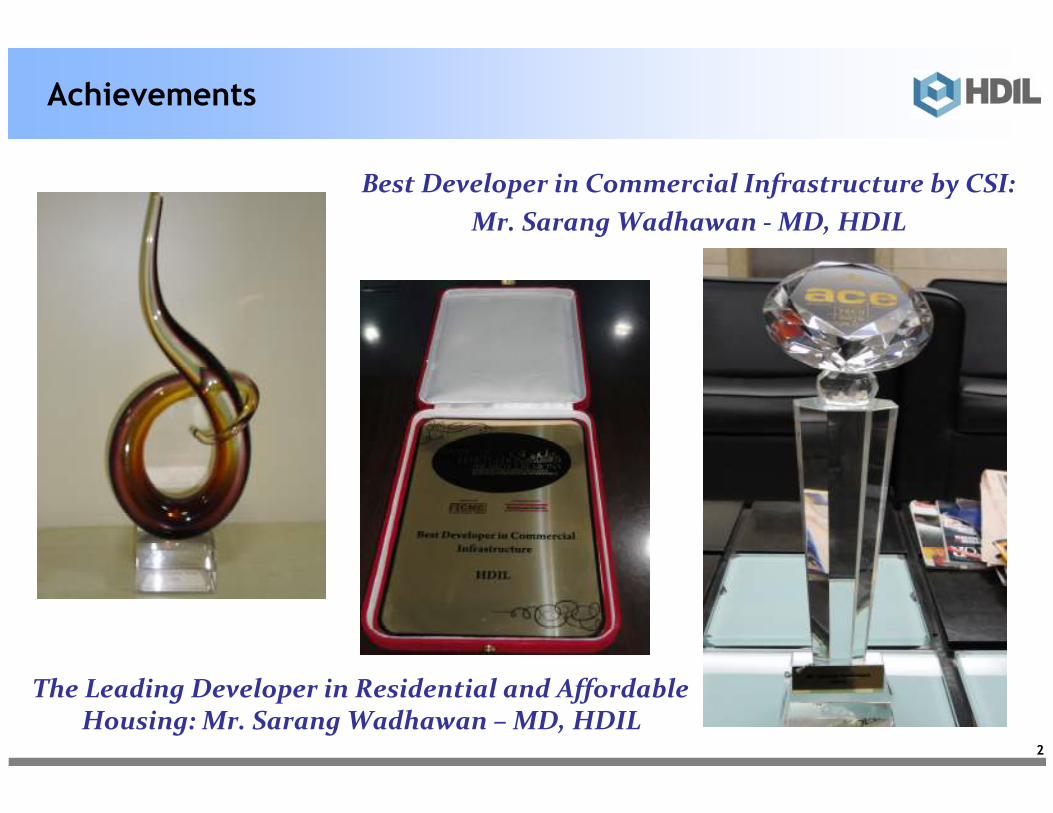
Achievements
Best Developer in Commercial Infrastructure by CSI:
Mr. Sarang Wadhawan - MD, HDIL
The Leading Developer in Residential and Affordable Housing: Mr. Sarang Wadhawan – MD, HDIL

333
Largest Player in Mumbai Metropolitan Region (MMR)
Ongoing Projects
Residential:
• Metropolis
• Harmony
• Ghatkopar
• Kurla Premier Phase I
• Kurla Premier Phase II
• Majestic Towers
• Whispering Towers- Phase I
• Whispering Towers- Phase II
• Galaxy Apartments
• Residency Park- Phase I
• Exotica
• Meadows Phase I
• Meadows Phase II
• Kharadi
• Daulat Nagar
• Ekta Nagar
• Paradise City
• Kochi
• Novinon Property (Shahad)
Commercial:
• Metropolis
• Kurla Premier
� Kalamsarry- Phase I
• HDIL Industrial Park
� Vasai-Virar belt (Part of Thane
district) Preferred residential
destination, well connected with rail
and road network
� Majority of Mumbai’s working
population resides in this region
� Potential business destination/
district
� HDIL is one of the largest land holders
in this area
� Vasai-Virar belt (Part of Thane
district) Preferred residential
destination, well connected with rail
and road network
� Majority of Mumbai’s working
population resides in this region
� Potential business destination/
district
� HDIL is one of the largest land holders
in this area
� Major potential for slum
rehabilitation and redevelopment
� Major investment in infrastructure in
the region
� Phase I of the MIAL project nearing
completion
� Major potential for slum
rehabilitation and redevelopment
� Major investment in infrastructure in
the region
� Phase I of the MIAL project nearing
completion
� Old business district of Mumbai
� Exploring potential options in South
Mumbai
� Old business district of Mumbai
� Exploring potential options in South
Mumbai
BKC
Churchgate
Virar
Bandra
Churchgate
to Vitar(52 kms)
Bandra
to Vitar(30 kms)
Total Land in MMR >200 million sq. ft.Total Land in MMR >200 million sq. ft.

444
Diversified Project Mix
22 Ongoing Projects aggregating 91.53 million sq. ft.22 Ongoing Projects aggregating 91.53 million sq. ft.
Segment wise Project Breakup
Ongoing Projects (Saleable Area)
39.03 mn38.78 mn
7.97 mn
SRS/Redevelopment- 6%
5.76 mn
TDR (MIAL Project)* 43%
Commercial and Retail- 9%
Residential- 42%
* Includes proposed TDR for Phase III
5
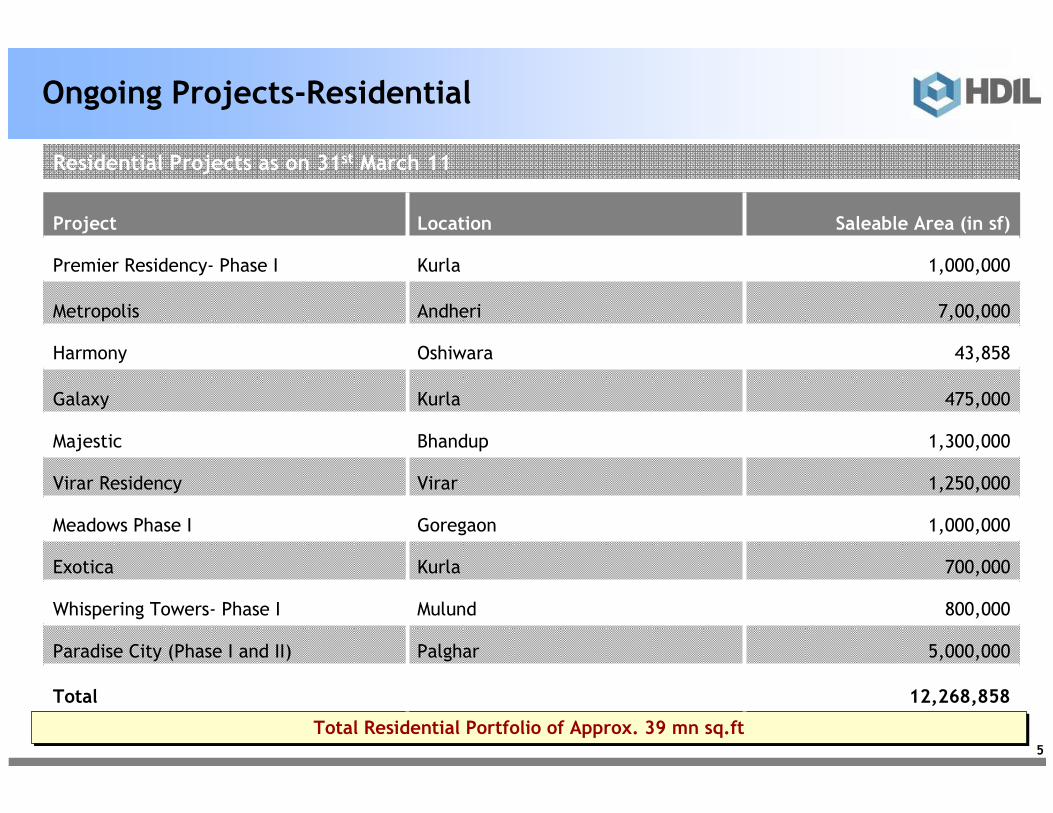
Ongoing Projects-Residential
Total Residential Portfolio of Approx. 39 mn sq.ftTotal Residential Portfolio of Approx. 39 mn sq.ft
1,250,000VirarVirar Residency
1,000,000GoregaonMeadows Phase I
700,000KurlaExotica
800,000MulundWhispering Towers- Phase I
5,000,000PalgharParadise City (Phase I and II)
Total
Majestic
Galaxy
Harmony
Metropolis
Premier Residency- Phase I
Project
Bhandup
Kurla
Oshiwara
Andheri
Kurla
Location
12,268,858
1,300,000
475,000
43,858
7,00,000
1,000,000
Saleable Area (in sf)
Residential Projects as on 31st March 11
6
Forthcoming Projects-Residential
26,506,186
6,797,089
5,000,000
400,000
6,299,640
509,457
800,000
800,000
3,600,000
800,000
1,500,000
Saleable Area (in sf)
Sales to be launchedPalgharParadise City (Phase III)
Total
Novinon Property (Shahad)
Kharadi
Kochi
Ghatkopar
Premier Residency- Phase II
Daulat Nagar
Meadows- Phase II
Whispering Towers- Phase II
Ekta Nagar
Project
MMR
Pune
Kochi
Ghatkopar
Kurla
Santacruz
Goregaon
Mulund
Kandivali
Location
Site preparation and
infrastructure work in progress
Construction started
Land Aggregation and site
infrastructure in progress
Planning and Approval stage,
Sales to be launched
Planning and Approval stage,
Sales to be launched
Rehabilitation in progress,
sales to be launched
MHADA Redevelopment in
progress, sales to be launched
Rehabilitation in progress,
sales launched in the month of
April, 2011
Rehabilitation in progress,
sales to be launched
Status
Total Residential Portfolio of Approx. 39 mn sq.ftTotal Residential Portfolio of Approx. 39 mn sq.ft

7
Commercial and Retail Projects as of 31st March 11
Ongoing Projects- Commercial and Retail
2,500,000KochiKalamsarry-I.T SEZ (Phase I)***
349,456OshiwaraHarmony*
1,500,000VirarHDIL Industrial Park**
400,000MulundWhispering Towers**
2,000,000KurlaKurla Premier*
7,969,456Total
1,220,000Andheri (West)Metropolis*
Saleable/Lease Area (in sf)LocationProject
* Pre-leasing commenced
** Sale Model
*** Construction Commenced
8
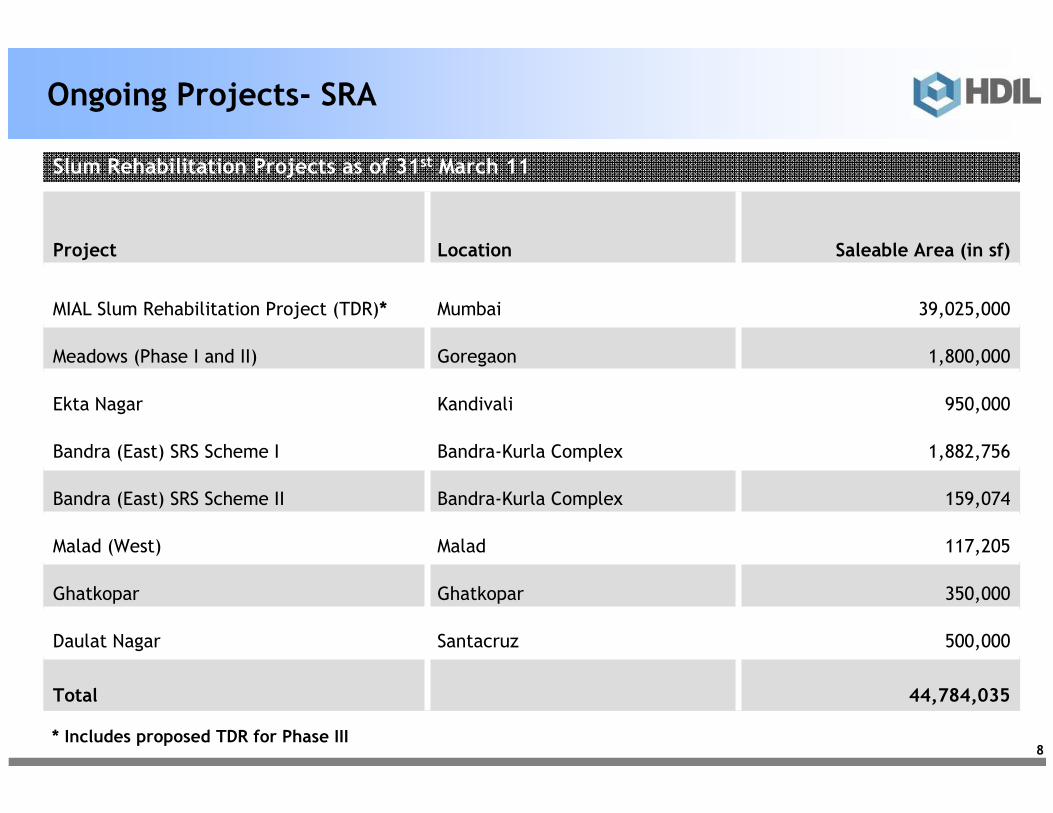
Slum Rehabilitation Projects as of 31st March 11
Ongoing Projects- SRA
950,000KandivaliEkta Nagar
1,800,000GoregaonMeadows (Phase I and II)
39,025,000MumbaiMIAL Slum Rehabilitation Project (TDR)*
44,784,035Total
500,000SantacruzDaulat Nagar
350,000GhatkoparGhatkopar
117,205MaladMalad (West)
159,074Bandra-Kurla Complex Bandra (East) SRS Scheme II
1,882,756Bandra-Kurla Complex Bandra (East) SRS Scheme I
Saleable Area (in sf)LocationProject
* Includes proposed TDR for Phase III

9
Construction Area- Ongoing Projects
SRA/TDR*
20.76 mn
Commercial/
Retail
9.29 mn
Residential
13.92 mn
Total Construction Area- 43.97 million sq.ftTotal Construction Area- 43.97 million sq.ft
21%
32%
47%
* Includes Phase I and II- 33,000 units

1010
Residential Projects- Construction UpdateResidential Projects- Construction Update
Metropolis Meadows

11
Premiere Residencies- Kurla (W)
Week 4, March 11
Galaxy Apartments- Kurla (E)
Construction Update- Residential Projects
Metropolis Residencies- Andheri (W) Majestic Towers- Nahur (W)

12
Construction Update- Residential Projects
Harmony- Oshiwara Residency Park- Virar (W)
Meadows- Goregaon (W) Whispering Towers (Phase I)-Mulund (W)
Week 4, March 11

13
Construction Update- Residential Projects
Paradise City (Phase I and II)- Palghar (W)
Week 4, March 11

1414
Commercial Projects- Construction UpdateCommercial Projects- Construction Update
Harmony Metropolis
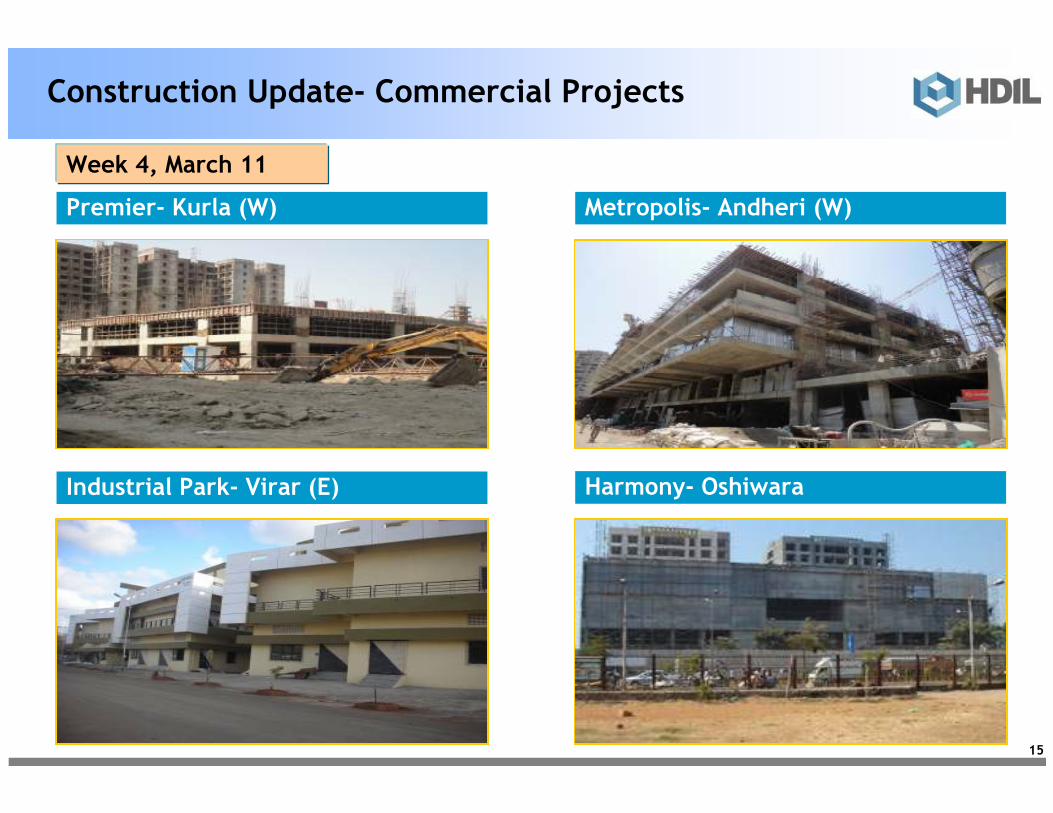
15
Construction Update- Commercial Projects
Week 4, March 11
Premier- Kurla (W) Metropolis- Andheri (W)
Industrial Park- Virar (E) Harmony- Oshiwara

161616
24
23
12
11 10
9
13
8
7
6
1
27
26
30
29
28
25
32
5
4
22
3
2
31
14
15
20
17
18
19
16
21
31A
PRIORITY 1
PRIORITY 2
PRIORITY 2A
PRIORITY 3
� Largest Urban Rehabilitation
Scheme in India
� Rehabilitation > 1 million
people
� No. of Hutments – 85,000
approx.
� Scale similar to Town Planning
& Urban Renewal Scheme
� Vital Public Infrastructure
Project.
� Approved FSI of 4
� Airport Modernization &
Expansion
� Provide World Class
Infrastructure
� Generation of more than
10,000 jobs over next few
years
MIAL Rehabilitation Project: Uplifting face of Mumbai
HIGHLIGHTS
MIAL Project would help in uplifting the face of MumbaiMIAL Project would help in uplifting the face of Mumbai
17
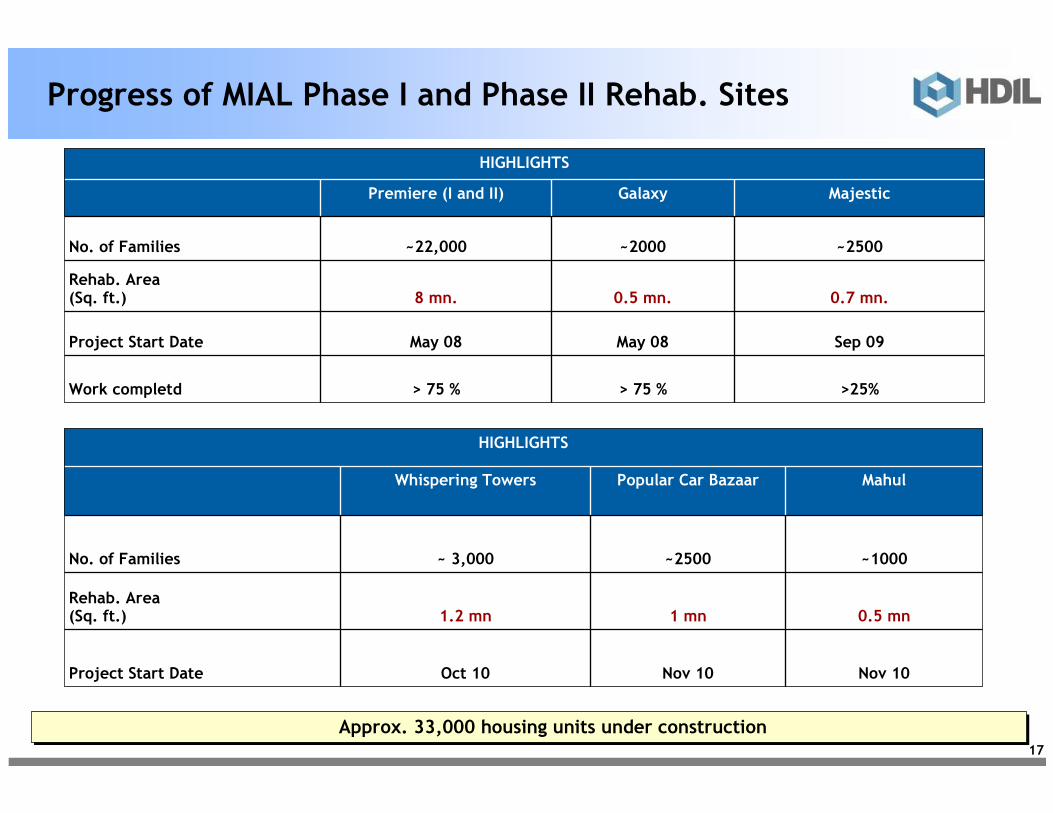
Progress of MIAL Phase I and Phase II Rehab. Sites
HIGHLIGHTS
Whispering Towers Popular Car Bazaar Mahul
No. of Families ~ 3,000 ~2500 ~1000
Rehab. Area (Sq. ft.) 1.2 mn 1 mn 0.5 mn
Project Start Date Oct 10 Nov 10 Nov 10
HIGHLIGHTS
Premiere (I and II) Galaxy Majestic
No. of Families ~22,000 ~2000 ~2500
Rehab. Area (Sq. ft.) 8 mn. 0.5 mn. 0.7 mn.
Project Start Date May 08 May 08 Sep 09
Work completd > 75 % > 75 % >25%
Approx. 33,000 housing units under constructionApprox. 33,000 housing units under construction
1818
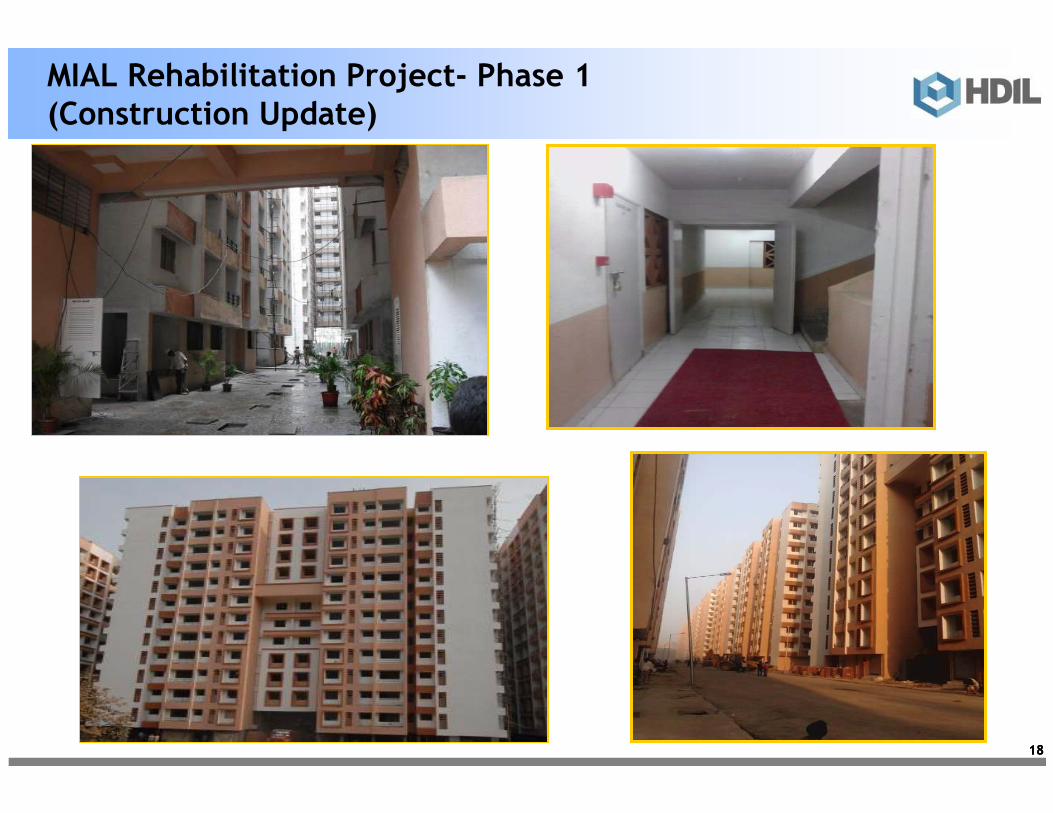
MIAL Rehabilitation Project- Phase 1 (Construction Update)

1919
Virar Rental Housing Project
19
Executing Largest Rental Housing Scheme in Mumbai Metropolitan Region since 1947 with MMRDA Executing Largest Rental Housing Scheme in Mumbai Metropolitan Region since 1947 with MMRDA
HIGHLIGHTS
� Largest Rental Housing Scheme
in MMR since 1947
� Development of 525 acres
aggregating to 56 million sq. ft.
of built up area - FSI of 4
� Completion in 4 phases by 2015
� Approx. 40,000 rental units of
160 sq. ft. carpet area
aggregating to 13 million sq. ft.
of built up area to be given to
MMRDA free of cost
� HDIL to generate 50 million sq.
ft. of saleable area
� Revenue visibility from sale of
FSI as well as constructed area
� Development of 4 million sq. ft.
of Social Infrastructure
� Environment Management Plan
RENTAL HOUSING SECTORRENTAL HOUSING SECTOR
FREE SALE HOUSING SECTORFREE SALE HOUSING SECTOR

20
Investment in Hospitality ProjectsInvestment in Hospitality Projects

21
Hospitality Project- Juhu, Mumbai
� Operator- Hilton
� Brand- Conrad
� Management Agreement signed with
Hilton hotels for 20 years
� Hotel Description-
– 5 star
– Approx. 240 rooms
– One All day dining
– Three Specialty restaurants
– Night Club
– Executive lounge, Lounge Bar
– Pool
– Retail segment
– Spa and Fitness, Banquet and Conference
� Project Completion Deadline- 2014
HDIL owns 45% stake in the Hospitality Business HDIL owns 45% stake in the Hospitality Business
Proposed Elevation
Current View

22
Hospitality Project- Andheri, Mumbai
� Operator- Intercontinental Hotel Group
� Brand- Crown Plaza
� Business/ Leisure Hotel
� Hotel Description-
– 5 star
– Approx. 200 rooms
– One All day dining
– Three Specialty restaurants
– Night Club
– Executive lounge, Lounge Bar
– Pool
– Retail segment
– Spa and Fitness, Banquet and Conference
� Project Completion Deadline- 2013
HDIL owns 100% stake in the project (part of Metropolis Commercial project)
Current View
Proposed Elevation
232323
Financial OverviewFinancial Overview

24
Housing Development and Infrastructure Limited
Financial Performance/ Ratios
*** Standalone
Cash as on 31/03/2011- 226 crores
Net Debt- Rs. 3969.39 crores
Net Debt/Equity- 0.42
Rs. in crores
31/03/2011 31/03/2010 31/03/2011 31/03/2010 3/31/2011 3/31/2010
Turnover (Net) 523.71 434.07 20.65% 1,802.62 1,491.99 20.82% 1,849.99 1,502.12 23.16%
Other Income 23.89 30.39 120.10 107.59 49.88 34.51
Total Income 547.60 464.46 17.90% 1,922.72 1,599.58 20.20% 1,899.87 1,536.63 23.64%
PBT&E 259.19 230.85 12.27% 1,054.03 735.28 43.35% 985.95 705.19 39.81%
PBT % to income 47.33% 49.70% 54.82% 45.97% 51.90% 45.89%
EBIDTA 279.49 257.71 8.45% 1,143.09 820.15 39.38% 1,153.33 824.56 39.87%
EBIDTA % to income 51.04% 55.49% 59.45% 51.27% 60.71% 53.66%
PAT 197.32 183.47 7.55% 896.41 602.30 48.83% 822.34 572.23 43.71%
PAT % to income 36.03% 39.50% 46.62% 37.65% 43.28% 37.24%
Net worth 9637.08 7,117.74 9,637.08 7,117.74 9,489.48 7,042.87 34.74%
Debt 4195.39 4,051.72 4,195.39 4,051.72 4,319.79 4,101.72 5.32%
Debt Equity ratio 0.44 0.57 0.44 0.57 0.46 0.58
EPS -Basic 4.75 5.14 22.88 18.23 21.04 17.35
- Diluted 4.65 4.98 22.48 17.81 20.67 16.95
Inventories 10,086.48 8,033.66 10,086.48 8,033.66 11,415.24 8,756.65 30.36%
ParticularsGrowth % Growth %
Audited standalone
Quarter ended Year Ended
Consolidated
Growth %Year ended
*** Consolidated
Cash as on 31/03/2011- 229.69
Net Debt- Rs. 4090.1 crores
Net Debt/Equity- 0.43

25
Standalone Balance Sheet as at
Housing Development and Infrastructure Limited
Sch edu le s
SO UR CE S O F FU N D SSha reho lde r s' f und s
Sh a re c ap ita l A 4 ,150 ,0 39 ,8 60 3 ,58 8 ,4 26 ,7 60
R ese rv e s an d su rp lu s B 89 ,628 ,8 44 ,8 29 6 6 ,80 9 ,0 08 ,3 78
Sh a re w a r r an t 2 ,59 2 ,0 00 ,0 00 9 6 ,3 7 0 ,8 84 ,6 89 7 8 0 ,0 00 ,0 00 7 1 ,1 7 7 ,4 35 ,138
Lo an fund s C
Se cur e d lo an s 41 ,953 ,9 43 ,1 68 4 0 ,51 7 ,1 69 ,4 30
U n se cu r e d lo an s - 4 1 ,9 5 3 ,9 43 ,1 68 - 4 0 ,5 1 7 ,1 69 ,430
Defer r ed ta x liab ility (N e t) D 65 ,6 94 ,2 58 5 3 ,3 3 1 ,8 45
To ta l 1 38 ,3 90 ,5 22 ,1 15 1 1 1 ,7 47 ,9 36 ,413
A PP LICA T IO N O F F UN D S
Fixe d a sse ts E
G ro ss b lo ck 1 ,883 ,9 40 ,6 92 1 ,90 5 ,3 07 ,8 62
1 0 6 ,7 76 ,8 99 9 8 ,3 0 7 ,0 30
Ne t b lo ck 1 ,777 ,1 63 ,7 93 1 ,80 7 ,0 00 ,8 32
C ap i ta l w o rk-in -p rog r es s 910 ,7 37 ,0 03 2 ,6 8 7 ,9 00 ,7 96 2 2 ,8 0 3 ,8 33 1 ,8 2 9 ,8 04 ,665
In ves tm en ts F 7 ,8 59 ,5 25 ,6 73 5 ,9 6 4 ,7 63 ,586
Cur ren t a ss e ts, lo ans an d adv anc e sIn ve n to ri e s G 100 ,8 64 ,8 31 ,5 41 8 0 ,33 6 ,6 24 ,0 06 Sundry de bto r s H 3 ,428 ,4 82 ,9 90 2 ,00 7 ,1 75 ,9 38 C a sh an d b an k ba l an ce s I 2 ,260 ,0 73 ,5 38 7 ,87 3 ,8 79 ,1 47 O th e r c u r r en t a sse t J 25 ,5 27 ,9 34 2 7 ,9 0 7 ,2 83 Loan s an d adv an ce s K 41 ,411 ,6 71 ,3 14 2 2 ,05 3 ,1 63 ,2 67
1 4 7 ,9 90 ,5 87 ,3 17 1 1 2 ,298 ,7 49 ,6 41 Less : C ur r en t liab ilitie s an d p ro vis ion sCur re n t lia b i li ti e s L 18 ,768 ,3 58 ,5 49 8 ,02 2 ,7 47 ,7 81 P rov is i o n s M 1 ,379 ,1 33 ,1 22 3 2 2 ,6 33 ,6 98
2 0 ,14 7 ,4 91 ,6 71 8 ,34 5 ,3 81 ,4 79 Net c u r ren t a sse ts 127 ,8 43 ,0 95 ,6 46 1 0 3 ,9 53 ,3 68 ,162
138 ,3 90 ,5 22 ,1 15 1 1 1 ,7 47 ,9 36 ,413
Le ss : A cc umu la te d de pre ci a t io n
(A mo u nt in `)
(A u d ited )
31 -M ar -2 011
(Am o un t in `)
3 1 -M ar -2 010
(Aud ited )

26
Standalone Profit and Loss Statement as on
Housing Development and Infrastructure Limited
Quarter ended Quarter ended Year ended Year endedSchedules 31-Mar-2011 31-Mar-2010 31-Mar-2011 31-Mar-2010
(Audited) (Audited) (Audited) (Audited)(Amount in `) (Amount in )̀ (Amount in `) (Amount in `)
INCOME
Turnover N 5,237,055,777 4,340,723,892 18,026,262,763 14,919,917,617 Other income O 239,156,224 303,881,541 1,201,332,928 1,075,907,120
5,476,212,001 4,644,605,433 19,227,595,691 15,995,824,737 EXPENDITURE
Variation in stock in trade P 279,208,292 251,423,369 (198,431,369) (391,507,225)
Variation in work-in-progress Q (2,313,942,299) (5,010,589,138) (23,953,382,490) (15,528,157,615)
Transfer to Investment / Fixed assets (831,325,002) (193,478,550) (1,052,469,136) (690,716,779)
R 3,987,894,847 5,572,842,015 26,955,957,613 19,147,668,693
Project specific interest S 1,284,445,795 1,176,116,191 4,961,500,530 4,366,496,459
Employees' remuneration and welfare expenses T 106,838,006 78,173,524 417,294,716 260,281,700 Administrative expenses U 167,765,520 192,157,022 620,918,745 630,136,229 Interest S 180,863,709 247,926,112 818,130,073 797,753,322 Depreciation / Amortisation 22,256,144 21,485,839 72,491,814 51,028,438 Share of loss from partnership firm 303,691 - 303,691 -
2,884,308,703 2,336,056,384 8,642,314,187 8,642,983,222 Operating Profit before exceptional items 47% 2,591,903,298 2,308,549,049 10,585,281,504 7,352,841,515 Less: Exceptional items - - 44,957,074 - Operating Profit after exceptional items before Tax 2,591,903,298 2,308,549,049 10,540,324,430 7,352,841,515 Less :Provision for tax 612,000,000 459,800,000 1,563,100,000 1,300,000,000 Less:-Provision for wealth tax 158,675 224,351 711,200 568,471 Less :Deferred tax liability /(asset) 6,474,310 13,807,021 12,362,413 29,316,652 Operating Profit after Tax 36% 1,973,270,313 1,834,717,677 8,964,150,817 6,022,956,392
Balance brought forward from previous year / quarter 12,829,617,520 7,767,474,901 5,829,241,346 6,054,236,187
- (56,351,232) 9,495,670 (56,351,232)
Profit available for appropriation 14,802,887,833 9,545,841,346 14,802,887,833 12,020,841,346 Appropriations :Less : Transferred to General Reserve 5,829,241,346 - 5,829,241,346 -
Less : Transferred to Debenture Redemption Reserve 4,333,400,000 3,716,600,000 4,333,400,000 6,191,600,000
Profit Carried to Balance Sheet 4,640,246,487 5,829,241,346 4,640,246,487 5,829,241,346
Earnings per share - Basic (Amount in `) 4.75 5.14 22.88 18.23
- Diluted (Amount in ̀ ) 4.65 4.98 22.48 17.81
Cost of construction, Land and development expenses
Add/ Less :Excess/ (Short) Provision for taxation no longer required

27
Housing Development and Infrastructure LimitedStandalone Cash Flow Statement for the period ended
A C a s h f lo w f r o m o p e r a t i n g a c ti v i t ie sN e t p r o f i t b e f o r e t a x 2 , 5 9 1 , 9 0 3 ,2 9 8 A d j u s tm e n t s f o r :
(1 ) D e p r e c i a t io n 2 2 , 2 5 6 ,1 4 4 (2 ) I n te r e s t e x p e n s e s 1 8 0 , 8 6 3 ,7 0 9 (3 ) P r o fi t o n s a l e o f u n i t s o f m u t u a l f u n d s ( 6 ,7 1 9 ) (4 ) I n te r e s t r e c e iv e d ( 1 9 4 , 5 1 5 ,0 9 8 ) (5 ) D iv i d e n d r e c e i v e d - (6 ) L o s s o n sa le o f in v e st m e n ts - (7 ) L o s s b y f i r e - (8 ) L o s s o n sa le o f fix e d a s s e t s ( 4 1 ,4 9 2 ) 8 , 5 5 6 ,5 4 4 O p e ra t in g p ro f i t b e f o re w o rk in g c a p i t a l c h a n g e s 2 , 6 0 0 , 4 5 9 ,8 4 2 M o v e m e n t s in w o rk in g c a p i t a l :
D e c r e a s e / (I n c r e a s e ) in i n v e n t o r y 1 , 5 8 8 , 8 7 2 ,3 1 7 D e c r e a s e / (I n c r e a s e ) in s u n d ry d e b t o r s 4 9 7 , 8 0 0 ,6 6 0 D e c r e a s e / (I n c r e a s e ) in o t h e r r e c e iv a b le s (6 , 1 5 2 , 2 3 1 ,8 4 8 ) ( D e c r e a s e ) / I n c r e a s e in t r a d e a n d o t h e r p a y a b l e s 2 , 0 4 8 , 6 1 6 ,6 5 7
N e t m o v e m e n t i n w o rk in g c a p i ta l (2 , 0 1 6 , 9 4 2 ,2 1 4 ) C a s h g e n e ra te d f ro m o p e r a t io n s 5 8 3 , 5 1 7 ,6 2 8 L e ss : D ir e c t ta x e s p a i d ( n e t o f r e f u n d s) * 1 9 , 2 9 0 ,1 7 1 N e t c a s h f ro m o p e r a t i n g a c ti v i t ie s 5 6 4 , 2 2 7 ,4 5 7
B C a s h f lo w s f r o m i n v e s t in g a c t i v i ti e s(1 ) ( I n c r e a s e ) / D e c re a s e in c a p i ta l w o rk i n p r o g r e s s ( 8 7 9 , 4 9 7 ,6 3 2 ) (2 ) ( I n c r e a s e ) / D e c re a s e in i n v e st m e n t s ( n e t ) 4 2 1 , 0 5 8 ,1 5 0 (3 ) I n te r e s t r e c e iv e d 1 9 4 , 5 1 5 ,0 9 8 (4 ) D iv i d e n d r e c e i v e d - (5 ) P u rc h a s e o f f ix e d a s s e ts (7 1 , 4 1 3 ,7 4 9 ) (6 ) P r o fi t o n s a l e o f u n i t s o f m u t u a l f u n d s 6 ,7 1 9 (7 ) S a le o f fix e d a s s e t s 6 4 ,9 5 0 N e t c a s h f ro m i n v e s t in g a c ti v i t ie s ( 3 3 5 , 2 6 6 ,4 6 4 )
C C a s h f lo w s f r o m f i n an c i n g a c ti v i t ie s
(1 ) P r o ce e d s f ro m b o r ro w in g s 3 , 6 5 1 , 4 2 3 ,9 1 6 (2 ) R e p a y m e n t o f b o r r o w in g s (3 , 1 2 0 , 5 1 3 ,3 7 0 ) (3 ) P r o ce e d s f ro m sh a r e w a r r a n t s 1 1 8 , 6 0 0 ,0 0 0
(4 ) I n c re a se i n s h a re c a p i t a l i n c lu d in g s h a re p rem iu m -
(5 ) S h a r e is su e e x p e n s e s -
(6 ) I n te r e s t p a i d ( 1 8 0 , 8 6 3 ,7 0 9 ) N e t c a s h u s e d i n f i n a n ci n g a c t i v i ti e s 4 6 8 , 6 4 6 ,8 3 7 N e t i n c r e a s e in c a sh a n d c a sh e q u iv a le n ts (A + B + C ) 6 9 7 , 6 0 7 ,8 3 0 C a s h a n d c a sh e q u iv a le n ts a t th e b e g i n n in g o f th e y e a r / p e r i o d 1 , 5 6 2 , 4 6 5 ,7 0 8
C a s h a n d c a sh e q u iv a le n ts a t th e e n d o f th e y e a r/ p e r io d 2 , 2 6 0 , 0 7 3 ,5 3 8
( A u d i te d )3 1 -M a r- 2 0 1 1
Q u a r t e r e n d e d
( A m o u n t in ` )

282828
Annexure 1: SRSAnnexure 1: SRS

292929
Slum Rehabilitation Scheme
Source: Slum Rehabilitation Authority
70% of dwellers from Co-
Op. Hsg. Soc.
Appt. of Chief Promoter/
Opening of bank account
Docs (land title etc.)
collected/ Plot measured/
Structures Demarcated
Structure survey & no./
Table of house no. prepared
Developer appointed/
Developer appoints
architects, surveyor,
engineer, etc.
Developer enters into
individual agreements with
dwellers
Proposal with plans,
annexures & documents
submitted to SRA
Initial Stage
Scrutiny by sub engineer/
Scrutiny fee calculated
Scrutiny fee paid by
developer
Annexure II submitted for
certification/ Annexure III
submitted to finance dept.
Annexure I scrutinised by
engg. dept.
Second Stage
Lots of allotment of
tenements to participating
members/ subsequently for
non-participants
Developers arrange for
transit accommodation,
either on-site or off-site
Draw lots for allotment of
transit tenements
Slum dwelleres shifted to
transit camps & hutments
demolished/ non-
participants issued notices
If non-participants do not
agree within 15 days, they
are physically evicted from
slum site
All structures demolished
and work up to plinth level is
completed
After verifying plinth
dimensions, SRA grants
permission to construct
beyond plinth level
Third Stage
Lists of allottees prepared /
allotment of tenements is
made in joint name
Rehabilitation buildings
completed
Building permissions for free
sale buildings given in
proportion to rehabilitation
buildings
Plans for further
rehabilitation & free sale
buildings approved
SRA issues identity cards to
slum dwellers
Building & compliance with
IoA conditions verified/
Occupation permitted/
Possession as per allotment
Building Completion
Certificate submitted by
architect
Fourth Stage
Annexure II & III certified by
respective authorities
LoI, layout, IoA, CC issued
Fifth Stage
Separate property cards for
rehabilitation plot, free sale
plot & reservation plots
prepared
Further building
permissions/ Occupation
permissions granted in due
course
Construction of remaining
buildings commenced

303030
Disclaimer
This investor presentation has been prepared by Housing Development and Infrastructure Ltd (“HDIL”). and does not constitute a
prospectus or placement memorandum or an offer to acquire any securities. This presentation or any other documentation or
information (or any part thereof) delivered or supplied should not be deemed to constitute an offer.
No representation or warranty, express or implied is made as to, and no reliance should be placed on, the fairness, accuracy,
completeness or correctness of such information or opinions contained herein. The information contained in this presentation is only
current as of its date. Certain statements made in this presentation may not be based on historical information or facts and may be
“forward looking statements”, including those relating to the general business plans and strategy of HDIL, its future financial
condition and growth prospects, future developments in its industry and its competitive and regulatory environment, and statements
which contain words or phrases such as ‘will’, ‘expected to’, ‘horizons of growth’, ‘strong growth prospects’, etc., or similar
expressions or variations of such expressions. These forward-looking statements involve a number of risks, uncertainties and other
factors that could cause actual results, opportunities and growth potential to differ materially from those suggested by the forward-
looking statements. These risks and uncertainties include, but are not limited to risks with respect to its real estate business, SEZ
business and its infrastructure business.
HDIL may alter, modify or otherwise change in any manner the content of this presentation, without obligation to notify any person of
such revision or changes. This presentation cannot be copied and disseminated in any manner.
No person is authorized to give any information or to make any representation not contained in and not consistent with this
presentation and, if given or made, such information or representation must not be relied upon as having been authorized by or on
behalf of HDIL. This presentation is strictly confidential.

31
Thank You