Q3 presentation 20 October Final utan speaker notes · • Lower marketing spend in Latvia ... •...
15
1 JOHAN DENNELIND, PRESIDENT & CEO INTERIM REPORT JANUARY – SEPTEMBER 2016 Q3 Q3 SLOWDOWN IN LINE WITH PROJECTIONS - CONTINUING OPERATIONS 2 SERVICE REVENUE GROWTH EBITDA* GROWTH FREE CASH FLOW Reported -0.7 Organic -1.1 Reported -1.5 Organic -1.6 SEK 3.3 billion *Excluding non-recurring items Reported -0.9 Organic -0.7 Reported +3.9 Organic +4.2 SEK 7.1 billion Q3 2016 9M 2016
Transcript of Q3 presentation 20 October Final utan speaker notes · • Lower marketing spend in Latvia ... •...

1
JOHAN DENNELIND, PRESIDENT & CEO
INTERIM REPORT JANUARY – SEPTEMBER 2016 Q3
Q3 SLOWDOWN IN LINE WITH PROJECTIONS - CONTINUING OPERATIONS
2
S E R V I C E R E V E N U E G R O W T H
E B I T D A * G R O W T H
F R E E C A S H F L O W
Reported -0.7Organic -1.1
Reported -1.5 Organic -1.6
SEK 3.3 billion
*Excluding non-recurring items
Reported -0.9Organic -0.7
Reported +3.9 Organic +4.2
SEK 7.1 billion
Q3 2016 9M 2016

2
THIRD QUARTER IN BRIEF
3
Proposed settlement
amount received from U.S. and
Dutch authorities related to entry in Uzbekistan
Core business on track
TV proposition strengthened
Focus on value loading offerings
Rebalancing continues - focus
on Nordics & Baltics
Full Eurasia exit demands more
time
Full year guidance reiterated
SETTLEMENT PROPOSAL RECEIVED FROM AUTHORITIES
4
• Global resolution (US & Dutch authorities) with proposed settlement of USD 1.45 billion
• Related to Telia Company’s entry into Uzbekistan in 2007
• Provision made in accordance with the proposed settlement amount
• Telia Company in discussions with authorities

3
ACTIVE SUSTAINABILITY AGENDA
5
NEW “CODE OF RESPONSIBLE BUSINESS
CONDUCT”
AVAILABLE AT TELIACOMPANY.COM
“SUSTAINABILITY UPDATE” REPORT RELEASED
AVAILABLE AT
TELIACOMPANY.COM
“ACCELERATING SUSTAINABLE GROWTH” REPORT RELEASED
AVAILABLE AT
TELIACOMPANY.COM
“LAW ENFORCEMENT DISCLOSURE” REPORT RELEASED
AVAILABLE AT
TELIACOMPANY.COM
“HUMAN RIGHTS IMPACT ASSESSMENT” REPORT RELEASED
AVAILABLE AT
TELIACOMPANY.COM
RECENTLY DIVESTED ASSETS
DIVESTMENTS ONGOING
6
• Divested to Aga Khan Fund for Economic Development. Closing estimated before year-end
REMAINING EURASIAN ASSETS
• Exploring divestment of Fintur Holdings together with the minority owner Turkcell
• More time needed to fully exit region Eurasia
• Divested to Axiata. Transaction closed in Q2
• Divested to MÁSMÓVIL. Completed on October 5
• Divested to Marginalen. Closing estimated before year-end

4
SERVICE REVENUESOrganic growth, external service revenues
Q3 15 Q4 15 Q1 16 Q2 16 Q3 16
Sweden Europe Continuing operations
-1.6%-1.6%
-1.1%-1.1%
+0.8%+0.8%
-4.0%
1.3%
-1.6%
Q315
Q316
Q315
Q316
Q315
Q316
CORE BUSINESS ON TRACK
7
EBITDAOrganic growth, excluding non-recurring items
• Less support from fiber revenues and a negative B2B segment in Sweden
• Stable growth in Europe as mobile service revenues offset pressure on fixed
• EBITDA erosion in Sweden from service revenue decline
• Europe benefits from service revenue growth and overall solid cost control
Continuing
operationsEuropeSweden
Q3 15 Q4 15 Q1 16 Q2 16 Q3 16
Telia passed, not connectedCommunication operatorTelia connected (MDUs + SDUs)
SWEDEN- STABLE B2C BUT STILL CHALLENGES IN B2B
Q3 15 Q3 16
+1.4%+1.4%
-6.6%-6.6%
+0.6%+0.6%
B2B
B2CExcl. fiber installation revenues
Incl. fiber installation revenues
1.45 million1.45 million
TELIA FIBER HOUSEHOLDSSERVICE REVENUES BY SEGMENTOrganic growth, external service revenues
• Stable B2C development but lower contribution from fiber installation revenues
• Positive development in SME/SoHo but continued price pressure in B2B large
• Deliveries impacted by increased permit lead time and sub-contractor delays
• Targeted full year order book achieved although some deliveries will spill over to 2017
• Target of 1.9 million homes reached by end of 2018 intact
1.25 million1.25 million
8

5
18 PERCENT TV REVENUE GROWTH IN SWEDEN
9
1.1%
5.9%
12.1%
Q315
Q316
Q315
Q316
Q315
Q316
TV
ARPU DEVELOPMENTGrowth y-o-y, B2C and B2B
• Increasing mobile ARPU from improved offerings despite continued price pressure in B2B
• Fixed broadband and TV ARPUs benefitting from price changes earlier this year
Fixed broadbandMobile
• Partnering with leading content and hardware suppliers
• New generation TV box launched
• Telia Play+ available in Apple TV
• Chromecast enabling “on any screen” experience
ENHANCED TV PROPOSITION
6.1%
2.9%
Q3 15 Q4 15 Q1 16 Q2 16 Q3 16
Mobile billed service revenues Total mobile service revenues2,758 2,784
Q3 15 Q3 16
0.0%0.0%
ACCELERATED MOBILE REVENUE GROWTH IN FINLAND
10* External service revenues **Excluding non-recurring items
Service revenues EBITDA
= Organic growth
SERVICE REVENUES* & EBITDA**SEK million, reported currency
MOBILE SERVICE REVENUES*Organic growth
• Mobile billed service revenue growth mitigated lower interconnect and fixed broadband revenues
• Stable profitability
• Successful data monetization and price increases in B2C boost mobile billed revenue growth
• Lower interconnect revenues behind lower growth in total mobile service revenues
1,048 1,055
Q3 15 Q3 16
+0.1%+0.1%

6
GOOD FOCUS AND EBITDA GROWTH IN NORWAY
11
862 890
Q3 15 Q3 16
+5.5%+5.5%
Service revenues EBITDA
SERVICE REVENUES* & EBITDA**SEK million, reported currency
• Lower interconnect revenues and disposal of fixed telephony customer base in Q4 2015
• EBITDA growth from mainly reduced SAC in Q3
* External service revenues **Excluding non-recurring items = Organic growth
Q3 15 Q4 15 Q1 16 Q2 16 Q3 16
Mobile billed service revenues Total mobile service revenues
MOBILE SERVICE REVENUES*Organic growth
• Flat mobile service revenues as growth in wholesale was offset by lower billed revenues and roaming
2,003 1,949
Q3 15 Q3 16
-1.5%-1.5%
-0.5%-0.5%
0.0%0.0%
12
256217
275295
148166
Q3 15 Q4 15 Q1 16 Q2 16 Q3 16
Estonia Lithuania Latvia
Q3 15 Q3 16Lithuania
Q3 15 Q3 16Latvia
+6.2%+6.2%
Q3 15 Q3 16Estonia
MIXED DEVELOPMENT IN THE BALTICS
-15.9%-15.9%
+11.6%+11.6%0.0%0.0%
+4.6%+4.6%
-4.3%-4.3%
SERVICE REVENUES*Organic growth
EBITDA**SEK million
• Growth in Lithuania from solid development in both mobile and fixed service revenues
• Lower sale of travel related products in Estonia
• Growing revenues coupled with synergies in Lithuania
• Lower marketing spend in Latvia
* External service revenues = Organic growth ** Excluding non-recurring items
7
SUMMARY Q3
13
PROVIS ION OF SEK 12 .5 B I LL ION
CORE BUS INESS ON TRACK
SHAPING OF NORDIC AND BALT IC FOOTPRINT
14
CHRISTIAN LUIGA,
SENIOR VICE PRESIDENT & CFO
INTERIM REPORT
JANUARY – SEPTEMBER 2016 Q1Q2Q3
8
15
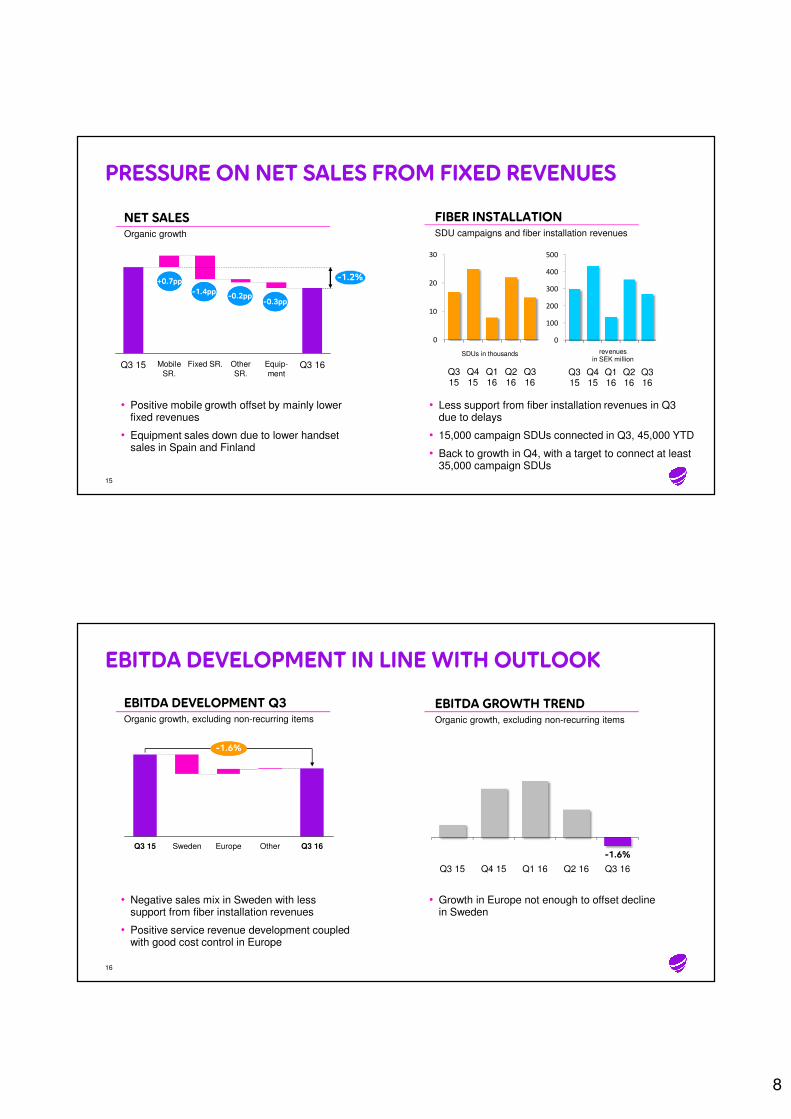
PRESSURE ON NET SALES FROM FIXED REVENUES
NET SALESOrganic growth
Q3 15 Fixed SR.Mobile SR.
Other SR.
Equip-ment
-1.2%
Q3 16
-1.4pp-1.4pp
+0.7pp+0.7pp
-0.2pp-0.2pp-0.3pp-0.3pp
0
100
200
300
400
500
Q315
Q415
Q116
Q216
Q316
revenuesin SEK million
FIBER INSTALLATIONSDU campaigns and fiber installation revenues
• Positive mobile growth offset by mainly lower fixed revenues
• Equipment sales down due to lower handset sales in Spain and Finland
• Less support from fiber installation revenues in Q3 due to delays
• 15,000 campaign SDUs connected in Q3, 45,000 YTD
• Back to growth in Q4, with a target to connect at least 35,000 campaign SDUs
0
10
20
30
Q315
Q415
Q116
Q216
Q316
SDUs in thousands
16
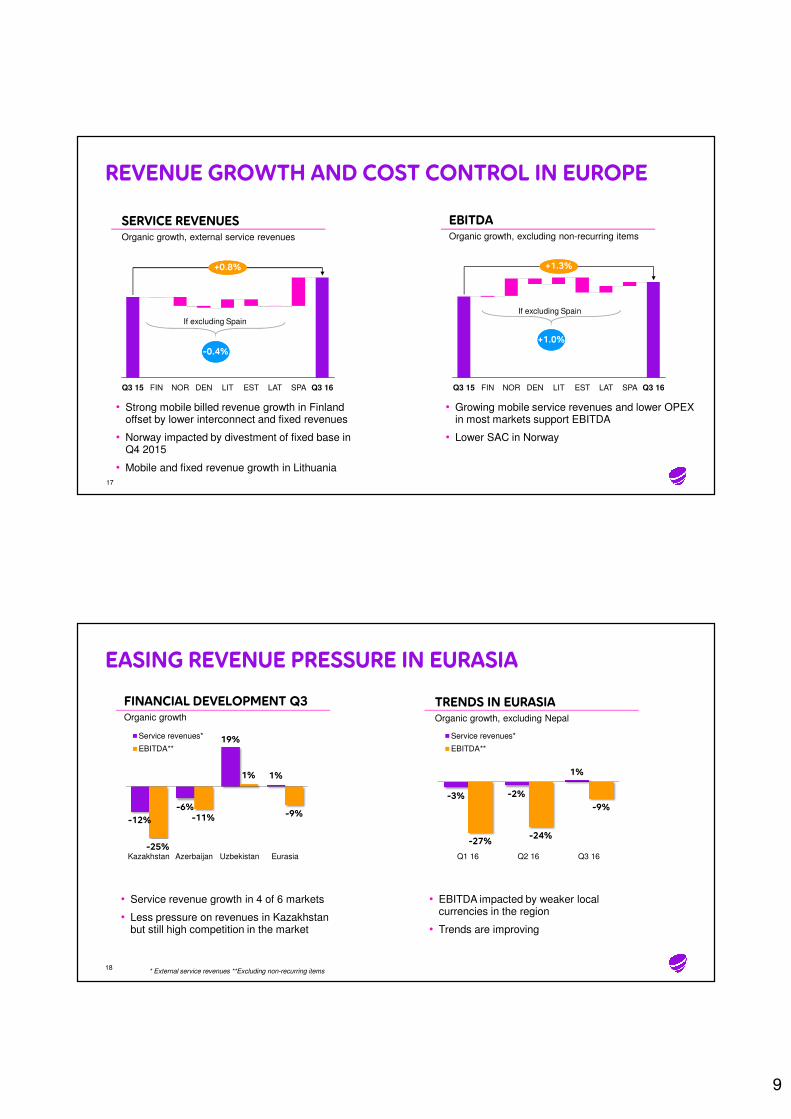
EBITDA DEVELOPMENT IN LINE WITH OUTLOOK
EBITDA DEVELOPMENT Q3Organic growth, excluding non-recurring items
EBITDA GROWTH TRENDOrganic growth, excluding non-recurring items
-1.6%-1.6%
Q3 16OtherEuropeSwedenQ3 15-1.6%
Q3 15 Q4 15 Q1 16 Q2 16 Q3 16
• Negative sales mix in Sweden with less support from fiber installation revenues
• Positive service revenue development coupled with good cost control in Europe
• Growth in Europe not enough to offset decline in Sweden
9
REVENUE GROWTH AND COST CONTROL IN EUROPE
17
EBITDAOrganic growth, excluding non-recurring items
ESTLITDENNORFINQ3 15
+1.3%+1.3%
Q3 16SPALAT
• Strong mobile billed revenue growth in Finland offset by lower interconnect and fixed revenues
• Norway impacted by divestment of fixed base in Q4 2015
• Mobile and fixed revenue growth in Lithuania
SERVICE REVENUESOrganic growth, external service revenues
• Growing mobile service revenues and lower OPEX in most markets support EBITDA
• Lower SAC in Norway
+0.8%+0.8%
Q3 16SPAQ3 15 LATESTLITDENNORFIN
-0.4%-0.4%
If excluding Spain
+1.0%+1.0%
If excluding Spain
18
EASING REVENUE PRESSURE IN EURASIA
FINANCIAL DEVELOPMENT Q3Organic growth
-12%
-6%
19%
1%
-25%
-11%
1%
-9%
Kazakhstan Azerbaijan Uzbekistan Eurasia
Service revenues*
EBITDA**
• Service revenue growth in 4 of 6 markets
• Less pressure on revenues in Kazakhstan but still high competition in the market
• EBITDA impacted by weaker local currencies in the region
• Trends are improving
* External service revenues **Excluding non-recurring items
TRENDS IN EURASIAOrganic growth, excluding Nepal
-3% -2%
1%
-27%-24%
-9%
Q1 16 Q2 16 Q3 16
Service revenues*
EBITDA**

10
19
COST DEVELOPMENT UNDER CONTROL
• Sweden and Spain key drivers behind lower OPEX H1 2016
• Increased transformation and commercial activities drive OPEX in Sweden Q3 2016
0.6%
Q3 15* Q4 15* Q1 16* Q2 16* Q3 16*
OPEX DEVELOPMENTOrganic growth, excluding Norway
* Norway excluded for comparison reasons due to Tele2 acquisition
OPEX represents ~40 percent of total cost base
2015 YTD Q32016
2016e 2017e
Sweden
Finland
Central funtions
INVEST TO SAVE PHASINGSEK billion, savings run-rate at period/year-end
0.6
0.91.1
2.0
• Program on track
1.4 1.7
1.21.1
0.60.8
0.0
1.0
2.0
3.0
4.0
Q3 15 Q3 16
Other operations
Europe
Sweden
TRANSFORMATION AND FIBER ROLL-OUT DRIVE CAPEX
20
= In relation to external service revenues
16.9%16.9% 19.8%19.8%
CAPEX EXCLUDING LICENSESSEK billion, continuing operations
• Higher CAPEX in Sweden driven by fiber and business transformation
• Group function IT investments main reason for higher CAPEX in Other operations
• Full year CAPEX likely to be in the high-end of guidance range
• Spectrum acquired in Denmark in the quarter -license auctions upcoming in Sweden and Finland
3.1
3.6

11
21
TOTAL EPS IMPACTED BY PROVISION
EPS - TOTALSEK
• Flat EPS in continuing operations
• Lower EPS in discontinued operations due mainly to SEK 12.5 billion settlement proposal provision
* Excluding income from associates and non-recurring items
-2.03
0.021.06
Oth
er
-0.12
Non
-rec
urrin
g
0.16
Ope
ratin
gin
com
e*
-0.06
Q3 15
Ass
ocia
tes
-3.09
Dis
cont
inue
dop
erat
ions Q3 16
0.000.00
Continuing operations
STABLE FREE CASH FLOW
FREE CASH FLOW Q3 SEK billion, continuing operations
• EBITDA in Eurasia impacted by Ncelldeconsolidation, erosion of local currencies and operational taxes
• MegaFon dividend of SEK 1.1 billion net of tax received in the quarter
* Excluding non-recurring items ** Net of tax
-0.2
EBITDA*
-0.1
Dividend associates
**
3.2
Q3 15
0.00.0
Q3 16
3.3
Interest Other
-0.5-0.4
Change in WC
-0.2
Tax Cash CAPEX
0.9 0.6
0
4
8
12
16
20
Q3 15 Q4 15 Q1 16 Q2 16 Q3 16
Discontinued operations Dividends from associates net of taxes Continuing operations excl. associates Continuing operations incl. associates
22
FREE CASH FLOW, R12 MONTHSSEK billion, continuing and discontinued operations
11.4
16.016.615.5
9.0
10.3
12
23
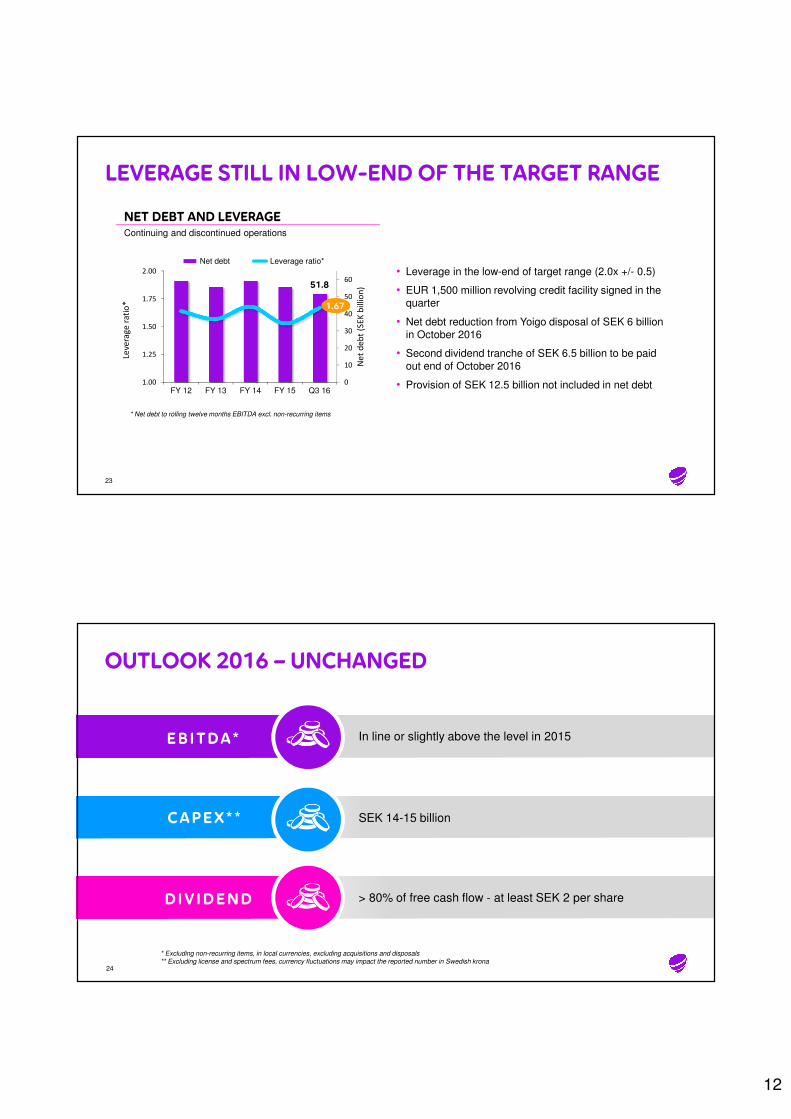
LEVERAGE STILL IN LOW-END OF THE TARGET RANGE
NET DEBT AND LEVERAGEContinuing and discontinued operations
51.8
0
10
20
30
40
50
60
1.00
1.25
1.50
1.75
2.00
FY 12 FY 13 FY 14 FY 15 Q3 16
Ne
t d
eb
t (S
EK
billio
n)
Leve
rag
e r
ati
o*
Net debt Leverage ratio*
* Net debt to rolling twelve months EBITDA excl. non-recurring items
1.67
• Leverage in the low-end of target range (2.0x +/- 0.5)
• EUR 1,500 million revolving credit facility signed in the quarter
• Net debt reduction from Yoigo disposal of SEK 6 billion in October 2016
• Second dividend tranche of SEK 6.5 billion to be paid out end of October 2016
• Provision of SEK 12.5 billion not included in net debt
OUTLOOK 2016 – UNCHANGED
* Excluding non-recurring items, in local currencies, excluding acquisitions and disposals** Excluding license and spectrum fees, currency fluctuations may impact the reported number in Swedish krona
24
In line or slightly above the level in 2015EB ITDA *
SEK 14-15 billion
> 80% of free cash flow - at least SEK 2 per share
CAPEX * *
DIV IDEND

13
Q&A
DEBT MATURITY SCHEDULE MMO
0
1
2
3
4
5
6
7
8
Oct-16
Nov-16
Dec-16
Jan-17
Feb-17
Mar-17
Apr-76
May-17
Jun-17
Jul-17
Aug-17
Sep-17
0
2
4
6
8
10
12
2016 2019 2022 2025 2028 2031 2034 2037 2040 2043 2046 2049 2052 2055 2058 2061 2064
26
DEBT MATURING NEXT 12 MONTHS
DEBT PORTFOLIO MATURITY SCHEDULE – 2016 AND ONWARDS
SEK billion
SEK billion

14
FINANCIAL SUMMARY Q3 2016
27
* Excluding non-recurring items
Q3 2016 Q3 2015 CHANGE (%)
Net sales (SEK million) 21,524 21,712 -0.9
Change local organic (%) -1.2
Service revenues (SEK million) 18,413 18,549 -0.7
Change local organic (%) -1.1
EBITDA* (SEK million) 6,850 6,957 -1.5
Change local organic (%) -1.6
EBITDA* Margin (%) 31.8 32.0
Total EPS (SEK) -2.03 1.06
Total free cash flow (SEK million) 3,657 4,699 -22.2
28
SEP 30, 2016 DEC 31, 2015
Return on equity*, % Negative 9.3
Return on capital employed*, % 2.6 8.9
Equity/assets ratio, % 31.5 35.1
Net debt/equity ratio, % 63.3 62.5
Net debt/EBITDA** ratio, multiple 1.67 1.53
Net debt/assets ratio, % 19.9 21.9
* Rolling 12 months ** Rolling 12 months, excluding non-recurring items
FINANCIAL KEY RATIOS Q3 2016

15
FORWARD-LOOKING STATEMENTS
Statements made in this document relating to future status or circumstances, including future performance and other trend projections are forward-looking statements. By their nature, forward-looking statements involve risk and uncertainty because they relate to events and depend on circumstances that will occur in the future. There can be no assurance that actual results will not differ materially from those expressed or implied by these forward-looking statements due to many factors, many of which are outside the control of Telia Company.