Q3 and 9M 2021 Schaeffler AG earnings
49
PUBLIC Q3 and 9M 2021 Schaeffler AG earnings Earnings Call November 9, 2021 Herzogenaurach
Transcript of Q3 and 9M 2021 Schaeffler AG earnings

PUBLIC
Q3 and 9M 2021 Schaeffler AG earningsEarnings CallNovember 9, 2021Herzogenaurach

PUBLIC
Disclaimer
Nov 9, 2021
This presentation contains forward-looking statements. The words “anticipate”, “assume”, “believe”, “estimate”, “expect”, “intend”, “may”, “plan”, “project”, “should” and similar expressions are used to identify forward-looking statements. Forward-looking statements are statements that are not historical facts; they include statements about Schaeffler Group’s beliefs and expectations and the assumptions underlying them. These statements are based on plans, estimates and projections as they are currently available to the management of Schaeffler AG. Forward-looking statements therefore speak only as of the date they are made, and Schaeffler Group undertakes no obligation to update any of them in light of new information or future events.
By their very nature, forward-looking statements involve risks and uncertainties. These statements are based on Schaeffler AG management’s current expectations and are subject to a number of factors and uncertainties that could cause actual results to differ materially from those described in the forward-looking statements. Actual results may differ from those set forth in the forward-looking statements as a result of various factors (including, but not limited to, future global economic conditions, changed market conditions affecting the automotive industry, intense competition in the markets in which we operate and costs of compliance with applicable laws, regulations and standards, diverse political, legal, economic and other conditions affecting our markets, and other factors beyond our control).
This presentation is intended to provide a general overview of Schaeffler Group’s business and does not purport to deal with all aspects and details regarding Schaeffler Group. Accordingly, neither Schaeffler Group nor any of its directors, officers, employees or advisers nor any other person makes any representation or warranty, express or implied, as to, and accordingly no reliance should be placed on, the accuracy or completeness of the information contained in the presentation or of the views given or implied. Neither Schaeffler Group nor any of its directors, officers, employees or advisors nor any other person shall have any liability whatsoever for any errors or omissions or any loss howsoever arising, directly or indirectly, from any use of this information or its contents or otherwise arising in connection therewith.
The material contained in this presentation reflects current legislation and the business and financial affairs of Schaeffler Group which are subject to change.
2Q3 and 9M 2021 Schaeffler AG earnings

PUBLIC
Claus Bauer – CFO and Member of the Board of Managing Directors
Claus Bauer – CFO Schaeffler AG as of September 1, 2021
Q3 and 9M 2021 Schaeffler AG earningsNov 9, 2021 3
Decision Supervisory Board, August 2021
• Claus Bauer has been appointed as a Member of the Board of Managing Directors, effective from September 1, 2021 and is responsible for Finance and IT
Career
• Claus Bauer (55) joined the Schaeffler Group in 1998 as Head of Tax Department and afterwards Head of Corporate Accounting
• He has been working at Schaeffler´s American headquarters since 2002, initially in the role of Chief Financial Officer North America. Following the merger of the regions North- and South America in 2016, he continued in the role as Chief Financial Officer Americas
• Claus Bauer is a business administration graduate and certified tax advisor
PUBLIC
Overview
Business Highlights Q3 and 9M 2021
Financial Results Q3 and 9M 2021
Outlook
1
2
3
4
Agenda
Nov 9, 2021 4Q3 and 9M 2021 Schaeffler AG earnings

PUBLIC
Solid Q3 2021 – Automotive Technologies sales hampered by market, EBIT margin2 and FCF3 successfully protected
1 Overview
Q3 and 9M 2021 Schaeffler AG earnings
Key messages
Q3 Group sales1 -3.0% – Automotive Technologies sales realization hampered by market disruptions, strong growth in Automotive Aftermarket and double-digit in Industrial
Q3 EBIT margin2 8.2% – Effective margin protection in Automotive Technologies despite lower volumes, strong margin in Automotive Aftermarket and Industrial
Q3 FCF3 EUR 225 mn – Supported by higher EBITDA; counter-balanced by increased Capex and tactically higher inventories
9M ROCE4 peaked at a strong 18.0% (9M 20: 8.0%) – Supported by above average LTM earnings and proactive capital management
Automotive Technologies Operating Model sharpened to boost execution of our “Mature and New” approach – Further differentiating powertrain-specific and powertrain-agnostic businesses
FY 2021 Guidance confirmed for Group and divisional margins and FCF – Auto Technologies Outperformance guidance unchanged, Industrial top line raised
1
2
3
4
6
5
Nov 9, 2021 5
Gross margin Q3
23.8%Q3 2020: 23.5%
Free Cash Flow3 Q3
EUR 225 mnQ3 2020: EUR 333 mn
EBIT margin2 Q3
8.2%EUR 272 mn
Sales growth1 Q3
-3.0%EUR 3,332 mn
1 FX-adjusted | 2 Before special items | 3 Before cash in- and outflows for M&A activities | 4 Before special items, LTM

PUBLIC
Schaeffler Group Q3 2021 – Highlights and lowlights
1 Overview
Q3 and 9M 2021 Schaeffler AG earnings
Semiconductor shortage led to extremely low LVP1 in Q3, indirectly impacting volumes in Automotive Technologies across all regions
General market headwinds – Semiconductor shortage, Covid-19 variants and supply chain situation – are persisting with low visibility
Automotive Technologies once again with strong Outperformance of 750 bps in Q3 (9M: 660 bps); all regions outperforming despite weaker markets
Automotive Aftermarket sales profiting from increasing demand for individual mobility solutions
Industrial growth in Q3 driven by brisk economic recovery, all sector clusters growing except Wind and Railway
Being an Automotive and Industrial supplier pays off, and leads to margin resilience; strong FCF for each division and the whole Group, despite persisting high uncertainty
Nov 9, 2021 6
Costs for raw materials, energy and transportation increasing in Q3 as flagged, impacting H2 2021 with a lag
1 Light Vehicle Production
PUBLIC
Overview
Business Highlights Q3 and 9M 2021
Financial Results Q3 and 9M 2021
Outlook
1
2
3
4
Agenda
Nov 9, 2021 7Q3 and 9M 2021 Schaeffler AG earnings

PUBLIC
Automotive Technologies – Strong Outperformance, effective margin protection
2 Business Highlights Q3 and 9M 2021
Q3 and 9M 2021 Schaeffler AG earnings
Higher raw material costs burdened Q3 earnings together with higher energy and freight costs; negative effect to further increase in Q4, with a lag as previously flagged
Q3 sales impacted by significantly lower LVP in all regions; still, exceptionally high 750 bps Outperformance achieved in Q3, leading to a YTD outperformance of 660 bps, above FY 2021 guidance range
Despite lower volumes and higher input costs, EBIT margin2 protected by additional tactical cost mitigation measures in production and overhead areas
Supply chain disruptions - mainly semiconductor shortages - clearly affected our customers in Q3; ongoing impact for LVP in Q4 and 2022 expected
1 FX-adjusted | 2 Before special items
Nov 9, 2021 8
EBIT2
in EUR mn
176 88
Q3 2020 Q3 2021
8.2%
-3.6pp
-16
467
9M 2020 9M 2021
4.6% -0.3% 7.4%
+7.7pp
EBITmargin2
Salesin EUR mn
2,161 1,921
Q3 2020 Q3 2021
21.0%
-12.2%1
Grossmargin
5,425 6,286
9M 2020 9M 2021
19.5% 15.8% 21.7%
+16.1%1

PUBLIC
Automotive Technologies – How we win: Driving the transition to innovative Powertrain and Chassis Technologies
Nov 9, 2021
2 Business Highlights Q3 and 9M 2021
Q3 and 9M 2021 Schaeffler AG earnings 9
Investment in state-of-the-art sustainable E-
Mobility plant
Schaeffler & Mobileye are advancing the industrialization of
autonomous vehicles
Schaeffler at IAA 2021:Showcasing our
technology competencies
Schaeffler wins prestigious 2021
Automotive News PACE Awards for E-Mobility

PUBLIC
Automotive Aftermarket – Strong sales development in Q3, good margin on high comps
2 Business Highlights Q3 and 9M 2021
Nov 9, 2021
Lower margin yoy due to increased product costs and high comps
Business environment continued to be strong in Q3 – Europe with stable development, double-digit growth in all other regions
Sequential growth in the new E-Commerce platform ETC in China
10Q3 and 9M 2021 Schaeffler AG earnings
EBIT2
in EUR mn
86 71
Q3 2020 Q3 2021
18.8%
-4.5pp
190 206
9M 2020 9M 2021
14.3% 15.8% 14.6%
-1.2pp
EBITmargin2
Salesin EUR mn
456 500
Q3 2020 Q3 2021
35.1%
+8.7%1
Grossmargin
1,204 1,411
9M 2020 9M 2021
30.8% 34.4% 31.5%
+18.3%1
Material availability continues to limit further sales growth opportunities
1 FX-adjusted | 2 Before special items

PUBLIC
Automotive Aftermarket – How we win: REPXPERT Remote Support is the next level digital service for garages
11
REPXPERT Remote Support enables complex technical repairs and promotes direct contact to garages
2 Business Highlights Q3 and 9M 2021
Free of charge for garages
Available in Europe already in
2021
Fast login via QR code
Nov 9, 2021 Q3 and 9M 2021 Schaeffler AG earnings
Conventional technical support methods reach their limitations
when it comes to complex, demanding vehicle repairs
• Service technicians increasingly report difficulties in resolving technical
inquiries via telephone or email
Schaeffler launches a Microsoft Dynamics 365 based technical
support solution for smartphones, tablets or HoloLens
• Images and sound transmitted in real time
• Mixed reality to accurately visualize positions and rotational directions
• No access barriers or licenses cost for garages

PUBLIC
Industrial – Double-digit sales growth, EBIT margin2 above 12%
2 Business Highlights Q3 and 9M 2021
Nov 9, 2021
1 FX-adjusted | 2 Before special items1 FX-adjusted | 2 Before special items
Wind with negative growth in Q3 yoy as expected, Railway recovering slowly; rising raw material costs preventing an even better profitability
Strong EBIT margin2 driven by scale effects and cost saving measures
All regions growing in Q3, double-digit growth in Europe, Americas and Asia/Pacific
1 FX-adjusted | 2 Before special items
12Q3 and 9M 2021 Schaeffler AG earnings
EBIT2
in EUR mn
61113
Q3 2020 Q3 2021
7.8%
+4.6pp
202
321
9M 2020 9M 2021
12.4% 8.6% 12.1%
+3.5pp
EBITmargin2
Salesin EUR mn
774 911
Q3 2020 Q3 2021
23.5%
+15.8%1
Grossmargin
2,335 2,649
9M 2020 9M 2021
29.0% 27.3% 29.5%
+14.2%1 Brisk economic recovery continued in Q3 – Most sectors growing double-digit, Industrial Distribution up more than 20%1 yoy

PUBLIC
13Nov 9, 2021 Q3 and 9M 2021 Schaeffler AG earnings
2 Business Highlights Q3 and 9M 2021
• Supply model with direct availability and 100 percent return service
• Circular approach reducing CO2 emissions, energy and water consumption by approx. 95 percent
• Combining customer value with key sustainability aspects
Industrial – How we win: Railsponsible Supplier Award 2021 in the category “Climate Change and Circular Economy”
Railway Supplier Award

PUBLIC
Investment1 allocation | in EUR mn
Capital allocation – Capex ratio increased to 6.4% in Q3, investments in growth business
2 Business Highlights Q3 and 9M 2021
Nov 9, 2021
FY 19 FY 20 Q3 20 Q3 21 9M 21
Automotive Technologies
672 378 86 127 273
Automotive Aftermarket
67 26 13 5 12
Industrial 193 235 72 66 154
Schaeffler Group
933 639 171 198 439
Capex 1,045 632 181 215 482
Capex ratio2 7.2% 5.0% 5.3% 6.4% 4.7%
Reinvestment Rate
1.0 0.7 0.7 0.9 0.7
1 Additions to intangible assets and property, plant and equipment | 2 Capex in % of sales
14Q3 and 9M 2021 Schaeffler AG earnings
Key aspects Q3
• Reinvestment rate: clearly >1 in Industrial division and BD E-Mobility; consistently <1 in BD Transmission Systems and Engine Systems
• Automotive Technologies: continued prioritization drives investments; machinery investments for E-Motor production in Hungary
• Industrial: investments for capacity expansion of large size bearings in Nanjing, China; new hall for Railway bearings in Brasov, Romania
Investments1 by region 9M 2021in EUR mn (yoy change)
Greater China
29 (-5)
Europe
Americas 53 (+5)
255 (+2)102 (-23)
Asia/Pacific7%
58%12%
23%

PUBLIC
How we create value: Portfolio management – Automotive Technologies Operating Model sharpened
Q3 and 9M 2021 Schaeffler AG earnings 15Nov 9, 2021
Key aspects
• We sharpen our Operating Model in Automotive Technologies, consistent with our goals to:
− Lead in E-Mobility, technological edge and innovation
− Strengthen Chassis system business as second pillar of the Division
− Extract higher synergies with business for conventional powertrains (Engine & Transmission Systems)
− Leverage our powertrain agnostic automotive bearings business and our synergies with the Industrial division
• We increasingly differentiate our steering of resources, capital and growth
Operating Model sharpened to further boost execution of “Mature & New” and “Powertrain-agnostic & -specific” approach
Engine & Transmission
E-Mobility
Chassis SystemsBearings
Powertrain-specific
Powertrain-agnostic
2 Business Highlights Q3 and 9M 2021
Mature Business New Business
1

PUBLIC
16Nov 9, 2021 Q3 and 9M 2021 Schaeffler AG earnings
2 Business Highlights Q3 and 9M 2021
• New E-Mobility business for Offroad applications based on close cooperation between divisions
• Customer intimacy and application knowledge of the Industrial Division
• Automotive E-motor technology know-how
How we create value: Synergies – Automotive and Industrial cross-fertilization leveraging Offroad & E-Motor2

PUBLIC
2 Business Highlights Q3 and 9M 2021
Nov 9, 2021 Q3 and 9M 2021 Schaeffler AG earnings 17
Scope 1 + 2
Base Year
Scope 3
upstream
20252019 2030 20402035
Climate Neutral Company
Climate Neutral Production
Scope 3
downstreamNot included
* Residual emissions are to be compensated
-25%
-90%*-75%
Long-Term Sustainability Targets
-90%*
Key aspects
• Decarbonization as top priority
• Emissions occurring in the supplychain (Scope 3 upstream):
− Climate neutral from 2040
− Emission reduction of 25% until2030
− From 2025, Schaeffler will source 100,000 tons of green steel on an annual basis from Swedish start-up H2greensteel
• Production facilities (Scope 1&2):
− Climate neutral from 2030
− Emission reduction of 75% until2025
• Clear strategy with specificmeasures being defined and implemented across the company
How we create value: Sustainability – New step on our path to Climate Neutrality3

PUBLIC
Overview
Business Highlights Q3 and 9M 2021
Financial Results Q3 and 9M 2021
Outlook
1
2
3
4
Agenda
Nov 9, 2021 18Q3 and 9M 2021 Schaeffler AG earnings

PUBLIC
Sales by region Q3 2021yoy growth2
Sales | in EUR mn
3,281 2,291 3,391 3,626 3,560 3,454 3,332
Q1 20 Q2 20 Q3 20 Q4 20 Q1 21 Q2 21 Q3 21
Sales – Mixed regional sales development, China with weakest growth on tough comps
3 Financial Results Q3 and 9M 2021
Q3 and 9M 2021 Schaeffler AG earnings
Greater China
+10.9%
EuropeAmericas -5.5% -2.2%
-9.7%
Asia/Pacific14%
41%21%
24%
Key aspects Q3
• Slightly negative growth development yoy, driven by lower production levels in Automotive Technologies and V-shape recovery in prior year
• Automotive Technologies with lower sales in Europe, Americas and Greater China; Asia/Pacific with +7%2
• AAM with double-digit growth in all regions, except Europe
• Industrial with double-digit growth in all regions, except China; China affected by normalizing demand in Wind business
FX-adjusted
-9.3% -34.5% -2.8% +4.5%
Reported
-9.4% -36.4% -6.1% +1.1%
Sales growth
1 Reported | 2 FX-adjusted
Nov 9, 2021 19
-1.8%1
-3.0%2
+11.2%
+8.5%
+50.6%
+50.8%
-3.0%
-1.8%

PUBLIC
Gross Profit – Stable gross margin yoy, production costs increasing
3 Financial Results Q3 and 9M 2021
Gross Profit Q3 2020 vs. Q3 2021 | in EUR mn
Q3 and 9M 2021 Schaeffler AG earnings
796
-8+38
+1
-26 -6 -2
793
Gross margin
in % of sales Q3 20 Q3 21Q3 21
vs. Q3 20 9M 20 9M 219M 21
vs. 9M 20
Automotive Technologies
21.0% 19.5% -1.5pp 15.8% 21.7% +5.9pp
Automotive Aftermarket
35.1% 30.8% -4.3pp 34.4% 31.5% -2.9pp
Industrial 23.5% 29.0% +5.5pp 27.3% 29.5% +2.2pp
Group 23.5% 23.8% +0.3pp 21.3% 25.1% +3.8pp23.5% 23.8%
Gross ProfitQ3 2021
OthersGross ProfitQ3 2020
Volume MixPrice Productioncosts
FX effect
Nov 9, 2021 20
Gross margin
Key aspects
• Negative price effect in Auto Technologies lower than PY, due to some material price clauses in North America; Aftermarket with positive pricing
• Volume impact driven by divisional mix (higher relative volume for Aftermarket and Industrial division)
• Production costs slightly higher yoy due to higher input costs phasing in (e. g. raw materials and energy)

PUBLIC
Gross margin – Managing input cost inflation
3 Financial Results Q3 and 9M 2021
Impact of input cost inflation
• As flagged, input prices continued to increase in Q3
– Steel accounts for 65% of our production material
– Logistics and energy cost follow the same trend
• In Q3 2021, 100 bps1 gross margin impact from Raw Materials, Energy and Logistics, expected to increase to 200 bps1 in Q4 2021
• We expect 200 bps1 of headwind on average in FY 2022, with front-loaded phasing
How we mitigate
• Pricing dynamics is different among divisions and businesses, and price recovery in most cases is partial, and moreover with a time lag
– In Automotive Technologies, price recovery mostly relies on one-to-one customer negotiations, which differ among customers and regions
– In Industrial, pricing initiatives are showing positive effects and mix is developing favorably
1 On a gross basis vs. H1 2021
Nov 9, 2021 Q3 and 9M 2021 Schaeffler AG earnings 21

PUBLIC
3 Financial Results Q3 and 9M 2021
Nov 9, 2021 Q3 and 9M 2021 Schaeffler AG earnings 22
Functional costs | in EUR mn
Functional cost ratio
Key aspects
• Functional costs increased by 12% in Q3 yoy on very low comps due to short-term work and other pandemic measures still in place
• R&D normalizing to pre-pandemic levels
• Selling costs increased yoy due to higher storage and logistic costs as well as revamping marketing efforts
• Admin costs increased by EUR 10 mn; still lower than pre-pandemic levels
Functional costs – Increase yoy due to low comps, cost discipline keeps functional cost ratio sequentially stable
in % of sales Q3 20 Q3 21Q3 21
vs. Q3 20 9M 20 9M 219M 21
vs. 9M 20
Automotive Technologies
12.7% 15.8% +3.1pp 15.9% 15.1% -0.8pp
Automotive Aftermarket
16.6% 17.1% +0.5pp 18.1% 17.4% -0.7pp
Industrial 18.9% 18.3% -0.6pp 19.2% 18.5% -0.7pp
Group 14.6% 16.7% +2.1pp 17.1% 16.3% -0.8pp
144 110 120 117 137 139 130
234193 211 243 246 232 243
192
162 164 165192 183 181
570
465 495 525575 554 555
Q1 20 Q2 20 Q3 20 Q4 20 Q1 21 Q2 21 Q3 21
EUR 1,530 mn
+12.1%
Admin
R&D
Selling
17.4% 20.3% 14.6% 14.5% 16.1%
In % of sales
16.1%
EUR 1,685 mn
16.7%

PUBLIC
EBIT1 | in EUR mn
212
-159
322 422 403 319 272
Q1 20 Q2 20 Q3 20 Q4 20 Q1 21 Q2 21 Q3 21
Solid EBIT margin1 – Strong margin in Industrial, Automotive Technologies indirectly impacted by semi shortage
3 Financial Results Q3 and 9M 2021
Q3 and 9M 2021 Schaeffler AG earnings
EBIT margin1
EBIT margin1
1 Before special items
Q3 20 Q3 21Q3 21
vs. Q3 20 9M 20 9M 219M 21
vs. 9M 20
Automotive Technologies
8.2% 4.6% -3.6pp -0.3% 7.4% +7.7pp
Automotive Aftermarket
18.8% 14.3% -4.5pp 15.8% 14.6% -1.2pp
Industrial 7.8% 12.4% +4.6pp 8.6% 12.1% +3.5pp
Group 9.5% 8.2% -1.3pp 4.2% 9.6% +5.4pp
Key aspects
• Solid Q3 EBIT margin1 of 8.2%, however input price effects phasing in
• Automotive Technologies with lower margin, driven by negative volume impact and temporary cost savings in prior year quarter
• Automotive Aftermarket with good margin, extraordinary margin prior year
• Industrial margin strong, supported by broad cyclical recovery and good cost control
EBIT margin1
6.5% -6.9% 9.5% 11.6%
4.2%
FY EBIT margin1
Nov 9, 2021 23
11.3%
-1.3pp
9.2%
9.6%
8.2%

PUBLIC
Sales by business division | yoy growth
Automotive Technologies – Outperformance driven by double-digit Europe and Asia/Pacific, Americas strong, effective margin protection
3 Financial Results Q3 and 9M 2021
Q3 and 9M 2021 Schaeffler AG earnings
Outperformance: Sales1 vs. market development in Q3
Q3 2020 Q3 2021 ∆1
E-Mobility 284 272 -6.0%
Engine Systems 566 486 -15.2%
Transmission Systems 989 861 -14.3%
Chassis Systems 322 302 -7.8%
Total 2,161 1,921 -12.2%
Production of light vehicles Q3 2021 vs. Q3 2020 (IHS Markit, October 2021)
Sales growth Schaeffler Automotive Technologies Q3 2021 vs. Q3 2020
EBIT2 Q3 2020 vs. Q3 2021 | in EUR mn
EBIT margin development2
8.2% -1.5pp -1.7pp -1.0pp -0.4pp +1.0pp 4.6%
EBITQ3 2021
OthersEBITQ3 2020
R&Dexpenses
Sellingexpenses
GrossProfit
1 FX-adjusted | 2 Before special items | 3 Includes negative FX effects of EUR 15 mn
Administrativeexpenses
-19.7%-27.1% -23.4% -16.5%
-12.7%-12.2% -15.0% -15.8% -15.8%
7.3%
World Europe Americas Greater China Asia/Pacific
+12.1pp +7.6pp +0.7pp +20.0pp+7.5pp
Nov 9, 2021 24
176 -793
-18-12 +1 +20
88
FY 20 +4.5pp +0.9pp +8.0pp +10.3pp +6.5pp

PUBLIC
EBIT5 Q3 2020 vs. Q3 2021 | in EUR mn
Automotive Aftermarket sales growth by channel1
IAM2
OES3
Total4
Automotive Aftermarket – Strong sales development, EBIT margin5 impacted by higher input costs
3 Financial Results Q3 and 9M 2021
Q3 and 9M 2021 Schaeffler AG earnings
5 Before special items | 6 Includes positive FX effects of EUR 1 mn
EBIT margin development5
18.8% -4.3pp +0.3pp -0.9pp +0.0pp +0.4pp 14.3%
86
-66+2
-10-1 +0
71
EBITQ3 2021
OthersEBITQ3 2020
R&Dexpenses
Sellingexpenses
GrossProfit
Administrativeexpenses
Sales by region | yoy growth
Q3 2020 Q3 2021 ∆1
Europe 334 341 +2.3%
Americas 80 102 +26.5%
Greater China 21 27 +18.9%
Asia/Pacific 21 30 +40.5%
Total 456 500 +8.7%
Q3 2021
1 FX-adjusted | 2 Independent Aftermarket | 3 Original Equipment Service | 4 Contains E-Commerce sales and sales to Automotive suppliers in addition to IAM and OES
Q3 2020
-20% -10% 0% 10% 20% 30%
Nov 9, 2021 25

PUBLIC
Industrial – Most sector clusters with double-digit growth, strong EBIT2 margin
3 Financial Results Q3 and 9M 2021
Q3 and 9M 2021 Schaeffler AG earnings
Sales by region | yoy growth
Q3 2020 Q3 2021 ∆1
Europe 295 372 +26.7%
Americas 127 151 +17.6%
Greater China 231 250 +2.5%
Asia/Pacific 121 138 +14.2%
Total 774 911 +15.8%
EBIT2 Q3 2020 vs. Q3 2021 | in EUR mn
2 Before special items | 3 Includes positive FX effects of EUR 8 mn
EBIT margin development2
7.8% +5.5pp +0.5pp +0.5pp -0.4pp -1.5pp 12.4%
61
+823
-1
-10-9
-10
113
EBITQ3 2021
OthersEBITQ3 2020
R&Dexpenses
Sellingexpenses
Industrial sales growth by sector cluster Q3 20211
Administrativeexpenses
GrossProfit
-10% 0% 10% 20% 30% 40% 50%
Industrial AutomationOffroad
Power TransmissionRaw MaterialsTwo-Wheelers
AerospaceRailway
WindIndustrial Distribution
Nov 9, 2021 26
1 FX-adjusted

PUBLIC
EBIT before special items – Reconciliation
3 Financial Results Q3 and 9M 2021
Q3 and 9M 2021 Schaeffler AG earnings
Special items by division| in EUR mn
Key aspects
• Special items amounted to positive EUR 27 mn in 9M, mainly related to a partial reversal of provisions for the Roadmap 2025
• Financial Result of EUR -85 mn (PY: EUR -114 mn); positively impacted from interest income on concluded tax case in Brazil
• Income taxes in line with expected average tax rate
Reconciliation 9M 2021 | in EUR mn
994
+27
1,021
-85
-280 -45
611
EBIT reported
EBIT bsi1
9.6% 9.9%EBIT margin
Special items
1 Before special items | 2 Attributable to the shareholders of the parent company
Financialresult
Incometaxes
Others Net Income2
Nov 9, 2021 27
Q3 20 Q3 21Q3 21
vs. Q3 20 9M 20 9M 219M 21
vs. 9M 20
EBIT Reported -188 278 +466 -422 1,021 +1,443
Automotive Technologies
+252 -20 -272 +517 -33 -549
Automotive Aftermarket
+23 -9 -31 +23 -19 -42
Industrial +236 +23 -213 +258 +24 -234
Group 511 -6 -517 +798 -27 -825
EBIT bsi1 322 272 -50 376 994 +618

PUBLIC
Net Income1 EUR 149 mn, EPS2 EUR 0.22 – ROCE3 reached a strong 18.0%
3 Financial Results Q3 and 9M 2021
Q3 and 9M 2021 Schaeffler AG earnings
Net income1 | in EUR mn
ROCE3 and Schaeffler Value Added4 | in EUR mn
1 Attributable to the shareholders of the parent company | 2 Earnings per common non-voting share 3 Before special items | 4 LTM EBIT before special items minus Cost of Capital (10% × Ø Capital Employed)
-186 -175 -171
103 235 227 149
Q1 20 Q2 20 Q3 20 Q4 20 Q1 21 Q2 21 Q3 21
939 787 557 284 2 631
22.3% 19.9%16.7%
13.2% 10.0%
18.0%
2016 2017 2018 2019 2020 9M 2021
ROCE before special items
Key aspects
• Q3 2021 Net Income1 reached EUR 149 mn, Net income before special items1 amounted to EUR 146 mn
• 9M 2021 Net Income1 of EUR 611 mn a strong basis to pay into our dividend policy
• ROCE3 peaked at a strong 18.0%; Schaeffler Value Added4 increased to EUR 631 mn due to higher EBIT LTM and lower average Capital Employed
EPS2 | in EUR
-0.28 -0.25 -0.26 0.15
-0.79
Nov 9, 2021 28
0.35
+320 mn
0.35
0.92
0.22

PUBLIC
Free Cash Flow – Strong EBITDA compensated outflows for Capex
3 Financial Results Q3 and 9M 2021
Q3 and 9M 2021 Schaeffler AG earningsNov 9, 2021 29
FCF Details | in EUR mn
Free Cash Flow before M&A1 | in EUR mn
1 Before cash in- and outflows for M&A activities | 2 Ratio FCF before M&A to EBIT reported – Only applicable if FCF and EBIT positive | 3 Capex in % of sales
Q32020
Q32021
∆ Q321/20
9M2020
9M2021
∆ 9M21/20
FCF as reported 333 215 -118 185 457 +272M&A 0 +10 +10 0 +11 +11FCF before M&A 333 225 -108 185 468 +283Legal cases 0 -2 -2 6 -4 -10Restructuring 45 75 +30 152 276 +124Others 0 3 +3 0 9 +9Financing 0 0 0 50 0 -50FCF bef. M&A and sp. items 377 301 -76 393 749 +356
Reconciliation Q3 2021 | in EUR mn
137
-285
333 355 130 113 225
Q1 20 Q2 20 Q3 20 Q4 20 Q1 21 Q2 21 Q3 21
Reinvestment rate
0.7
FCF Conversion ratio2
-
0.6
-
0.7
-
0.8
1.3
-108 mn
Capex ratio3
5.0% 5.9% 5.3% 4.2%
0.5
0.3
3.7%
0.9
0.3
6.4%
0.8
0.6
3.9%
519
+15 -2150
-97
+3 225
OthersEBITDAQ3 2021
Capex∆ Net Working Capital
FCF Q3 20211
Net Interest
Taxes

PUBLIC
Net debt decreased to EUR 2.0 bn – Leverage ratio1 at 0.8x
3 Financial Results Q3 and 9M 2021
Q3 and 9M 2021 Schaeffler AG earnings
Net financial debt and Leverage ratio1 | in EUR mn
1 Net financial debt to EBITDA ratio before special items | 2 LTM | 3 Excluding restricted cash
Key aspects
• Net financial debt decreased to EUR 2.0 bn, Leverage ratio1 0.8x
• No maturities until March 2024 after announced prepayment of 2023 Schuldschein tranches and pre-funded bond maturity in March 2022
Strong liquidity situation
• Cash balance Schaeffler Group as per end of September 2021 EUR 2,020 mn (December 2020: EUR 1,758 mn)
• Committed unused credit lines on Group level of almost EUR 2.0 bn as per end of September, available liquidity3 27% of LTM Net Sales
Leverage ratio1
EBITDA before special items2
3,044
2,064
Cash & cash equivalents
629
Gross debt
Nov 9, 2021 30
3,921
1,633
919
2,414 3,002 2,688 2,312 2,176 2,228 2,014
1.2
1.8 1.61.3 1.1 0.9 0.8
Q1 20 Q2 20 Q3 20 Q4 20 Q1 21 Q2 21 Q3 21
3,914
1,637
1,226
4,071
1,788
1,758
4,030
1,972
1,854
4,039
2,449
1,810
4,034
2,382
2,020

PUBLIC
Overview
Business Highlights Q3 and 9M 2021
Financial Results Q3 and 9M 2021
Outlook
1
2
3
4
Agenda
Nov 9, 2021 31Q3 and 9M 2021 Schaeffler AG earnings

PUBLIC
Automotive Technologies – Global LVP1 2021
4 Outlook
Our Outlook going forward – What changed in our market assumptions since August
32Nov 9, 2021 Q3 and 9M 2021 Schaeffler AG earnings
74.6
20.6 18.8 16.5 18.9
74.8
2020 Q1 Q2 Q3 Q4e 2021e
yoy vs. 20200.3%
1 Light Vehicle Production (IHS Markit, October 2021)
Schaeffler market
assumption up to 0.5 mn
higher than IHS estimates
• Schaeffler market assumption at the FY release was ~ 80 mn vehicles (5 mn discount to IHS, Feb. 2021)
• After a strong Q1, the LVP1 in Q2 and even more in Q3 was strongly impacted by the semiconductor shortage
• For Q4, Schaeffler anticipates a moderate upside of up to 0.5 mn vehicles vs. IHS estimates
Industrial – Industrial Production3
• Global industrial production expected to grow by 12.0% in 2021 (last release: 11.9%)
• Strong market development across all regions, mainly driven by Greater China and Americas; fastest growing sector was the mechanical engineering sector (~ 13%)
3 Industrial Production (Oxford Economics, Sept. 2021)Sectors: Mechanical Engineering (NACE 28), Transport Equipment (NACE 30), Electrical Equipment (NACE 27.1)
0%
2%
4%
6%
8%
10%
12%
14%
Europe Americas Greater China Asia/Pacific
FY 2021E
World
Automotive Aftermarket – GDP2
• World GDP expected to reach 5.9% growth in 2021 (2020: -3.4%) fueled by economic recovery after the Coronavirus crisis
• Global GDP growth expectation for FY 2021 slightly reduced compared to the previous prognosis from June 2021 (6.3%)
2 GDP (Oxford Economics, September 2021)
World
0%
2%
4%
6%
8%
Europe Americas Greater China Asia/Pacific
FY 2021E
Up to 75.3

PUBLIC
Group Guidance
1 FX-adjusted | 2 Before special items | 3 Before cash in- and outflows for M&A activities | 4 Release Date 5 Light Vehicle Production (IHS Markit, October 2021)
Divisional Guidance
Automotive Technologies
Automotive Aftermarket
Industrial
FY 2021 Guidance – Group and divisional margins and FCF confirmed
4 Outlook
New market assumptions for Fiscal Year 2021
• Automotive Technologies: LVP 2021 up to 0.5 mn vehicles higher than latest IHS estimate5 of 74.8 mn vehicles
• Automotive Aftermarket: Increase of global GDP by around 6%
• Industrial: Increase of relevant industrial production of around 12%
Nov 9, 2021 Q3 and 9M 2021 Schaeffler AG earnings 33
Guidance Aug 44
FY 2021Guidance Nov 94
FY 2021
Sales growth1 > 11% > 7%
EBIT margin2 8 - 9.5% 8 - 9.5%
Free Cash Flow3 > EUR 400 mn > EUR 400 mn
Aug 44 Nov 94 Aug 44 Nov 94 Aug 44 Nov 94
Outperf.
200 - 500 bps
Outperf.
200 - 500 bps >10% > 10% 9 - 11% 11 - 13%
> 6% > 6% > 12.5% > 12.5% > 10.5% > 10.5%

PUBLIC
Conclusion & Outlook
Automotive Technologies strongly outperformed a weaker market, strong Aftermarket and Industrial sales support evidence of “Automotive & Industrial Supplier” resilience paying off
FY 2021 Margins and FCF guidance confirmed – Preparedness to face increased input costs for longer, related to raw materials, energy and transportation costs; high confidence in sustainably growing our business and leveraging Automotive and Industrial competitive edge
Margins and FCF solid, also supported by tactical mitigating actions, as external headwinds -raw materials, energy, freight - continue to be challenging. All hands on deck for Q4 and 2022
Brisk pace of innovation is recognized by our Customers – „Automotive and Industrial Supplier“ cross-fertilisation supports our ecosystem; new cooperation with Mobileye in Auto
1
Sustainability focus intensifying – Strategically with Scope 3 upstream targets. Operationally, increasingly embedded in product innovation, investments and operations, and sourcing
2
3
4
5
Relentless focus on execution –
Delivering solid operating
performance and cash generation
34
4 Outlook
Nov 9, 2021 Q3 and 9M 2021 Schaeffler AG earnings

PUBLIC
Roadshows & Conferences – Next CEO & CFO IR events
2021/2022 Capital market activities
4 Outlook
Q3 and 9M 2021 Schaeffler AG earnings
Financial calendar 2021/2022
Nov 11
Nov 12
Roadshow – J.P. Morgan, Europe ex-DACH
Roadshow – Deutsche Bank, DACH
Nov 9 9M 2021 Earnings Release
Mar 8 FY 2021 Earnings Release
Nov 9, 2021 35
Jan 19 Conference – Kepler, German Corporates
Apr 21 AGM
May 10 Q1 2022 Earnings Release
Aug 4 H1 2022 Earnings Release
Apr 25 - 29 Hanover Fair, Industrial
Apr 6Colloquium Baden-Baden, Automotive Technologies

PUBLIC
IR ContactInvestor RelationsPhone: + 49 9132 82-4440Email: [email protected]: www.schaeffler.com/ir

PUBLIC
Additional KPIs FY 2021 Comments
E-Mobility perimeter Incl. TMM, Fuel Cells and
Chassis MechatronicsStarting from 2021, the business division E-Mobility includes Thermal management modules, fuel cell components as well as mechatronic chassis systems
Order Intake E-Mobility EUR 1.5 - 2.0 bn Starting from 2022 the new target of EUR 2 - 3 bn applies
Capex Up to EUR 700 mnFocus areas include Digitalization, Sustainability, Innovation & Technology and investments in New Business
Restructuring cash-out Up to EUR 350 mnSignificant portion of extraordinary restructuring expenses in 2021 expected leading to prudent FCF guidance
Payout Ratio 30 - 50% Dividend payout ratio2 50% within our range of 30 - 50%
Leverage ratio1 0.75x - 1.25x Leverage ratio 2021 below mid-term range
Average Tax rate 28 - 32% Overall effective tax rate in line with pre-Covid years
FX rate EUR/USD 1.25 Next to EUR/USD, also the Chinese Renminbi and Mexican Peso are of specific importance
Ancillary comments to support the Equity Story
Backup
1 Net financial debt to EBITDA ratio before special items | 2 in % of Net income attributable to shareholders before special items
Nov 9, 2021 Q3 and 9M 2021 Schaeffler AG earnings 37

PUBLIC
in EUR mn Q3 2020 Q3 2021Q3 2021
vs. Q3 2020 9M 2020 9M 20219M 2021
vs. 9M 2020
Sales 3,391 3,332-1.8%
-3.0%1 8,964 10,346+15.4%
+15.9%1
Gross ProfitGross margin
79623.5%
79323.8%
-3 mn+0.3pp
1,90721.3%
2,59325.1%
+686 mn+3.8pp
EBIT2
EBIT margin2
3229.5%
2728.2%
-50 mn-1.3pp
3764.2%
9949.6%
+618 mn+5.4pp
Net income3 -171 149 +320 mn -531 611 +1,142 mn
EPS4 (in EUR) -0.26 0.22 +0.48 -0.79 0.92 +1.71
Schaeffler Value Added5 -164 631 +795 mn -164 631 +795 mn
ROCE6 8.0% 18.0% +10.0pp 8.0% 18.0% +10.0pp
Free Cash Flow7 333 225 -108 mn 185 468 +283 mn
Capex 181 215 +34 mn 481 482 +1 mn
Net financial debt 2,688 2,014 -674 mn 2,688 2,014 -674 mn
Leverage ratio8 1.6x 0.8x -0.8x 1.6x 0.8x -0.8x
Headcount 83,711 83,935 +0.3% 83,711 83,935 +0.3%
Key figures Q3 and 9M 2021
Backup
Q3 and 9M 2021 Schaeffler AG earnings
1 FX-adjusted | 2 Before special items | 3 Attributable to shareholders of the parent company | 4 Earnings per common non-voting share | 5 Defined as EBIT before special items LTM minus Cost of Capital (10% × Ø Capital Employed) | 6 Before special items, LTM | 7 Before cash in- and outflows for M&A activities | 8 Net financial debt to EBITDA ratio before special items
Nov 9, 2021 38

PUBLIC
Group Guidance
1 FX-adjusted | 2 Before special items | 3 Before cash in- and outflows for M&A activities | 4 Release Date 5 Light Vehicle Production (IHS Markit, October 2021)
Divisional Guidance
Automotive Technologies
Automotive Aftermarket
Industrial
FY 2021 Guidance – Group and divisional margins and FCF confirmed
Backup
New market assumptions for Fiscal Year 2021
• Automotive Technologies: LVP 2021 up to 0.5 mn vehicles higher than latest IHS estimate5 of 74.8 mn vehicles
• Automotive Aftermarket: Increase of global GDP by around 6%
• Industrial: Increase of relevant industrial production of around 12%
Nov 9, 2021 Q3 and 9M 2021 Schaeffler AG earnings 39
Actuals9M 2021
Guidance Nov 94
FY 2021
Sales growth1 15.9% > 7%
EBIT margin2 9.6% 8 - 9.5%
Free Cash Flow3 EUR 468 mn > EUR 400 mn
Actuals 9M 2021
Guidance Nov 94
Actuals 9M 2021
Guidance Nov 94
Actuals 9M 2021
Guidance Nov 94
Outperf.
660 bps
Outperf.
200 - 500 bps 18.3% > 10% 14.2% 11 - 13%
7.4% > 6% 14.6% > 12.5% 12.1% > 10.5%

PUBLIC
Equity Story – Positioning Schaeffler for long-term value creation
Roadmap 2025 in execution – Focus on capital allocation, portfolio management and FCF generation
Automotive Technologies – Conquer leadership positions in New Business for electrified Powertrains and Chassis applications
Automotive Aftermarket – Maintain a high margin level, expand our share of wallet and reach
Industrial – Enter attractive growth fields, further enhance profitability
1
Financial Framework – Strict performance orientation based on Mid-term Targets
2
3
4
5
Creating long-term value and generating
Free Cash Flow
40
Sustainability – Fully committed to activate all impact levers to achieve sustainability goals 6
Backup
Nov 9, 2021 Q3 and 9M 2021 Schaeffler AG earnings

PUBLIC
Backup
E-Mobility – Promised and delivered: Order Intake and Footprint
41
2.1 bn EUR Order Intake for
E-Mobility achieved in H1 2021
11.4 bn EUR Total Order Intake
for E-Mobility since 2018
Official inaugurationon September 17, 2021
Nov 9, 2021 Q3 and 9M 2021 Schaeffler AG earnings

PUBLIC
Free Cash Flow details 9M 2021 – FCF supported by good operational performance
Backup
Q3 and 9M 2021 Schaeffler AG earnings
FCF1 9M 2020 vs. 9M 2021 | in EUR mn
185
+1.156
-549 +115+283
+2
-724
468
CapexFCF 9M 20201
InventoriesEBITDA
1 Before cash in- and outflows for M&A activities
Others FCF 9M 20211
Nov 9, 2021 42
Receivables Payables
Net Working Capital details| in EUR mn
Key aspects
• Positive EBITDA development yoy due to good operating performance
• Net Working Capital negative with EUR -151 mn driven by normalization of working capital structure and levels (prior year impacted by V-shape recovery in Q3 2020)
• Others included non-cash relevant provisions for restructuring program in Q3 2020
Change inQ3
2020Q3
2021∆ Q3
21/209M
20209M
2021∆ 9M
21/20Inventories 184 -145 -329 37 -512 -549Receivables -479 65 +544 -148 -33 +115
thereof R. Sale Program 0 0 0 0 0 0Payables 254 95 -159 -78 205 +283∆ Net Working Capital -41 +15 +56 -189 -340 -151Working Capital ratio1 20.4 19.7 - 20.4 19.7 -
1 in % of sales (LTM)
∆ Net Working Capital EUR -151 mn

PUBLIC
Sales by business division | yoy growth
Automotive Technologies – Strong Outperformance across all regions, good EBIT margin2
Backup
Q3 and 9M 2021 Schaeffler AG earnings
Outperformance: Sales1 vs. market development in 9M
9M 2020 9M 2021 ∆1
E-Mobility 719 883 +22.4%
Engine Systems 1,425 1,603 +13.5%
Transmission Systems 2,439 2,819 +16.5%
Chassis Systems 842 982 +16.8%
Total 5,425 6,286 +16.1%
Production of light vehicles 9M 2021 vs. 9M 2020 (IHS Markit, October 2021)
Sales growth Schaeffler Automotive Technologies 9M 2021 vs. 9M 2020
EBIT2 9M 2020 vs. 9M 2021 | in EUR mn
EBIT margin development2
-0.3% +5.9pp +0.4pp +0.0pp +0.4pp +1.0pp 7.4%
EBIT9M 2021
OthersEBIT9M 2020
R&Dexpenses
Sellingexpenses
GrossProfit
1 FX-adjusted | 2 Before special items | 3 Includes negative FX effects of EUR -19 mn
Administrativeexpenses9.5% 6.6% 9.8% 8.1% 14.2%16.1% 17.5% 16.4% 11.1%
23.6%
World Europe Americas Greater China Asia/Pacific
+10.9pp +6.6pp +3.0pp +9.4pp+6.6pp
Nov 9, 2021 43
-16
+5103
-38-38 -8 +57
467
FY 20 +4.5pp +0.9pp +8.0pp +10.3pp +6.5pp
PUBLIC
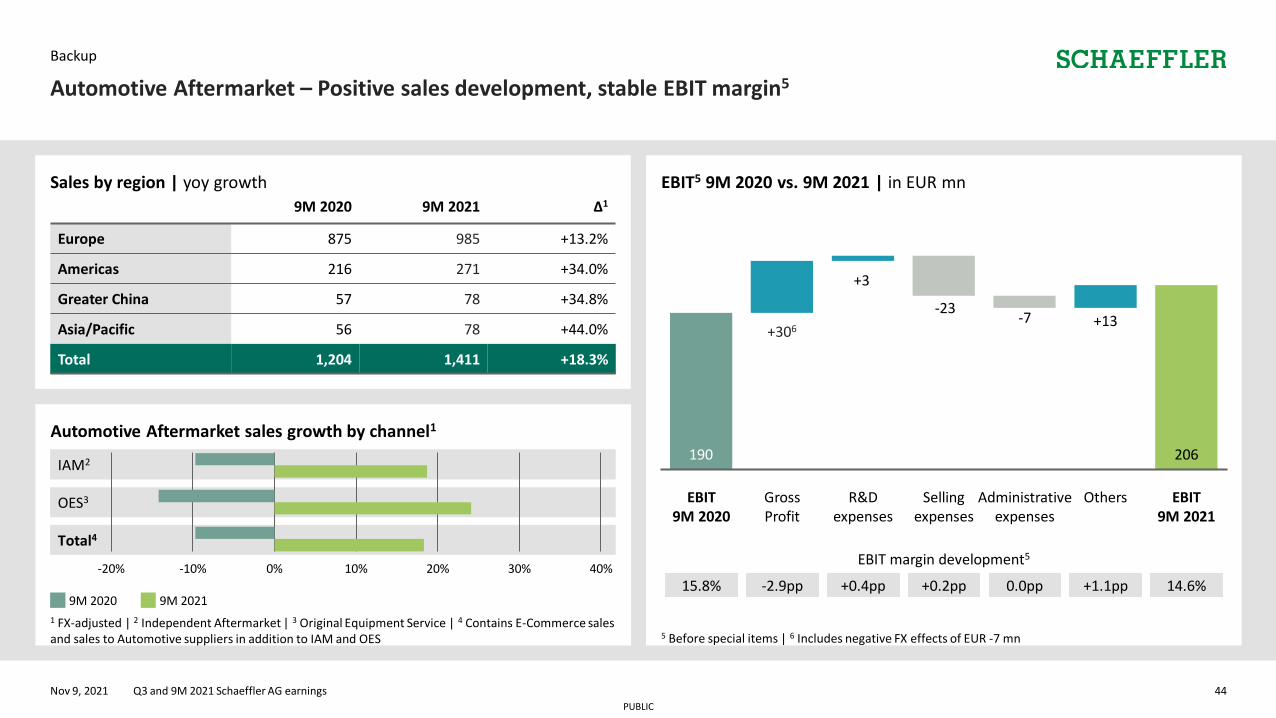
EBIT5 9M 2020 vs. 9M 2021 | in EUR mn
Automotive Aftermarket sales growth by channel1
IAM2
OES3
Total4
Automotive Aftermarket – Positive sales development, stable EBIT margin5
Backup
Q3 and 9M 2021 Schaeffler AG earnings
5 Before special items | 6 Includes negative FX effects of EUR -7 mn
EBIT margin development5
15.8% -2.9pp +0.4pp +0.2pp 0.0pp +1.1pp 14.6%
190
+306
+3
-23-7 +13
206
EBIT9M 2021
OthersEBIT9M 2020
R&Dexpenses
Sellingexpenses
GrossProfit
Administrativeexpenses
Sales by region | yoy growth
9M 2020 9M 2021 ∆1
Europe 875 985 +13.2%
Americas 216 271 +34.0%
Greater China 57 78 +34.8%
Asia/Pacific 56 78 +44.0%
Total 1,204 1,411 +18.3%
9M 2021
1 FX-adjusted | 2 Independent Aftermarket | 3 Original Equipment Service | 4 Contains E-Commerce sales and sales to Automotive suppliers in addition to IAM and OES
9M 2020
-20% -10% 0% 10% 20% 30% 40%
Nov 9, 2021 44

PUBLIC
Industrial – Double-digit growth in all regions, strong EBIT margin2
Backup
Q3 and 9M 2021 Schaeffler AG earnings
Sales by region | yoy growth
9M 2020 9M 2021 ∆1
Europe 973 1,071 +10.5%
Americas 396 436 +15.3%
Greater China 639 756 +17.7%
Asia/Pacific 328 385 +20.4%
Total 2,335 2,649 +14.2%
EBIT2 9M 2020 vs. 9M 2021 | in EUR mn
1 FX-adjusted | 2 Before special items | 3 Includes negative FX effects of EUR -7 mn
EBIT margin development2
8.6% +2.2pp +0.4pp +0.5pp -0.1pp +0.5pp 12.1%
202
+1453
-3
-21 -18 +16
321
EBIT9M 2021
OthersEBIT9M 2020
R&Dexpenses
Sellingexpenses
Industrial sales growth by sector cluster 9M 20211
Administrativeexpenses
GrossProfit
-10% 0% 10% 20% 30% 40% 50%
Two-WheelersOffroad
Industrial AutomationPower Transmission
WindRaw Materials
AerospaceRailway
Industrial Distribution
Nov 9, 2021 45
PUBLIC
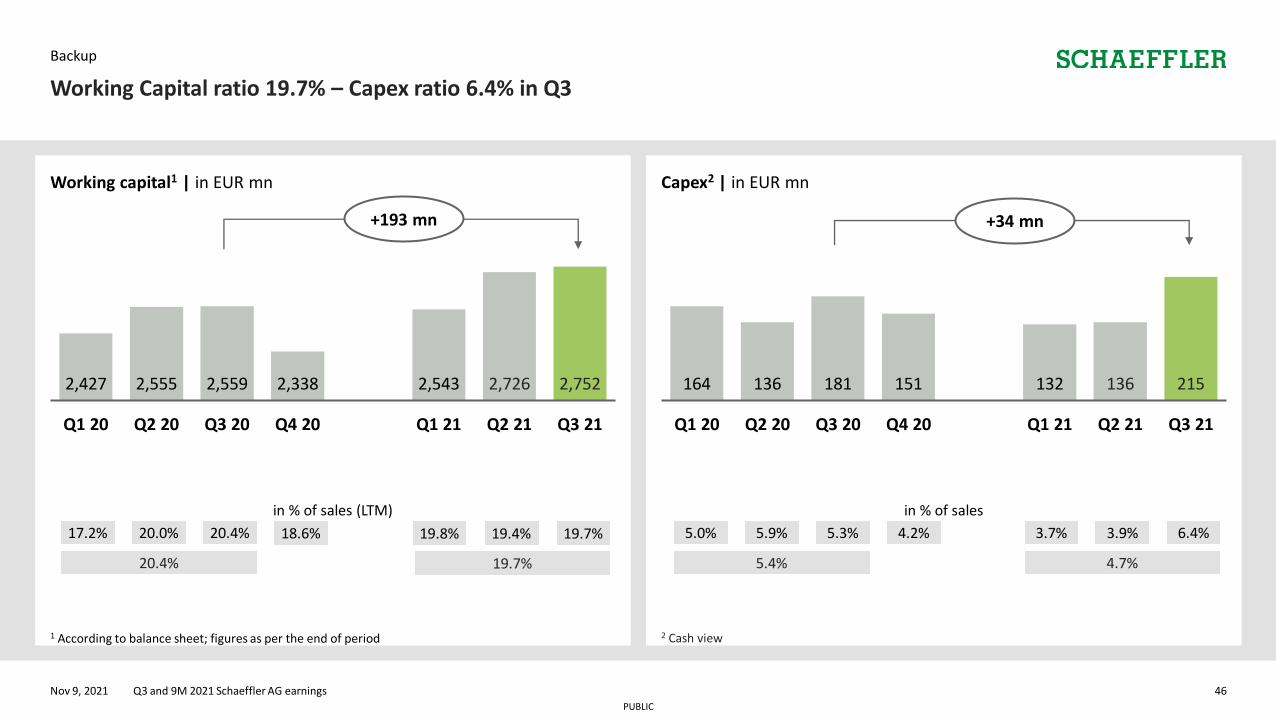
Working Capital ratio 19.7% – Capex ratio 6.4% in Q3
Backup
Q3 and 9M 2021 Schaeffler AG earnings
Working capital1 | in EUR mn
1 According to balance sheet; figures as per the end of period 2 Cash view
Capex2 | in EUR mn
164 136 181 151 132 136 215
Q1 20 Q2 20 Q3 20 Q4 20 Q1 21 Q2 21 Q3 21
2,427 2,555 2,559 2,338 2,543 2,726 2,752
Q1 20 Q2 20 Q3 20 Q4 20 Q1 21 Q2 21 Q3 21
in % of sales (LTM)
17.2% 20.0% 20.4% 18.6% 19.8%
20.4%
in % of sales
5.0% 5.9% 5.3% 4.2% 3.7%
5.4%
Nov 9, 2021 46
2 Cash view
+193 mn +34 mn
19.4% 3.9%
19.7% 4.7%
19.7% 6.4%

PUBLIC
Automotive Technologies (AT) outperformance by quarters
Backup
Q3 and 9M 2021 Schaeffler AG earnings
Q1 21
1 Light Vehicle production growth according to IHS Markit, October 2021 | 2 FX-adjusted sales growth of Automotive Technologies division
Q1 20 Q2 20
IHS1 AT2
Outper-formance
World +15.7% +15.8% +0.1pp
Europe +1.1% +3.4% +2.3pp
Americas -2.9% +6.0% +8.9pp
Greater China +79.2% +74.3% -4.9pp
Asia/Pacific +5.2% +13.6% +8.4pp
Q4 20Q3 20
IHS1 AT2
Outper-formance
World -22.2% -12.1% +10.1pp
Europe -15.7% -13.5% +2.2pp
Americas -11.6% -5.2% +6.4pp
Greater China -45.7% -22.8% +22.9pp
Asia/Pacific -13.5% -7.3% +6.2pp
IHS1 AT2
Outper-formance
-42.9% -41.9% +1.0pp
-58.2% -59.5% -1.3pp
-69.6% -62.5% +7.1pp
+10.2% +17.3% +7.1pp
-54.9% -41.9% +13.0pp
IHS1 AT2
Outper-formance
-2.4% -1.2% +1.2pp
-6.0% -9.3% -3.3pp
-3.1% +2.9% +6.0pp
+10.9% +14.2% +3.3pp
-12.9% -10.1% +2.8pp
IHS1 AT2
Outper-formance
+3.2% +8.0% +4.8pp
+1.1% +6.4% +5.3pp
+0.6% +9.1% +8.5pp
+6.1% +9.5% +3.4pp
+3.6% +9.1% +5.5pp
FY 20 Outperformance: +4.5pp
Nov 9, 2021 47
YTD 21 Outperformance: +6.6pp
Q2 21
IHS1 AT2
Outper-formance
+48.3% +65.3% +17.0pp
+81.9% +116.2% +34.3pp
+146.9% +136.4% -10.5pp
-4.3% +3.3% +7.6pp
+82.0% +62.5% -19.5pp
IHS1 AT2
Outper-formance
-19.7% -12.2% +7.5%
-27.1% -15.0% +12.1%
-23.4% -15.8% +7.6%
-16.5% -15.8% +0.7%
-12.7% +7.3% +20.0%
Q3 21

PUBLIC
Automotive Aftermarket | in EUR mnGroup | in EUR mn
Industrial | in EUR mnAutomotive Technologies | in EUR mn
1 FX-adjusted
Key figures by Group and division
Backup
Q3 and 9M 2021 Schaeffler AG earnings
Q1 20 Q2 20 Q3 20 Q4 20 Q1 21 Q2 21 Q3 21
Sales 2,008 1,256 2,161 2,391 2,281 2,084 1,921
Sales Growth1 -12.1% -41.9% -1.2% +8.0% +15.8% +65.3% -12.2%
EBIT Reported -223 -235 -75 189 238 154 108
EBIT bsi 47 -240 176 280 246 133 88
EBIT bsi margin 2.3% -19.1% 8.2% 11.7% 10.8% 6.4% 4.6%
Q1 20 Q2 20 Q3 20 Q4 20 Q1 21 Q2 21 Q3 21
Sales 3,281 2,291 3,391 3,626 3,560 3,454 3,332
Sales Growth1 -9.3% -34.5% -2.8% +4.5% +11.2% +50.6% -3.0%
EBIT Reported -90 -144 -188 274 388 355 278
EBIT bsi 212 -159 322 422 403 319 272
EBIT bsi margin 6.5% -6.9% 9.5% 11.6% 11.3% 9.2% 8.2%
Q1 20 Q2 20 Q3 20 Q4 20 Q1 21 Q2 21 Q3 21
Sales 827 734 774 797 836 902 911
Sales Growth1 -7.7% -18.2% -8.2% -3.0% +3.9% +24.0% +15.8%
EBIT Reported 56 63 -175 24 93 113 90
EBIT bsi 88 53 61 74 99 109 113
EBIT bsi margin 10.7% 7.2% 7.8% 9.3% 11.9% 12.0% 12.4%
Q1 20 Q2 20 Q3 20 Q4 20 Q1 21 Q2 21 Q3 21
Sales 446 301 456 438 444 467 500
Sales Growth1 +1.6% -30.5% -0.2% +1.3% +4.0% +54.1% +8.7%
EBIT Reported 77 28 62 61 57 88 80
EBIT bsi 77 28 86 67 57 77 71
EBIT bsi margin 17.2% 9.3% 18.8% 15.4% 12.9% 16.5% 14.3%
Adjusted comparative figures 2020
Nov 9, 2021 48

PUBLIC
Financing structure | as of September 30, 2021
Overview Corporate and Financing Structure
Backup
Q3 and 9M 2021 Schaeffler AG earnings
Corporate structure (simplified) | as of September 30, 2021
1 EUR/USD = 1.1579 | 2 After cross currency swaps | 3 Incl. commitment and utilization fees | 4 On October 4, 2021, Schaeffler AG has terminated variable SSD tranches in the amount of EUR 259 m. The early repayment will be made on November 11, 2021.
Debt instrument Nominal(USD m)
Nominal(EUR1 m)
Interest Maturity Rating(Fitch/Moody’s/S&P)
Loans RCF (EUR 800 m) - 200 E+2.25% Dec-24 Not rated
Bridge Facility (EUR 400 m) - 0 E+3.00% Feb-22 Not rated
Bonds 3.625% SSNs 2025 (EUR) - 800 3.625% May-25 BB/Ba2/BB-
3.75% SSNs 2026 (EUR) - 750 3.75% Sep-26 BB/Ba2/BB-
4.75% SSNs 2026 (USD) 500 432 4.75% Sep-26 BB/Ba2/BB-
3.875% SSNs 2027 (EUR) 500 3.875% May-27 BB/Ba2/BB-
6.00% SSNs 2027 (USD) 450 389 6.00% May-27 BB/Ba2/BB-
6.375% SSNs 2029 (USD) 400 345 6.375% May-29 BB/Ba2/BB-
Total IHO Verwaltungs GmbH 3,416 Ø 3.75%2,3
IHO Verwaltungs GmbH
IHO Beteiligungs GmbH
Continental AGSchaeffler AG
36.0%
INA-Holding Schaeffler GmbH & Co. KG
IHO Verwaltungs GmbH
54.0%75.1%24.9%
100%
100%
10.0%
A
A
Debt instrument Nominal(USD m)
Nominal(EUR1 m)
Interest Maturity Rating(Fitch/Moody’s/S&P)
Loans RCF (EUR 1,800 m) - - E+0.80% Sep-24 Not rated
Schuldschein Loans (EUR) - 5574 Ø 1.65% May-23, 25, 28 & 30 Not rated
CP Commercial Paper Program (EUR) - - - - Not rated
Bonds 1.125% SNs 2022 (EUR) - 545 1.125% Mar-22 BB+/Ba1/BB+
1.875% SNs 2024 (EUR) - 800 1.875% Mar-24 BB+/Ba1/BB+
2.750% SNs 2025 (EUR) - 750 2.750% Oct-25 BB+/Ba1/BB+
2.875% SNs 2027 (EUR) - 650 2.875% Mar-27 BB+/Ba1/BB+
3.375% SNs 2028 (EUR) - 750 3.375% Oct-28 BB+/Ba1/BB+
Total Schaeffler Group 4,052 Ø 2.47%3
Schaeffler AGB
Nov 9, 2021 49
Vitesco Technologies AG
10.0%
36.0%
Freefloat
Freefloat
Freefloat
B
54.0%