Q3 2017 Update: The State Of Distributed Solar to grow at a faster rate than Tesla/SolarCity, SunRun...
24
0 Perea - State of U.S. Solar Austin Perea Analyst, U.S. Solar [email protected] Q3 2017 Update: The State Of Distributed Solar
Transcript of Q3 2017 Update: The State Of Distributed Solar to grow at a faster rate than Tesla/SolarCity, SunRun...

0Perea - State of U.S. Solar
Austin Perea
Analyst, U.S. Solar
Q3 2017 Update: The State Of Distributed Solar

1Perea - State of U.S. Solar
The U.S. solar PV market installed over
2 GW
• Up 12% year-over-year
• Up 8% quarter-over-quarter
Utility PV – 1.4 GW
• ~60% of U.S. solar capacity in Q2 2017
DG remains smallest share of overall
quarterly capacity additions
Non-Residential – 436 MW
• Up 10% over Q1 2017
• Up 31% year-over-year
Residential – 563 MW
• Up 1% over Q1 2017
• Down 17% year-over-year
National-Level Market Overview – H1 2017
747941 964
2,110
1,364 1,287 1,395
2,205
1,342 1,434 1,430
3,285
2,0902,203
4,151
6,582
2,1322,387
0
1,000
2,000
3,000
4,000
5,000
6,000
7,000
Inst
alla
tio
ns
(MW
dc)
Residential Non-Residential Utility

2Perea - State of U.S. Solar
Unpacking Residential Solar’s Slowdown

3Perea - State of U.S. Solar
Residential solar continues to face challenges Quarterly Residential PV Installed Capacity (MWdc) Q1 2012-Q2 2017
111 128
148 169 171
195
261 249 279
328
410
461
501
593 612
672 679
607 638
555 563
-
100
200
300
400
500
600
700
800
Cap
acit
y (M
Wd
c)
4Perea - State of U.S. Solar
Despite strong near-term policy certainty, major residential state markets are struggling
-50%
0%
50%
100%
150%
200%
250%
300%
Year
-ove
r-Ye
ar G
row
th (
%)
Top Five Markets Year-over-Year Growth
California Arizona New York Maryland New Jersey
Q2 2017 marks first quarter top five states all
experience YoY decline
41%
9%7%
7%
6%
30%
Q2 2017 State Market Shares
California
Arizona
New York
Maryland
New Jersey
All Others
Top Five state markets account for
70% of national installations

5Perea - State of U.S. Solar
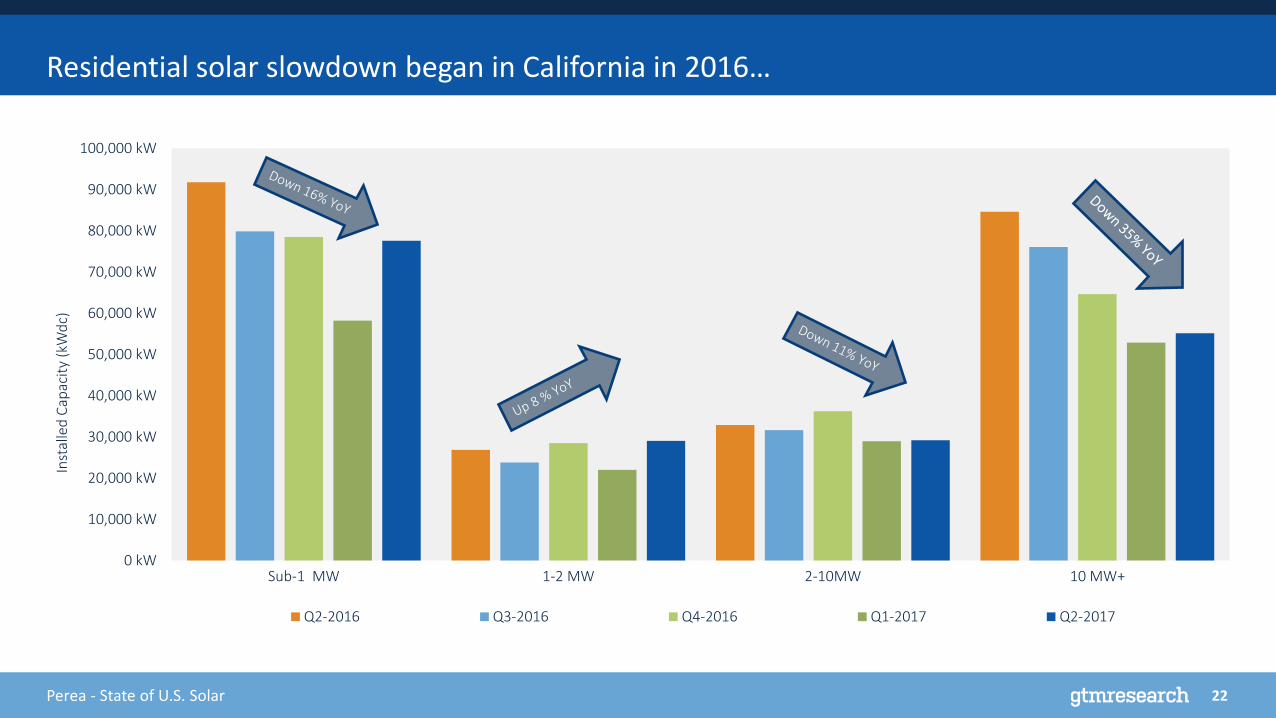
Residential solar slowdown began in California in 2016…
0 kW
10,000 kW
20,000 kW
30,000 kW
40,000 kW
50,000 kW
60,000 kW
70,000 kW
80,000 kW
90,000 kW
100,000 kW
Sub-1 MW 1-2 MW 2-10MW 10 MW+
Inst
alle
d C
apac
ity
(kW
dc)
Q2-2016 Q3-2016 Q4-2016 Q1-2017 Q2-2017
-60%
-50%
-40%
-30%
-20%
-10%
0%
10%
20%
30%
40%
0
20
40
60
80
100
120
140
160
180
200
Q1-2016 Q2-2016 Q3-2016 Q4-2016 Q1-2017 Q2-2017
Year-over-Year G
row
th
MW
Inst
alle
d
SolarCity All Others
SCTY YoY Growth All Others YoY Growth
California Installation Volumes by Installer SizeSolarCity vs. All Other Installers in California:
Capacity and Year-over-Year Growth
Residential solar slowdown began in California in 2016…

6Perea - State of U.S. Solar
…and hit Northeast markets in full force in H1 2017
-80%
-60%
-40%
-20%
0%
20%
40%
60%
80%
100%
120%
140%
New York Maryland New Jersey Massachusetts
Year
-ove
r-Ye
ar G
row
th (
%)
Q2-2016 Q3-2016 Q4-2016 Q1-2017 Q2-2017
0.0
10.0
20.0
30.0
40.0
50.0
60.0
70.0
New York Maryland New Jersey Massachusetts
Cap
acit
y (M
Wd
c)
Q2-2016 Q3-2016 Q4-2016 Q1-2017 Q2-2017
Northeast Markets Q2 2016-Q2 2017 Residential Installations Northeast Markets Q2 2016-Q2 2017 Year-over-Year Growth

7Perea - State of U.S. Solar
Growing pains among the national residential solar providers…Transitioning away from unabated market share capture to profitable growth
90%106%
66%
-1%
45%24%
78%
45%
-20%0%
20%40%60%80%
100%120%
2013 2014 2015 2016An
nu
al G
row
th (
%)
Growth Rate (SolarCity, Sunrun, Vivint Solar)
Growth Rate (Rest of Residential Market)
$0.00$0.10$0.20$0.30$0.40$0.50$0.60$0.70$0.80
SolarCity,Vivint Solar,
Sunrun
Large Regional(over 2
MW/quarter)
Mid-SizeRegional (1-2MW/quarter)
Large Local(100 kw-1
MW/quarter)
Long Tail
20
16
Avg
Co
st (
$/W
)
0%
20%
40%
60%
80%
100%
SolarCity Vivint Solar Sunrun All Others
Shar
e o
f To
tal
Dep
loym
ents
Third-Party Owned Customer Owned
Source: GTM Research
Annual Growth Rates: SCTY+RUN+VSLR vs. Rest of Residential PV Market Quarterly Residential PV TPO Market Shares in 2016: National vs. California
Source: GTM Research
2016: TPO Market Shares by Residential PV Company
Source: GTM Research
In aggregate: National residential PV companies have a more than 3x higher costof customer acquisition than the long tail of installers

8Perea - State of U.S. Solar
Emerging Markets – Quarterly Installed Capacity Q1 2015-Q2 2017
-
5.0
10.0
15.0
20.0
25.0
30.0
35.0
Utah South Carolina Texas Florida Pennsylvania
Cap
acit
y (M
Wd
c)
Q1-2015 Q2-2015 Q3-2015 Q4-2015 Q1-2016 Q2-2016 Q3-2016 Q4-2016 Q1-2017
9Perea - State of U.S. Solar
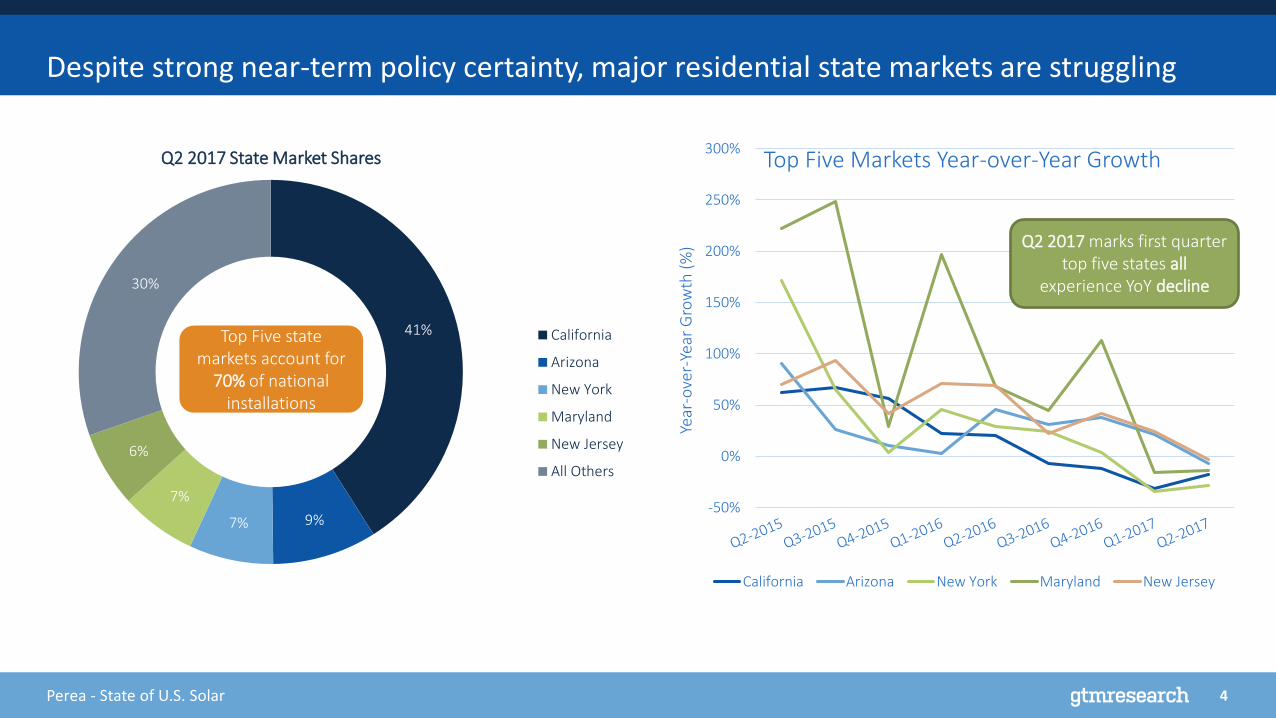
Recent regulatory and policy wins have potential to open up new markets – NV, IL
Nevada PUC’s decision to pull-back NEM and not grandfather
had huge impact
• #7 in 2015 vs. #11 in 2016 vs. #20 in Q2 2017
• Installations trickled into H1 2016 as they were energized, but stark dropoff
thereafter
AB 405 decision to restore NEM opens up major new market
opportunity though NV Energy general rate proceeding
threatens long-term outlook
Illinois’ new RPS program rethinks REC program
Adjustable Block Incentive (ABI) 15 year REC program
• Sets capacity procurement targets – ~330-675 MW by 2020
• Upfront REC functions like cash rebate program, but doesn’t diminish tax
eligible basis of project, resulting in higher value proposition for customer
• Reduces volatility of SREC; appeases finaciers
1 4 625
59
84
118
156
0
50
100
150
200
2015 2016 2017E 2018E 2019E 2020E 2021E 2022E
Cap
acit
y (M
Wd
c)
Illinois Forecast 2015-2022E
-
5.0
10.0
15.0
20.0
25.0
30.0
35.0
40.0
Cap
acit
y (M
Wd
c)
Nevada Quarterly Installations

10Perea - State of U.S. Solar
Major Trends Defining Residential Solar in 2017
• The “long tail” of installers, with cheaper customer acquisition costs, are on
track to grow at a faster rate than Tesla/SolarCity, SunRun and Vivint
collectively
• And the “Big Three’s” pursuit of profitable sales and lower customer
acquisition costs will result in a the market contacting 3% from 2016
• Major markets continue to struggle despite strong policy environment
2017 marks the first time…
• California will fall on annual basis this decade
• Direct ownership will drive the majority of annual installations since 2011
• More than half of all states in the U.S. will be at grid parity in H2 2017
◦ Emerging state markets outside the top 5 (CA, AZ, NJ, NY and MD) to
grow 20% in a year of flat national level demand
◦ Q2 2017 second consecutive quarter in which emerging state (Utah,
Texas) replaces major state (MA) at #6 largest market
The Near Term Residential PV Outlook: Defined by market transitions
109%
15%
52%
65%
50%
95%
38%
54%
64%
75%
82%
72%
5%
45%
23%20%
-13%
2%5%
-3%
-20%
0%
20%
40%
60%
80%
100%
120%
California Next Five States All Other States Total
Axi
s Ti
tle
2013 2014 2015 2016 2017E

11Perea - State of U.S. Solar
Non-Residential Solar’s Reboot: Growth Beyond Standalone Onsite Solar to Community Solar

12Perea - State of U.S. Solar
Policy and Incentive Driven Bubbles Support 2017 Rebound
The Top 4 States: Partly fueled by short lived market drivers
• California: The closure of solar-friendly rate structures
• Massachusetts: Pull-in of demand amidst closure of SREC programs
• New Jersey: RPS driven demand for SRECs pulled in from future years
• New York: Depleting pipeline of virtual/remote NEM projects
What’s driving a reboot in all other states?
• The emergence of community solar: 220 MW+ installed in 2016
◦ Utility led community solar: Drove more than 60% of community solar
◦ Top 3 community solar states in 2017: CA, MA and MN
After 3 Consecutive Years of Flat Demand: Non-Residential PV Grew by 50%+ in 2016, expected to grow 9% in 2017E
0
100
200
300
400
500
600
700
800
Cap
acit
y (M
Wd
c)
2013 2014 2015 2016 2017E

13Perea - State of U.S. Solar
Emergence of Community Solar: Legislative and Voluntary Segments Both Set to Scale
126 9 6
2952
223
410
0
100
200
300
400
500
600
700
20
10
20
11
20
12
20
13
20
14
20
15
20
16
20
17
E
20
18
E
20
19
E
20
20
E
20
21
E
An
nu
al In
stal
lati
on
s (M
Wd
c)
Third Party Led Utility Led
3744
62
26
227
113
0
50
100
150
200
250
Coop IOU Muni
Uti
lity
Led
Co
mm
un
ity
Sola
r (M
Wd
c)
Operating In Development
Source: <Insert source>
Community Solar Installation Outlook:Third Party Led vs Utility Led Community Solar
Source: <Insert source>
Within Utility Led Community Solar:Emergence of IOUs Procuring Large Scale Community Solar
14Perea - State of U.S. Solar
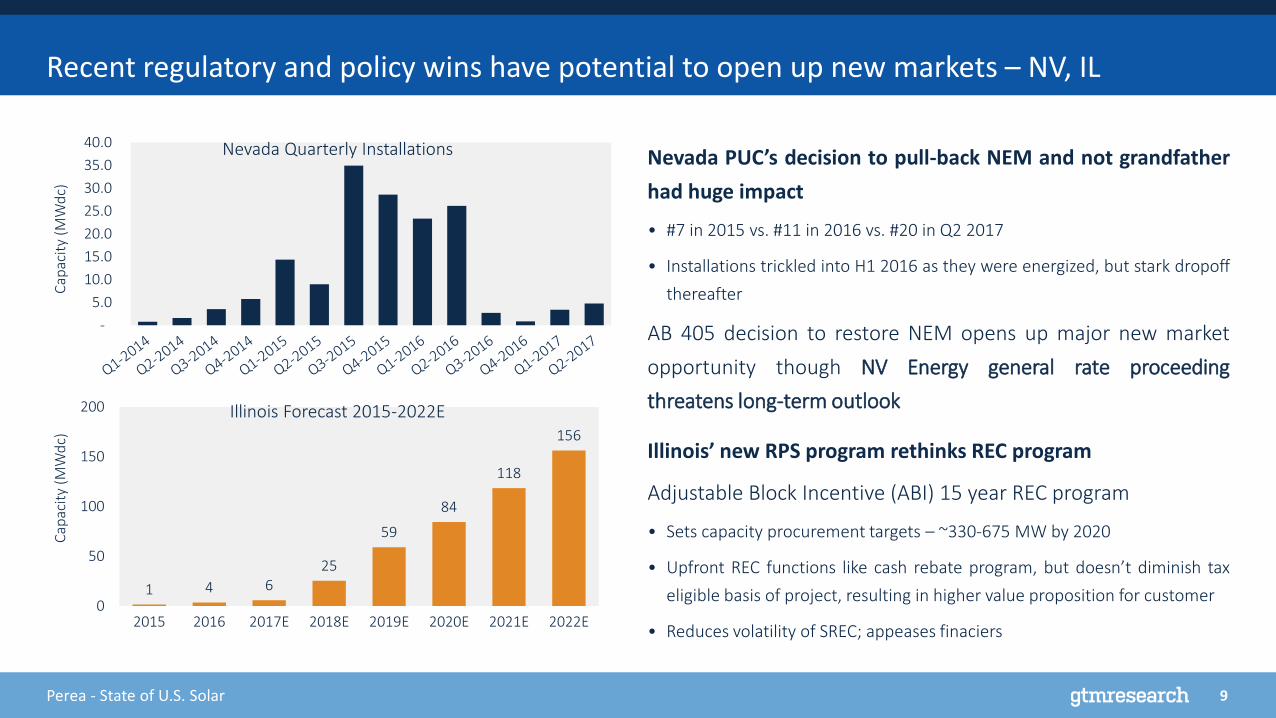
Non-Residential PV Outlook: Moving Beyond Onsite, Standalone Solar
8351,075 1,110 1,063 1,062
1,5861,756 1,671
1,9332,127
2,471
2,859
0%
10%
20%
30%
40%
50%
60%
70%
80%
90%
100%
0
500
1,000
1,500
2,000
2,500
3,000
3,500
2011 2012 2013 2014 2015 2016 2017E 2018E 2019E 2020E 2021E 2022E
Share o
f An
nu
al Installatio
ns (%
)A
nn
ual
Inst
alla
tio
ns
(MW
dc)
Non-Residential Community Solar Solar-Plus-Storage Onsite Solar
2021: Less than 50% of annual non-residential PV installations will be onsite, standalone PV
2016: First year < 90% of non-residential PV market came from onsite PV

15Perea - State of U.S. Solar
The Next 5 Years of U.S. Solar

16Perea - State of U.S. Solar
1. Macro level uncertainty: Solar trade dispute, corporate tax reform, NEM and rate reform risk
What comes next for U.S. solar?

17Perea - State of U.S. Solar
1. Macro level uncertainty: Solar trade dispute, corporate tax reform, NEM and rate reform risk
2. Residential Solar: Near term contraction, sub 12% annual growth in a more fragmented installer landscape, paired with the emergence of loans and cash sales collectively outpacing third party owned leases and PPAs
3. Non-Residential Solar: Continued growth hinges on community solar (near term) and solar-plus-storage (long term) amidst state incentive reductions and TOU rate reforms across major markets
What comes next for U.S. solar?
4. Utility Solar: On track for another boom in procurement heading into 2019 in response to the scheduled stepdown of the 30% federal ITC, supporting growth in the 2019-2021 timeframe

18Perea - State of U.S. Solar
Total Installed Capacity triples by 2022, reaches 16 GW annually
September 29, 2017www.seia.org18
0
2,000
4,000
6,000
8,000
10,000
12,000
14,000
16,000
18,000
2010 2011 2012 2013 2014 2015 2016 2017E 2018E 2019E 2020E 2021E 2022E
Year
ly In
stal
led
So
lar
Cap
acit
y (M
Wd
c)
U.S. Solar PV Deployment Forecast
Residential (PV) Non-residential (PV) Utility (PV)Source: SEIA/GTM
Research U.S. Solar Market
Insight

20Perea - State of U.S. Solar
Appendix: Utility-Scale Trends
21Perea - State of U.S. Solar
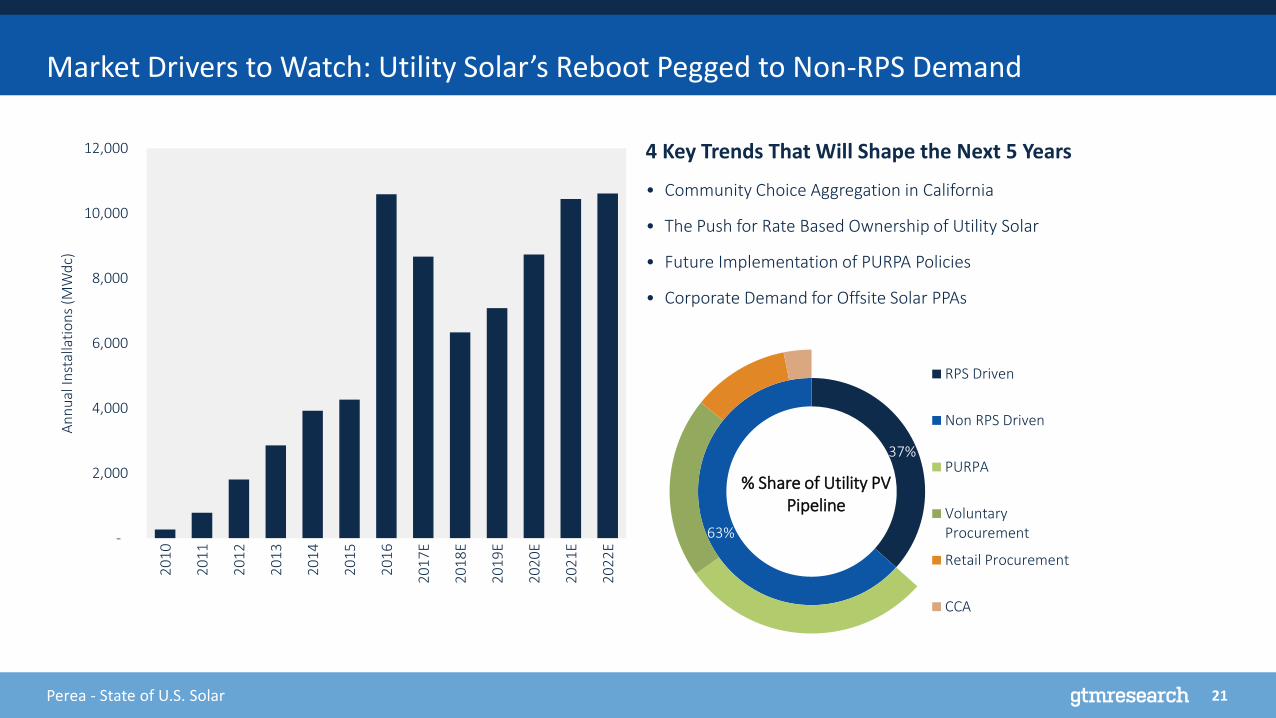
4 Key Trends That Will Shape the Next 5 Years
• Community Choice Aggregation in California
• The Push for Rate Based Ownership of Utility Solar
• Future Implementation of PURPA Policies
• Corporate Demand for Offsite Solar PPAs
Market Drivers to Watch: Utility Solar’s Reboot Pegged to Non-RPS Demand
37%
63%
RPS Driven
Non RPS Driven
PURPA
VoluntaryProcurement
Retail Procurement
CCA
% Share of Utility PV Pipeline
-
2,000
4,000
6,000
8,000
10,000
12,0002
01
0
20
11
20
12
20
13
20
14
20
15
20
16
20
17
E
20
18
E
20
19
E
20
20
E
20
21
E
20
22
E
An
nu
al In
stal
lati
on
s (M
Wd
c)
22Perea - State of U.S. Solar
Residential solar slowdown began in California in 2016…
0 kW
10,000 kW
20,000 kW
30,000 kW
40,000 kW
50,000 kW
60,000 kW
70,000 kW
80,000 kW
90,000 kW
100,000 kW
Sub-1 MW 1-2 MW 2-10MW 10 MW+
Inst
alle
d C
apac
ity
(kW
dc)
Q2-2016 Q3-2016 Q4-2016 Q1-2017 Q2-2017

23Perea - State of U.S. Solar
U.S. Solar Market Outlook: Resumption of market growth in 2019
0.9 1.9
3.4
4.8
6.2 7.5
15.0
12.5
11.1
13.1
15.0 16.3
17.4
-
2.0
4.0
6.0
8.0
10.0
12.0
14.0
16.0
18.0
20.0
2010 2011 2012 2013 2014 2015 2016 2017E 2018E 2019E 2020E 2021E 2022E
An
nu
al P
V In
stal
lati
on
s (G
Wd
c)
Residential Non-Residential Utility
Resumption of total market growth
Return to 2016 installation levels