Q2’2017 RESULTS PRESENTATION - Euronext · PDF fileQ2’2017 RESULTS PRESENTATION 28...
19
Q2’2017 RESULTS PRESENTATION 28 July 2017
Transcript of Q2’2017 RESULTS PRESENTATION - Euronext · PDF fileQ2’2017 RESULTS PRESENTATION 28...

Q2’2017 RESULTS PRESENTATION
28 July 2017

EURONEXT PRESENTING TEAM
2 28 July 2017
Giorgio Modica Stephane Boujnah
Lee Hodgkinson
Group Chief Financial Officer
CEO & Chairman of the Managing Board
Head of Markets & Global Sales
Anthony Attia
Global Head of Listing

EXECUTIVE SUMMARY
3
I
Strong performance in Q2’2017 with solid trading and listing activities
Strengthening core business and delivering on growth initiatives
28 July 2017
Revenues of €137.3 million in Q2’2017 compared to €132.3 million in Q2’2016, up +3.8% Strong EBITDA, at €79.2 million, representing an EBITDA margin of 57.7%
II Cash equity market share at 64.2% for Q2’2017, up from 61.3% in Q2’2016 Successful completion of the TOM migration in Amsterdam Launch of the Euronext Block MTF for equities Successful delivery of Optiq® Market Data Gateway
Disciplined acquisitions
III FastMatch, the fastest growing ECN in the spot FX market, expected to close in Q3’2017 iBabs, the innovative digital board portal solution, complementing Euronext Corporate Services offering,
with closing expected in Q3’2017

Q2’2017 FINANCIAL HIGHLIGHTS
4
REVENUES
€137.3m +3.8%
€15.3m
of cumulated
gross efficiencies
OPERATING EXPENSES ex. D&A
€58.1m +6.3%
EBITDA MARGIN
57.7%
NET PROFIT
€53.9m EPS
€0.78 (basic)
CASH POSITION
€81.2m As at 30
June 2017
HEADCOUNT
615 (629 as of 31th March
2017)
Record revenues supported by an improved financial and macro environment
Increase in operating expenses excl. D&A driven by IT project & business initiatives
Decrease in headcount as of 30 June 2017 vs. end of Q1’2017, following the completed migration of resources to the new technology centre in Porto, and despite additional headcount related to the consolidation of Company Webcast
€15.3m of cost savings achieved since Q2 2016, slightly down compared to Q1 2017 due to costs related to the Optiq® and MiFID II projects
Agility for Growth initiatives contributed €1.6m revenues and €1.9m operating expenses
€1.4m of exceptional costs, mainly due to restructuring
Net cash position of €81.2m at 30 June 2017 with no outstanding financial debt
28 July 2017

45.8 50.3
10.2 10.4
12.3 13.3
23.3 23.6
27.3 26.0
8.5 8.4 5.0 5.2
Q2'2016 Q2'2017
Custody &Settlement
Market Solutions &Other revenue
Market Data &Indices
Listing
Clearing
Derivatives trading
Cash trading
+25.0%
-19.3%
+2.4%
+26.4%
+17.5%
-1.9%
5.0 6.3
3.0 2.4
6.8 7.0
9.0 11.4
4.3
5.1
26.4
25.9
Q2'2016 Q2'2017
Staff Expenses
System &Communication
Professional Services
Clearing expenses
Accommodation
Other expenses
RECORD PERFORMANCE DESPITE AN INCREASE IN OPERATING EXPENSES
5
132.3 137.3
+3.8%
1) Volume-related businesses include IPO fees, cash and derivatives trading and clearing revenues. Follow-ons, bonds and other listing revenues are considered as non-volume related due to their lower volatility.
2) Include other income of €0.1m in Q2’2017 and €0.2m in Q2’2016
Revenues In €m
Volume related 1)
54%
Volume related 1)
55%
+2.2%
+8.0%
+1.1%
-4.6%
-0.2%
28 July 2017
54.6 58.1
+6.3%
Operating expenses
In €m
+5.4%
+9.8%
2)

141.2
292.4
81.2
250.0
38.8
250.0
98.8
Q1'2017 Dividendpayment
Cashaccumulation
Q2'2017
Targeted cashfor operation
RCF
Cash & CashEquivalent
STRONG CASH FLOW GENERATION AND LIQUIDITY POSITION
6
EBITDA / operating cash flow conversion rate Balance sheet
Liquidity1) Net debt
Assets Liabilities & Equity
391.2 331.2
60%
17%
23%
72%
12%
16%
In €m In €m
756.7 756.7 742.8 742.8
110
28 July 2017 1) The new revolving credit facility was set up in April but reported as at 31 March 2017 for consistency
In €m
77.7 79.2
42.0 44.2
Q2'2016 Q2'2017
EBITDA
Net operatingcash flow
54% 56%
141.2 81.2
102.0 106.8
328.9 331.5
184.6 223.4
Q1'2017 Q2'2017
Other non-current assetsGoodwill & other intangiblesOther current assetsCash & Cash Equivalent
140.1 131.5 30.7 35.1
585.9 576.2
Q1'2017 Q2'2017
Equity
Other non-current liabilities
Current liabilities
-141.2
-81.2
Q1'2017 Q2'2017
In €m

7.5 8.4
8.4 7.7
5.1 3.5
1.2 2.2
1.1 1.8
Q2'2016 Q2'2017Annual fees Follow ons IPOs Other Bond fees
2.8 1.5
86.1
104.3
Q2'2016 Q2'2017
Large Caps SMEs
STRONG QUARTER IN LISTING SUPPORTED BY LARGE SECONDARY MARKET OPERATIONS
7
Listing Fees Money raised1)
Continuation of the positive trend seen in primary markets with the listing of ALD, the first large cap deal in Paris since November 2015, and numerous follow-ons operations on the secondary market
Positive impact of the new SME market model with a reported increase of volumes for SMEs trading in auction of +10% since launch
New milestones reached in the EU Tech Hub initiative with Euronext team established in Germany, Italy, Spain and Switzerland, and the IPO of X-Fab, a German-based semi-conductor company in April
23.3 23.6
+1.1% # of listings
14 9 In €m In €bn
28 July 2017 1) Total money raised figures revised as from January 2017. Corporate bonds figures revised as from January 2017 to
exclude Euronext listed financials issuers and to regroup them in a broader newly created financial bonds category. Total money raised also now includes Public/Semi-Public bonds category not reported before, created as from January 2017.
88.9
105.8
+18.9%

8
BUILDING UP A COMPLETE CORPORATE SERVICES OFFERING
Listed companies
ADVISORY
Private companies
SOLUTIONS
Relationship management Webcast Governance
PRE LISTING SERVICES
POST LISTING SERVICES
Since March 2017
Complete and intuitive Investor Relationship Management and Targeting platform for corporate Investor Relations teams Analytics Roadshow support Engagement
Since February 2017
Comprehensive range of webcast, webinar and conference call services for all types of Investor Relations and corporate events Webcasts Events Visibility
Since July 2017
Dematerialized board portal solution and decision making tool for corporates and public organisations Board management Confidentiality Transparency
Acquisition of iBabs, tangible progress of the build-up of the offering
On-going commercial roll out of the existing services with positive developments and new clients
Continuous enhancement of existing services with increasing integration and new features
Potential to complement current offer with additional services
28 July 2017
2016 2017
Organic Organic Organic Bolt-on Bolt-on
Launched in 2016
Tailor-made and independent financial advisory for small private companies during their IPO process Investor access IPO execution
Launched in 2016
Advisory, market intelligence and decision making analytics for listed companies willing to be more active on capital markets Shareholder analysis Investor access Perception studies Market intelligence

POSITIVE SENTIMENT FOR EUROZONE CONTINUES
Long volatility down-trend continued into 2017. Volatility level at 14.5 in May, the lowest since January 2015
Confidence in European equities accelerated in recent months and reached above US level for the first time since Dec 2015. Together with positive economic outlook, this is creating favourable environment for our volume
9
Post French elections momentum
28 July 2017

0.50 0.48
Q2'2016 Q2'2017
20%
40%
60%
80%
Jan-12 Jul-12 Jan-13 Jul-13 Jan-14 Jul-14 Jan-15 Jul-15 Jan-16 Jul-16 Jan-17
Euronext Market Share MTF Market Share
STRENGTHENED MARKET SHARE AND STRONGER CASH TRADING VOLUMES
10
Market share
Market quality Average daily turnover Q2’2017/Q2’2016 (€m)
Significant achievements in key projects: Launch of Euronext Fund services, an innovative and complementary solution for investing in open-end funds registered or
passported in France FCA approval for Euronext Block, the new block trading service for equities, in partnership with AX Trading Euronext Synapse technology delivered, client testing now open for the fixed-income MTF developed in collaboration with Algomi
Announced withdrawal of the extension of the financial transaction tax to intraday transactions in France
Continued strong performance in ETF with the listing of 26 new products, bringing the total numbers of ETFs to 809, and the onboarding of a new issuer, Candriam
Revenue per trade (in basis point)
Q2’2017 market share: 64.2%
28 July 2017
-4.0%
Blue Chips Presence
time at EBBO (%)
EBBO with greatest size
(%)
EBBO setter (%)
Relative spread (bps)
Displayed market
depth (€) (30 June
2017)
Euronext 89% 54% 73% 3.98 63,838
BATS Europe
37% 0% 3% 8.73 17,919
Chi-X 67% 3% 13% 5.86 22,430
Equiduct 2% 0% 0% 65.19 31,927
Turquoise 55% 1% 8% 7.28 21,662
7,077 6,456
560
35 27
8,386 7,819
501
42 24
TOTAL CASH EQUITIES ETF STRUCT. PRODS BONDS
Q2'2016
Q2'2017
+18.5% +21.1% -10.6% +19.1% -8.5%

0.32
0.27
Q2'2016 Q2'2017
IMPROVED COMPETITIVE LANDSCAPE IN DERIVATIVES TRADING
11
Euronext – number of contracts traded (lots in m) Average daily volume Q2’2017/Q2’2016 (‘000)
Revenue per lot (€) Market share on Individual equity options - Amsterdam
Increasing trading activity in financial derivatives, recording the most active quarter for individual equity options since Q1’2014
Successful completion of the migration of open interest from TOM 5.6 million contracts migrated to Euronext at marginal rate, impacting revenue capture at the end of the quarter Euronext market share on AEX index options at 100% at the end of the quarter
Success of the New Market Participant programme with 17 firms trading commodities, 8 of them for the first time on Euronext
28 July 2017
-15.8%
17.2 14.0 15.1 17.7 16.0 16.0 15.6 13.3 15.2 14.1 12.0 13.7 14.3 15.2
18.3
15.9 15.5 17.1
15.5 14.3 16.3 14.0
15.7 14.5
12.3 14.8 15.9
20.7
3.2
2.4 3.7
3.9 3.1 3.4
4.4
3.3 3.9
3.6
3.3 3.0
3.4
3.1
Q1'14 Q2'14 Q3'14 Q4'14 Q1'15 Q2'15 Q3'15 Q4'15 Q1'16 Q2'16 Q3'16 Q4'16 Q1'17 Q2'17
Index Equity Commodities
495
221 178
39 55
630
331
189
57 50
TTL DERIVS. EQUITY OPTS. INDEX FUTURES INDEX OPTS COMMODITIES
Q2'2016
Q2'2017
+49.8% +6.0% +45.7% -8.5% +27.3%
0%
20%
40%
60%
80%
100%
2015
-01
2015
-02
2015
-03
2015
-04
2015
-05
2015
-06
2015
-07
2015
-08
2015
-09
2015
-10
2015
-11
2015
-12
2016
-01
2016
-02
2016
-03
2016
-04
2016
-05
2016
-06
2016
-07
2016
-08
2016
-09
2016
-10
2016
-11
2016
-12
2017
-01
2017
-02
2017
-03
2017
-04
2017
-05
2017
-06
Euronext TOM

3.9
5.8
Q1'2016 Q1'2017
4.6
6.5
Q2'2016 Q2'2017
0.7
2.4
Q1'2016 Q1'2017
1.3
2.6
Q2'2016 Q2'2017
11.0
17.7
Q1'2016 Q1'2017
12.9
20.5
Q2'2016 Q2'2017
4.4%
7.9%
Q1'2016 Q1'2017
5.7%
9.4%
Q2'2016 Q2'2017
12
ADV1) ($bn)
EBITDA3) ($m)
Revenues3) ($m)
1
EBITDA Margin
16.9% 41.0% 39.6%
Market share2)
27.6%
Source: FastMatch 1) Traded volume in $ 2) Market share is defined as percentage of total ADV among publicly reporting Spot FX venues 3) All figures are unaudited
CLOSING OF THE FASTMATCH ACQUISITION EXPECTED IN Q3 TRADING UPDATE
28 July 2017
+48.8%
x2.1
+59.5%
x3.6
+43.3% +60.8%
+371bps +350bps
Acquisition expected to close in Q3’2017
Growth in average daily traded volume remained strong over the quarter at +59.5% compared to Q2’2016
Continued increasing market share

8.2 8.3
Q2'2016 Q2'2017
12.3
5.0
13.3
5.2
Clearing Custody & Settlement
Q2'2016
Q2'2017
27.3 26.0
Q2'2016 Q2'2017
NON-TRANSACTIONAL BUSINESSES
13
Mar
ket
dat
a an
d
ind
ice
s M
arke
t so
luti
on
s P
ost
-tra
de
Positive impact of MiFID II projects and related work for commercial technology clients
Second phase of MiFID II upgrade successfully delivered for commercial UTP
Completion of Head of Terms for Atos to become the sales and delivery partner for Optiq®, with first commercial work approved in June and started in July
Decrease in revenues due to large contractual audit findings in Q2’2016
Launch of two new indices in collaboration with Morningstar: the Morningstar Developed Markets Europe 100 and the Morningstar Euro 50 indices
New pricing scheme for market data to be implemented in Q3’2017 in accordance with MiFID II requirements relating to disaggregation of data
In €m
In €m
Clearing revenues benefited from stronger derivatives trading activity and higher treasury and other clearing income
EuroCCP technically live with all Euronext markets and conformance testing ongoing with largest clearing members
Revenues growth in Interbolsa driven by an increase of settlement, public debt and equities under custody
In €m
28 July 2017
-4.6%
+1.7%
+8.0% +5.4%

OPTIQ® BENEFITS NOW VISIBLE TO CLIENTS
14 28 July 2017
OPTIQ® STEP 1
Migration to the new Market Data
Gateway
CASH AND DERIVATIVES
OPTIQ® STEP 2
Migration to the
new order entry gateway and
matching engine
CASH
Migration to Market Data Gateway is close to completion, delivering on company objectives with positive client feedback
Planning has been adjusted in a risk balanced approach, leveraging stakeholders feedback
Excellent stability
Outstanding performance
High flexibility to reduce time to market
MiFID II requirements on market data
Delivery planning
Client readiness
Regulatory constraints
"The new feed is very stable and the move onto production for us was surprisingly smooth" - NL bank
"We love MDG and can't wait for OEG: the performance improvements are huge!" - UK prop firm
6-month client testing requested
Clients overloaded in Q4 2017
Market Data Gateway for cash live since 10 July
Parallel run on Market Data Gateway for derivatives since 24 July
Start of customer testing in August 2017
Order entry and matching engine to go live on 12 March 2018

APPENDICES

INCOME STATEMENT
16 28 July 2017
Income statement (unaudited)
In €m Q2'17 Q2'16 var %
Revenues
Listing 23.6 23.3 1.1%
Trading revenues, of which
Cash Trading 50.3 45.8 9.8%
Derivatives Trading 10.4 10.2 2.2%
Market Data & indices 26.0 27.3 -4.6%
Post-trade, of which
Clearing 13.3 12.3 8.0%
Custody and Settlement 5.2 5.0 5.4%
Market Solutions & other revenues 8.3 8.2 1.7%
Other income 0.1 0.3 -62.4%
Total Revenues 137.3 132.3 3.8%
Expenses
Salaries and employee benefits (25.9) (26.4) -1.9%
Depreciation & Amortisation (3.3) (3.8) -12.8%
Other Operational Expenses, of which
System & Communication (5.1) (4.3) 17.5%
Professional Services (11.4) (9.0) 26.3%
Clearing expenses (7.0) (6.8) 2.4%
Accommodation (2.4) (3.0) -19.4%
Other Operational Expenses (6.3) (5.0) 25.0%
Total Expenses (61.4) (58.4) 5.1% EBITDA margin 57.7% 58.7%
Operating profit before Exceptional items 75.9 73.9 2.7%
Exceptional items (1.4) (5.2) -73.0%
Operating profit 74.5 68.7 8.4%
Net financing income / (expense) (0.4) (0.8) -47.2%
Results from equity investments 4.0 4.5 -11.3%
Profit before income tax 78.0 72.4 7.9%
Income tax expense (24.0) (23.0) 4.3%
Minority interests (0.1) -
Profit for the period 53.9 49.3 9.3%

BALANCE SHEET
17 28 July 2017
Summary balance sheet (unaudited)
In €m 30-Jun-17 31-Mar-17
Non-current assets
Property, plant and equipment 27.9 28.7
Goodwill and other intangible assets 331.5 328.9
Investments in associates and JV 16.0 16.0
Available-for-sale financial assets 166.9 126.6
Other non-current assets 12.5 13.2
Total non-current assets 554.9 513.4
Current assets
Cash & cash equivalents 81.2 141.2
Other current assets 106.8 102.0
Total current assets 187.9 243.2
Total assets 742.8 756.7
Equity
Shareholders' equity 575.6 585.4
Non-controlling interests 0.5 0.4
Total Equity 576.2 585.9
Non-current liabilities
Borrowings 0.1 0.1
Other non-current liabilities 35.0 30.6
Total Non-current liabilities 35.1 30.7
Current liabilities
Trade and other payables 96.7 109.4
Other current liabilities 34.8 30.7
Total Current liabilities 131.5 140.1
Total equity and liabilities 742.8 756.7
CASH FLOW & LIQUIDITY
18 28 July 2017
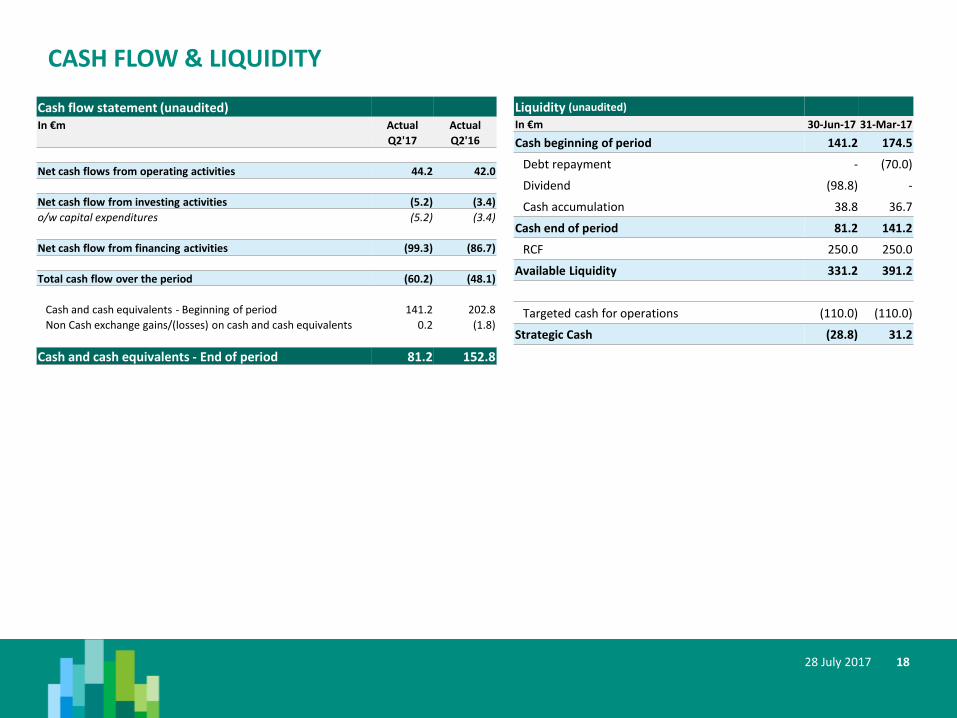
Cash flow statement (unaudited) In €m Actual Actual
Q2'17 Q2'16
Net cash flows from operating activities 44.2 42.0
Net cash flow from investing activities (5.2) (3.4)
o/w capital expenditures (5.2) (3.4)
Net cash flow from financing activities (99.3) (86.7)
Total cash flow over the period (60.2) (48.1)
Cash and cash equivalents - Beginning of period 141.2 202.8
Non Cash exchange gains/(losses) on cash and cash equivalents 0.2 (1.8)
Cash and cash equivalents - End of period 81.2 152.8
Liquidity (unaudited) In €m 30-Jun-17 31-Mar-17
Cash beginning of period 141.2 174.5
Debt repayment - (70.0)
Dividend (98.8) -
Cash accumulation 38.8 36.7
Cash end of period 81.2 141.2
RCF 250.0 250.0
Available Liquidity 331.2 391.2
Targeted cash for operations (110.0) (110.0)
Strategic Cash (28.8) 31.2
DISCLAIMER
19
This presentation is for information purposes only and is not a recommendation to engage in investment activities. The information and materials contained in this presentation are provided ‘as is’ and Euronext does not warrant as to the accuracy, adequacy or completeness of the information and materials and expressly disclaims liability for any errors or omissions. This presentation contains materials (including videos) produced by third parties and this content has been created solely by such third parties with no creative input from Euronext. It is not intended to be, and shall not constitute in any way a binding or legal agreement, or impose any legal obligation on Euronext. All proprietary rights and interest in or connected with this publication shall vest in Euronext. No part of it may be redistributed or reproduced without the prior written permission of Euronext. This presentation may include forward-looking statements, which are based on Euronext’s current expectations and projections about future events. By their nature, forward-looking statements involve known and unknown risks, uncertainties, assumptions and other factors because they relate to events and depend on circumstances that will occur in the future whether or not outside the control of Euronext. Such factors may cause actual results, performance or developments to differ materially from those expressed or implied by such forward-looking statements. Accordingly, no undue reliance should be placed on any forward-looking statements. Forward-looking statements speak only as at the date at which they are made. Euronext expressly disclaims any obligation or undertaking to update, review or revise any forward-looking statements contained in this presentation to reflect any change in its expectations or any change in events, conditions or circumstances on which such statements are based unless required to do so by applicable law. Financial objectives are internal objectives of the Company to measure its operational performance and should not be read as indicating that the Company is targeting such metrics for any particular fiscal year. The Company’s ability to achieve these financial objectives is inherently subject to significant business, economic and competitive uncertainties and contingencies, many of which are beyond the Company’s control, and upon assumptions with respect to future business decisions that are subject to change. As a result, the Company’s actual results may vary from these financial objectives, and those variations may be material. Efficiencies are net, before tax and on a run-rate basis, ie taking into account the full-year impact of any measure to be undertaken before the end of the period mentioned. The expected operating efficiencies and cost savings were prepared on the basis of a number of assumptions, projections and estimates, many of which depend on factors that are beyond the Company’s control. These assumptions, projections and estimates are inherently subject to significant uncertainties and actual results may differ, perhaps materially, from those projected. The Company cannot provide any assurance that these assumptions are correct and that these projections and estimates will reflect the Company's actual results of operations Euronext refers to Euronext N.V. and its affiliates. Information regarding trademarks and intellectual property rights of Euronext is located at https://www.euronext.com/terms-use. © 2017, Euronext N.V. - All rights reserved.
28 July 2017