
Q2 STOCK GUIDE The Blue Dot List - Investor's Business Daily
28
Q2 STOCK GUIDE » 19 20 The Blue Dot List: Our newest feature for finding top stocks
Transcript of Q2 STOCK GUIDE The Blue Dot List - Investor's Business Daily
Q2 STOCK GUIDE
»1920
The Blue Dot List:Our newest feature for finding top stocks


Stock Guide // 2019 Q2
At MarketSmith, our team is always looking for ways to improve our
product and help our members invest better. Our newest featured stock list
is quickly becoming a favorite among both long-time members and our in-
house team: RS Line Blue Dot, better known around here as “The Blue Dot
List.” Check out this issue’s feature article for a full rundown of what Blue
Dot stocks are and why you should be checking this new list frequently.
For our featured interview this month, we talked to Joe Fahmy, a profession-
al Investment Advisory Representative with nearly two decades of trading
experience. Joe has been using MarketSmith for years to find and evaluate
new stock trades through a fundamental and technical lens. He shares some
of his experiences in the market, as well as his predictions for Q2.
Finally, we’re excited to introduce a new regular feature to our Stock Guide
readers. In Good Trade/Bad Trade, we’ll talk to one of our in-house experts
about two of their recent trades—one winner and one loser—and see what
they did right and wrong. This month’s subject is MarketSmith Product
Coach Andrew Rocco, who dives into some revealing technical analysis of
Baozun (BZUN) and talks about his mistakes buying into the volatile
Tesla (TSLA).
As always, if you have any questions or comments about your investing
research or any MarketSmith features, please call one of our product
coaches at (800) 831-2525 or email us at [email protected].
We’re here to help you make more money in the market.
Best Returns,
The MarketSmith Team
2
MarketSmith.com // 2019 Q2
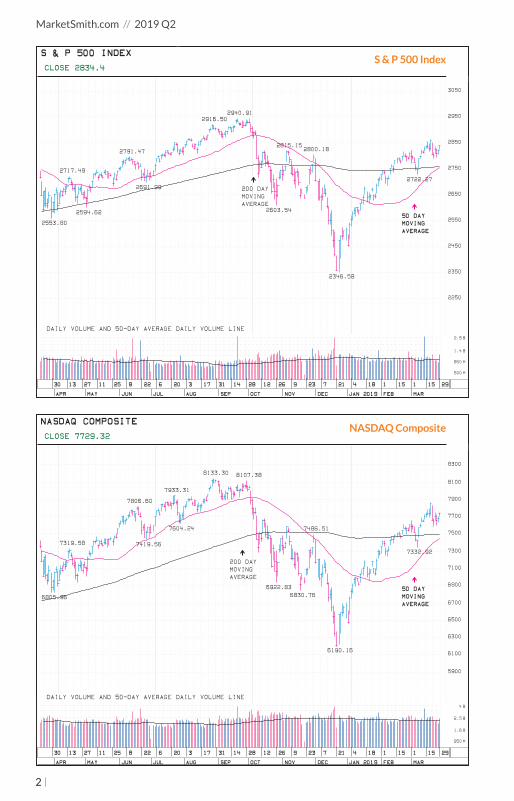
S & P 500 INDEXCLOSE 2834.4
2717.49
2791.47
2916.502940.91
2815.152800.18
2553.80
2594.62
2691.99
2603.54
2346.58
2722.27
50 DAY MOVING AVERAGE
200 DAY MOVING AVERAGE
2250
2350
2450
2550
2650
2750
2850
2950
3050
DAILY VOLUME AND 50-DAY AVERAGE DAILY VOLUME LINE
500 M
850 M
1.4 B
2.5 B
2915115118421723926122814311732062282511271330
MARFEBJAN 2019DECNOVOCTSEPAUGJULJUNMAYAPR
NASDAQ COMPOSITECLOSE 7729.32
7319.58
7806.60
7933.31
8133.30 8107.38
7486.51
6805.96
7419.56
7604.24
6922.836830.76
6190.16
7332.92
50 DAY MOVING AVERAGE
200 DAY MOVING AVERAGE
5900
6100
6300
6500
6700
6900
7100
7300
7500
7700
7900
8100
8300
DAILY VOLUME AND 50-DAY AVERAGE DAILY VOLUME LINE
850 M
1.6 B
2.5 B
4 B
2915115118421723926122814311732062282511271330
MARFEBJAN 2019DECNOVOCTSEPAUGJULJUNMAYAPR
S & P 500 Index
NASDAQ Composite

3
*All screen results are computer-generated and were run on March 29, 2019.
Market Charts . . . . . . . . . . . . . . . . . . . . . . . . . . . . . . . . . . . . . . . . . . . . . . . . . . . . . . . . . . 2
The MarketSmith Blue Dot . . . . . . . . . . . . . . . . . . . . . . . . . . . . . . . . . . . . . . . . . . . . . 4
Blue Dot Special* . . . . . . . . . . . . . . . . . . . . . . . . . . . . . . . . . . . . . . . . . . . . . . . . . . . . . . . 6
Tegna Inc (TGNA) . . . . . . . . . . . . . . . . . . . . . . . . . . . . . . . . . . . . . . . . . . . . . . . . . . . . . 7
Sinclair Broadcast Group (SBGI) . . . . . . . . . . . . . . . . . . . . . . . . . . . . . . . . . . . . . . 7
Alexion Pharmaceuticals (ALXN) . . . . . . . . . . . . . . . . . . . . . . . . . . . . . . . . . . . . . 8
Gray Television Inc (GTN) . . . . . . . . . . . . . . . . . . . . . . . . . . . . . . . . . . . . . . . . . . . . . 8
S S & C Technologies (SSNC). . . . . . . . . . . . . . . . . . . . . . . . . . . . . . . . . . . . . . . . . . . 9
Palo Alto Networks (PANW) . . . . . . . . . . . . . . . . . . . . . . . . . . . . . . . . . . . . . . . . . . 9
A Conversation with Joe Fahmy . . . . . . . . . . . . . . . . . . . . . . . . . . . . . . . . . . . . . . . 10
Earnings & Margins* . . . . . . . . . . . . . . . . . . . . . . . . . . . . . . . . . . . . . . . . . . . . . . . . . . . . 13
Arista Networks Inc (ANET) . . . . . . . . . . . . . . . . . . . . . . . . . . . . . . . . . . . . . . . . . . . 14
Camtek Ltd (CAMT) . . . . . . . . . . . . . . . . . . . . . . . . . . . . . . . . . . . . . . . . . . . . . . . . . . . 14
Cabot Microelectronics (CCMP) . . . . . . . . . . . . . . . . . . . . . . . . . . . . . . . . . . . . . . 15
Fortinet Inc (FTNT) . . . . . . . . . . . . . . . . . . . . . . . . . . . . . . . . . . . . . . . . . . . . . . . . . . . . 15
Good Trade/Bad Trade: Andrew Rocco . . . . . . . . . . . . . . . . . . . . . . . . . . . . . . . . 16
Feature Highlight: Stock Ideas Button . . . . . . . . . . . . . . . . . . . . . . . . . . . . . . . . . 20
Resources . . . . . . . . . . . . . . . . . . . . . . . . . . . . . . . . . . . . . . . . . . . . . . . . . . . . . . . . . . . . . . . 22
Connect with Us . . . . . . . . . . . . . . . . . . . . . . . . . . . . . . . . . . . . . . . . . . . . . . . . . . . . . . . . 23
Table of Contents

4
MarketSmith.com // 2019 Q2 l Feature Article
MarketSmith’s newest stock list is already one of its most popular among
subscribers. It’s called RS Line Blue Dot, and if you’re not checking it for
new stock ideas, you could be missing out.
Here’s How It Works
Stocks make the RS Line Blue
Dot list when they satisfy two
criteria: first, they’ve hit a
52-week high in their Relative
Strength line. This is where
you’ll notice a translucent blue
dot appear on the Relative
Strength line of the stock’s
chart. Second, the stock is
currently building a base. If both of these conditions occur, the stock goes
on the list for 90 days. You can access the list by clicking on the “Open
Stock Ideas” button in the top-right corner on any MarketSmith chart.
What does that mean? Two things.
The first thing stocks on the Blue Dot list have shown is that they are
outperforming the market (specifically, the S&P 500) in the strongest way
possible. This is important because the highest-potential stocks will show
strength by outperforming the market in any market conditions.
If the market’s down, good stocks will outperform by treading water and
setting up for a spike when the market character changes to an uptrend. In
good market conditions, the best stocks will offer the biggest gains relative
to other high-performance names. Ultimately, it’s all about maximizing
opportunity; since you can only buy a finite amount of stocks, it makes
sense to prioritize the best ones.
Feature Article:
The MarketSmith Blue Dot

5
MarketSmith.com // 2019 Q2
The second important characteristic of Blue Dot stocks is that they’re
building a base, which means you’re not chasing an extended stock that
has less potential for short-term growth. After all, even the best stocks
take time to retrench after sizeable runs. A stock that’s currently in a
base will have a clear buy point in MarketSmith thanks to the Pattern
Recognition feature.
Blue Dot Case Study: KEYS
Let’s look at a recent Blue Dot stock. Keysight (KEYS) is a company that
stands to benefit from the forthcoming adoption of the 5G standard
in wireless data. To bring 5G networks and smart devices to market,
wireless service providers and electronics makers use Keysight’s
technologies to test and optimize their designs.
The company itself was showing very bullish fundamentals in late 2018:
accelerating earnings, steady sales and a strong ROE. KEYS started
forming a cup-shaped base in August 2018; as it began to form the right
side of the base, its Relative Strength line hit a new high eight times
during December 2018 and January 2019! Keep in mind, KEYS was
outperforming the S&P during the December market correction that
dragged down stocks across the board—a classic sign that a stock is one
to watch when a new uptrend starts.
To recap, as KEYS neared its buy point in January 2019, it had very
strong fundamentals and eight recent Blue Dot appearances in
MarketSmith—a rare combination of superior technical and fundamental
strength aligning at the right time.
On January 24, 2019, KEYS broke out in volume 91% above average and
rose 4.5% from the day prior. It closed up in price 19 out of the next 21
trading days before entering a +20% profit target zone. Stocks don’t get
much easier to hold than that.

6
Find the strongest Blue Dot stocks
This screen builds on the Blue Dot list criteria to screen for stocks in a strong industry group with 90th-percentile fundamentals, strong liquidity and positive demand.
Blue Dot Special
COMPANY (SYMBOL) INDUSTRY GROUP RS RATING PAGE
Tegna Inc (TGNA) Media-Radio/Tv 99 7
Sinclair Broadcast Group (SBGI) Media-Radio/Tv 99 7
Alexion Pharmaceuticals (ALXN) Medical-Biomed/Biotech 99 8
Gray Television Inc (GTN) Media-Radio/Tv 99 8
S S & C Technologies (SSNC) Computer Sftwr-Financial 99 9
Palo Alto Networks (PANW) Computer Sftwr-Security 99 9
Visit MarketSmith.com/learn/stockguide to load the criteria for this and
other Stock Guide screens directly into your MarketSmith screener.
*All screen results are computer-generated and were run on March 29, 2019. This screen can also be found on
marketsmith.com in shared screens.
Screen created by Arnie Gutierrez, MarketSmith Product Coach

7
MarketSmith.com // 2019 Q2Tegna Inc (TGNA)
Sinclair Broadcast Group (SBGI)
TEGNA INC(TGNA) NYSE 216.1 SHRS / 213.9 FLT / AVG VOL2.32MIL $14.10(OH -9%)MEDIA-RADIO/TV tegna.comOPERATES 49 TELEVISION STATIONS AND AFFILIATED ONLINE SITES COVERING ONE THIRD OF THE U.S. POPULATION.
3/19 EXPECTS Q1 2019 REVENUES GROWTH OF LOW-SINGLE DIGITS.
SHORT INT 5.7 DAYS -22%OPTIONS ON AM/MSUP/DOWN 1.5EX-DIV 3/7YIELD 2.0%
GROWTH RATE -3%EARNINGS STAB 17EPS RANK 80PE 8 (0.4XS&P)5 YR PE 6 - 17
DEBT 220%NEW CEO 6/17TIMELINESS AACC/DIST BSMR RATING A
2.28 X BK VALUEINVENTORY TO.R&D N/ARET ON EQUITY 34%CASH FLOW $2.24
FUNDS 52%BANKS 1%MGMT 1%ALPHA 0.08BETA 0.98
11.10
12.4912.16
13.59
15.5815.58
10.46
10.00 10.1110.53 10.37
10.80
10.24
11.25
92
QTR 1QTR 4
QTR 3
QTR 2
8
10
12
14
16
PRICE SCALE
99COMPOSITE RATING13$ 2.02 $ 14 814 1.22 17 1215 1.44 20 1316 1.69 16 1117 1.08 16 1118 1.83 15 1019 1.31EST -28% ↓20 2.12EST +62% ↓
EARNINGS (DEC) HI LOGrayTelA GTNA 97 99GrayTelevi GTN 96 99NexstarMed NXST 96 99ScrippsEWA SSP 96 77Sinclair SBGI 94 94
GROUP REL STR 87 RS EPS
29151151184217239261228143117320622825112713MARFEBJAN 19DECNOVOCTSEPAUGJULJUNMAY
EARNINGS $SALES MIL. $DIVIDEND-PE
0.33 VS 0.25 +32%502.1 VS 459.1 +9%$0.07 12X-- 10X
0.36 VS 0.29 +24%524.1 VS 489.4 +7%$0.07 10X-- 9X
0.40 VS 0.23 +74%539.0 VS 464.3 +16%$0.07 11X-- 8X
0.74 VS 0.32 +131%642.1 VS 490.3 +31%$0.07 10X-- 7X
EPS DUE 5/8 QUARTER ENDED MAR 31,18 QUARTER ENDED JUN 30,18 QUARTER ENDED SEP 30,18 QUARTER ENDED DEC 31,18
R S LINE VS SP500 VOLUME
1.1M
3M
8M
*SINCLAIR BROADCAST GROUP(SBGI) NASDAQ 65.7 SHRS / 46.7 FLT / AVG VOL1.09MIL $38.48(OH -3%)MEDIA-RADIO/TV sbgi.netTV BROADCASTER THAT OWNS OR PROVIDES PROGRAMMING, OPERATING OR SALES SERVICES TO 191 STATIONS IN 89 MARKETS.
2/19 EXPECTS 2019 CAPITAL EXPENDITURES OF $250 MIL TO $260 MIL.
SHORT INT 3.6 DAYS -1%OPTIONS ON PHUP/DOWN 2.4EX-DIV 3/8YIELD 2.0%
GROWTH RATE +22%EARNINGS STAB 17EPS RANK 94PE 11 (0.6XS&P)5 YR PE 8 - 33
DEBT 235%NEW CEOTIMELINESS AACC/DIST ASMR RATING A
2.20 X BK VALUEINVENTORY TO.R&D N/ARET ON EQUITY 23%CASH FLOW $7.9
FUNDS 35%BANKS 1%MGMT 29%ALPHA 0.08BETA 0.94
33.95
30.00
32.30 32.00
39.88
26.5027.05
25.13
26.8526.04
25.14
94
QTR 1QTR 4
QTR 3
QTR 2
DIVINC
20
25
30
35
40
PRICE SCALE
99COMPOSITE RATING(C)13$ 1.04∆ $ 36 1214 2.17∆ 37 2315 1.79∆ 35 2416 2.86∆ 34 2417 2.82∆ 43 2618 3.59∆ 40 2519 2.31EST -36% ↓20 4.56EST +97% ↑
EARNINGS (DEC) HI LOGrayTelA GTNA 97 99GrayTelevi GTN 96 99NexstarMed NXST 96 99ScrippsEWA SSP 96 77Tegna TGNA 92 80
GROUP REL STR 87 RS EPS
29151151184217239261228143117320622825112713MARFEBJAN 19DECNOVOCTSEPAUGJULJUNMAY
EARNINGS $SALES MIL. $DIVIDEND-PE
0.42∆ VS 0.32∆ +31%665.4 VS 626.9 +6%$0.18 16X-- 11X
0.27∆ VS 0.43 -37%730.1 VS 652.2 +12%$0.18 12X-- 9X
0.86∆ VS 0.37∆ +132%766.3 VS 644.5 +19%$0.18 12X-- 9X
2.10∆ VS 1.67∆ +26%893.3 VS 712.5 +25%$0.20 11X-- 8X
EPS DUE 5/9 QUARTER ENDED MAR 31,18 QUARTER ENDED JUN 30,18 QUARTER ENDED SEP 30,18 QUARTER ENDED DEC 31,18
R S LINE VS SP500
VOLUME
500K
1.2M

8
Alexion Pharmaceuticals (ALXN)
Gray Television Inc (GTN)
ALEXION PHARMACEUTICALS(ALXN) NASDAQ 223.5 SHRS / 212.3 FLT / AVG VOL1.59MIL $135.18(OH -3%)MEDICAL-BIOMED/BIOTECH alexion.comDEVELOPS THERAPEUTICS TO TREAT HEMATOLOGIC AND NEUROLOGIC DISEASES AND METABOLIC AND INFLAMMATORY DISORDERS.
2/19 EXPECTS 2019 NON-GAAP EARNINGS OF $9.10 TO $9.30 PER SHARE ON REVENUES OF $4.625 BIL TO $4.700 BIL.
SHORT INT 2.4 DAYS +6%OPTIONS ON AM/MSUP/DOWN 1.4EX-DIVYIELD
GROWTH RATE +12%EARNINGS STAB 13EPS RANK 90PE 17 (1.0XS&P)5 YR PE 13 - 60
DEBT 31%NEW CEOTIMELINESS AACC/DIST BSMR RATING A
3.39 X BK VALUEINVENTORY TO. 8.9XR&D 17.7%RET ON EQUITY 20%CASH FLOW $8.43
FUNDS 57%BANKS 2%MGMT 4%ALPHA 0.05BETA 1.41
123.48
138.77140.77
129.36
138.32138.32
102.10
114.40 115.40
109.74
92.56
91
QTR 1QTR 4
QTR 3
QTR 2
80
90
100
110
120
130
140
150
160
PRICE SCALE
99COMPOSITE RATING(W)13$ 3.08 $ 133 8114 5.21 203 12615 4.70 208 14216 4.62 193 10917 5.86 149 9618 7.92 140 9219 9.29EST +17% ↓20 10.49EST +13% ↓
EARNINGS (DEC) HI LOCorMedix CRMD 99 54Trevana TRVN 99 44Clementia CMTA 99 41Kalvista KALV 99 40Cel-Sci CVM 99 40
GROUP REL STR 88 RS EPS
29151151184217239261228143117320622825112713MARFEBJAN 19DECNOVOCTSEPAUGJULJUNMAY
EARNINGS $SALES MIL. $DIVIDEND-PE
1.68 VS 1.38 +22%930.9 VS 869.6 +7%N/A 24X-- 18X
2.07 VS 1.56 +33%1045 VS 912.7 +14%N/A 21X-- 17X
2.02 VS 1.44 +40%1026 VS 859.1 +19%N/A 22X-- 17X
2.14 VS 1.48 +45%1128 VS 909.7 +24%N/A 21X-- 13X
EPS DUE*4/26 QUARTER ENDED MAR 31,18 QUARTER ENDED JUN 30,18 QUARTER ENDED SEP 30,18 QUARTER ENDED DEC 31,18
R S LINE VS SP500 VOLUME
600K
1.6M
4M
*GRAY TELEVISION INC(GTN) NYSE 82.0 SHRS / 80.4 FLT / AVG VOL983080 $21.36(OH -8%)MEDIA-RADIO/TV gray.tvOWNS AND OPERATES TELEVISION STATIONS IN 91 TELEVISION MARKETS BROADCASTING 400 PROGRAMMING STREAMS.
2/19 EXPECTS Q1 2019 REVENUES OF $495.0 MIL TO $502.0 MIL.
SHORT INT 2.6 DAYS -62%OPTIONS ONUP/DOWN 1.6EX-DIVYIELD
GROWTH RATE +45%EARNINGS STAB 33EPS RANK 99PE 9 (0.5XS&P)5 YR PE 6 - 83
DEBT 184%NEW CEOTIMELINESS AACC/DIST BSMR RATING A
1.95 X BK VALUEINVENTORY TO.R&D N/ARET ON EQUITY 20%CASH FLOW $3.55
FUNDS 41%BANKS 0%MGMT 2%ALPHA 0.22BETA 1.04
17.00
20.24
16.93
23.4523.45
10.70 10.70
14.60
16.35 16.22
13.75
96
QTR 1QTR 4
QTR 3
QTR 2
5
10
15
20
PRICE SCALE
99COMPOSITE RATING(W)13$ 0.32∆ $ 15 214 0.82∆ 15 715 0.66∆ 18 916 1.12∆ 16 717 1.75∆ 17 918 2.44∆ 20 1019 1.39EST -43% ↓20 3.44EST+147% ↓
EARNINGS (DEC) HI LOGrayTelA GTNA 97 99NexstarMed NXST 96 99ScrippsEWA SSP 96 77Sinclair SBGI 94 94Tegna TGNA 92 80
GROUP REL STR 87 RS EPS
29151151184217239261228143117320622825112713MARFEBJAN 19DECNOVOCTSEPAUGJULJUNMAY
EARNINGS $SALES MIL. $DIVIDEND-PE
0.22∆ VS 0.17∆ +29%226.3 VS 203.5 +11%N/A 10X-- 7X
0.46∆ VS 0.98∆ -53%250.3 VS 226.7 +10%N/A 9X-- 6X
0.70∆ VS 0.21∆ +233%279.3 VS 219.0 +28%N/A 14X-- 8X
1.06∆ VS 0.40∆ +165%328.2 VS 233.6 +40%N/A 15X-- 8X
EPS DUE 5/8 QUARTER ENDED MAR 31,18 QUARTER ENDED JUN 30,18 QUARTER ENDED SEP 30,18 QUARTER ENDED DEC 31,18
R S LINE VS SP500 VOLUME
300K
800K
2.5M

9
MarketSmith.com // 2019 Q2MarketSmith.com // 2019 Q2S S & C Technologies (SSNC)
Palo Alto Networks (PANW)
S S & C TECHNOLOGIES(SSNC) NASDAQ 240.5 SHRS / 197.2 FLT / AVG VOL1.78MIL $63.69(OH -1%)COMPUTER SFTWR-FINANCIAL ssctech.comPROVIDES SOFTWARE FOR THE FINANCIAL SERVICES INDUSTRY TO SUPPORT INVESTMENT MANAGEMENT AND OTHER FUNCTIONS.
3/19 TO OFFER $2.0 BIL OF 5.500% SENIOR NOTES DUE 2027.
SHORT INT 3.9 DAYS -4%OPTIONS ON PHUP/DOWN 2.0EX-DIV 2/28YIELD 0.6%
GROWTH RATE +20%EARNINGS STAB 5EPS RANK 98PE 22 (1.2XS&P)5 YR PE 17 - 30
DEBT 75%NEW CEOTIMELINESS AACC/DIST ASMR RATING A
5.80 X BK VALUEINVENTORY TO.R&D 9.2%RET ON EQUITY 20%CASH FLOW $3.38
FUNDS 47%BANKS 1%MGMT 18%ALPHA 0.04BETA 1.26
55.25
60.9759.52
52.54
50.00
64.3664.36
46.1047.51
51.0252.50 53.15
42.7340.96
54.03
93
QTR 1QTR 4
QTR 3
QTR 2
DIVINCPSO
SODIVINC
30
40
50
60
70
PRICE SCALE
99COMPOSITE RATING13$ 0.99 $ 22 1114 1.18 29 1715 1.33 38 2616 1.64 34 2317 1.93 42 2818 2.90 60 4019 3.73EST +29% ↑20 4.15EST +11% ↑
EARNINGS (DEC) HI LOFairIsaac FICO 95 83Q2 Holding QTWO 94 70Intuit INTU 93 91ACI Wwde ACIW 92 83EllieMae ELLI 90 65
GROUP REL STR 88 RS EPS
29151151184217239261228143117320622825112713MARFEBJAN 19DECNOVOCTSEPAUGJULJUNMAY
EARNINGS $SALES MIL. $DIVIDEND-PE
0.53 VS 0.44 +20%421.9 VS 407.7 +3%$0.07 28X-- 22X
0.62 VS 0.46 +35%895.8 VS 411.0 +118%$0.07 28X-- 23X
0.79 VS 0.50 +58%992.4 VS 418.3 +137%$0.08 28X-- 24X
0.95 VS 0.54 +76%1111 VS 438.4 +153%$0.08 26X-- 17X
EPS DUE 5/1 QUARTER ENDED MAR 31,18 QUARTER ENDED JUN 30,18 QUARTER ENDED SEP 30,18 QUARTER ENDED DEC 31,18
R S LINE VS SP500 VOLUME
600K
1.7M
5M
*PALO ALTO NETWORKS(PANW) NYSE 93.7 SHRS / 90.0 FLT / AVG VOL1.45MIL $242.88(OH -6%)COMPUTER SFTWR-SECURITY paloaltonetworks.comPROVIDES NETWORK SECURITY INFRASTRUCTURE PRODUCTS FOR ENTERPRISES, SERVICE PROVIDERS AND GOVERNMENT ENTITIES.
3/19 ACQUIRED DEMISTO, A CYBERSECURITY COMPANY SPECIALIZING IN SECURITY ORCHESTRATION, FOR ABOUT $560 MIL IN CASH/STK.
SHORT INT 3.9 DAYS -2%OPTIONS ONUP/DOWN 1.3EX-DIVYIELD
GROWTH RATE +77%EARNINGS STAB 14EPS RANK 99PE 49 (2.7XS&P)5 YR PE 38 - 311
DEBT 142%NEW CEO 6/18TIMELINESS AACC/DIST BSMR RATING A
23.30 X BK VALUEINVENTORY TO.R&D 17.6%RET ON EQUITY 45%CASH FLOW $5.33
FUNDS 34%BANKS 2%MGMT 3%ALPHA 0.08BETA 1.11
197.20
217.40 219.38
239.50
192.80
260.63
195.78 193.61
160.08
168.80
89
QTR 1QTR 4
QTR 3
QTR 2
140
160
180
200
220
240
260
280
PRICE SCALE
99COMPOSITE RATING$42.00IPO 7/20/1213$ 0.24 $ 62 3914 0.40 128 5415 0.86 200 11716 1.89 177 11117 2.71 157 10718 4.07 239 14519 5.48EST +35% ↑20 6.43EST +17% ↑
EARNINGS (JUL) HI LOZscaler ZS 99 73CybArkSftw CYBR 98 99Rapid7 RPD 98 38Okta A OKTA 97 43Securework SCWX 96 73
GROUP REL STR 98 RS EPS
29151151184217239261228143117320622825112713MARFEBJAN 19DECNOVOCTSEPAUGJULJUNMAY
EARNINGS $SALES MIL. $DIVIDEND-PE
0.99 VS 0.61 +62%567.1 VS 431.8 +31%N/A 59X-- 49X
1.28 VS 0.92 +39%658.1 VS 509.1 +29%N/A 64X-- 52X
1.17 VS 0.75 +56%656.0 VS 501.8 +31%N/A 63X-- 43X
1.51 VS 1.05 +44%711.2 VS 545.6 +30%N/A 48X-- 38X
EPS DUE 6/4 QUARTER ENDED APR 30,18 QUARTER ENDED JUL 31,18 QUARTER ENDED OCT 31,18 QUARTER ENDED JAN 31,19
R S LINE VS SP500
VOLUME
700K
1.4M
3M

10
MarketSmith.com // 2019 Q2 l Q&A: Joe Fahmy
Joe Fahmy is an
Investment Advisory
Representative at Zor
Capital, a New York-
based investment firm.
Joe has over 21 years of
trading experience during
which he developed his
investment strategy and
sharpened his skills. He’s also a long-time MarketSmith member who uses
the platform to find and evaluate trading ideas. His extensive knowledge
of technical analysis, market forecasting and risk management has landed
him appearances on Wall Street Week, Fox Business, CNBC, ABC News,
CNN Money and Yahoo Finance, where he is a regular contributor.
We recently spoke to Joe about stock analysis and the trends he sees
ahead for Q2.
Q: What was your first big winning trade, and what did you learn from it?
I did well in many stocks during the 1995-1999 bull market, but my first
big winning trade was Hansen’s Natural Corporation in 2004-2006. The
symbol used to be HANS but it is now Monster Beverage Corp (MNST). I
remember buying a position and immediately being up 20-25% in a few
weeks. I normally would sell a nice gain like that, but I remembered how
both Jesse Livermore and William O’Neil say that when you buy a stock at
the proper entry point and it shows you an immediate profit, be patient
and play for a bigger move.
I kept a core position and traded around it from around $20 all the way
up to around $135 (split adjusted). Less than a week after I sold it, it
had a “blow-off” move and went to $200, but I was more than happy
with the gain.
A Conversation with Joe Fahmy

11
MarketSmith.com // 2019 Q2
The biggest lesson I learned from this was patience, especially when you
discover a stock with a strong fundamental story and explosive triple-digit
growth with expanding profit margins. These stories are difficult to find,
but when you discover them and have some patience, all you need is one
of them to make your year.
Q: Name a sector or industry you’re bullish on for Q2.
I’ve been pounding the table on Enterprise Software and Software
Security stocks for over a year now. Many of these stocks doubled in 2018
when all the major averages were negative for the year, and this group
showed amazing relative strength during the Q4 correction. When the
market had a follow-through day on January 4th, 2019, I immediately
started putting money to work in the strongest stocks I could find, and
most of them came from this sector.
Q: What are a few trends you see coming in Q2?
I always say that the stock market moves on two main factors: earnings
and interest rates. The rest is just noise in my view. For the rest of the year,
interest rates are expected to remain low and this is bullish for stocks.
I’m never one to complain about what the Fed is doing. I prefer to take
advantage of this equity-friendly environment instead.
While earnings are slowing from the strong pace of the last two years,
they are still growing slowly and steadily. I think these two factors will
keep us moving higher into the end of the year (with corrections and
pullbacks along the way, of course).
Q: Any favorite MarketSmith screens or lists you pay special attention to?
The three main MarketSmith screens I use involve earnings growth, profit
margin expansion, and MarketSmith’s proprietary Relative Strength
Rating. My process involves screening the market nightly and going
through about 500-1,000 stocks. This gives you a really good feel for the
market’s health and guides you toward the strongest sectors. In other

12
words, while going through your screens, a light bulb should go on
when you notice many strong stocks from the same sectors appear
over and over.
Q: What’s your market-wide “warning light” for reducing your
overall exposure?
I like to use the 10-week moving average on the major indexes. Most
people use the S&P 500, but I prefer to look at the Nasdaq Composite
and the Russell 2000. I like these averages better because they are
where most of the growth stocks come from and it tells me if the big
institutions are putting money to work in riskier assets or not. If they
are, it is usually a sign the market is healthy.
When the indexes break below the 10-week moving average, it is usually
a warning sign to raise cash and get more defensive. There are other
factors, of course, but this is a simple one investors can use.
Q: What’s the best advice you would give investors?
To paraphrase William O’Neil, most investors buy “nothing to write
home about” stocks. There are thousands of stocks in the market, so why
not buy the best you can find when the market is in a strong uptrend?
By the best, I mean companies with 30% or higher earnings and sales
growth.
I would also stress the importance of mental toughness and protecting
your confidence. An investor’s goal should be to produce consistently
strong returns over a long period of time. This is very tough to do unless
you have a strong mental state and confidence in what you are doing.
There are thousands of stocks in the market, so why not buy the best you can find when the market is in a strong uptrend?
MarketSmith.com // 2019 Q2 l Q&A: Joe Fahmy

13
Quality stocks that outperform their peers
This screen looks for stocks with classically strong fundamentals, especially in the area of earnings (quarterly and 3-year). Along with strong proprietary ratings like EPS and RS, this screen selects for margins better than a company’s industry group peers.
Earnings & Margins
COMPANY (SYMBOL) INDUSTRY GROUP RS RATING PAGE
Arista Networks Inc (ANET) Computer-Networking 99 14
Camtek Ltd (CAMT) Elec-Scientific/Msrng 99 14
Cabot Microelectronics (CCMP) Elec-Semiconductor Equip 99 15
Fortinet Inc (FTNT) Computer Sftwr-Security 99 15
Visit MarketSmith.com/learn/stockguide to load the criteria for this and
other Stock Guide screens directly into your MarketSmith screener.
*All screen results are computer-generated and were run on March 29, 2019. This screen can also be found on
marketsmith.com in shared screens.
Screen created by Scott St. Clair, MarketSmith Product Coach

14
Arista Networks Inc (ANET)
Camtek Ltd (CAMT)
*ARISTA NETWORKS INC(ANET) NYSE 75.7 SHRS / 50.7 FLT / AVG VOL912920 $314.46(OH 0%)COMPUTER-NETWORKING arista.comPROVIDES CLOUD NETWORKING SOFTWARE, HARDWARE FOR INTERNET, CLOUD AND NEXT-GEN DATA CENTERS.
2/19 EXPECTS Q1 2019 REVENUES OF $588 MIL TO $598 MIL.
SHORT INT 2.2 DAYS -5%OPTIONS ONUP/DOWN 3.0EX-DIVYIELD
GROWTH RATE +56%EARNINGS STAB 7EPS RANK 97PE 40 (2.2XS&P)5 YR PE 23 - 87
DEBT 2%NEW CEOTIMELINESS AACC/DIST ASMR RATING A
11.25 X BK VALUEINVENTORY TO. 7.5XR&D 20.6%RET ON EQUITY 34%CASH FLOW $8.76
FUNDS 35%BANKS 1%MGMT 25%ALPHA 0.05BETA 1.7
272.54
287.12281.20
313.37
269.49
248.98
233.16235.24
252.25 253.51
213.11 210.55
187.08
204.94 94
QTR 1QTR 4
QTR 3
QTR 2
140
160
180
200
220
240
260
280
300
320
340
360
PRICE SCALE
99COMPOSITE RATING$43.00IPO 6/06/1413$ 0.82 $14 1.54 94 5515 2.44 88 5616 3.30 98 5217 5.61 245 8718 7.96 313 18719 9.25EST +16% ↑20 10.78EST +17% ↓
EARNINGS (DEC) HI LOCisco CSCO 90 77Aerohive N HIVE 90 73Digi DGII 81 77ExtremeNtk EXTR 80 54Radware RDWR 78 67
GROUP REL STR 91 RS EPS
29151151184217239261228143117320622825112713MARFEBJAN 19DECNOVOCTSEPAUGJULJUNMAY
EARNINGS $SALES MIL. $DIVIDEND-PE
1.66 VS 0.93 +78%472.5 VS 335.5 +41%N/A 62X-- 42X
1.93 VS 1.34 +44%519.9 VS 405.2 +28%N/A 49X-- 37X
2.11 VS 1.62 +30%563.3 VS 437.6 +29%N/A 45X-- 37X
2.25 VS 1.71 +32%595.7 VS 467.9 +27%N/A 39X-- 25X
EPS DUE 5/3 QUARTER ENDED MAR 31,18 QUARTER ENDED JUN 30,18 QUARTER ENDED SEP 30,18 QUARTER ENDED DEC 31,18
R S LINE VS SP500
VOLUME
350K
1M
2.8M
*CAMTEK LTD(CAMT) NASDAQ 36.4 SHRS / 18.9 FLT / AVG VOL178700 $8.92(OH -19%)ELEC-SCIENTIFIC/MSRNG camtek.comISRAELI MAKER OF AUTOMATED OPTICAL INSPECTION SYSTEMS FOR THE PRINTED CIRCUIT BOARD/SEMICONDUCTOR INDUSTRIES.
2/19 EXPECTS Q1 2019 REVENUES OF $33.5 MIL TO $34.5 MIL.
SHORT INT .2 DAYS+214%OPTIONS ONUP/DOWN 2.2EX-DIVYIELD
GROWTH RATE +28%EARNINGS STAB 73EPS RANK 96PE 16 (0.9XS&P)5 YR PE 11 - 584
DEBT 0%NEW CEOTIMELINESS CACC/DIST ASMR RATING B
3.97 X BK VALUEINVENTORY TO. 4.9XR&D 14.5%RET ON EQUITY 23%CASH FLOW $0.57
FUNDS 9%BANKS 0%MGMT 1%ALPHA 0.1BETA 1.23
8.60 8.74
11.11
9.198.83 8.90
9.349.63
7.20
7.95
6.83
7.31
6.29
92
QTR 1QTR 4
QTR 3
QTR 2
DIVSPEC
4
6
8
10
12
PRICE SCALE
99COMPOSITE RATING13$ 0.07 $ 6 114 0.15 5 215 0.16 3 216 0.06 3 117 0.21 7 318 0.57 11 519 0.71EST +25% ↑20 0.84EST +18% ↓
EARNINGS (DEC) HI LOKeysight T KEYS 96 82Novanta NOVT 95 95MettlerTol MTD 92 84Bruker BRKR 92 81AgilentTec A 90 71
GROUP REL STR 94 RS EPS
29151151184217239261228143117320622825112713MARFEBJAN 19DECNOVOCTSEPAUGJULJUNMAY
EARNINGS $SALES MIL. $DIVIDEND-PE
0.12 VS -0.02#+700%27.3 VS 21.2 +29%N/A 51X-- 27X
0.13 VS 0.06 +117%30.5 VS 22.7 +34%$0.14 34X-- 19X
0.16 VS 0.08 +100%32.3 VS 23.8 +35%N/A 26X-- 18X
0.17 VS 0.10 +70%33.2 VS 25.8 +28%N/A 21X-- 12X
EPS DUE 5/2 QUARTER ENDED MAR 31,18 QUARTER ENDED JUN 30,18 QUARTER ENDED SEP 30,18 QUARTER ENDED DEC 31,18
R S LINE VS SP500
VOLUME
22K
70K
250K

15
MarketSmith.com // 2019 Q2Cabot Microelectronics (CCMP)
Fortinet Inc (FTNT)
*CABOT MICROELECTRONICS(CCMP) NASDAQ 28.9 SHRS / 28.1 FLT / AVG VOL298418 $111.96(OH -9%)ELEC-SEMICONDUCTOR EQUIP cabotcmp.comMANUFACTURES CHEMICAL MECHANICAL PLANARIZATION SLURRIES FOR POLISHING CONDUCTING/INSULATING MATERIALS
2/19 EXPECTS Q2 FY19 REVENUES TO BE DOWN LOW SINGLE DIGITS.
SHORT INT 2.7 DAYS -20%OPTIONS ON MS/NYUP/DOWN 1.2EX-DIV 3/20YIELD 1.5%
GROWTH RATE +22%EARNINGS STAB 17EPS RANK 95PE 19 (1.1XS&P)5 YR PE 16 - 30
DEBT 0%NEW CEOTIMELINESS AACC/DIST ASMR RATING A
4.96 X BK VALUEINVENTORY TO. 8.2XR&D 8.8%RET ON EQUITY 22%CASH FLOW $6.11
FUNDS 57%BANKS 1%MGMT 2%ALPHA N/ABETA 1.47
113.47
119.32
123.76
104.95
111.30
115.61
97.42
104.03 103.46
89.19
82.24 80
QTR 1QTR 4
QTR 3
QTR 2
DIVINC
70
80
90
100
110
120
130
140
PRICE SCALE
99COMPOSITE RATING(W)13$ 2.10 $ 45 3114 2.10 49 3815 2.26 53 3716 2.68 64 3417 3.56 102 6218 5.22 123 8219 7.07EST +35% ↑20 8.30EST +17% ↑
EARNINGS (SEP) HI LOAcmResrch ACMR 95 34KLA KLAC 90 92Ichor Hldn ICHR 88 59Entegris ENTG 87 85Formfactor FORM 86 79
GROUP REL STR 81 RS EPS
29151151184217239261228143117320622825112713MARFEBJAN 19DECNOVOCTSEPAUGJULJUNMAY
EARNINGS $SALES MIL. $DIVIDEND-PE
1.19 VS 0.76 +57%143.0 VS 119.2 +20%$0.40 30X-- 24X
1.37 VS 0.81 +69%150.4 VS 128.0 +18%$0.40 30X-- 23X
1.48 VS 1.07 +38%156.7 VS 136.8 +15%N/A 28X-- 21X
1.90 VS 1.19 +60%221.8 VS 140.0 +58%$0.80 22X-- 16X
EPS DUE*4/26 QUARTER ENDED MAR 31,18 QUARTER ENDED JUN 30,18 QUARTER ENDED SEP 30,18 QUARTER ENDED DEC 31,18
R S LINE VS SP500
VOLUME
66K
138K
300K
*FORTINET INC(FTNT) NASDAQ 170.6 SHRS / 139.9 FLT / AVG VOL1.82MIL $83.97(OH -11%)COMPUTER SFTWR-SECURITY fortinet.comDEVELOPS UNIFIED THREAT MANAGEMENT SYSTEMS TO PROVIDE SECURITY AND NETWORKING FUNCTIONS
2/19 EXPECTS 2019 ADJUSTED EARNINGS OF $2.05 TO $2.10 PER DILUTED SHARE ON REVENUES OF $2.06 BIL TO $2.10 BIL.
SHORT INT 4.5 DAYS +7%OPTIONS ON AM/MSUP/DOWN 1.2EX-DIVYIELD
GROWTH RATE +31%EARNINGS STAB 18EPS RANK 98PE 47 (2.6XS&P)5 YR PE 36 - 112
DEBT 0%NEW CEOTIMELINESS AACC/DIST CSMR RATING A
14.46 X BK VALUEINVENTORY TO. 21.5XR&D 13.6%RET ON EQUITY 40%CASH FLOW $2.69
FUNDS 35%BANKS 2%MGMT 18%ALPHA 0.15BETA 1.31
57.98
66.32
94.37
84.00
77.18
88.60
53.40
62.2764.65 64.41
79.68
91
QTR 1QTR 4
QTR 3
QTR 2
40
50
60
70
80
90
100
110
PRICE SCALE
99COMPOSITE RATING(W)$6.25IPO 11/18/0913$ 0.49 $ 25 1614 0.48 31 1815 0.51 50 2816 0.73 37 2317 1.04 45 2918 1.84 94 4319 2.08EST +13% ↑20 2.36EST +13% ↑
EARNINGS (DEC) HI LOZscaler ZS 99 73CybArkSftw CYBR 98 99Rapid7 RPD 98 38Okta A OKTA 97 43Securework SCWX 96 73
GROUP REL STR 98 RS EPS
29151151184217239261228143117320622825112713MARFEBJAN 19DECNOVOCTSEPAUGJULJUNMAY
EARNINGS $SALES MIL. $DIVIDEND-PE
0.33 VS 0.17 +94%399.0 VS 340.6 +17%N/A 53X-- 43X
0.41 VS 0.27 +52%441.3 VS 363.5 +21%N/A 56X-- 45X
0.49 VS 0.28 +75%453.9 VS 374.2 +21%N/A 69X-- 47X
0.59 VS 0.32 +84%507.0 VS 416.7 +22%N/A 70X-- 42X
EPS DUE 5/3 QUARTER ENDED MAR 31,18 QUARTER ENDED JUN 30,18 QUARTER ENDED SEP 30,18 QUARTER ENDED DEC 31,18
R S LINE VS SP500 VOLUME
800K
2.5M
8M

16
MarketSmith.com // 2019 Q2
In this edition of Good Trade / Bad Trade,
Andrew Rocco shared a couple of his
trades from last year—one winner and
one loser—and told us what he learned
from each.
TIP: pull up daily charts for BZUN and TSLA in MarketSmith and see how you would have handled these trades!
GOOD TRADE: BAOZUN (BZUN)
The Timeframe: May 2018 – June 2018
Stock Background: This trade came at a time when Chinese stocks were
very strong performers, so I felt like this stock might have good tailwinds.
Add to that the fact that it’s an enterprise software stock, one of the best-
performing industry groups from 2018, and I was intrigued. I really liked
BZUN’s consistently strong earnings and sales growth.
I’ve heard Baozun described as “the Shopify of China,” meaning the
company’s products and services are innovative and serve a huge need in
a market with enormous potential. E-commerce is exploding in China, and
this service helps optimize e-commerce websites, so it’s a great second-
order recipient of a larger trend.
Technical Picture: When I was watching Baozun in May 2018, it was in the
middle of a consolidation-type base after a big gap up on its Q4 earnings
report. The next earnings report was coming up on May 17; just before
that, there was a little shakeout and most of the weak hands were cleared
out. I was ready to pounce if the stock gapped up on earnings.
Good Trade/Bad Trade
The Trader: Andrew Rocco, MarketSmith Product Coach

17
MarketSmith.com // 2019 Q2
My Buy Point: May 17, 2018 at 48. The stock gapped up on a really
strong earnings report and broke out of the consolidation during the day.
I bought in when it broke through the 50-day line, and the stock cleared a
52.43 buy point that same day. BZUN displayed some traits I really like to
see in a breakout: volume was 435% above average, it closed high in the
range and it held the pivot point.
How I Held It: BZUN went up from the get-go. I was tempted to add on
at points, but I don’t like to drive up my average cost per share on volatile
stocks. For this one, I just rode it and waited to either hit my profit target
or sell defensively if it broke the 50-day line.
My Sell Point: June 12, 2018 at 65. I had my standard 20-25% profit
target on this trade, and it crossed that threshold at 60. It was around
this time that the market was starting to act shaky, so I decided to sell
offensively around 65. That proved to be fortunate—it topped at 67.41
and then dove into a base. BZUN was at 51.50 just 15 days later; I would
have nearly roundtripped it if I ignored my profit target to chase a top.
My 4 Takeaways:
• Keep an eye on promising new growth areas. In this case, BZUN was
a hot type of stock (a Chinese ADR) in a hot industry group (Enterprise
Software).
• Be prepared to jump in quickly when earnings reports come out.
• Signs that point to a successful breakout: big volume plus a close at the
high end of the range and above the pivot.
• If a trade hits your profit target, it’s more than okay to sell offensively
and not worry about catching the very top.

18
MarketSmith.com // 2019 Q2
BAD TRADE: TESLA (TSLA)
The Timeframe: October 2018 – December 2018
Stock Background: I thought Tesla was going to be the next Apple. I still
think it might. The fundamental story of this stock is what really excited
me: an innovative new product (advanced electric cars) that’s a cut above
everything else in the market. They have a big first-mover advantage in a
field that will grow exponentially in the next decade.
The fundamental numbers, on the other hand, had some warning signs
I overlooked because I was so bullish on the story. The company carries
a high debt ratio. Production problems with the cars meant that sales
growth had a hard ceiling. The company had years of negative earnings
per share. I overlooked
these signs because I
had a lot of conviction
in the company.
Technical Picture: There were plenty of
warning signs in the
technical picture. The
Cup-with-Handle base
that TSLA was forming
when I bought it was
very wide and loose,
with the right side of
the cup being really steep. The base just had a lot of technical flaws. But
maybe the biggest mistake was not waiting for a strong prior uptrend
preceding the base. CAN SLIM® relies on trends, so if there’s no prior
uptrend in the stock, it’s really an iffy bet.
First Buy
Added On
Sold

19
MarketSmith.com // 2019 Q2
My Buy Point: October 25, 2018 at 310. I bought the stock when it
broke the 200-day line on nearly double average volume. It was still far
away from the 366.85 proper buy point of the base, so it was maybe an
aggressive alternative entry point.
How I Held It: Since it was going up, I was optimistic! I added to the position in the handle of the Cup-with-Handle at around 350. Which,
of course, drove up my average cost per share. Pretty soon TSLA hit the
proper buy point, but the breakout failed. There was low volume, mostly
sideways price action and waning relative strength. Plus the market was
really running into that bad December correction! TSLA started plunging
on December 14 and I held on to see if it would rebound.
My Sell Point: December 20, 2018 at 328. Having already given back
my profits, I sold my whole position when it crashed through the 50-day
line as part of its dive to a December low of 294. I roundtripped this one
badly. The sting of the trade was magnified because I had a relatively large
position size after I added to it, something you normally don’t want to do
with more volatile stocks because the big swings can crush your account.
My 4 Takeaways:
• Good fundamentals aren’t enough—you need to be patient and wait
for good technical setups.
• Sometimes your strong conviction in a stock can work against you.
• Tight, symmetrical bases and a 30% prior uptrend are really important
technical indicators.
• Smaller position sizes for volatile stocks help prevent big swings from
inflicting major damage on your portfolio.

20
The MarketSmith product team recently redesigned the interface to
make it easier to find new stock ideas. Above every MarketSmith chart
in the top-right, you’ll find the new orange “Open Stock Ideas” button.
Click it and you’ll see the top lists to check for your daily or weekly
stock research.
Features Highlight: Stock Ideas Button
Start Here for Trade Ideas
The Open Stock Ideas button is a great first step in your investing routine.
The window displays the current market trend at the top and has three
tabs to choose from: Uptrend, Correction and Earnings.
If the market is in an Uptrend, you’ll want to search those lists for potential
buys; many of the stock lists here are focused on stocks in the vicinity of
a buy point. If the market is in a Correction, those lists will feature the
strongest names to keep an eye on for when a new uptrend starts. The
Earnings tabs features lists of stocks that have reported earnings or will
soon do so. This is worth paying attention to, as earnings reports can
greatly affect the prices of stocks on the day they are released.

21
Daily Routines
Whether you selected the Uptrend or Downtrend tab, the Stock Ideas
window has the option for either a Daily Routine or a Weekly Routine.
The Daily Routine contains lists helpful for finding and monitoring stocks
throughout the week during and after trading hours. Daily lists and
screens are generally tighter and more focused on timely potential trades;
Breaking Out Today, Recent Breakouts and Near Pivot are the top 3 lists.
Weekly Routines
The Weekly Routine lists, on the other hand, represent a broader universe
of stocks, with some of these lists having over 100 names. During the
weekend when the market is closed, it’s an ideal time to cast a wide net
and look for new trading ideas you may not have come across during more
focused daily screens. These lists are filled with fundamentally strong
stocks that might not necessarily be near a buy point, but nonetheless
could be worth putting on your watchlist.

22
Resources
MarketSmith® Mobile Apps
MarketSmith has a full suite of tablet
and phone apps—and they’re included
with your subscription! Download
them today from the Apple App Store
and the Google Play Store, then log in with the same email and password
you use to access MarketSmith from your desktop. See how to get the
most out of the mobile apps in our Video Tutorials section by going to
the MarketSmith home page and hovering over the “Learn” section, then
selecting “Video Tutorials.” __________________________________________________________________________________
High-Powered Stock Lists
Pattern Recognition and the Growth 250 list are two of MarketSmith’s
most powerful features, and when you combine the two it creates timely
and highly selective stock lists. These G250 Pattern Recognition lists
make it easy to find all of today’s breakouts, plus recent breakouts, stocks
near a buy point, stocks in tight areas and stocks showing strong power
from their pivot point. Find them all in the lists window at the bottom of
MarketSmith by going to Reports > MarketSmith Growth 250 > G250
Pattern Recognition. __________________________________________________________________________________
Stay in Step with the Market
MarketSmith’s monthly “Stay in Step
with the Market” webinar is a must-
watch for timely market analysis and
evergreen investing strategies to help
you trade better. Our Senior Product
Coaches dive into the current market and analyze the trends, leading
stocks and potential breakouts that investors need to know. Watch the
latest episode at: Investors.com/mswebinars
STAY

23
Follow us for exclusive offers, giveaways and stock investing tips.
Get actionable investing content, unique financial stories and
live videos with market updates on our Facebook page.
______________________________________________________________________
Get real-time updates on the stock market throughout the day
on Twitter. Tweet us @MarketSmith with your thoughts on the
market.
______________________________________________________________________
IBD’s StockTwits allows you to connect with other stock traders
to get tips on growing your portfolio.
______________________________________________________________________
Reach out and network with the IBD® and MarketSmith® teams
on LinkedIn to get in-depth investing knowledge.
______________________________________________________________________
Check out Friday’s video market update for our take on the
market action in the week that was. Plus, you’ll find timely tips
for your stock research routine.
______________________________________________________________________
Our Instagram gives you a behind-the-scenes look at how the
IBD® and MarketSmith® teams work to help you succeed in the
market.
Connect with Us

Get the Big Picture with IBD® Digital! Investor’s Business Daily® has been covering investing every day for over 30 years. Our team analyzes the markets from open to close and beyond. That’s why you need IBD Digital: one subscription gives you access to all of our actionable market analysis and original research. It’s like having a personal stock research team available 24 / 7 on your desktop, tablet and phone.
MarketSmith® Members: Try IBD® Digital for 5 weeks for only $5!
Investors.com/5for5
STAY ON TOP OF
THE MARKET

Copyright © 2019 Investor’s Business Daily, Inc., Investor’s Business Daily, IBD, CAN SLIM, and corresponding logos are registered trademarks owned by Investor’s Business Daily, Inc. MarketSmith is a registered trademark of MarketSmith, Incorporated.
The material contained herein is not to be reproduced, redistributed, published, stored in a retrieval system, or transmitted in any form or by any means, electronic mechanical, photocopying, recording, or otherwise, without prior written permission of Investor’s Business Daily, Inc. and MarketSmith Incorporated.
Data provided under license agreement by William O’Neil + Co. Incorporated. All material presented here has been obtained or derived from sources believed to be accurate, but Investor’s Business Daily, Inc., MarketSmith Inc., and William O’Neil + Company, Inc. do not guarantee its accuracy and it may possibly be incomplete and/or condensed. The contents are based on the study and interpretation of available data as it relates to our historical models of the best performing stocks. This is not a prospectus; no effort on our part with respect to sale or purchase of any securities is intended or implied. Any chart appearing in this material is for educational purposes and is not, and should not be construed as a recommendation or rating to buy or sell any security. It is possible that at this date or some subsequent date the officers, directors and/or shareholders of William O’Neil + Company, Inc., MarketSmith Inc. and Investor’s Business Daily, Inc. and their affiliates own securities or buy or sell securities listed in the following pages or those not mentioned.
Standard & Poor’s US Index Data
Copyright © 2019, Standard & Poor’s Financial Services LLC (“S&P”). Reproduction of S&P US Index Data in any form is prohibited except with the prior written permission of S&P. Because of the possibility of human or mechanical error by S&P’s sources, S&P or others, S&P does not guarantee the accuracy, adequacy, completeness, timeliness or availability of any information and is not responsible for any errors or omissions or for the results obtained from the use of such information. S&P GIVES NO EXPRESS OR IMPLIED WARRANTIES, INCLUDING, BUT NOT LIMITED TO, ANY WARRANTIES OF MERCHANTABILITY OR FITNESS FOR A PARTICULAR PURPOSE OR USE. In no event shall S&P or its affiliates be liable for any indirect, special or consequential damages in connection with subscriber’s or others’ use of S&P US Index Data. (2012)

1265
5 Be
atric
e St
reet
Los
Ange
les,
CA
9006
6
CO
NN
ECT
WIT
H U
S
STO
CK G
UID
E //
20
19
Q2
The
Blu
e D
ot L
ist :
Our
new
est f
eatu
re fo
r fin
ding
top
stoc
ks


![Investor's / Analyst Presentation [Company Update]](https://static.fdocuments.net/doc/165x107/577c7c241a28abe05499770f/investors-analyst-presentation-company-update.jpg)


![Investor's brief [Company Update]](https://static.fdocuments.net/doc/165x107/577c7e711a28abe054a12f95/investors-brief-company-update.jpg)


