
Q2 2019 Earnings - WESCO Investor...
17
1 Q2 2019 Earnings Webcast Presentation August 1, 2019
Transcript of Q2 2019 Earnings - WESCO Investor...
1
Q2 2019 EarningsWebcast Presentation
August 1, 2019
2
Forward Looking StatementsAll statements made herein that are not historical facts should be considered as “forward-looking statements” within the meaningof the Private Securities Litigation Act of 1995. Such statements involve known and unknown risks, uncertainties and other factors that may cause actual results to differ materially. Such risks, uncertainties and other factors include, but are not limited to:adverse economic conditions; increase in competition; expansion of business activities; disruptions in operations or informationtechnology systems; supply chain disruptions, changes in supplier strategy or loss of key suppliers; personnel turnover or laborcost increases; risks related to acquisitions, including the integration of acquired businesses; changes in tax laws, regulations and guidance, and uncertainties regarding their application, and challenges by tax authorities to the company’s tax positions; exchange rate fluctuations; debt levels, terms, financial market conditions or interest rate fluctuations; stock market, economic or political instability; legal or regulatory matters; litigation, disputes, contingencies or claims; and other factors described in detail in the Form 10-K for WESCO International, Inc. for the year ended December 31, 2018 and any subsequent filings with the Securities & Exchange Commission. The following presentation includes a discussion of certain non-GAAP financial measures. Information required by Regulation G with respect to such non-GAAP financial measures can be found in the appendix and obtained via WESCO’s website, www.wesco.com.
Non-GAAP MeasuresThis presentation includes certain non-GAAP financial measures. These financial measures include organic sales growth, gross profit, financial leverage, earnings before interest, taxes, depreciation and amortization (EBITDA), and free cash flow. The Company believes that these non-GAAP measures are useful to investors as they provide a better understanding of sales performance, and the use of debt and liquidity on a comparable basis. Management does not use these non-GAAP financial measures for any purpose other than the reasons stated above.
3
Q2 2019 Highlights
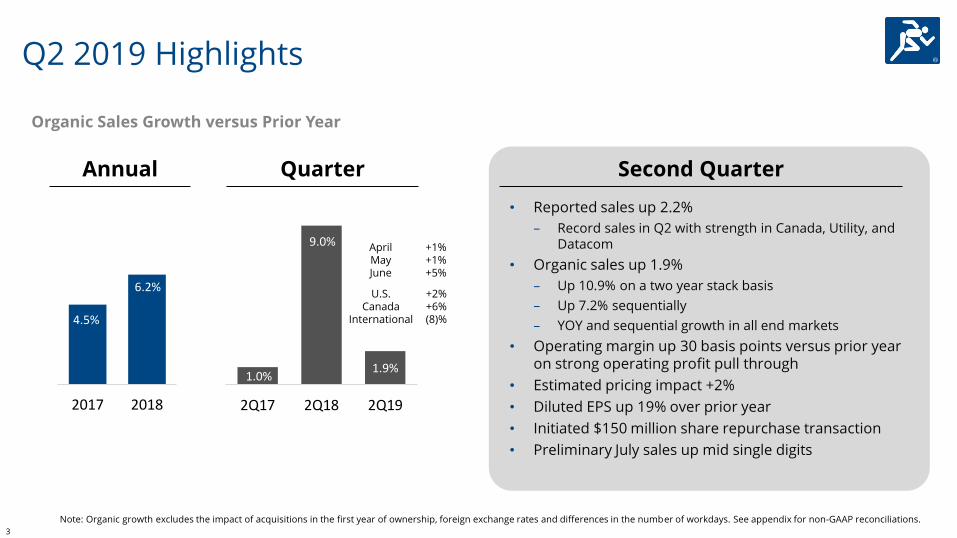
Note: Organic growth excludes the impact of acquisitions in the first year of ownership, foreign exchange rates and differences in the number of workdays. See appendix for non-GAAP reconciliations.
4.5%
6.2%
2017 2018
1.0%
9.0%
1.9%
2Q17 2Q18 2Q19
Annual Quarter
Organic Sales Growth versus Prior Year
• Reported sales up 2.2%
– Record sales in Q2 with strength in Canada, Utility, and Datacom
• Organic sales up 1.9%
– Up 10.9% on a two year stack basis
– Up 7.2% sequentially
– YOY and sequential growth in all end markets
• Operating margin up 30 basis points versus prior year on strong operating profit pull through
• Estimated pricing impact +2%
• Diluted EPS up 19% over prior year
• Initiated $150 million share repurchase transaction
• Preliminary July sales up mid single digits
Second Quarter
U.S. +2%Canada +6%
International (8)%
April +1%May +1%June +5%
4
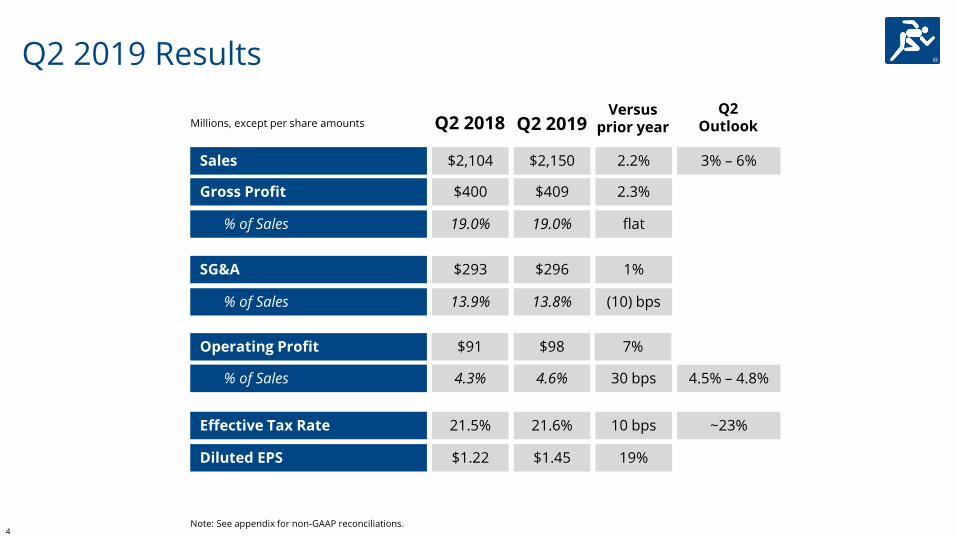
Q2 2019 Results
Sales
Gross Profit
% of Sales
SG&A
Operating Profit
$2,104 $2,150
$400 $409
19.0% 19.0%
Q2 2018 Q2 2019
$293 $296
$91 $98
% of Sales 4.3% 4.6%
Effective Tax Rate
Diluted EPS
21.5% 21.6%
$1.22 $1.45
Versus prior year
2.2%
2.3%
flat
(10) bps% of Sales 13.9% 13.8%
1%
30 bps
7%
Q2 Outlook
3% – 6%
4.5% – 4.8%
~23%10 bps
19%
Millions, except per share amounts
Note: See appendix for non-GAAP reconciliations.
5
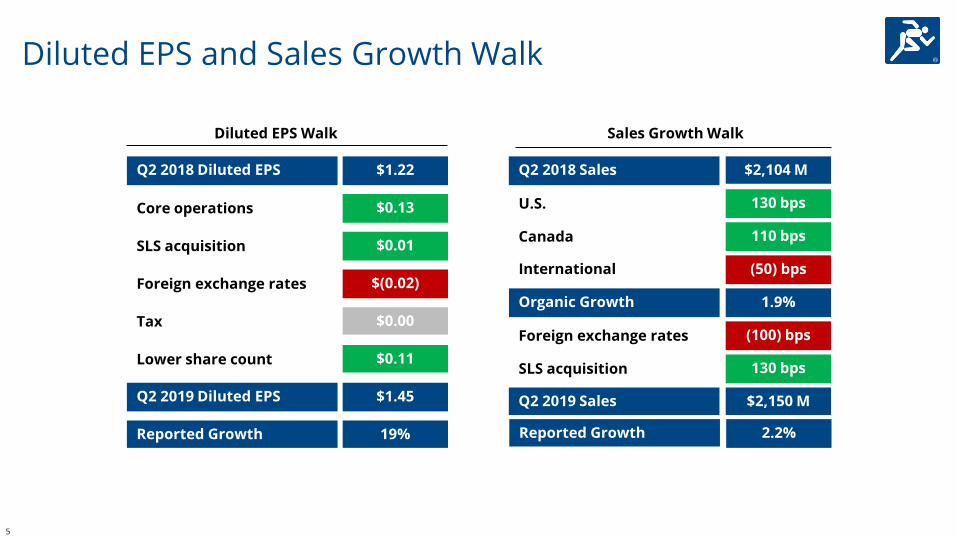
Diluted EPS and Sales Growth Walk
Diluted EPS Walk
Core operations $0.13
SLS acquisition $0.01
Foreign exchange rates $(0.02)
Q2 2018 Diluted EPS $1.22
Tax $0.00
Lower share count $0.11
Q2 2019 Diluted EPS $1.45
Reported Growth 19%
Sales Growth Walk
U.S. 130 bps
Canada 110 bps
International (50) bps
Q2 2018 Sales $2,104 M
Organic Growth 1.9%
130 bpsSLS acquisition
Foreign exchange rates (100) bps
Reported Growth 2.2%
Q2 2019 Sales $2,150 M
6
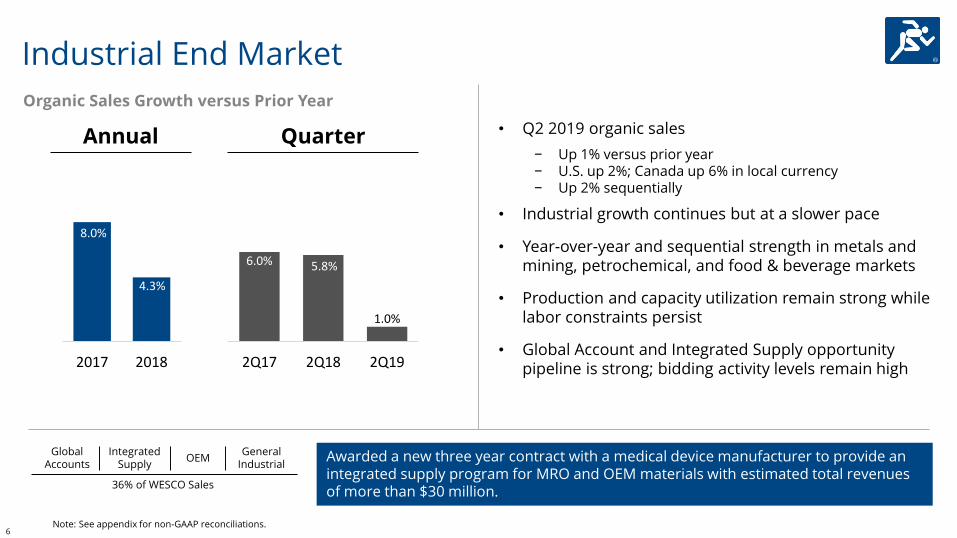
Industrial End Market
• Q2 2019 organic sales
− Up 1% versus prior year− U.S. up 2%; Canada up 6% in local currency− Up 2% sequentially
• Industrial growth continues but at a slower pace
• Year-over-year and sequential strength in metals and mining, petrochemical, and food & beverage markets
• Production and capacity utilization remain strong while labor constraints persist
• Global Account and Integrated Supply opportunity pipeline is strong; bidding activity levels remain high
8.0%
4.3%
2017 2018
6.0% 5.8%
1.0%
2Q17 2Q18 2Q19
Annual Quarter
Global Accounts
OEMGeneral
Industrial
36% of WESCO Sales
IntegratedSupply
Awarded a new three year contract with a medical device manufacturer to provide an integrated supply program for MRO and OEM materials with estimated total revenues of more than $30 million.
Organic Sales Growth versus Prior Year
Note: See appendix for non-GAAP reconciliations.
7
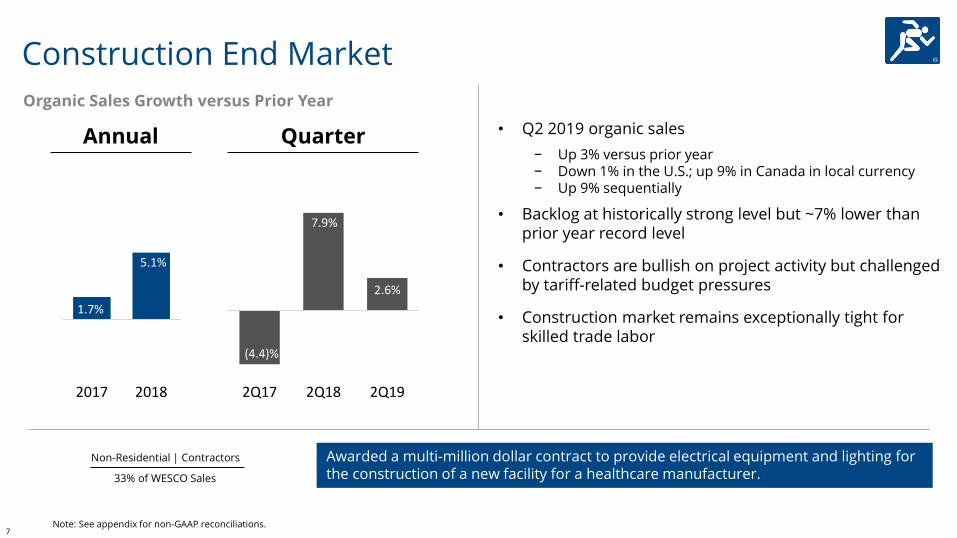
• Q2 2019 organic sales
− Up 3% versus prior year− Down 1% in the U.S.; up 9% in Canada in local currency− Up 9% sequentially
• Backlog at historically strong level but ~7% lower than prior year record level
• Contractors are bullish on project activity but challenged by tariff-related budget pressures
• Construction market remains exceptionally tight for skilled trade labor
Construction End Market
Note: See appendix for non-GAAP reconciliations.
1.7%
5.1%
2017 2018
(4.4)%
7.9%
2.6%
2Q17 2Q18 2Q19
Annual Quarter
Non-Residential | Contractors
33% of WESCO Sales
Awarded a multi-million dollar contract to provide electrical equipment and lighting for the construction of a new facility for a healthcare manufacturer.
Organic Sales Growth versus Prior Year
8
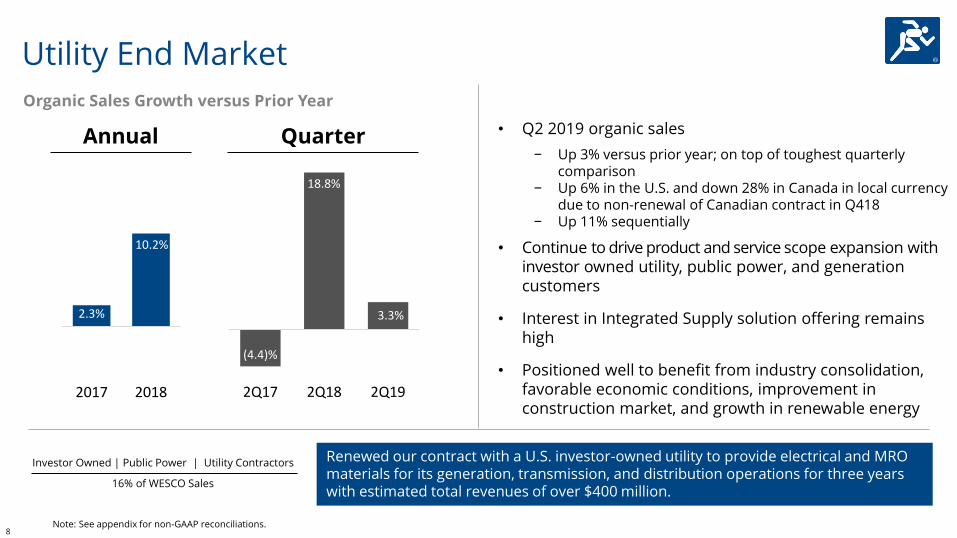
Utility End Market
• Q2 2019 organic sales
− Up 3% versus prior year; on top of toughest quarterly comparison
− Up 6% in the U.S. and down 28% in Canada in local currency due to non-renewal of Canadian contract in Q418
− Up 11% sequentially
• Continue to drive product and service scope expansion withinvestor owned utility, public power, and generation customers
• Interest in Integrated Supply solution offering remains high
• Positioned well to benefit from industry consolidation, favorable economic conditions, improvement in construction market, and growth in renewable energy
2.3%
10.2%
2017 2018
(4.4)%
18.8%
3.3%
2Q17 2Q18 2Q19
Annual Quarter
Investor Owned | Public Power | Utility Contractors
16% of WESCO Sales
Renewed our contract with a U.S. investor-owned utility to provide electrical and MRO materials for its generation, transmission, and distribution operations for three years with estimated total revenues of over $400 million.
Organic Sales Growth versus Prior Year
Note: See appendix for non-GAAP reconciliations.
9
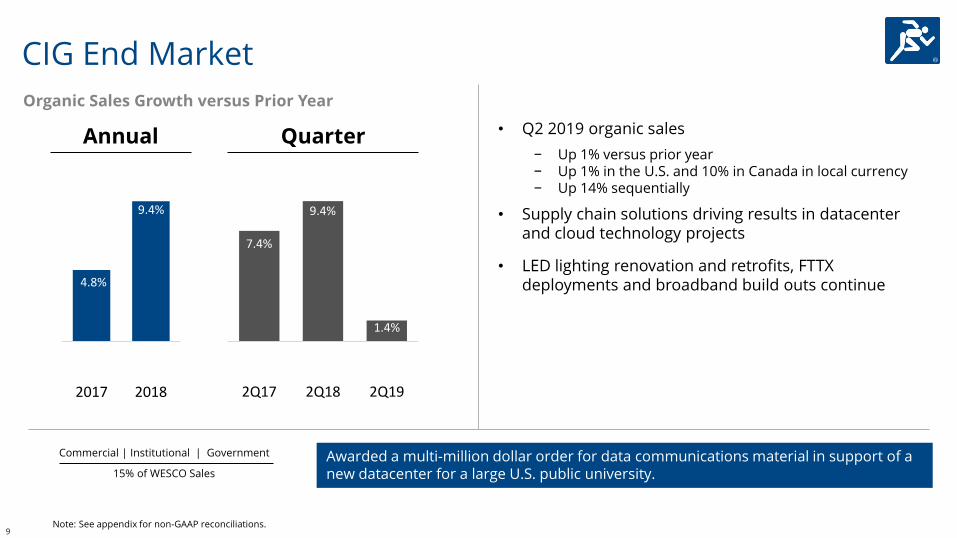
CIG End Market
• Q2 2019 organic sales
− Up 1% versus prior year − Up 1% in the U.S. and 10% in Canada in local currency− Up 14% sequentially
• Supply chain solutions driving results in datacenter and cloud technology projects
• LED lighting renovation and retrofits, FTTX deployments and broadband build outs continue
Annual Quarter
4.8%
9.4%
2017 2018
7.4%
9.4%
1.4%
2Q17 2Q18 2Q19
Commercial | Institutional | Government
15% of WESCO Sales
Awarded a multi-million dollar order for data communications material in support of a new datacenter for a large U.S. public university.
Organic Sales Growth versus Prior Year
Note: See appendix for non-GAAP reconciliations.
10
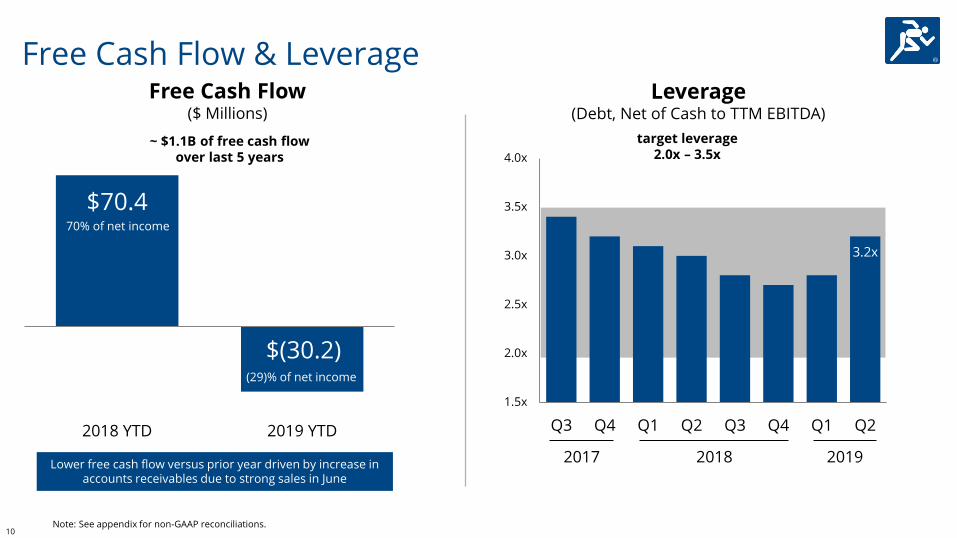
3.2x
1.5x
2.0x
2.5x
3.0x
3.5x
4.0x
Q3 Q4 Q1 Q2 Q3 Q4 Q1 Q2
Free Cash Flow & Leverage
$70.4
$(30.2)
2018 YTD 2019 YTD
Free Cash Flow($ Millions)
target leverage 2.0x – 3.5x
Leverage(Debt, Net of Cash to TTM EBITDA)
2017 20192018
~ $1.1B of free cash flow over last 5 years
(29)% of net income
Note: See appendix for non-GAAP reconciliations.
Lower free cash flow versus prior year driven by increase in accounts receivables due to strong sales in June
70% of net income
11
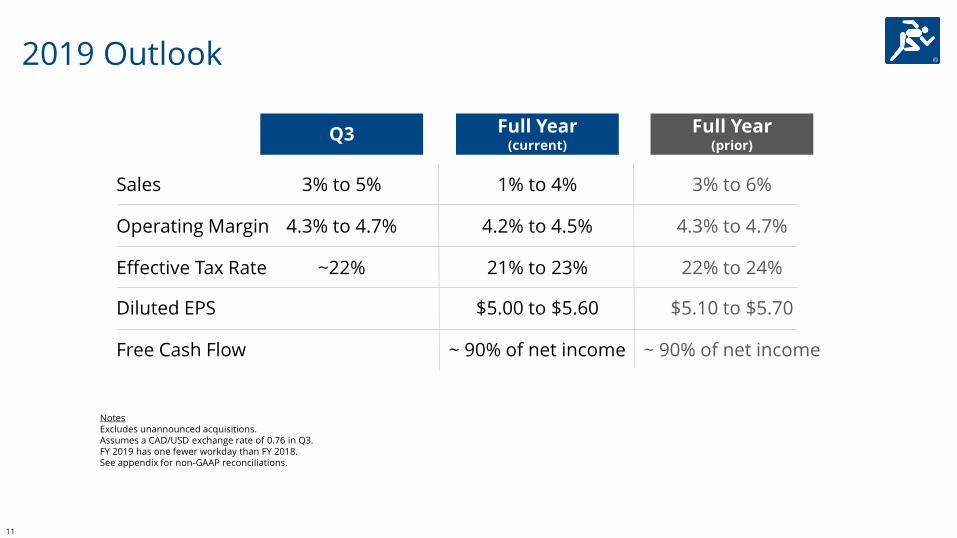
NotesExcludes unannounced acquisitions.Assumes a CAD/USD exchange rate of 0.76 in Q3.FY 2019 has one fewer workday than FY 2018.See appendix for non-GAAP reconciliations.
2019 Outlook
Sales
Operating Margin
Effective Tax Rate
Diluted EPS
Free Cash Flow
Full Year(current)
1% to 4%
4.2% to 4.5%
21% to 23%
$5.00 to $5.60
~ 90% of net income
Full Year(prior)
3% to 6%
4.3% to 4.7%
22% to 24%
$5.10 to $5.70
~ 90% of net income
Q3
3% to 5%
4.3% to 4.7%
~22%

APPENDIX
13
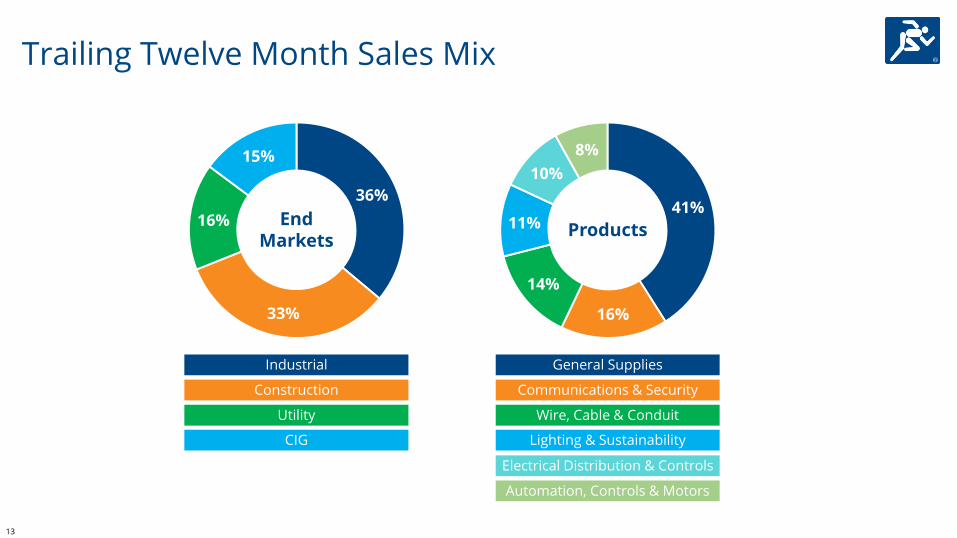
36%
33%
16%
15%
41%
16%
14%
11%
10%
8%
Trailing Twelve Month Sales Mix
End Markets
Automation, Controls & Motors
Lighting & Sustainability
General Supplies
Communications & Security
Wire, Cable & Conduit
Electrical Distribution & Controls
Industrial
Construction
Utility
CIG
Products
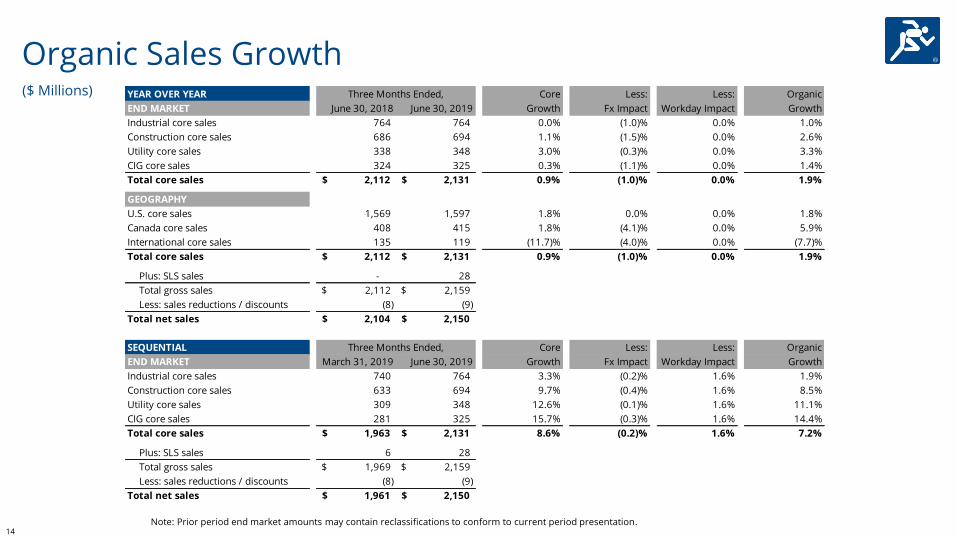
14Note: Prior period end market amounts may contain reclassifications to conform to current period presentation.
($ Millions)
Organic Sales GrowthYEAR OVER YEAR
END MARKET June 30, 2018 June 30, 2019
Industrial core sales 764 764 0.0% (1.0)% 0.0% 1.0%
Construction core sales 686 694 1.1% (1.5)% 0.0% 2.6%
Utility core sales 338 348 3.0% (0.3)% 0.0% 3.3%
CIG core sales 324 325 0.3% (1.1)% 0.0% 1.4%
Total core sales 2,112$ 2,131$ 0.9% (1.0)% 0.0% 1.9%
GEOGRAPHY
U.S. core sales 1,569 1,597 1.8% 0.0% 0.0% 1.8%
Canada core sales 408 415 1.8% (4.1)% 0.0% 5.9%
International core sales 135 119 (11.7)% (4.0)% 0.0% (7.7)%
Total core sales 2,112$ 2,131$ 0.9% (1.0)% 0.0% 1.9%
Plus: SLS sales - 28
Total gross sales 2,112$ 2,159$
Less: sales reductions / discounts (8) (9)
Total net sales 2,104$ 2,150$
SEQUENTIAL
END MARKET March 31, 2019 June 30, 2019
Industrial core sales 740 764 3.3% (0.2)% 1.6% 1.9%
Construction core sales 633 694 9.7% (0.4)% 1.6% 8.5%
Utility core sales 309 348 12.6% (0.1)% 1.6% 11.1%
CIG core sales 281 325 15.7% (0.3)% 1.6% 14.4%
Total core sales 1,963$ 2,131$ 8.6% (0.2)% 1.6% 7.2%
Plus: SLS sales 6 28
Total gross sales 1,969$ 2,159$
Less: sales reductions / discounts (8) (9)
Total net sales 1,961$ 2,150$
Three Months Ended, Core
Growth
Less:
Fx Impact
Less:
Workday Impact
Organic
Growth
Three Months Ended, Core
Growth
Less:
Fx Impact
Less:
Workday Impact
Organic
Growth
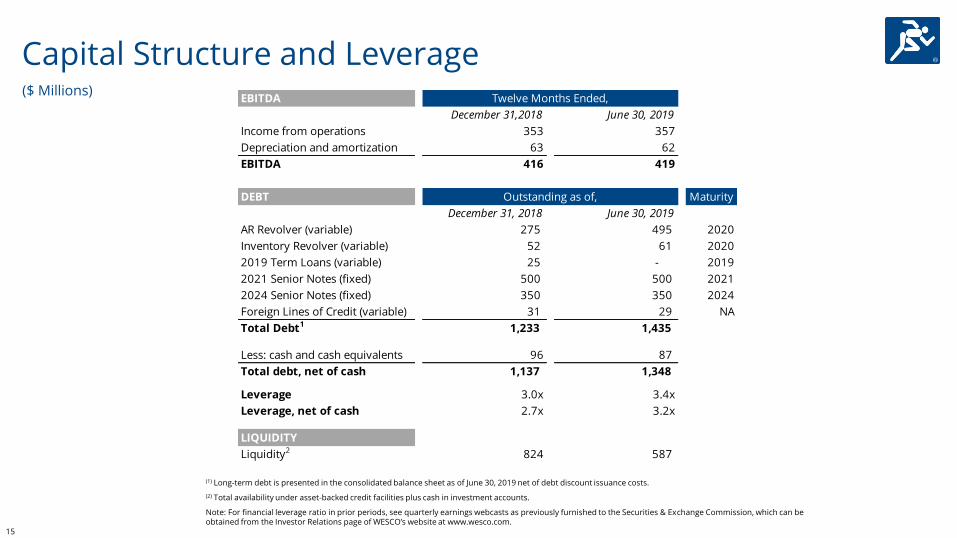
15
Capital Structure and Leverage
(2) Total availability under asset-backed credit facilities plus cash in investment accounts.
(1) Long-term debt is presented in the consolidated balance sheet as of June 30, 2019 net of debt discount issuance costs.
Note: For financial leverage ratio in prior periods, see quarterly earnings webcasts as previously furnished to the Securities & Exchange Commission, which can be obtained from the Investor Relations page of WESCO’s website at www.wesco.com.
($ Millions)EBITDA Twelve Months Ended,
December 31,2018 June 30, 2019
Income from operations 353 357
Depreciation and amortization 63 62
EBITDA 416 419
DEBT Outstanding as of, Maturity
December 31, 2018 June 30, 2019
AR Revolver (variable) 275 495 2020
Inventory Revolver (variable) 52 61 2020
2019 Term Loans (variable) 25 - 2019
2021 Senior Notes (fixed) 500 500 2021
2024 Senior Notes (fixed) 350 350 2024
Foreign Lines of Credit (variable) 31 29 NA
Total Debt1 1,233 1,435
Less: cash and cash equivalents 96 87
Total debt, net of cash 1,137 1,348
Leverage 3.0x 3.4x
Leverage, net of cash 2.7x 3.2x
LIQUIDITY
Liquidity2 824 587
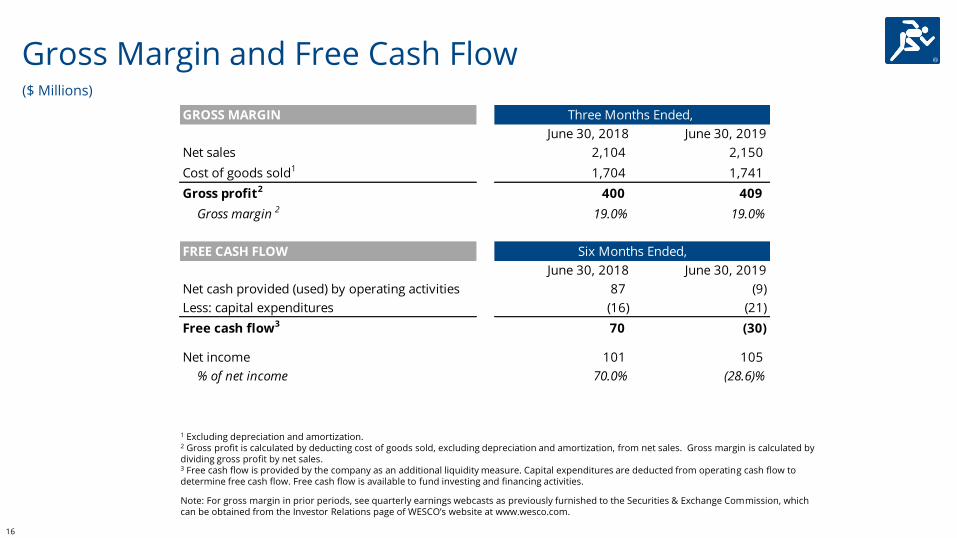
16
Gross Margin and Free Cash Flow
1 Excluding depreciation and amortization.2 Gross profit is calculated by deducting cost of goods sold, excluding depreciation and amortization, from net sales. Gross margin is calculated by dividing gross profit by net sales.3 Free cash flow is provided by the company as an additional liquidity measure. Capital expenditures are deducted from operating cash flow to determine free cash flow. Free cash flow is available to fund investing and financing activities.
Note: For gross margin in prior periods, see quarterly earnings webcasts as previously furnished to the Securities & Exchange Commission, which can be obtained from the Investor Relations page of WESCO’s website at www.wesco.com.
($ Millions)
GROSS MARGIN Three Months Ended,
June 30, 2018 June 30, 2019
Net sales 2,104 2,150
Cost of goods sold1 1,704 1,741
Gross profit2 400 409
Gross margin 2 19.0% 19.0%
FREE CASH FLOW Six Months Ended,
June 30, 2018 June 30, 2019
Net cash provided (used) by operating activities 87 (9)
Less: capital expenditures (16) (21)
Free cash flow3 70 (30)
Net income 101 105
% of net income 70.0% (28.6)%
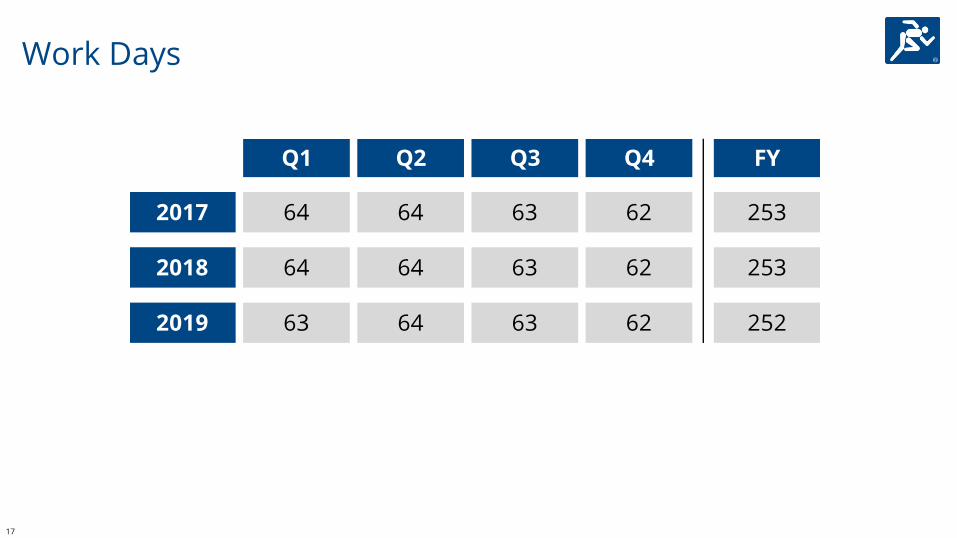
17
Work Days
Q1 Q2 Q3 Q4 FY
2017 64 64 63 62 253
2018 64 64 63 62 253
2019 63 64 63 62 252


