
Q2 2016 Earningsfilecache.investorroom.com/mr5ir_travelport/343/download... · 2016-08-04 · Q2...
25
Q2 2016 Earnings
Transcript of Q2 2016 Earningsfilecache.investorroom.com/mr5ir_travelport/343/download... · 2016-08-04 · Q2...

Q2 2016 Earnings

Related to Forward-Looking StatementsCertain items in this presentation and in today’s discussion, including matters relating to revenue, net income (loss), and percentages or calculations using these measures, capital structure, future business opportunities, plans, prospects or growth rates and other financial measurements and non-financial statements in future periods, constitute forward-looking statements. These forward-looking statements are based on management’s current views with respect to future results and are subject to risks and uncertainties. These statements are not guarantees of future performance. Actual results may differ materially from those contemplated by forward-looking statements. Travelport Worldwide Limited (the ‘Company’ or ‘Travelport’) refers you to our periodic reports and filings with the Securities and Exchange Commission (SEC), including our Annual Report on Form 10-K for the year ended December 31, 2015, filed with the SEC on February 18, 2016 and our Quarterly Reports on Form 10-Q for the quarter ended March 31, 2016, filed with the SEC on May 5, 2016, and for the quarter June 30, 2016, to be filed with the SEC on August 4, 2016, for additional discussion of these risks and uncertainties, as well as a cautionary statement regarding forward-looking statements. Forward-looking statements made during this presentation speak only as of today’s date. Travelport expressly disclaims any obligation to update or revise any forward-looking statements, whether as a result of new information, future events or otherwise.
Related to Non-GAAP Financial InformationTravelport analyzes its performance using Adjusted EBITDA, Adjusted Net Income/(Loss), Adjusted Income/(Loss) per Share, Adjusted Operating Income/(Loss), Capital Expenditures, Net Debt, and Adjusted Free Cash Flow, which are non-GAAP financial measures. Such measures may not be comparable to similarly named measures used by other companies. The Company believes these measures provide management with a more complete understanding of underlying results, trends and the liquidity of the core operating business, along with the Company’s ability to meet its current and future financing and investing needs. Adjusted EBITDA is the primary metric, used to evaluate and understand our underlying operations and business trends, forecasting and determining future capital investment allocations. Adjusted EBITDA, Adjusted Net Income/(Loss), Adjusted Income/(Loss) per Share and Adjusted Operating Income/(Loss) are also used by the Board of Directors to determine incentive compensation for future periods. Capital Expenditures, which impact depreciation and amortization, interest expense and income tax expense, are reviewed separately by management. These measures are disclosed so that investors have the same tools as those available to management when evaluating the results of Travelport. These non-GAAP measures are defined in the ‘Definitions’ appendix of this presentation and discussed and reconciled to GAAP measures in our quarterly and annual filings with the SEC.
Disclaimers
2 This document supports the Company’s Q2 2016 Results Presentation, a recording of which will beavailable on Travelport’s investor relations website shortly after the live presentation on August 4, 2016

Q2 2016Gordon WilsonPresident and Chief Executive Officer
Key point summary
4
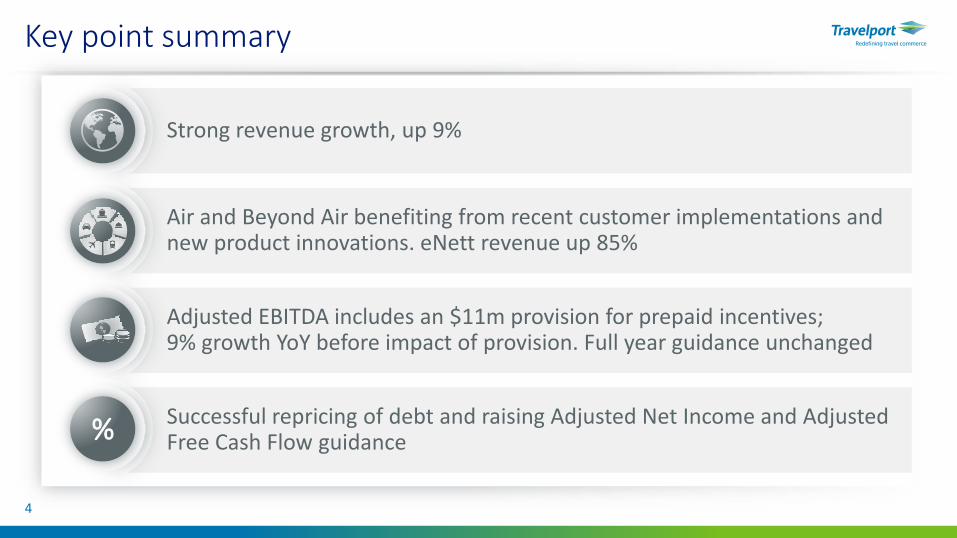
Strong revenue growth, up 9%
Air and Beyond Air benefiting from recent customer implementations and new product innovations. eNett revenue up 85%
Adjusted EBITDA includes an $11m provision for prepaid incentives; 9% growth YoY before impact of provision. Full year guidance unchanged
Successful repricing of debt and raising Adjusted Net Income and Adjusted Free Cash Flow guidance%

Q2 2016 highlights
Net Revenue AdjustedEBITDA
AdjustedNet Income
AdjustedEPS (diluted)
AdjustedFree Cash Flow
9% YoY 1% YoY $1m YoY $0.01 YoY $1m YoY
$606m $139m $34m $0.28 $52m
5
Travel Commerce Platform revenue up 10%– Air revenue up 6%– Beyond Air revenue up 22% (includes e eNett up 85%)
Technology Services revenue up 1%
Adjusted EBITDA up 1% to $139m
Fully provided $11m in relation to European travel agency. Offsets 9 percentage points of growth from rest of business. Post-tax impact $9m
Adjusted Free Cash Flow lower due to $14m of interest payments brought forward from Q3 as part of debt reprice

Revenue and Reported Segments
Travel Commerce Platform Revenue (YoY growth)
RevPas progression and YoY growth
Regions (% growth) Revenue ReportedSegments
International +15% YoY +3% YoY
US (2)% YoY (6)% YoY
All Regions +10% YoY —
International % 73%1 60%2
Memorandum disclosure3
US Ex Orbitz +1% YoY (1)% YoY
All Regions Ex Orbitz +11% YoY +2% YoY
Air YoY 4% — (2)% 6%
Beyond Air YoY 19% 12% 12% 22%
Q2 2016 Travel Commerce Platform revenue & Reported Segments - YoY Growth (%)
6
Q2 2013 Q2 2014 Q2 2015 Q2 2016
$6.00 $5.66 $5.75 $6.61
+2%YoY
+4%YoY
+10%YoY
CAGR+5%
CAGR+4%
Q2 2013 Q2 2014 Q2 2015 Q2 2016
+2%YoY
+1%YoY
+10%YoY
+6%YoY
$507m $518m $523m $574m
+4%YoY
1 Represents International revenue as a percentage of Travel Commerce Platform revenue2 Represents International Reported Segments as a percentage of Travel Commerce Platform Reported Segments3 Represents growth excluding the YoY impact of our renegotiated long-term contract with Orbitz Worldwide which was effected on January 1, 2015

Air revenue (up 6%) benefited from airline merchandising, mix and pricing
Expanded deals with Aeroméxico, Emirates and Aeroflot underscore breadth of Platform offering
Leading the industry for airline merchandising with >200 airlines signed and ~170 implemented
Air revenue (up 6%) benefited from airline merchandising, mix and pricing
7
Recent developments – Air
Away1
Air revenue
Q2 201666%2
Away1
Air segments
Q2 201646%3
Airline merchandising
Q2 2016~170 Airlines4
Air revenue ($m)
CAGR+1%
$410m $410m $401m $426m
+4%YoY
flatYoY (2)%
YoY
+6%YoY
Q2 2016Q2 2015Q2 2014Q2 2013
1 Away bookings are defined as bookings made by travel buyers located outside the travel provider’s home country2 Represents % of total air segment revenue from Away bookings3 Represents % of total air segments from Away bookings4 Airlines live with merchandising including fares families, branded fares, ancillaries and tailored offers as of August 4, 2016
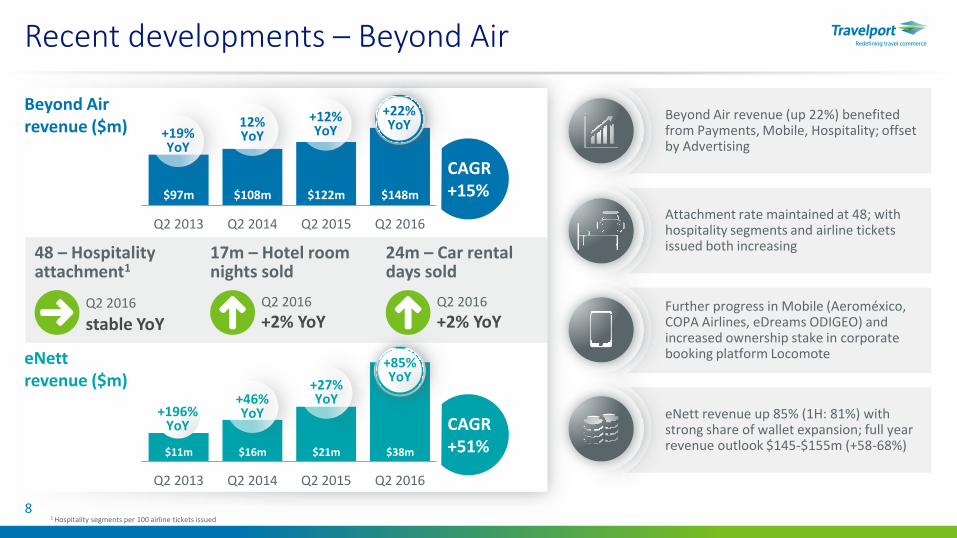
Beyond Air revenue (up 22%) benefited from Payments, Mobile, Hospitality; offset by Advertising
Attachment rate maintained at 48; with hospitality segments and airline tickets issued both increasing
Further progress in Mobile (Aeroméxico, COPA Airlines, eDreams ODIGEO) and increased ownership stake in corporate booking platform Locomote
eNett revenue up 85% (1H: 81%) with strong share of wallet expansion; full year revenue outlook $145-$155m (+58-68%)
48 – Hospitality attachment1
Recent developments – Beyond Air
Beyond Air revenue ($m)
CAGR+15%
Q2 2016
stable YoY
17m – Hotel room nights sold
Q2 2016
+2% YoY
24m – Car rentaldays sold
Q2 2016
+2% YoY
Q2 2013 Q2 2014 Q2 2015 Q2 2016
$97m $108m $122m $148m
+19%YoY
12%YoY
+12%YoY
+22%YoY
Q2 2013 Q2 2014 Q2 2015 Q2 2016
eNett revenue ($m)
+196%YoY
+46%YoY
+27%YoY
+85%YoY
CAGR+51%$11m $16m $21m $38m
81 Hospitality segments per 100 airline tickets issued

Q2 2016Bernard BotChief Financial Officer
Summarized income statement (1 of 2)
* SG&A – excluding Non-core corporate costs10
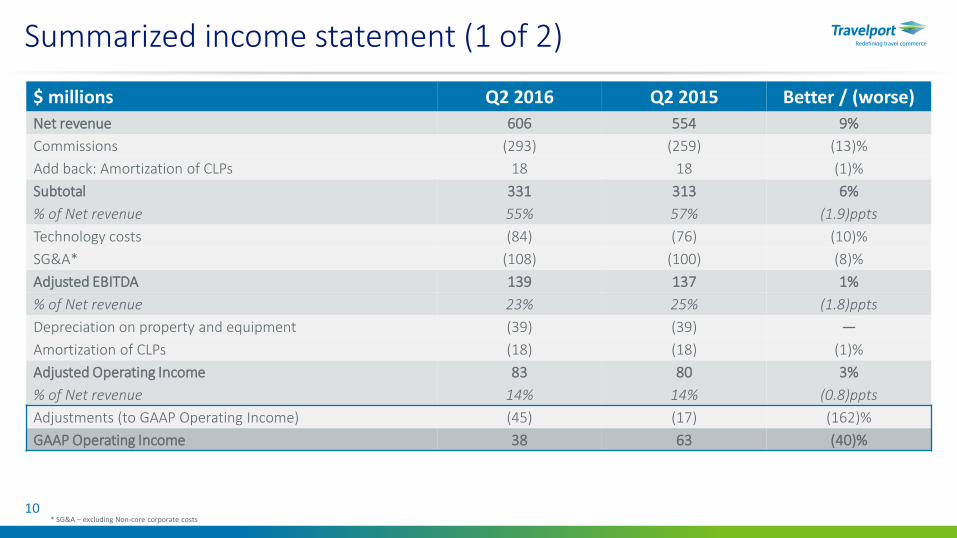
$ millions Q2 2016 Q2 2015 Better / (worse)
Net revenue 606 554 9%
Commissions (293) (259) (13)%
Add back: Amortization of CLPs 18 18 (1)%
Subtotal 331 313 6%
% of Net revenue 55% 57% (1.9)ppts
Technology costs (84) (76) (10)%
SG&A* (108) (100) (8)%
Adjusted EBITDA 139 137 1%
% of Net revenue 23% 25% (1.8)ppts
Depreciation on property and equipment (39) (39) —
Amortization of CLPs (18) (18) (1)%
Adjusted Operating Income 83 80 3%
% of Net revenue 14% 14% (0.8)ppts
Adjustments (to GAAP Operating Income) (45) (17) (162)%
GAAP Operating Income 38 63 (40)%

Summarized income statement (2 of 2)
n/m = percentage calculated not meaningful1 ‘Interest expense, net’ in Q2 2016 excludes a $6m unrealized loss on interest rate derivative contracts, which is included within GAAP Interest expense2 ‘Provision for income taxes’ excludes the Tax impact of adjusted items
11
$ millions Q2 2016 Q2 2015 Better / (worse)
Adjusted Operating Income 83 80 3%
Interest expense, net1 (40) (39) (2)%
Subtotal 43 42 4%
Remaining provision for income taxes2 (9) (6) (44)%
Adjusted Net Income 34 35 (3)%
Amortization of acquired intangible assets (14) (19) 28%
Other adjustments (to GAAP Net Income) (35) — n/m
GAAP Net (Loss) / income (14) 16 (188)%
Adjusted Earnings Per Share – diluted $0.28 $0.29 $(0.01)
GAAP Earnings Per Share – diluted $(0.12) $0.12 $(0.24)
Summary cash flows
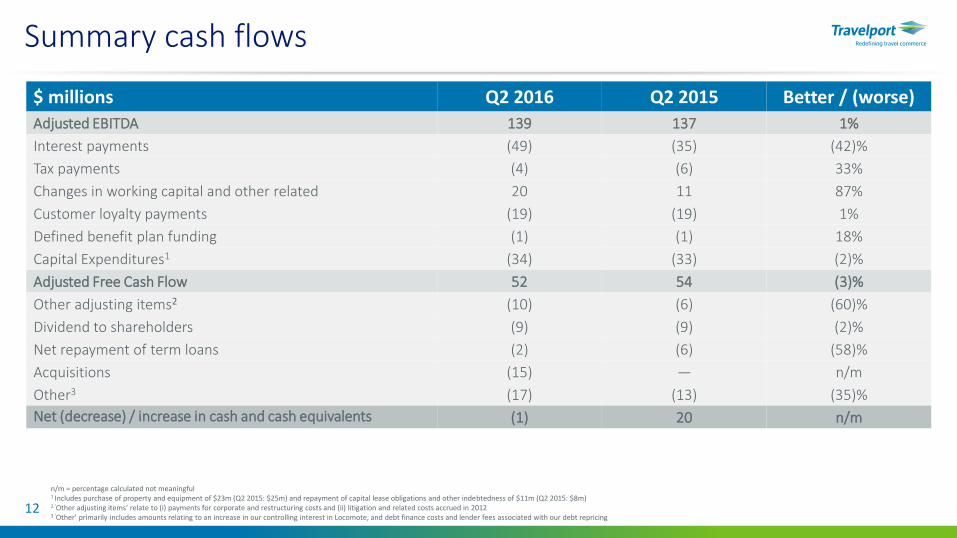
n/m = percentage calculated not meaningful1 Includes purchase of property and equipment of $23m (Q2 2015: $25m) and repayment of capital lease obligations and other indebtedness of $11m (Q2 2015: $8m)2 ‘Other adjusting items’ relate to (i) payments for corporate and restructuring costs and (ii) litigation and related costs accrued in 20123 ‘Other’ primarily includes amounts relating to an increase in our controlling interest in Locomote, and debt finance costs and lender fees associated with our debt repricing
12
$ millions Q2 2016 Q2 2015 Better / (worse)
Adjusted EBITDA 139 137 1%
Interest payments (49) (35) (42)%
Tax payments (4) (6) 33%
Changes in working capital and other related 20 11 87%
Customer loyalty payments (19) (19) 1%
Defined benefit plan funding (1) (1) 18%
Capital Expenditures1 (34) (33) (2)%
Adjusted Free Cash Flow 52 54 (3)%
Other adjusting items2 (10) (6) (60)%
Dividend to shareholders (9) (9) (2)%
Net repayment of term loans (2) (6) (58)%
Acquisitions (15) — n/m
Other3 (17) (13) (35)%
Net (decrease) / increase in cash and cash equivalents (1) 20 n/m

Net Debt and Leverage
13
Net Debt stable at $2.3bn
Targeting leverage ratio of <4.0x by end of 2016
Term loans repriced
75bps reduction of interest rate following successful repricing of term loans in
June 2016
Interest charge reduced
Now paying LIBOR +400bps (with 1% LIBOR
floor) equating to annualized pre-tax saving
of ~$18m
Key terms
No significant maturities until 2021; further
opportunity to re-price/re-finance post
December 2016
$ millions June 30, 2016 March 31, 2016 December 31, 2015Term Loan1 2,292 2,296 2,303
Capital leases and other indebtedness 118 129 134
Cash (127) (128) (155)
Net Debt 2,284 2,297 2,282
LTM Adjusted EBITDA2 554 552 535
Ratio 4.1x 4.2x 4.3x
1 Net of unamortized discount and unamortized debt issuance costs2 Adjusted EBITDA on a last twelve months (LTM) basis

Q2 2016Gordon WilsonPresident and Chief Executive Officer

15
Guidance
* Guidance assumes spot foreign exchange rates as of July 28, 2016** Based on expected FY fully diluted shares outstanding of 125m
The information presented here represent forward-looking statements and reflect our expectations as of August 4, 2016. We assume no obligation to update these statements. Results may be materially different and are affected by many factors detailed inthis presentation and in our Annual Report on Form 10-K for the year ended December 31, 2015, filed with the SEC on February 18, 2016 and our Quarterly Reports on Form 10-Q for the quarter ended March 31, 2016, filed with the SEC on May 5, 2016, andquarter ended June 30, 2016, to be filed on August 4, 2016..
(in $ millions, except per share amounts)RevisedFY 2016
Guidance*
PreviousFY 2016
Guidance
Net revenue 2,350 – 2,400 Unchanged
Adjusted EBITDA 565 – 580 Unchanged
Adjusted Net Income 145 – 155 140 – 150
Adjusted Income per Share – diluted** 1.16 – 1.24 1.12 – 1.20
Adjusted Free Cash Flow 150 – 170 145 – 165

Summary
Repricing lowers interest charge
and improves earnings growth and free cash flow
generation
Commercial momentum continues
with new customer wins and implementations,
product innovations and rapid eNett growth
Strong set of results
Revenue and Adjusted EBITDA both up 9%
before $11m provision in relation to European
travel agency
Net revenue and Adjusted EBITDA
guidance unchanged
with strong commercial pipeline and good
visibility, although we remain mindful of the
challenging economic and travel environment
16

Q2 2016AppendicesFinancial StatisticsOperating StatisticsKey FinancialsDefinitions

Financial statistics
Travel Commerce Platform Revenue by Region ($ thousands) Q2 2016 Q2 2015 Better / (worse) 1H 2016 1H 2015 Better / (worse)
Asia Pacific 130,526 115,397 13% 259,021 233,170 11%
Europe 182,710 149,913 22% 377,557 315,640 20%
Latin America & Canada 28,245 24,299 16% 56,281 48,060 17%
Middle East & Africa 77,346 74,625 4% 150,796 147,948 2%
International 418,827 364,234 15% 843,655 744,818 13%
% of Travel Commerce Platform revenue 73% 70% 3.3ppts 73% 70% 3.2ppts
United States 155,231 158,440 (2)% 309,289 319,497 (3)%
Total Travel Commerce Platform revenue 574,058 522,674 10% 1,152,944 1,064,315 8%
Net Revenue ($ thousands) Q2 2016 Q2 2015 Better / (worse) 1H 2016 1H 2015 Better / (worse)
Air 425,861 400,974 6% 869,745 832,495 4%
Beyond Air 148,197 121,700 22% 283,199 231,820 22%
Travel Commerce Platform 574,058 522,674 10% 1,152,944 1,064,315 8%
Technology Services 31,847 31,528 1% 62,224 62,015 —
Net Revenue 605,905 554,202 9% 1,215,168 1,126,330 8%
Travel Commerce Platform revenue as a % of Net revenue 95% 94% 0.4ppts 95% 94% 0.4ppts
Beyond Air revenue as a % of Travel Commerce Platform revenue 26% 23% 2.6ppts 25% 22% 2.8ppts
% of Air segment revenue from away bookings 66% 65% 1.8ppts 67% 65% 2.2ppts
18
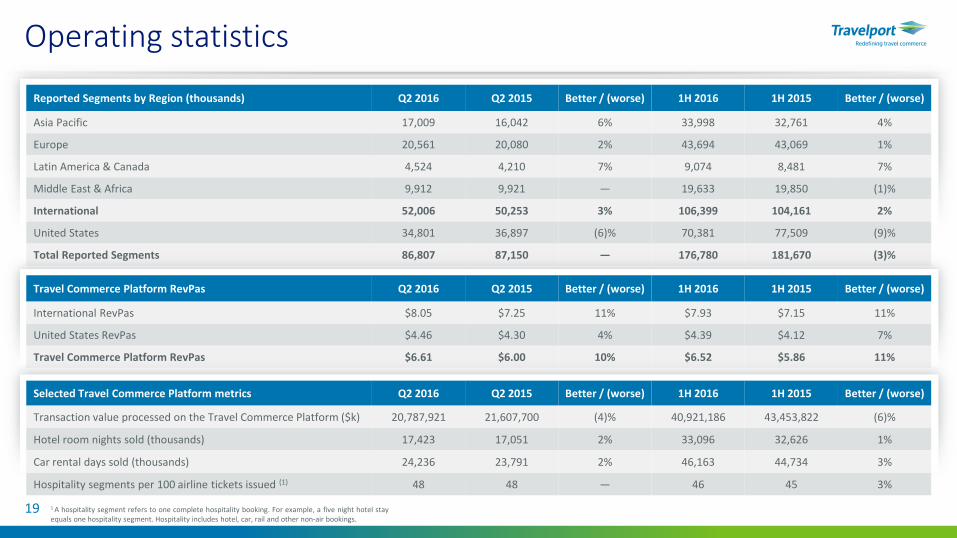
Operating statistics
1 A hospitality segment refers to one complete hospitality booking. For example, a five night hotel stayequals one hospitality segment. Hospitality includes hotel, car, rail and other non-air bookings.
Reported Segments by Region (thousands) Q2 2016 Q2 2015 Better / (worse) 1H 2016 1H 2015 Better / (worse)
Asia Pacific 17,009 16,042 6% 33,998 32,761 4%
Europe 20,561 20,080 2% 43,694 43,069 1%
Latin America & Canada 4,524 4,210 7% 9,074 8,481 7%
Middle East & Africa 9,912 9,921 — 19,633 19,850 (1)%
International 52,006 50,253 3% 106,399 104,161 2%
United States 34,801 36,897 (6)% 70,381 77,509 (9)%
Total Reported Segments 86,807 87,150 — 176,780 181,670 (3)%
Travel Commerce Platform RevPas Q2 2016 Q2 2015 Better / (worse) 1H 2016 1H 2015 Better / (worse)
International RevPas $8.05 $7.25 11% $7.93 $7.15 11%
United States RevPas $4.46 $4.30 4% $4.39 $4.12 7%
Travel Commerce Platform RevPas $6.61 $6.00 10% $6.52 $5.86 11%
Selected Travel Commerce Platform metrics Q2 2016 Q2 2015 Better / (worse) 1H 2016 1H 2015 Better / (worse)
Transaction value processed on the Travel Commerce Platform ($k) 20,787,921 21,607,700 (4)% 40,921,186 43,453,822 (6)%
Hotel room nights sold (thousands) 17,423 17,051 2% 33,096 32,626 1%
Car rental days sold (thousands) 24,236 23,791 2% 46,163 44,734 3%
Hospitality segments per 100 airline tickets issued (1) 48 48 — 46 45 3%
19

$ thousands Q2 2016 Better / (worse) Better / (worse) 1H 2016 Better / (worse) Better / (worse)
Net Revenue 605,905 51,703 9% 1,215,168 88,838 8%
Adjusted EBITDA 139,013 2,027 1% 293,153 18,709 7%
Depreciation on property and equipment (38,530) 175 — (79,632) 1,478 2%
Amortization of customer loyalty payments (17,687) 251 1% (34,261) 2,006 6%
Adjusted Operating Income 82,796 2,453 3% 179,260 22,193 14%
Interest expense, net1 (39,707) (956) 2% (78,146) (6) —
Remaining provision for income taxes (8,802) (2,697) (44)% (15,872) (2,009) (14)%
Adjusted Net Income 34,287 (1,200) (3)% 85,242 20,178 31%
Amortization of acquired intangible assets (13,716) 5,426 28% (24,855) 12,910 34%
Non-core corporate costs2 (36,726) (38,671) 10% (58,639) (36,232) (162)%
Tax impact of adjustments 4,397 6,084 n/m 3,675 5,362 n/m
Share of losses in equity method investments — 194 n/m — 175 n/m
Gain on sale of share of Orbitz Worldwide — — — — (6,271) n/m
Loss on early extinguishment of debt (2,671) (2,671) n/m (2,671) (2,671) n/m
Net (Loss) / Income (14,429) (30,838) (188)% 2,752 (6,549) (70)%
Summarized income statement
n/m = percentage calculated not meaningful1 ‘Interest expense, net’ excludes unrealized losses on interest rate derivative contracts, which is included within Non-core corporate costs2 ‘Non-core corporate costs’ include Equity-based compensation and related taxes, Corporate and restructuring costs, and Other–non cash (which consists of unrealized gains and losses on foreign currency derivative contracts, impairment of PP&E,unrealized losses on interest rate derivative contracts, and other gains)
20
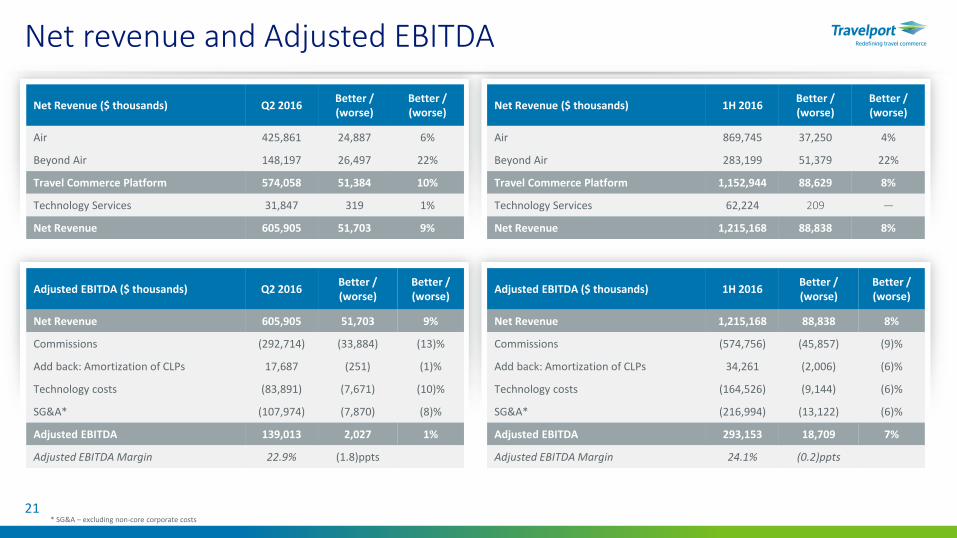
Net revenue and Adjusted EBITDA
Net Revenue ($ thousands) Q2 2016Better / (worse)
Better / (worse)
Air 425,861 24,887 6%
Beyond Air 148,197 26,497 22%
Travel Commerce Platform 574,058 51,384 10%
Technology Services 31,847 319 1%
Net Revenue 605,905 51,703 9%
Adjusted EBITDA ($ thousands) Q2 2016Better / (worse)
Better / (worse)
Net Revenue 605,905 51,703 9%
Commissions (292,714) (33,884) (13)%
Add back: Amortization of CLPs 17,687 (251) (1)%
Technology costs (83,891) (7,671) (10)%
SG&A* (107,974) (7,870) (8)%
Adjusted EBITDA 139,013 2,027 1%
Adjusted EBITDA Margin 22.9% (1.8)ppts
Net Revenue ($ thousands) 1H 2016Better / (worse)
Better / (worse)
Air 869,745 37,250 4%
Beyond Air 283,199 51,379 22%
Travel Commerce Platform 1,152,944 88,629 8%
Technology Services 62,224 209 —
Net Revenue 1,215,168 88,838 8%
Adjusted EBITDA ($ thousands) 1H 2016Better / (worse)
Better / (worse)
Net Revenue 1,215,168 88,838 8%
Commissions (574,756) (45,857) (9)%
Add back: Amortization of CLPs 34,261 (2,006) (6)%
Technology costs (164,526) (9,144) (6)%
SG&A* (216,994) (13,122) (6)%
Adjusted EBITDA 293,153 18,709 7%
Adjusted EBITDA Margin 24.1% (0.2)ppts
21* SG&A – excluding non-core corporate costs

Income per share
Income per share ($) Q2 2016 Q2 2015 1H 2016 1H 2015
(Loss) / income per share – Diluted (0.12) 0.12 0.01 0.06
Adjusted Income per Share – Diluted 0.28 0.29 0.69 0.53
Weighted average shares (millions) Q2 2016 Q2 2015 1H 2016 1H 2015
Weighted average common shares outstanding – Basic 123.8 122.3 123.8 121.8
Weighted average common shares outstanding – Diluted 124.0 122.7 123.9 122.7
22
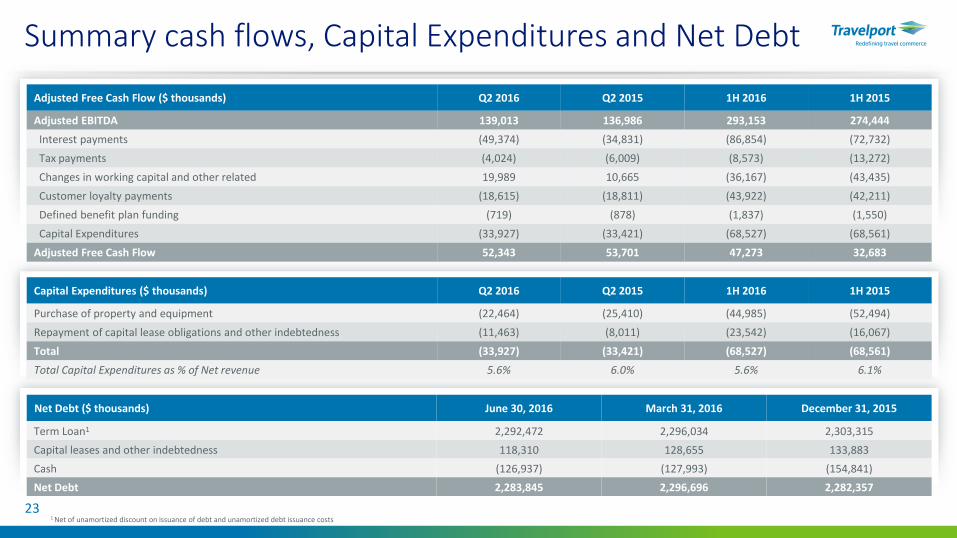
Summary cash flows, Capital Expenditures and Net Debt
Adjusted Free Cash Flow ($ thousands) Q2 2016 Q2 2015 1H 2016 1H 2015
Adjusted EBITDA 139,013 136,986 293,153 274,444
Interest payments (49,374) (34,831) (86,854) (72,732)
Tax payments (4,024) (6,009) (8,573) (13,272)
Changes in working capital and other related 19,989 10,665 (36,167) (43,435)
Customer loyalty payments (18,615) (18,811) (43,922) (42,211)
Defined benefit plan funding (719) (878) (1,837) (1,550)
Capital Expenditures (33,927) (33,421) (68,527) (68,561)
Adjusted Free Cash Flow 52,343 53,701 47,273 32,683
Capital Expenditures ($ thousands) Q2 2016 Q2 2015 1H 2016 1H 2015
Purchase of property and equipment (22,464) (25,410) (44,985) (52,494)
Repayment of capital lease obligations and other indebtedness (11,463) (8,011) (23,542) (16,067)
Total (33,927) (33,421) (68,527) (68,561)
Total Capital Expenditures as % of Net revenue 5.6% 6.0% 5.6% 6.1%
Net Debt ($ thousands) June 30, 2016 March 31, 2016 December 31, 2015
Term Loan1 2,292,472 2,296,034 2,303,315
Capital leases and other indebtedness 118,310 128,655 133,883
Cash (126,937) (127,993) (154,841)
Net Debt 2,283,845 2,296,696 2,282,357
1 Net of unamortized discount on issuance of debt and unamortized debt issuance costs23
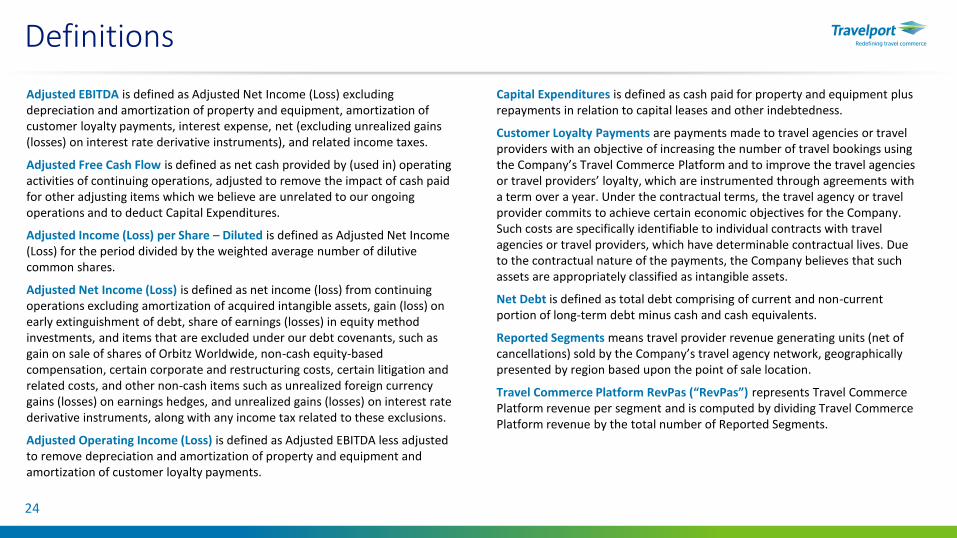
Adjusted EBITDA is defined as Adjusted Net Income (Loss) excluding depreciation and amortization of property and equipment, amortization of customer loyalty payments, interest expense, net (excluding unrealized gains (losses) on interest rate derivative instruments), and related income taxes.
Adjusted Free Cash Flow is defined as net cash provided by (used in) operating activities of continuing operations, adjusted to remove the impact of cash paid for other adjusting items which we believe are unrelated to our ongoing operations and to deduct Capital Expenditures.
Adjusted Income (Loss) per Share – Diluted is defined as Adjusted Net Income (Loss) for the period divided by the weighted average number of dilutive common shares.
Adjusted Net Income (Loss) is defined as net income (loss) from continuing operations excluding amortization of acquired intangible assets, gain (loss) on early extinguishment of debt, share of earnings (losses) in equity method investments, and items that are excluded under our debt covenants, such as gain on sale of shares of Orbitz Worldwide, non-cash equity-based compensation, certain corporate and restructuring costs, certain litigation and related costs, and other non-cash items such as unrealized foreign currency gains (losses) on earnings hedges, and unrealized gains (losses) on interest rate derivative instruments, along with any income tax related to these exclusions.
Adjusted Operating Income (Loss) is defined as Adjusted EBITDA less adjusted to remove depreciation and amortization of property and equipment and amortization of customer loyalty payments.
Capital Expenditures is defined as cash paid for property and equipment plus repayments in relation to capital leases and other indebtedness.
Customer Loyalty Payments are payments made to travel agencies or travel providers with an objective of increasing the number of travel bookings using the Company’s Travel Commerce Platform and to improve the travel agencies or travel providers’ loyalty, which are instrumented through agreements with a term over a year. Under the contractual terms, the travel agency or travel provider commits to achieve certain economic objectives for the Company. Such costs are specifically identifiable to individual contracts with travel agencies or travel providers, which have determinable contractual lives. Due to the contractual nature of the payments, the Company believes that such assets are appropriately classified as intangible assets.
Net Debt is defined as total debt comprising of current and non-current portion of long-term debt minus cash and cash equivalents.
Reported Segments means travel provider revenue generating units (net of cancellations) sold by the Company’s travel agency network, geographically presented by region based upon the point of sale location.
Travel Commerce Platform RevPas (“RevPas”) represents Travel Commerce Platform revenue per segment and is computed by dividing Travel Commerce Platform revenue by the total number of Reported Segments.
Definitions
24

Q2 2016 Earnings


