Q2 2015 presentation - Scandi...
19
0 Q2 2015 presentation Scandinavian market leader in chicken products 28 August 2015
-
Upload
truonghanh -
Category
Documents
-
view
216 -
download
2
Transcript of Q2 2015 presentation - Scandi...
0
Q2 2015 presentation
Scandinavian market leader in chicken products
28 August 2015
1
Summary, Q2 2015
1
• Sales in Sweden and Denmark grew well and margins improved
• Continued weak market and results in Norway
• New supply agreement signed with Coop Norway, deliveries started as of August
• Acquisition of Huttulan Kukku in Finland finalised on 25 May
• Agreement to acquire Lagerbergs in Sweden signed on 15 June, pending approval of Competition Authority
2
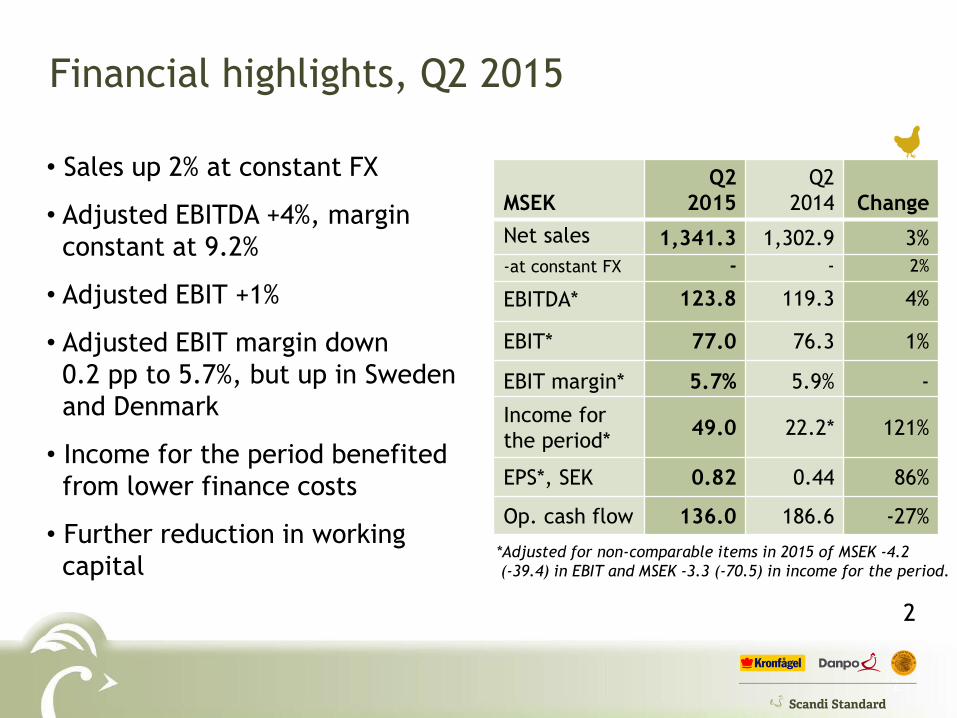
• Sales up 2% at constant FX
• Adjusted EBITDA +4%, margin
constant at 9.2%
• Adjusted EBIT +1%
• Adjusted EBIT margin down
0.2 pp to 5.7%, but up in Sweden
and Denmark
• Income for the period benefited
from lower finance costs
• Further reduction in working
capital
Financial highlights, Q2 2015
MSEK
Q2
2015
Q2
2014 Change
Net sales 1,341.3 1,302.9 3%
-at constant FX - - 2%
EBITDA* 123.8 119.3 4%
EBIT* 77.0 76.3 1%
EBIT margin* 5.7% 5.9% -
Income for
the period* 49.0 22.2* 121%
EPS*, SEK 0.82 0.44 86%
Op. cash flow 136.0 186.6 -27%
*Adjusted for non-comparable items in 2015 of MSEK -4.2
(-39.4) in EBIT and MSEK -3.3 (-70.5) in income for the period.
2

3
• Net sales up 8% • Continued good market growth
• Successful product innovations
• Good barbecue season despite bad weather
• Strong category management
• Strong improvement in EBIT and margin• Last year impacted by inventory reductions
• Improved mix
• Continued improvements in operational efficiency
Sweden – strong growth in sales and income
3
MSEK Q2 2015 Q2 2014 Change H1 2015 H1 2014 Change
Net sales 564.4 524.9 8% 1,095.3 1,023.4 7%
EBIT 43.3* 30.6* 42% 76.4* 50.1* 52%
EBIT margin 7.7%* 5.8%* - 7.0%* 4.9%* -*)Adjusted for non-comparable items of MSEK -4.2 (0.2) in Q2 2015 and MSEK -4.2 (-5.5) in H1 2015.
4
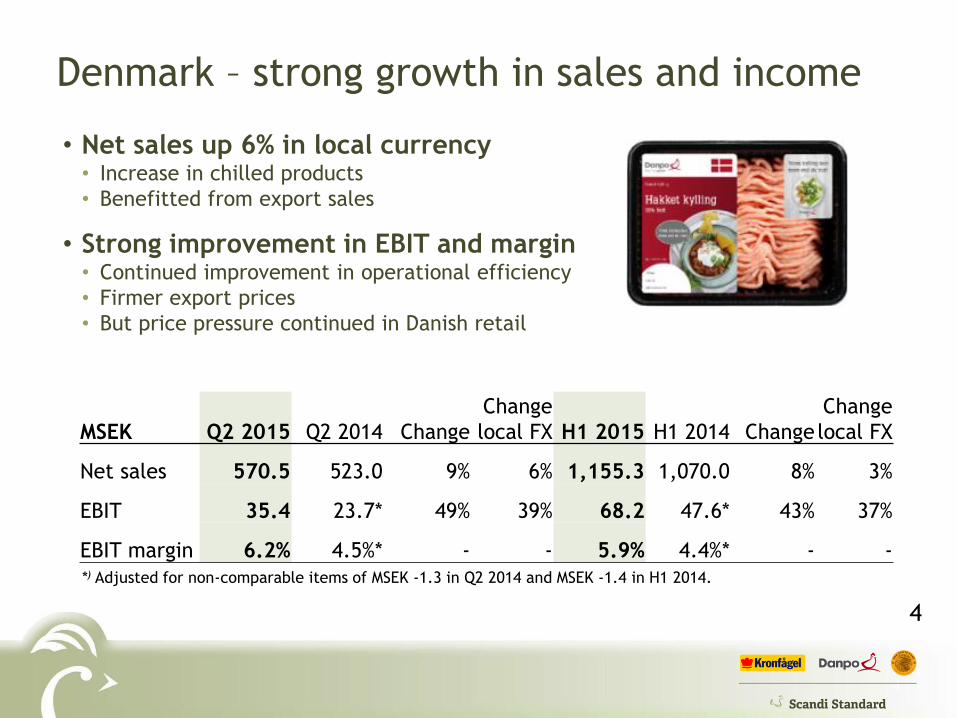
Denmark – strong growth in sales and income
4
• Net sales up 6% in local currency• Increase in chilled products
• Benefitted from export sales
• Strong improvement in EBIT and margin• Continued improvement in operational efficiency
• Firmer export prices
• But price pressure continued in Danish retail
MSEK Q2 2015 Q2 2014 Change
Change
local FX H1 2015 H1 2014 Change
Change
local FX
Net sales 570.5 523.0 9% 6% 1,155.3 1,070.0 8% 3%
EBIT 35.4 23.7* 49% 39% 68.2 47.6* 43% 37%
EBIT margin 6.2% 4.5%* - - 5.9% 4.4%* - -
*) Adjusted for non-comparable items of MSEK -1.3 in Q2 2014 and MSEK -1.4 in H1 2014.

5
Norway – lower sales and margin
5
• Net sales down 7% in local currency• Retail market down 4%
• EBIT and margin substantially down• Lower volumes
• Poorer mix
• Sales of excess inventory at discounted prices
MSEK Q2 2015 Q2 2014 Change
Change
local FX H1 2015 H1 2014 Change
Change
local FX
Net sales 280.4 307.0 -9% -7% 556.1 681.9 -18% -18%
EBIT 9.6 28.1* -66% -65% 22.8 70.5* -68% -68%
EBIT margin 3.4% 9.2%* - - 4.1% 10.3%* - -*) Adjusted for non-comparable items of MSEK -0.7 in Q2 and H1 2014.
6
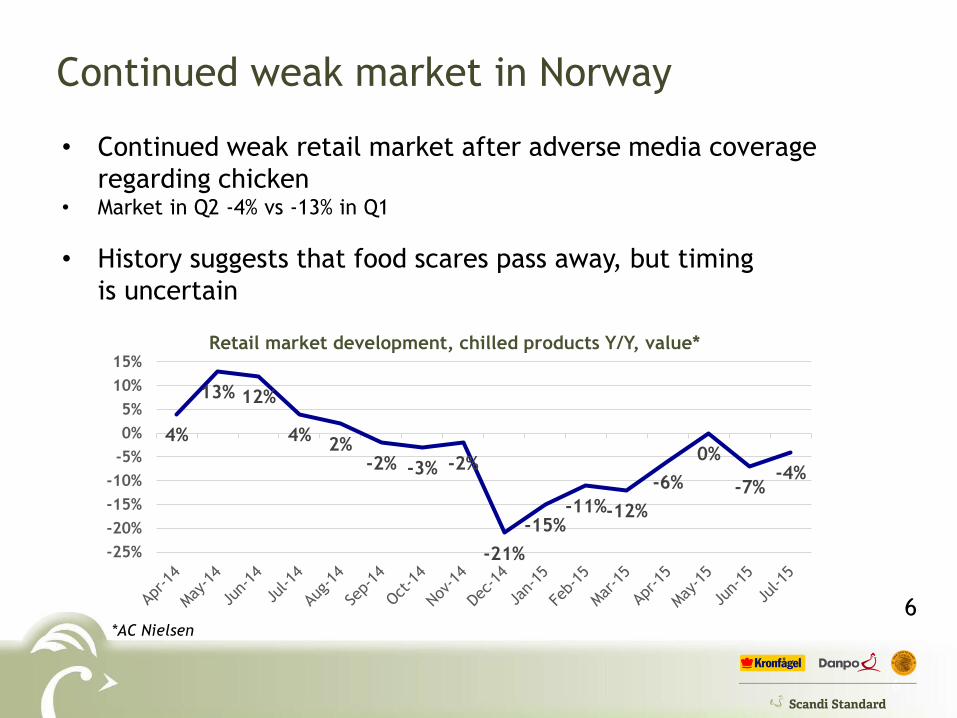
Continued weak market in Norway
• Continued weak retail market after adverse media coverage
regarding chicken• Market in Q2 -4% vs -13% in Q1
• History suggests that food scares pass away, but timing
is uncertain
*AC Nielsen
6
4%
13% 12%
4%2%
-2% -3% -2%
-21%
-15%-11%-12%
-6%
0%
-7%-4%
-25%
-20%
-15%
-10%
-5%
0%
5%
10%
15%Retail market development, chilled products Y/Y, value*

7
• Deliveries to the new stores at Coop started in August and will
be phased in gradually
• Continued operational cost-savings in production
• Product development, innovation and new listings
• Launch of pre-cooked products to improve convenience and
mitigate concerns over handling raw chicken
Initiatives in Norway
7
• 370 new stores compared to 550 ICA stores supplied previously
8
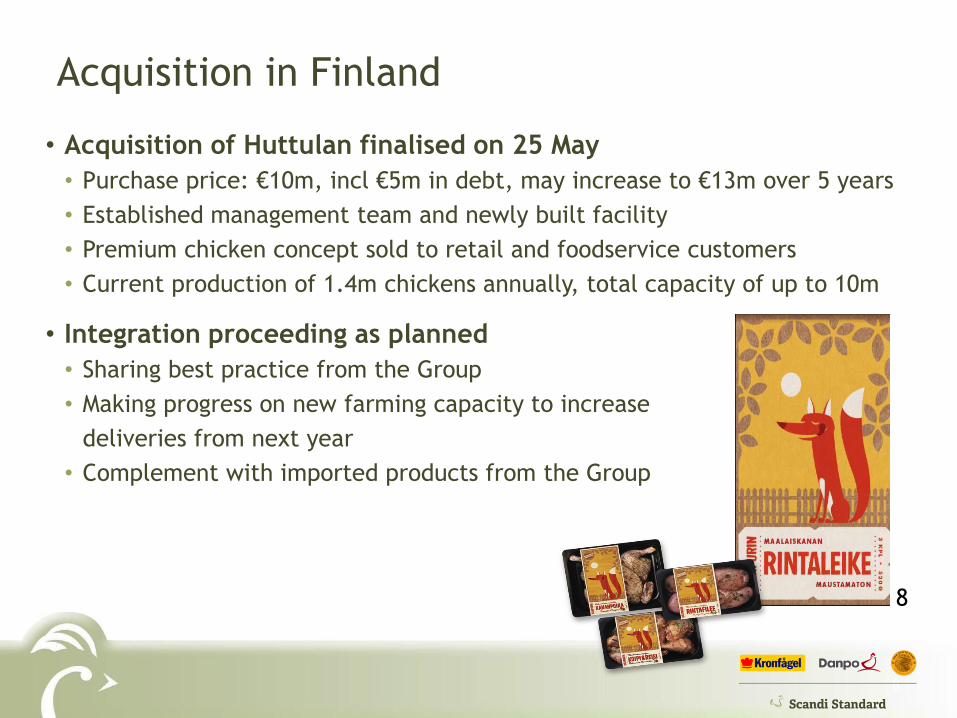
• Acquisition of Huttulan finalised on 25 May
• Purchase price: €10m, incl €5m in debt, may increase to €13m over 5 years
• Established management team and newly built facility
• Premium chicken concept sold to retail and foodservice customers
• Current production of 1.4m chickens annually, total capacity of up to 10m
• Integration proceeding as planned
• Sharing best practice from the Group
• Making progress on new farming capacity to increase
deliveries from next year
• Complement with imported products from the Group
Acquisition in Finland
8
9
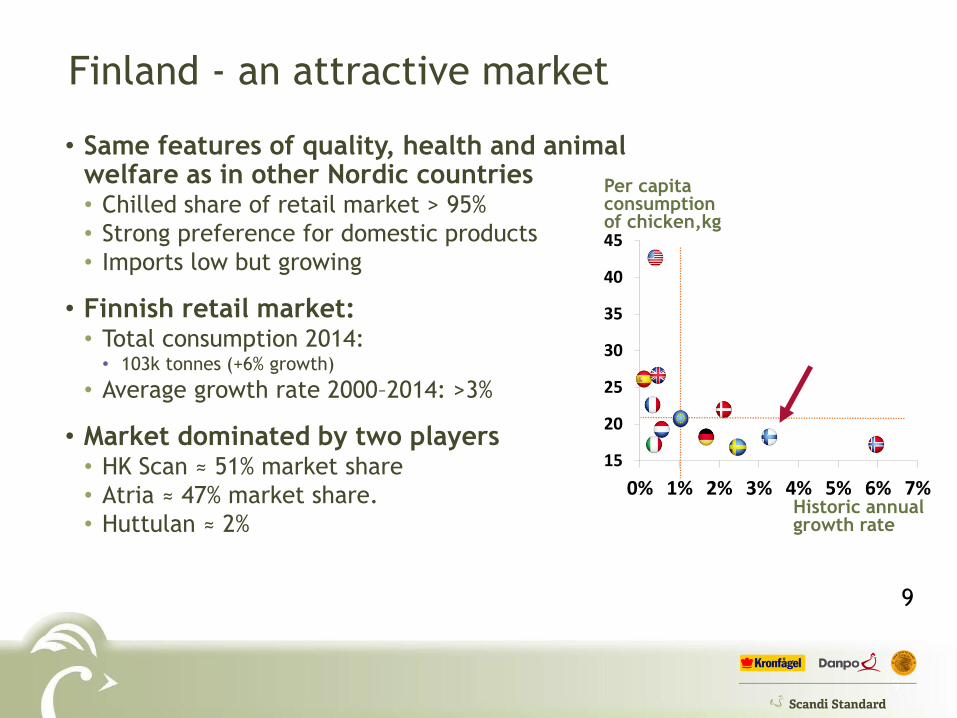
• Same features of quality, health and animal welfare as in other Nordic countries• Chilled share of retail market > 95%
• Strong preference for domestic products
• Imports low but growing
• Finnish retail market:• Total consumption 2014: • 103k tonnes (+6% growth)
• Average growth rate 2000–2014: >3%
• Market dominated by two players• HK Scan ≈ 51% market share
• Atria ≈ 47% market share.
• Huttulan ≈ 2%
Finland - an attractive market
9
15
20
25
30
35
40
45
0% 1% 2% 3% 4% 5% 6% 7%Historic annual growth rate
Per capita consumptionof chicken,kg
10
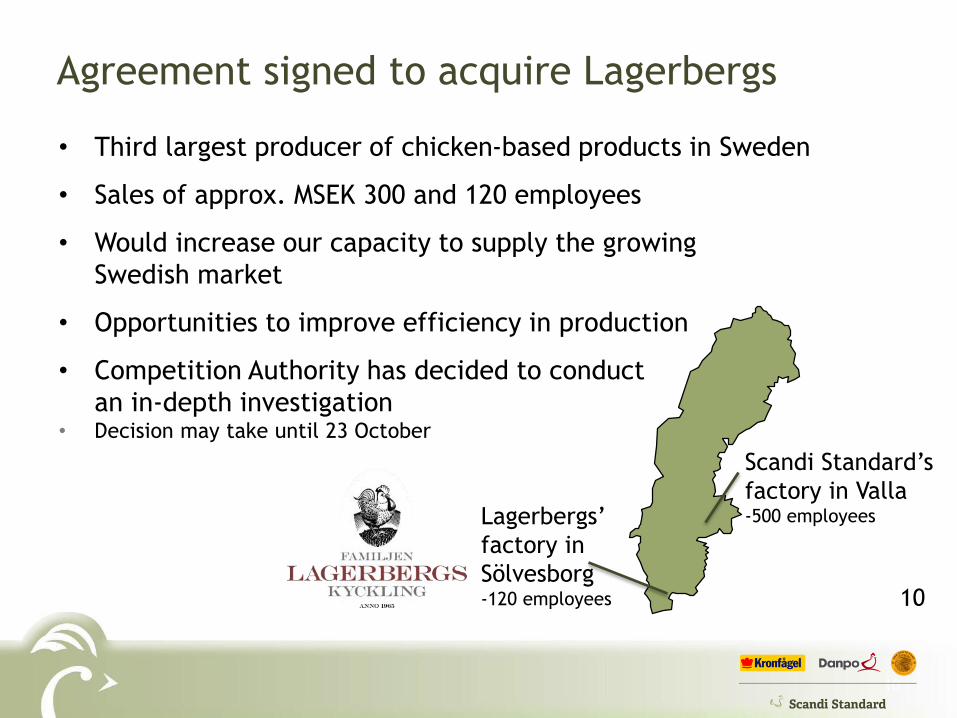
Agreement signed to acquire Lagerbergs
• Third largest producer of chicken-based products in Sweden
• Sales of approx. MSEK 300 and 120 employees
• Would increase our capacity to supply the growing
Swedish market
• Opportunities to improve efficiency in production
• Competition Authority has decided to conduct
an in-depth investigation• Decision may take until 23 October
10
Lagerbergs’
factory in
Sölvesborg-120 employees
Scandi Standard’s
factory in Valla-500 employees
11
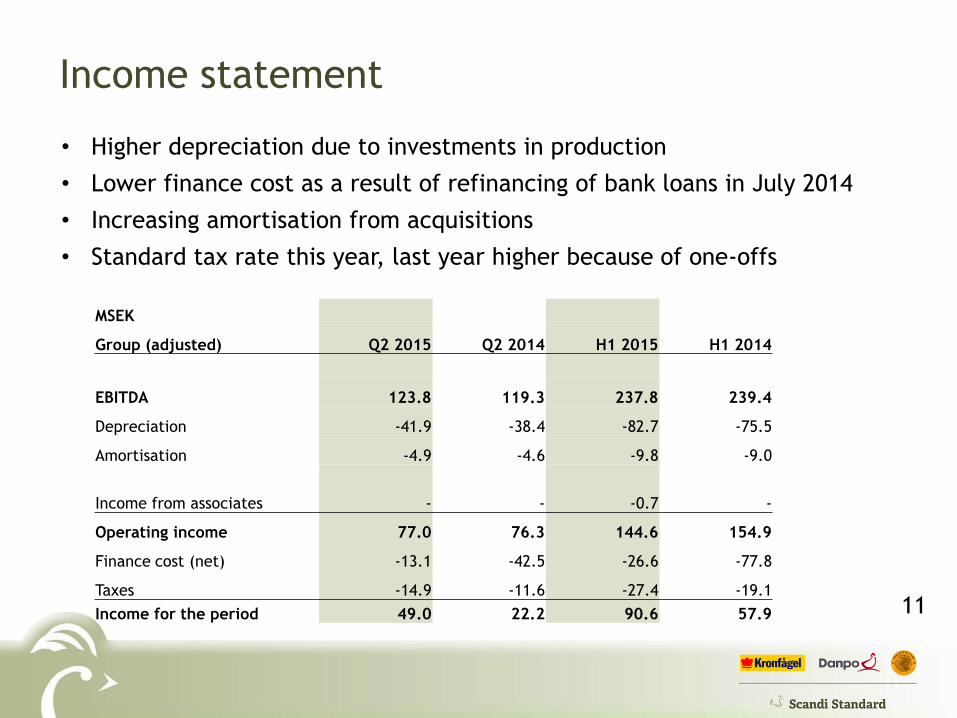
Income statement
• Higher depreciation due to investments in production
• Lower finance cost as a result of refinancing of bank loans in July 2014
• Increasing amortisation from acquisitions
• Standard tax rate this year, last year higher because of one-offs
MSEK
Group (adjusted) Q2 2015 Q2 2014 H1 2015 H1 2014
EBITDA 123.8 119.3 237.8 239.4
Depreciation -41.9 -38.4 -82.7 -75.5
Amortisation -4.9 -4.6 -9.8 -9.0
Income from associates - - -0.7 -
Operating income 77.0 76.3 144.6 154.9
Finance cost (net) -13.1 -42.5 -26.6 -77.8
Taxes -14.9 -11.6 -27.4 -19.1
Income for the period 49.0 22.2 90.6 57.9 11
12
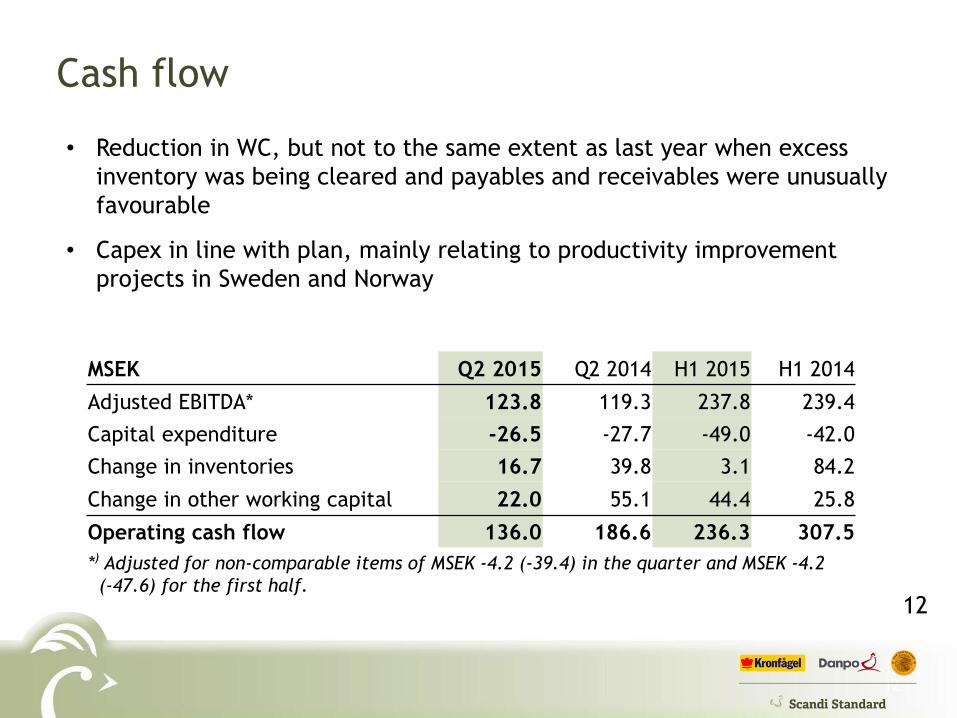
Cash flow
• Reduction in WC, but not to the same extent as last year when excess
inventory was being cleared and payables and receivables were unusually
favourable
• Capex in line with plan, mainly relating to productivity improvement
projects in Sweden and Norway
MSEK Q2 2015 Q2 2014 H1 2015 H1 2014
Adjusted EBITDA* 123.8 119.3 237.8 239.4
Capital expenditure -26.5 -27.7 -49.0 -42.0
Change in inventories 16.7 39.8 3.1 84.2
Change in other working capital 22.0 55.1 44.4 25.8
Operating cash flow 136.0 186.6 236.3 307.5
*) Adjusted for non-comparable items of MSEK -4.2 (-39.4) in the quarter and MSEK -4.2
(-47.6) for the first half. 12
13
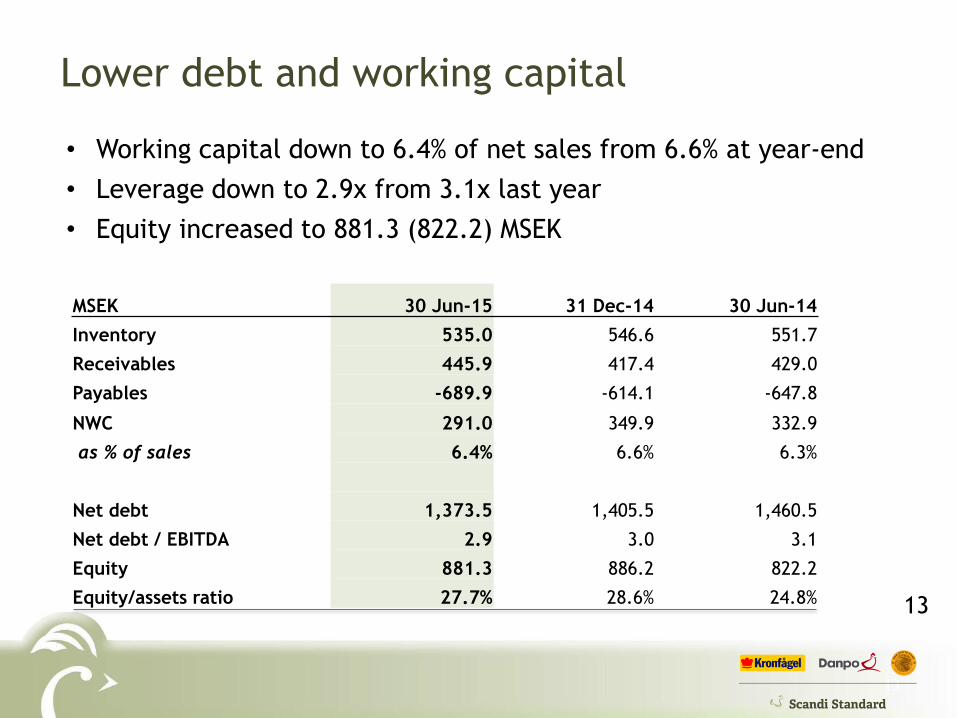
Lower debt and working capital
• Working capital down to 6.4% of net sales from 6.6% at year-end
• Leverage down to 2.9x from 3.1x last year
• Equity increased to 881.3 (822.2) MSEK
13
MSEK 30 Jun-15 31 Dec-14 30 Jun-14
Inventory 535.0 546.6 551.7
Receivables 445.9 417.4 429.0
Payables -689.9 -614.1 -647.8
NWC 291.0 349.9 332.9
as % of sales 6.4% 6.6% 6.3%
Net debt 1,373.5 1,405.5 1,460.5
Net debt / EBITDA 2.9 3.0 3.1
Equity 881.3 886.2 822.2
Equity/assets ratio 27.7% 28.6% 24.8%

14
Summary
14
• Strong performance in Sweden and Denmark
• Continued weak market in Norway; decline in sales and margin
• Group results overall showed some progress from last year• Stable operating margin• Good cash flow• Reduced leverage
• Continued improvements in operational efficiency
• Acquisitions to develop the business in line with our strategy

1515
Q & A

16
Segment information by quarter
16
Segment information by quarter
Group (MSEK) Q1 2014 Q2 2014 Q3 2014 Q4 2014 Q1 2015 Q2 2015
Sales 1 353,4 1 302,9 1 358,9 1 252,0 1 309,6 1 341,3
Sales growth 6% 1% 3% -4% -3% 3%
EBIT 78,6 76,3 66,5 79,6 67,6 77,0
EBIT margin 5.8% 5.9% 4.9% 6.4% 5.2% 5.7%
Sweden (MSEK)
Sales 498,5 524,9 543,8 488,0 530,9 564,4
Sales growth 2% 17% 15% 3% 6% 8%
EBIT 19,5 30,6 29,8 33,9 33,0 43,3
EBIT margin 3.9% 5.8% 5.5% 6.9% 6.2% 7.7%
Denmark (MDKK)
Sales 460,8 431,3 473,1 445,2 464,4 570,5
Sales growth 5% -4% 3% 3% 1% 6%
EBIT 20,1 19,8 20,1 25,9 26,9 35,4
EBIT margin 4.4% 4.5% 4.2% 5.8% 5.8% 6.2%
Norway (MNOK)
Sales 353,5 277,3 277,0 257,9 256,7 280,4
Sales growth 6% -20% -20% -29% -27% -7%
EBIT 40,0 26,0 22,3 22,9 12,1 9,6
EBIT margin 11.3% 9.2% 7.9% 9.0% 4.8% 3.4%
17
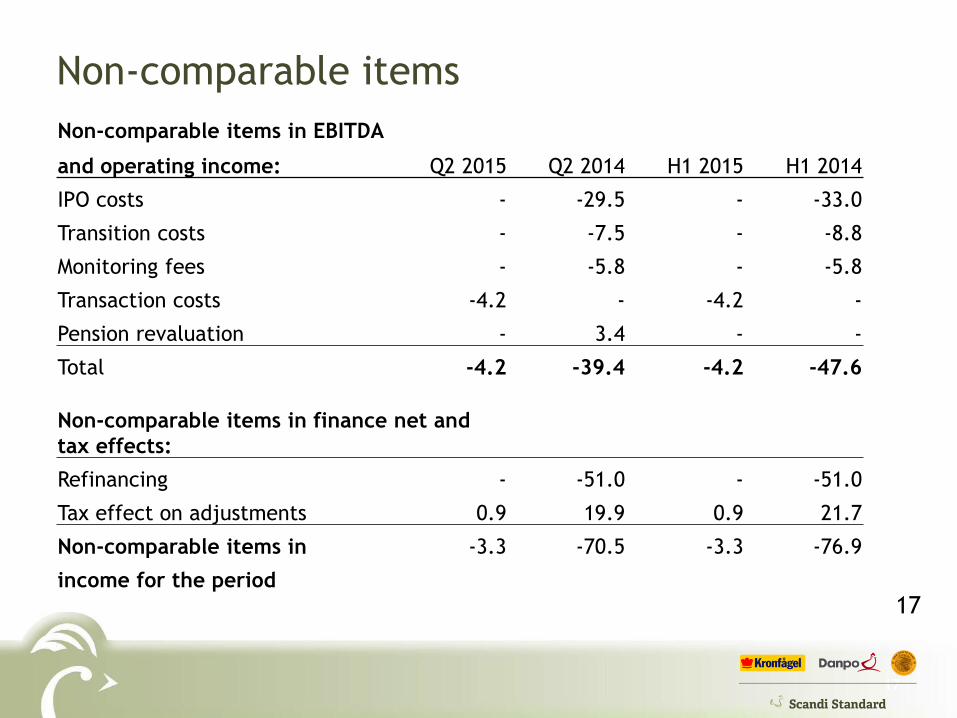
Non-comparable items
17
Non-comparable items in EBITDA
and operating income: Q2 2015 Q2 2014 H1 2015 H1 2014
IPO costs - -29.5 - -33.0
Transition costs - -7.5 - -8.8
Monitoring fees - -5.8 - -5.8
Transaction costs -4.2 - -4.2 -
Pension revaluation - 3.4 - -
Total -4.2 -39.4 -4.2 -47.6
Non-comparable items in finance net and
tax effects:
Refinancing - -51.0 - -51.0
Tax effect on adjustments 0.9 19.9 0.9 21.7
Non-comparable items in -3.3 -70.5 -3.3 -76.9
income for the period

18
Disclaimer
This presentation contains various forward-looking statements that reflect management’s current
views with respect to future events and financial and operational performance. The words
“believe,” “expect,” “anticipate,” “intend,” “may,” “plan,” “estimate,” “should,” “could,”
“aim,” “target,” “might,” or, in each case, their negative, or similar expressions identify certain
of these forward-looking statements. Others can be identified from the context in which the
statements are made. These forward-looking statements involve known and unknown risks,
uncertainties and other factors, which are in some cases beyond the Company’s control and may
cause actual results or performance to differ materially from those expressed or implied from such
forward-looking statements. These risks include but are not limited to the Company’s ability to
operate profitably, maintain its competitive position, to promote and improve its reputation and
the awareness of the brands in its portfolio, to successfully operate its growth strategy and the
impact of changes in pricing policies, political and regulatory developments in the markets in
which the Company operates, and other risks.
The information and opinions contained in this document are provided as at the date of this
presentation and are subject to change without notice.
No representation or warranty (expressed or implied) is made as to, and no reliance should be
placed on, the fairness, accuracy or completeness of the information contained herein.
Accordingly, none of the Company, or any of its principal shareholders or subsidiary undertakings or
any of such person’s officers or employees accepts any liability whatsoever arising directly or
indirectly from the use of this document. 18