Q2 2015 INDONESIA MOBILE DATA - Amazon S32015... · MoboMarket is an Android app store developed by...
32
Q2 2015 INDONESIA MOBILE DATA REPORT Based on MoboMarket user data research
Transcript of Q2 2015 INDONESIA MOBILE DATA - Amazon S32015... · MoboMarket is an Android app store developed by...
Q2 2015
INDONESIA MOBILE DATAREPORTBased on MoboMarket user data research
Research background and data sampling Main conclusions
Mobile phone screen resolution Mobile users network breakdown Android version distribution
Search and downloads continuously growing App seekers tend to do a precise search for what they want Top 20 popular search terms
Popular download days Download quantity Infographic of mobile Internet users interests/habits Game types downloaded Top 200 most downloaded new apps Top 200 most downloaded new games
Top 500 app types distribution Top 500 game types distribution App browsing conversion charts Top 10 installed social apps Top 10 installed photography apps Top 10 installed tool apps Top 10 installed games Top 10 installation package sizes
How many apps do users update?
What type of apps do users update?
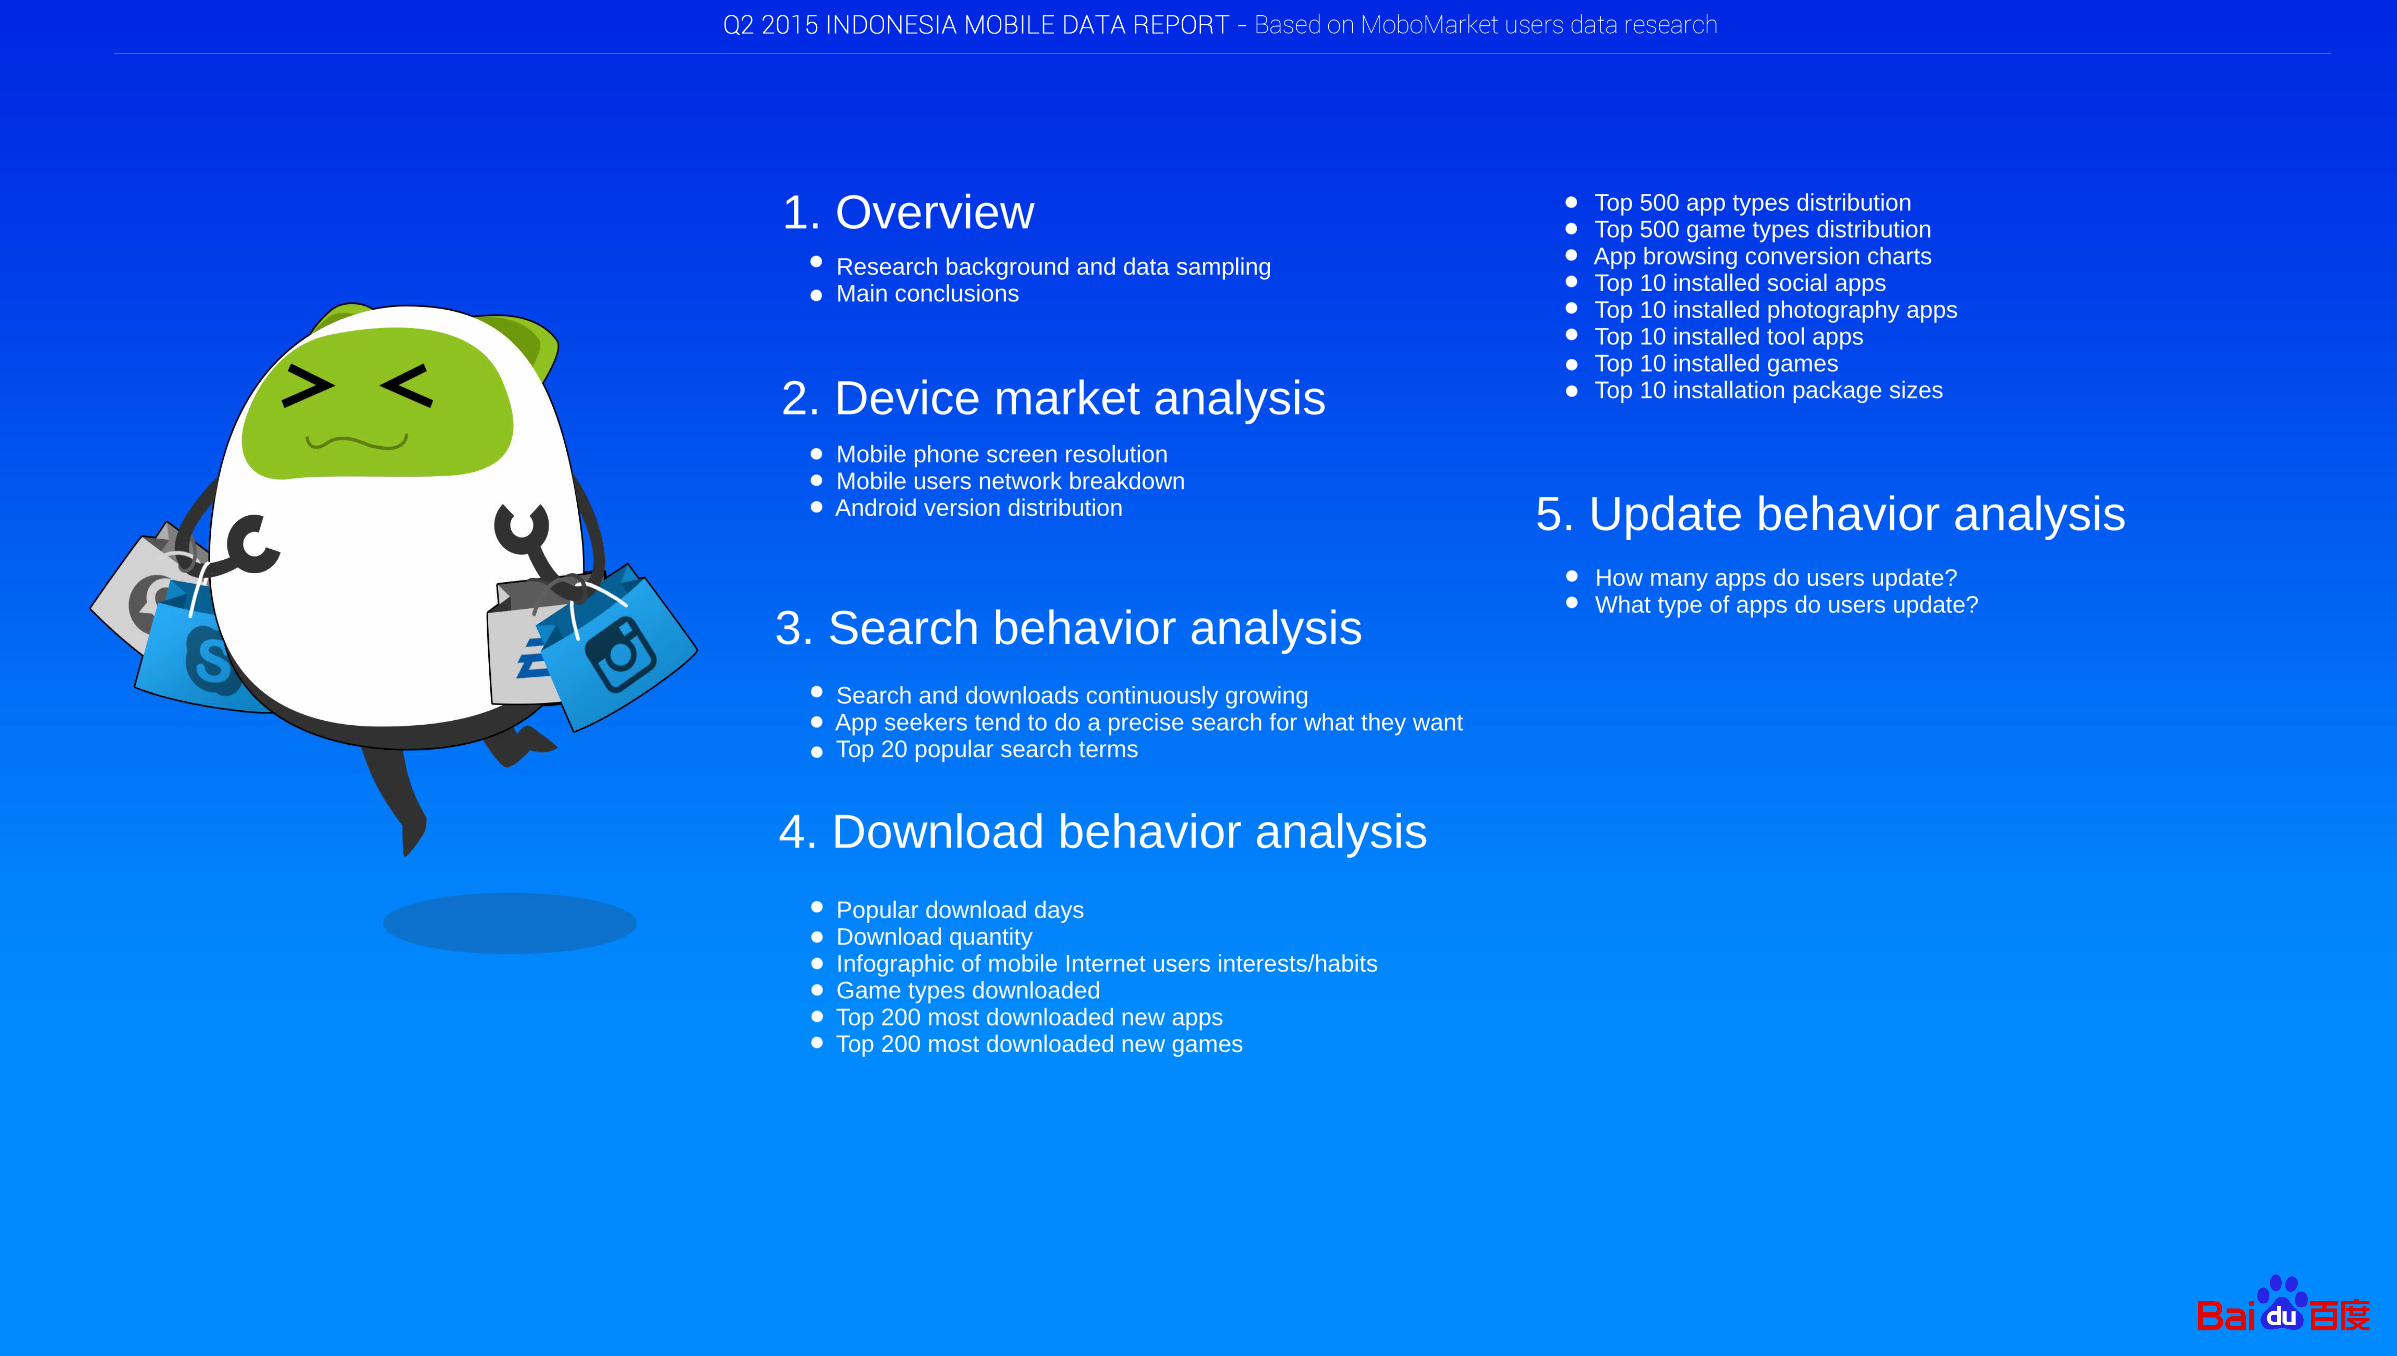
1. Overview
2. Device market analysis
3. Search behavior analysis
4. Download behavior analysis
5. Update behavior analysis
1 Research background and data sampling
Main conclusions
Overview
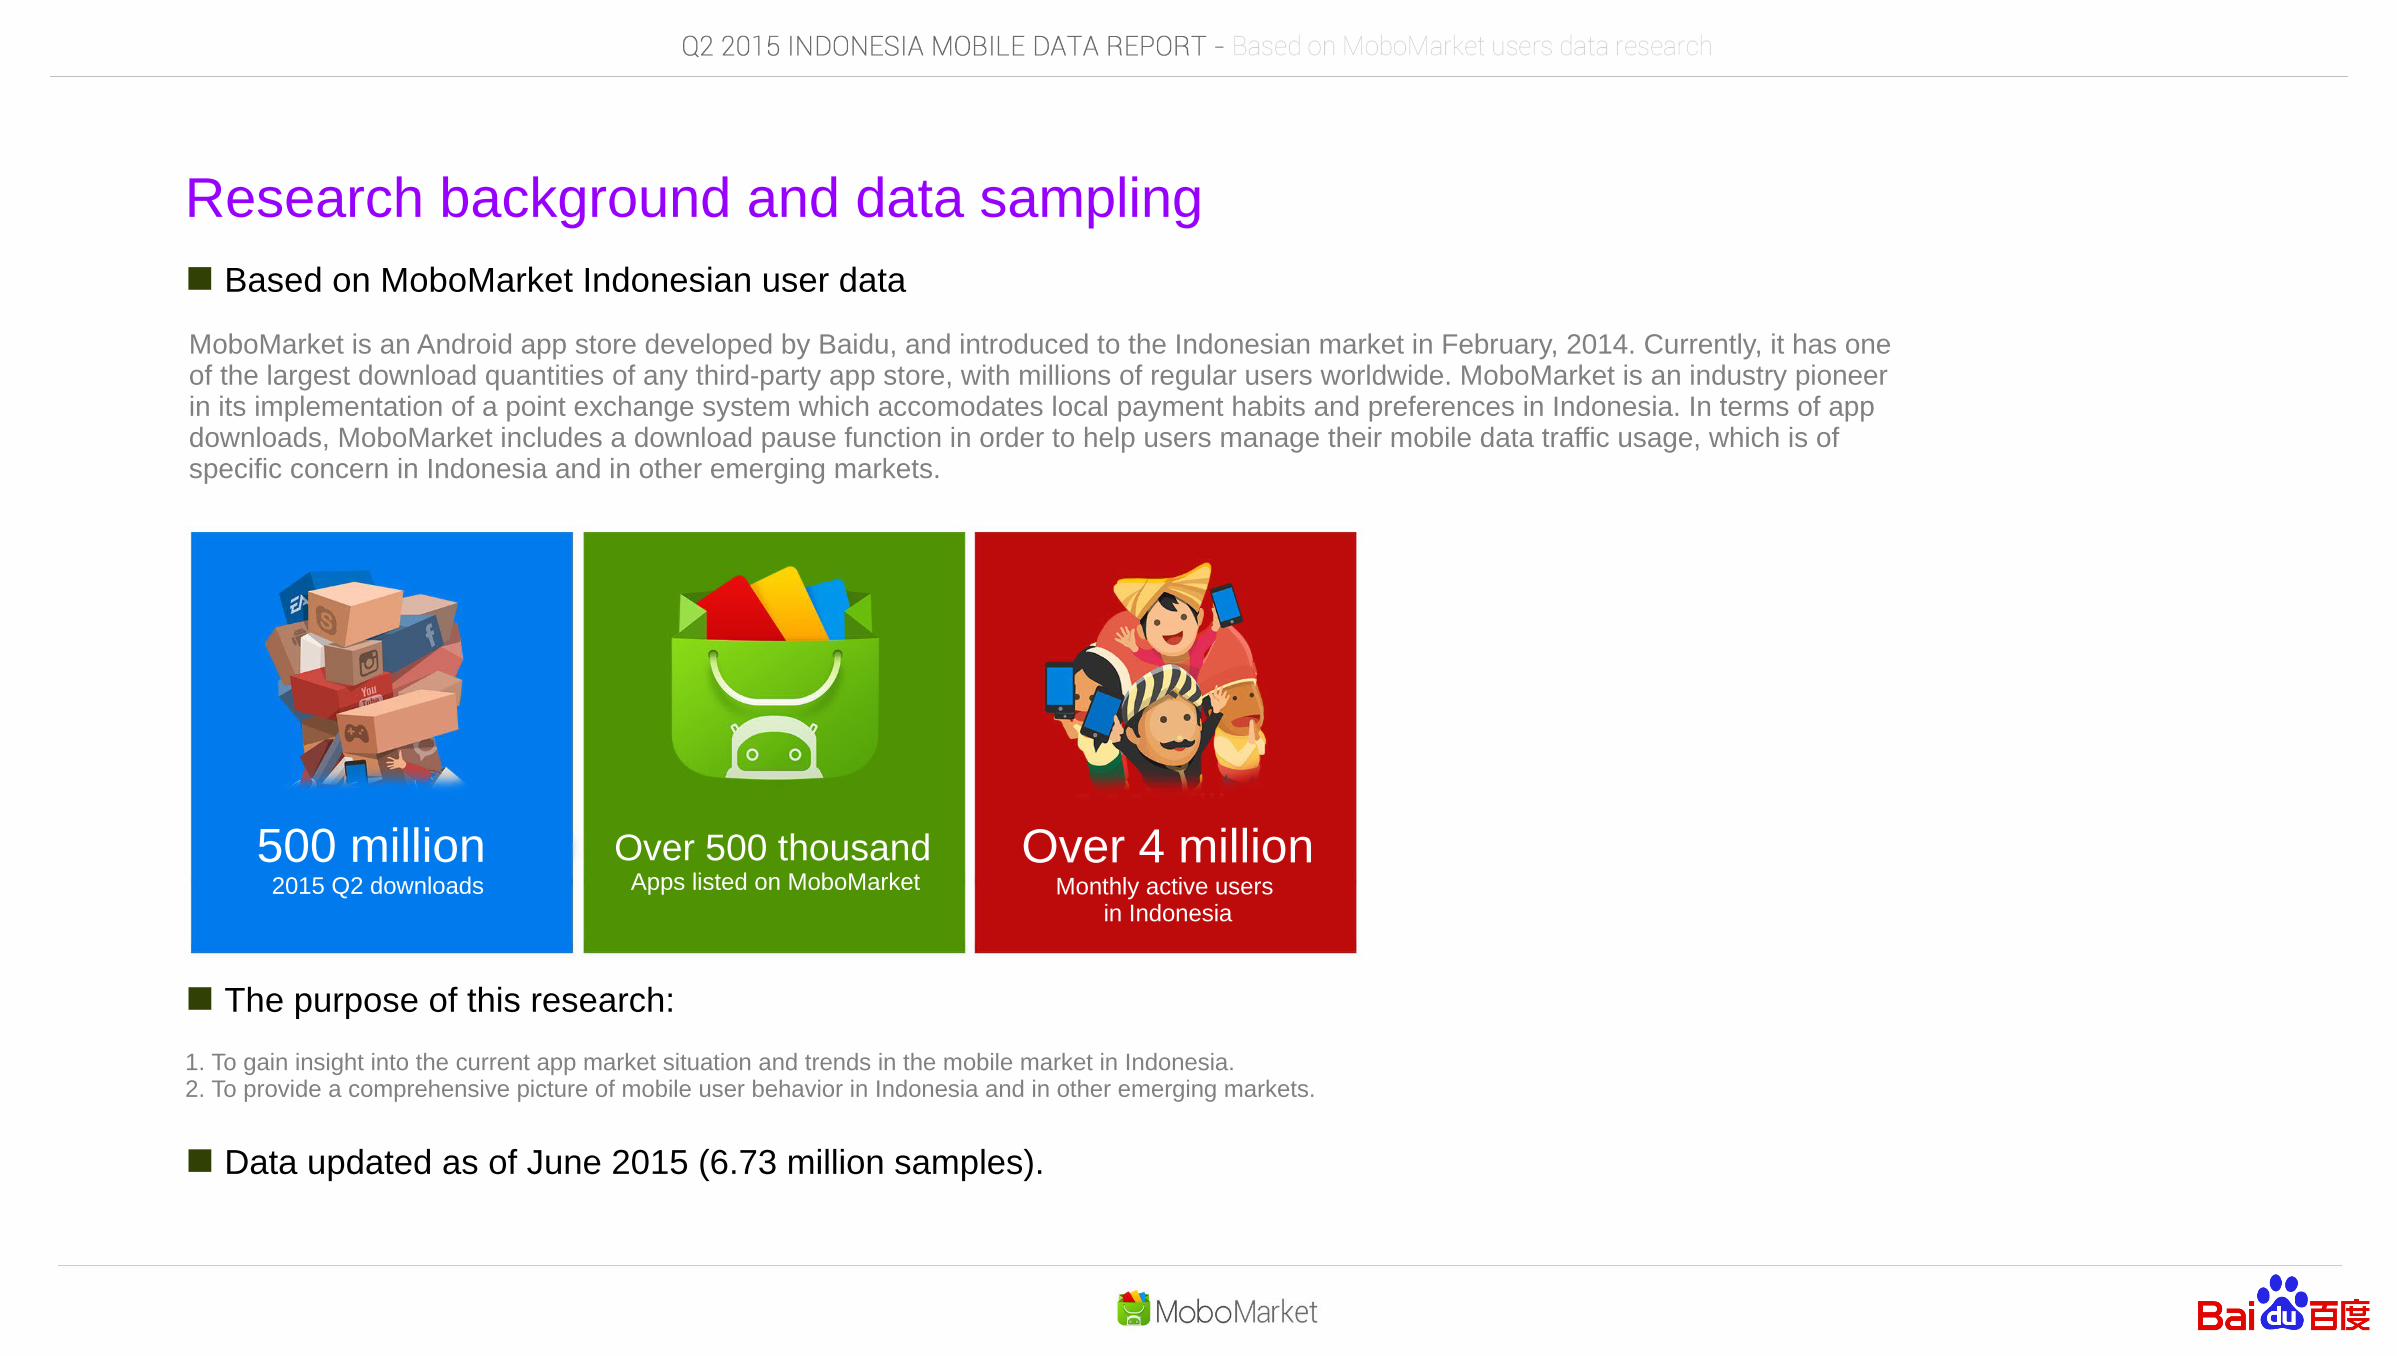
Based on MoboMarket Indonesian user data
Research background and data sampling
MoboMarket is an Android app store developed by Baidu, and introduced to the Indonesian market in February, 2014. Currently, it has one of the largest download quantities of any third-party app store, with millions of regular users worldwide. MoboMarket is an industry pioneer in its implementation of a point exchange system which accomodates local payment habits and preferences in Indonesia. In terms of app downloads, MoboMarket includes a download pause function in order to help users manage their mobile data traffic usage, which is of specific concern in Indonesia and in other emerging markets.
The purpose of this research:
1. To gain insight into the current app market situation and trends in the mobile market in Indonesia.2. To provide a comprehensive picture of mobile user behavior in Indonesia and in other emerging markets.
Data updated as of June 2015 (6.73 million samples).
500 million 2015 Q2 downloads
Over 500 thousand Apps listed on MoboMarket
Over 4 millionMonthly active users
in Indonesia

The most common phone resolution type is still WVGA, accounting for 32.93% of the total market share in Indonesia. The percentage of higher resolution phones (FWVGA~FHD) increased from 23.34% (2015 Q1) to 26.89% (2015 Q2).
There were few changes in user network distribution, and the share of 3G users remained stable at around 60%.
The search browsing to download conversion rate was 22.98% higher than the list browsing to download conversion rate. App users tend to do a precise search for what they want.
The top 20 search terms are mainly in social media, popular games and photography.
Saturday is the day with the highest download activity, especially for game downloads.
Users are very welcoming of all kinds of apps for children and tourism. We observed that users are eager to try all available apps in these categories, and don’t want to miss a single one of them.
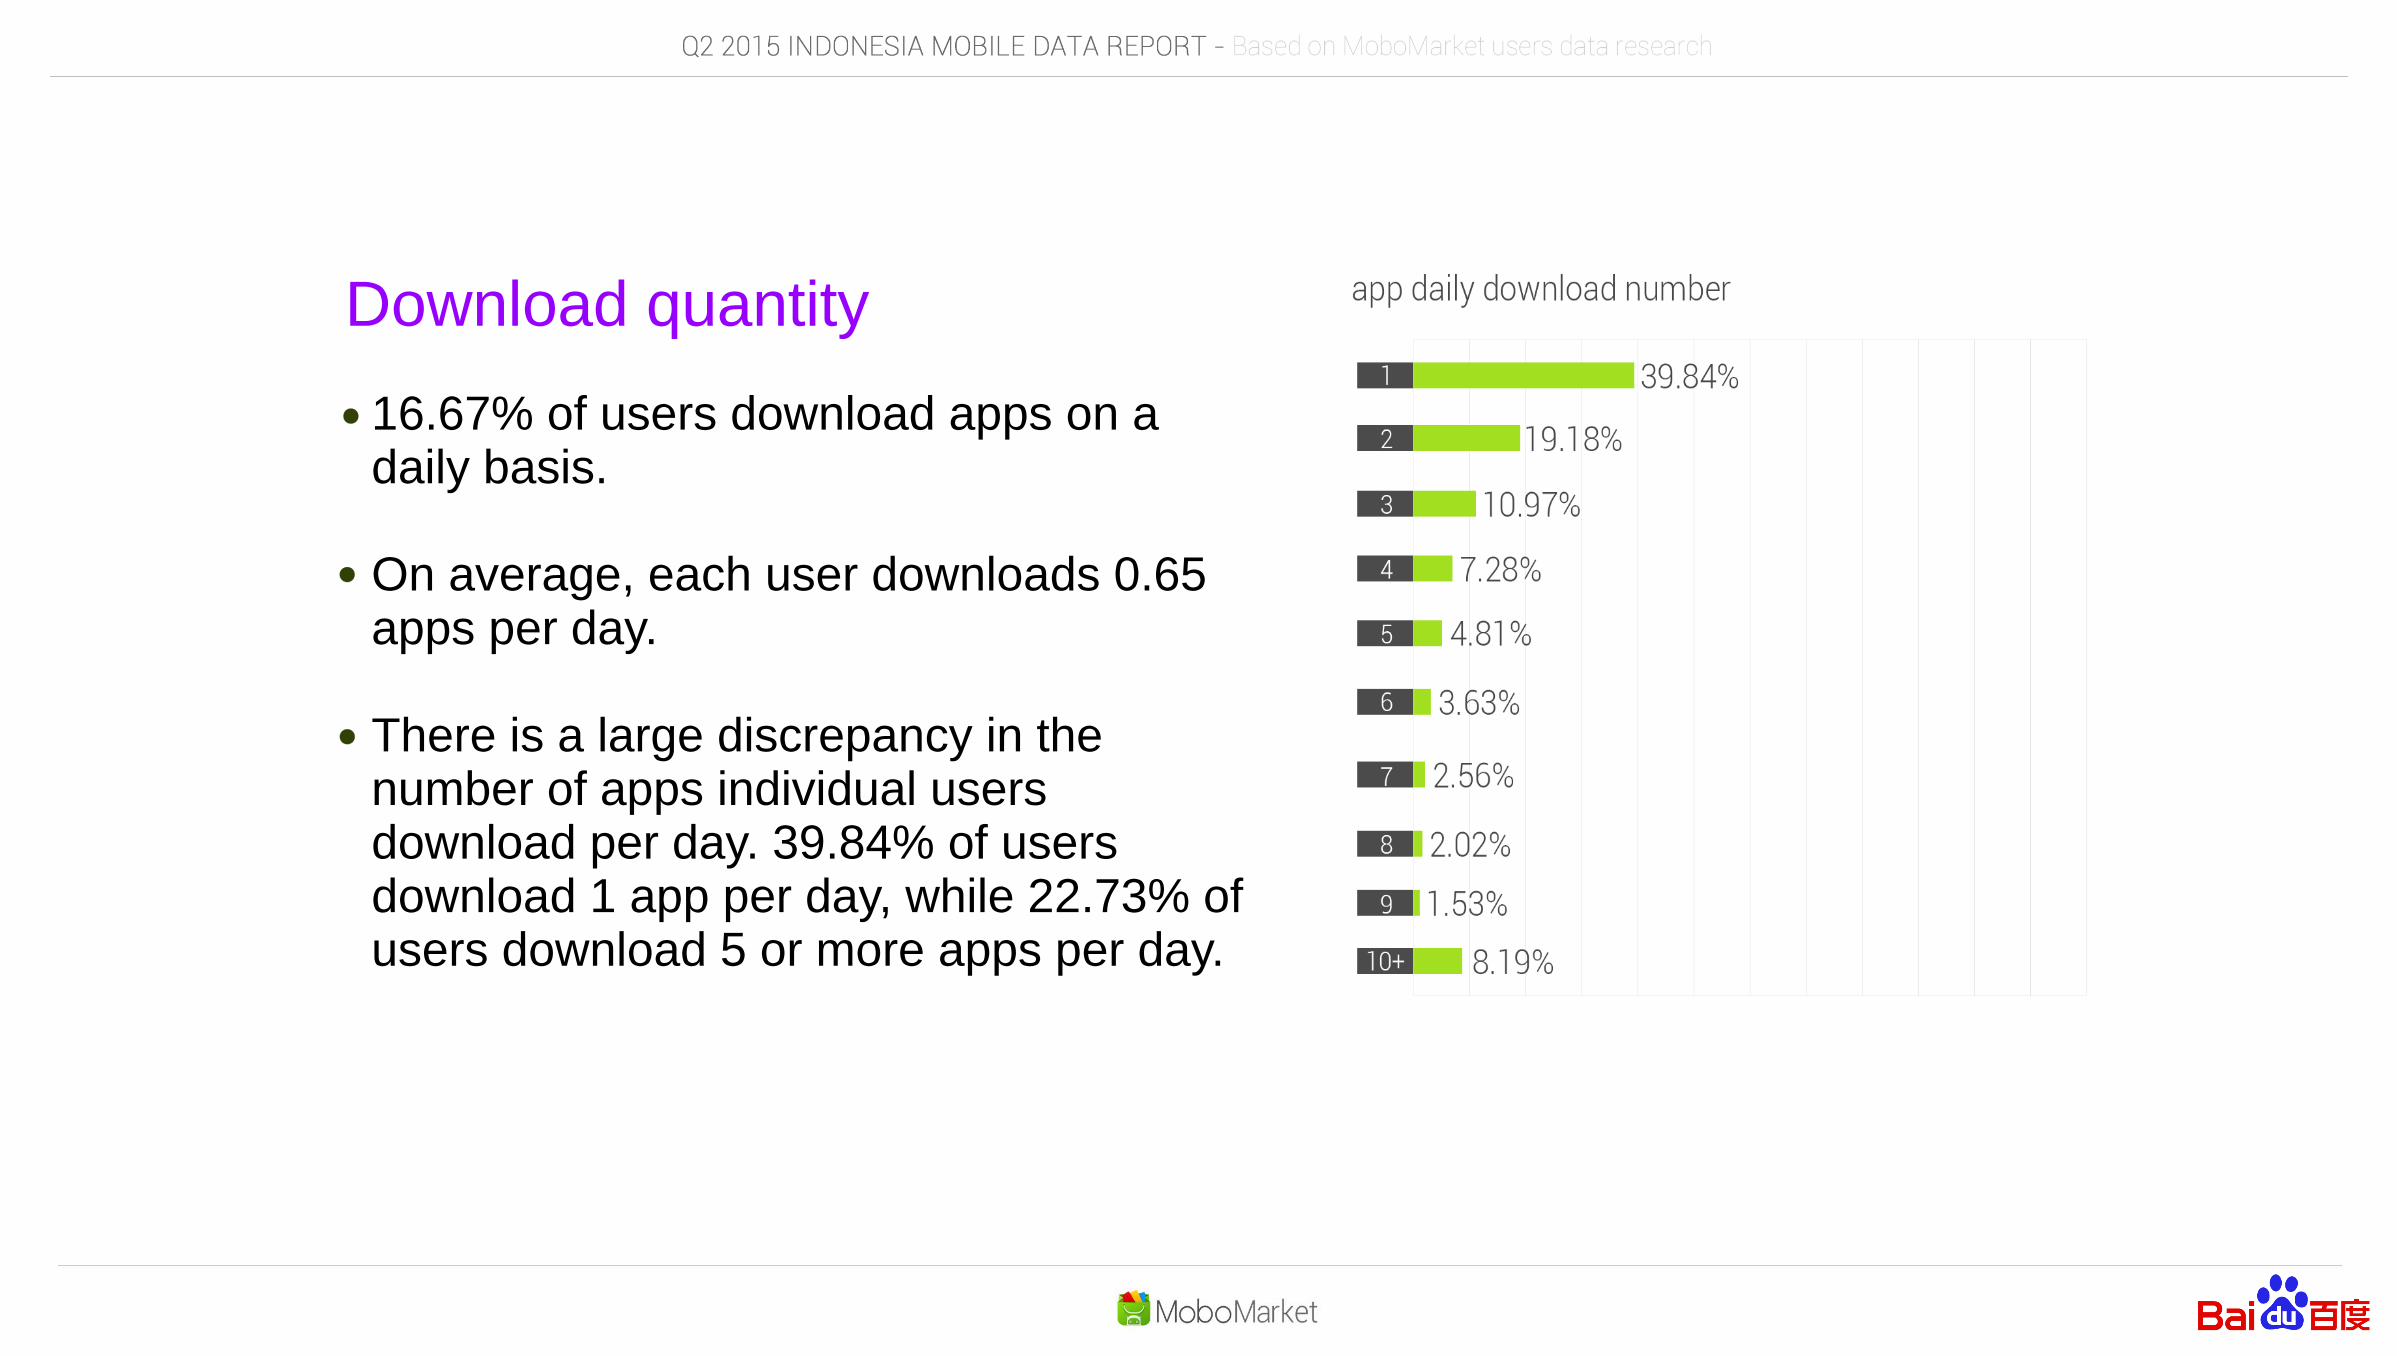
16.67% of users download apps on a daily basis. On average, each user downloads 0.65 app per day. The 3 highest groups are gamers, social media users and tool enthusiasts. Within the games category, casual games were downloaded at the highest percentage.
Social, tools and strategy apps make up a higher percentage of downloads, as these categories belong to the red ocean market category (established markets). Lifestyle, personalization and simulation apps belong to the blue ocean market category (uncontested markets).
4.97% of users update their apps on a daily basis. On average, they update 0.17 apps per day, which demonstrates that users are not particularly willing to update their apps. Social apps outperformed other categories in terms of updates, thus demonstrating a long lifespan in social apps. On the other hand, games exhibited a rather short life span.
Main conclusions
2 Changes in mobile phone screen resolution
Mobile users network breakdown
Android version distribution
Device market analysis
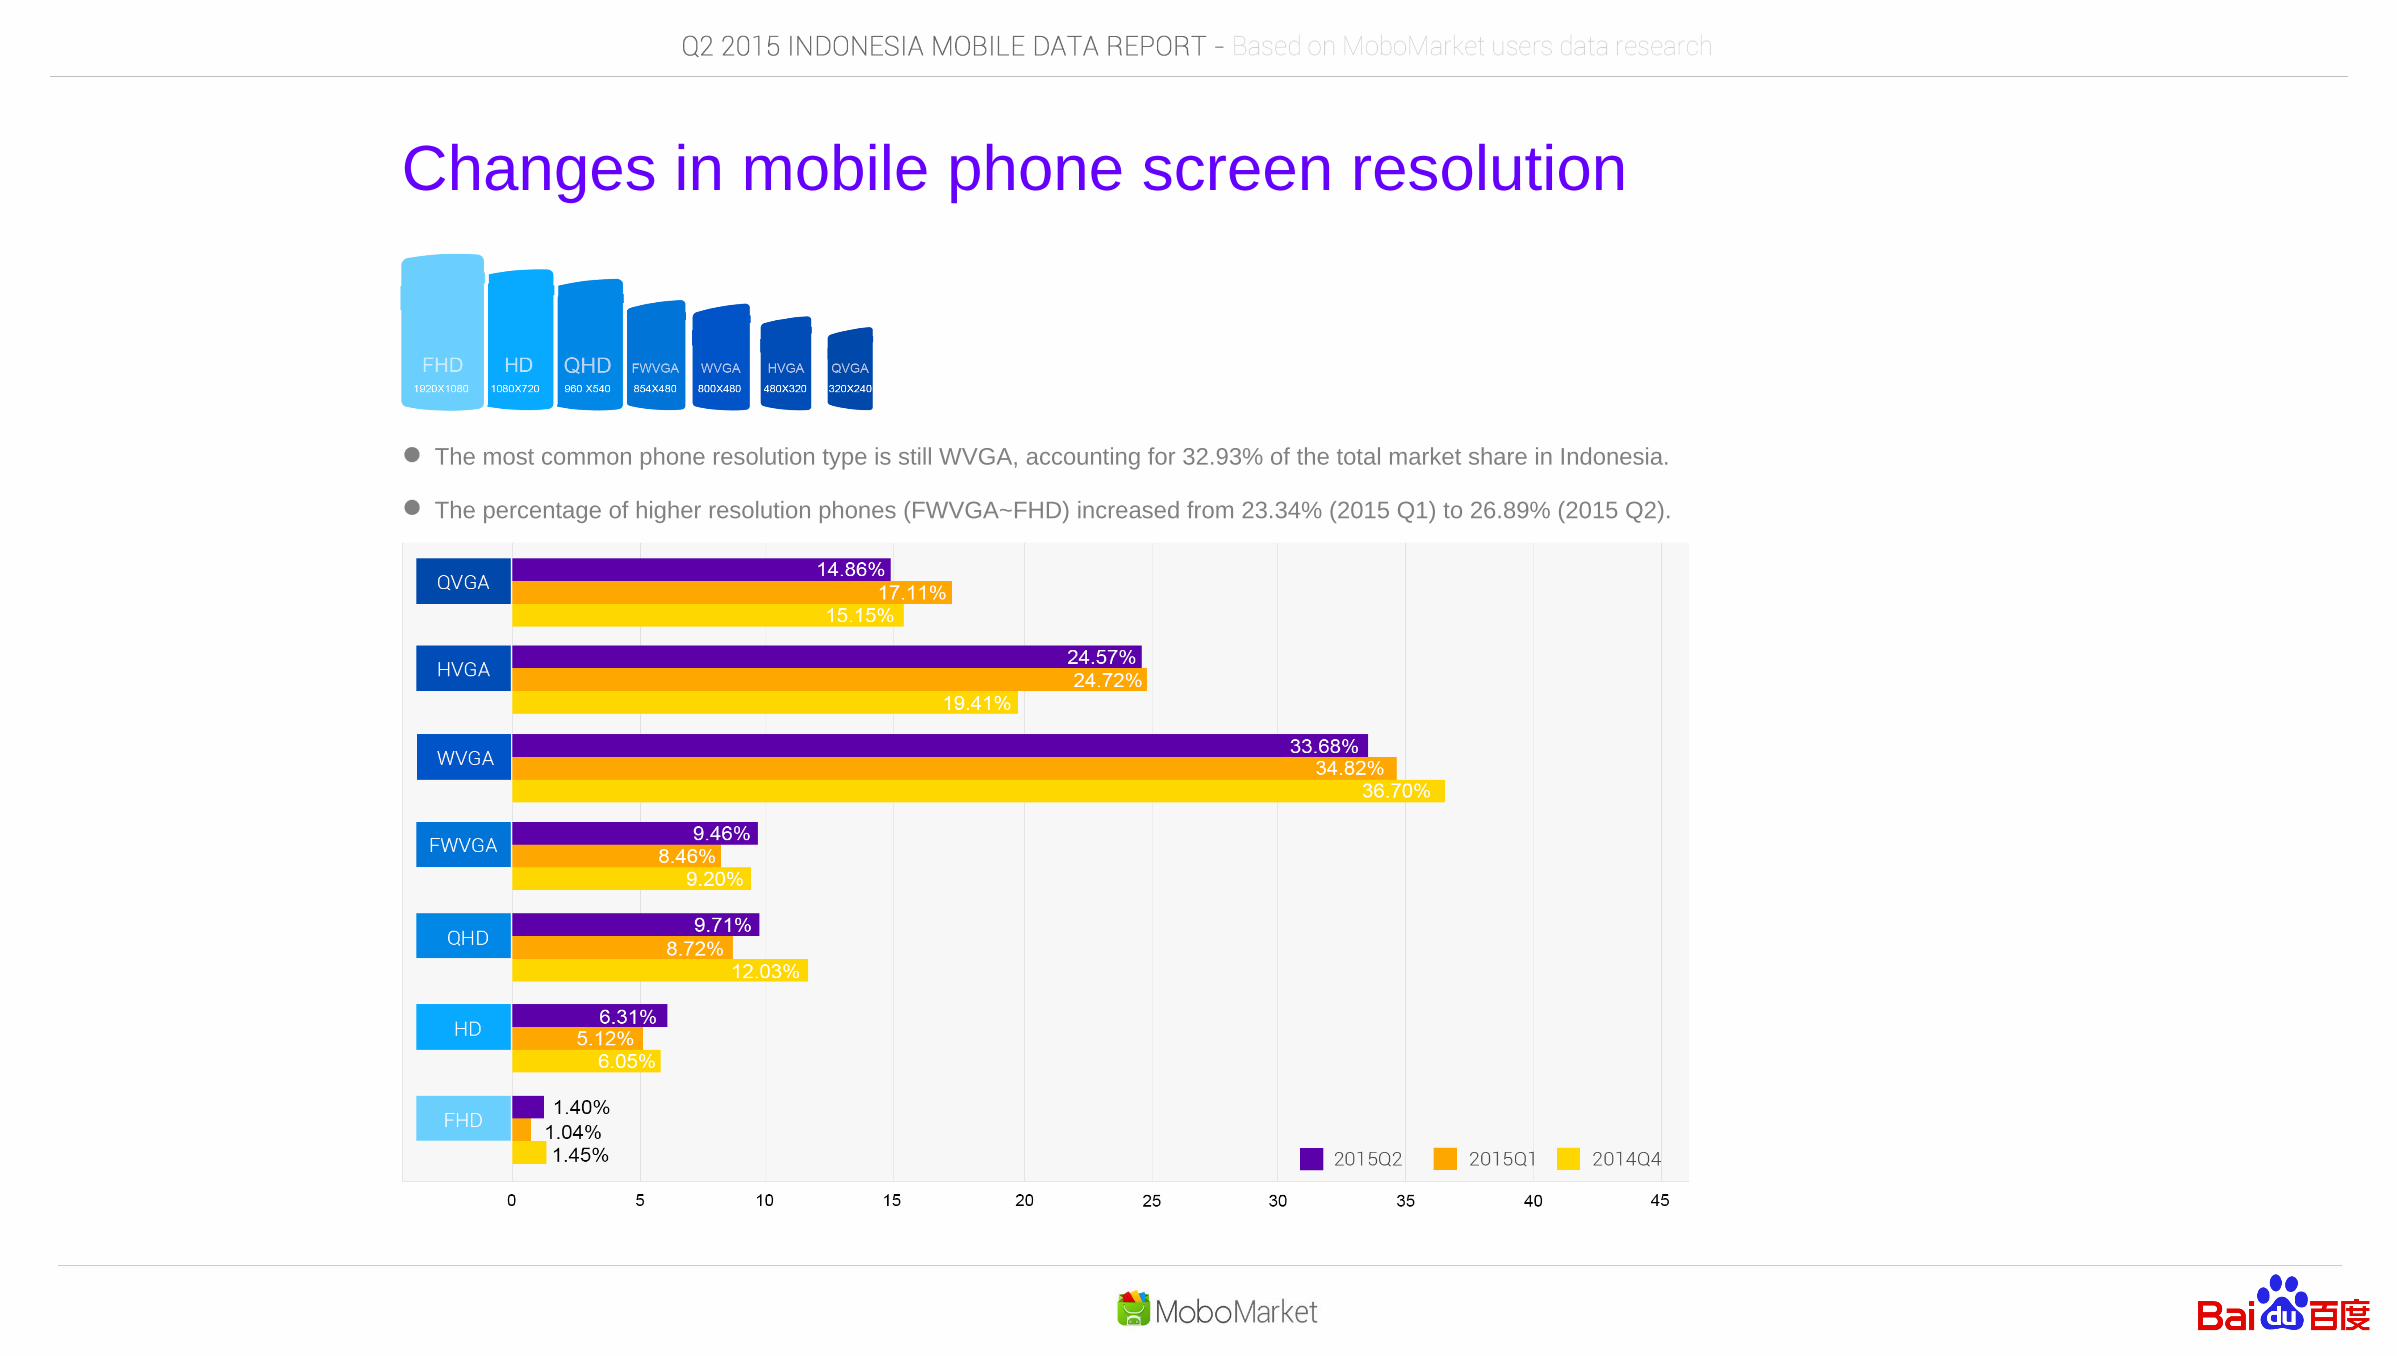
Changes in mobile phone screen resolution
The most common phone resolution type is still WVGA, accounting for 32.93% of the total market share in Indonesia.
The percentage of higher resolution phones (FWVGA~FHD) increased from 23.34% (2015 Q1) to 26.89% (2015 Q2).
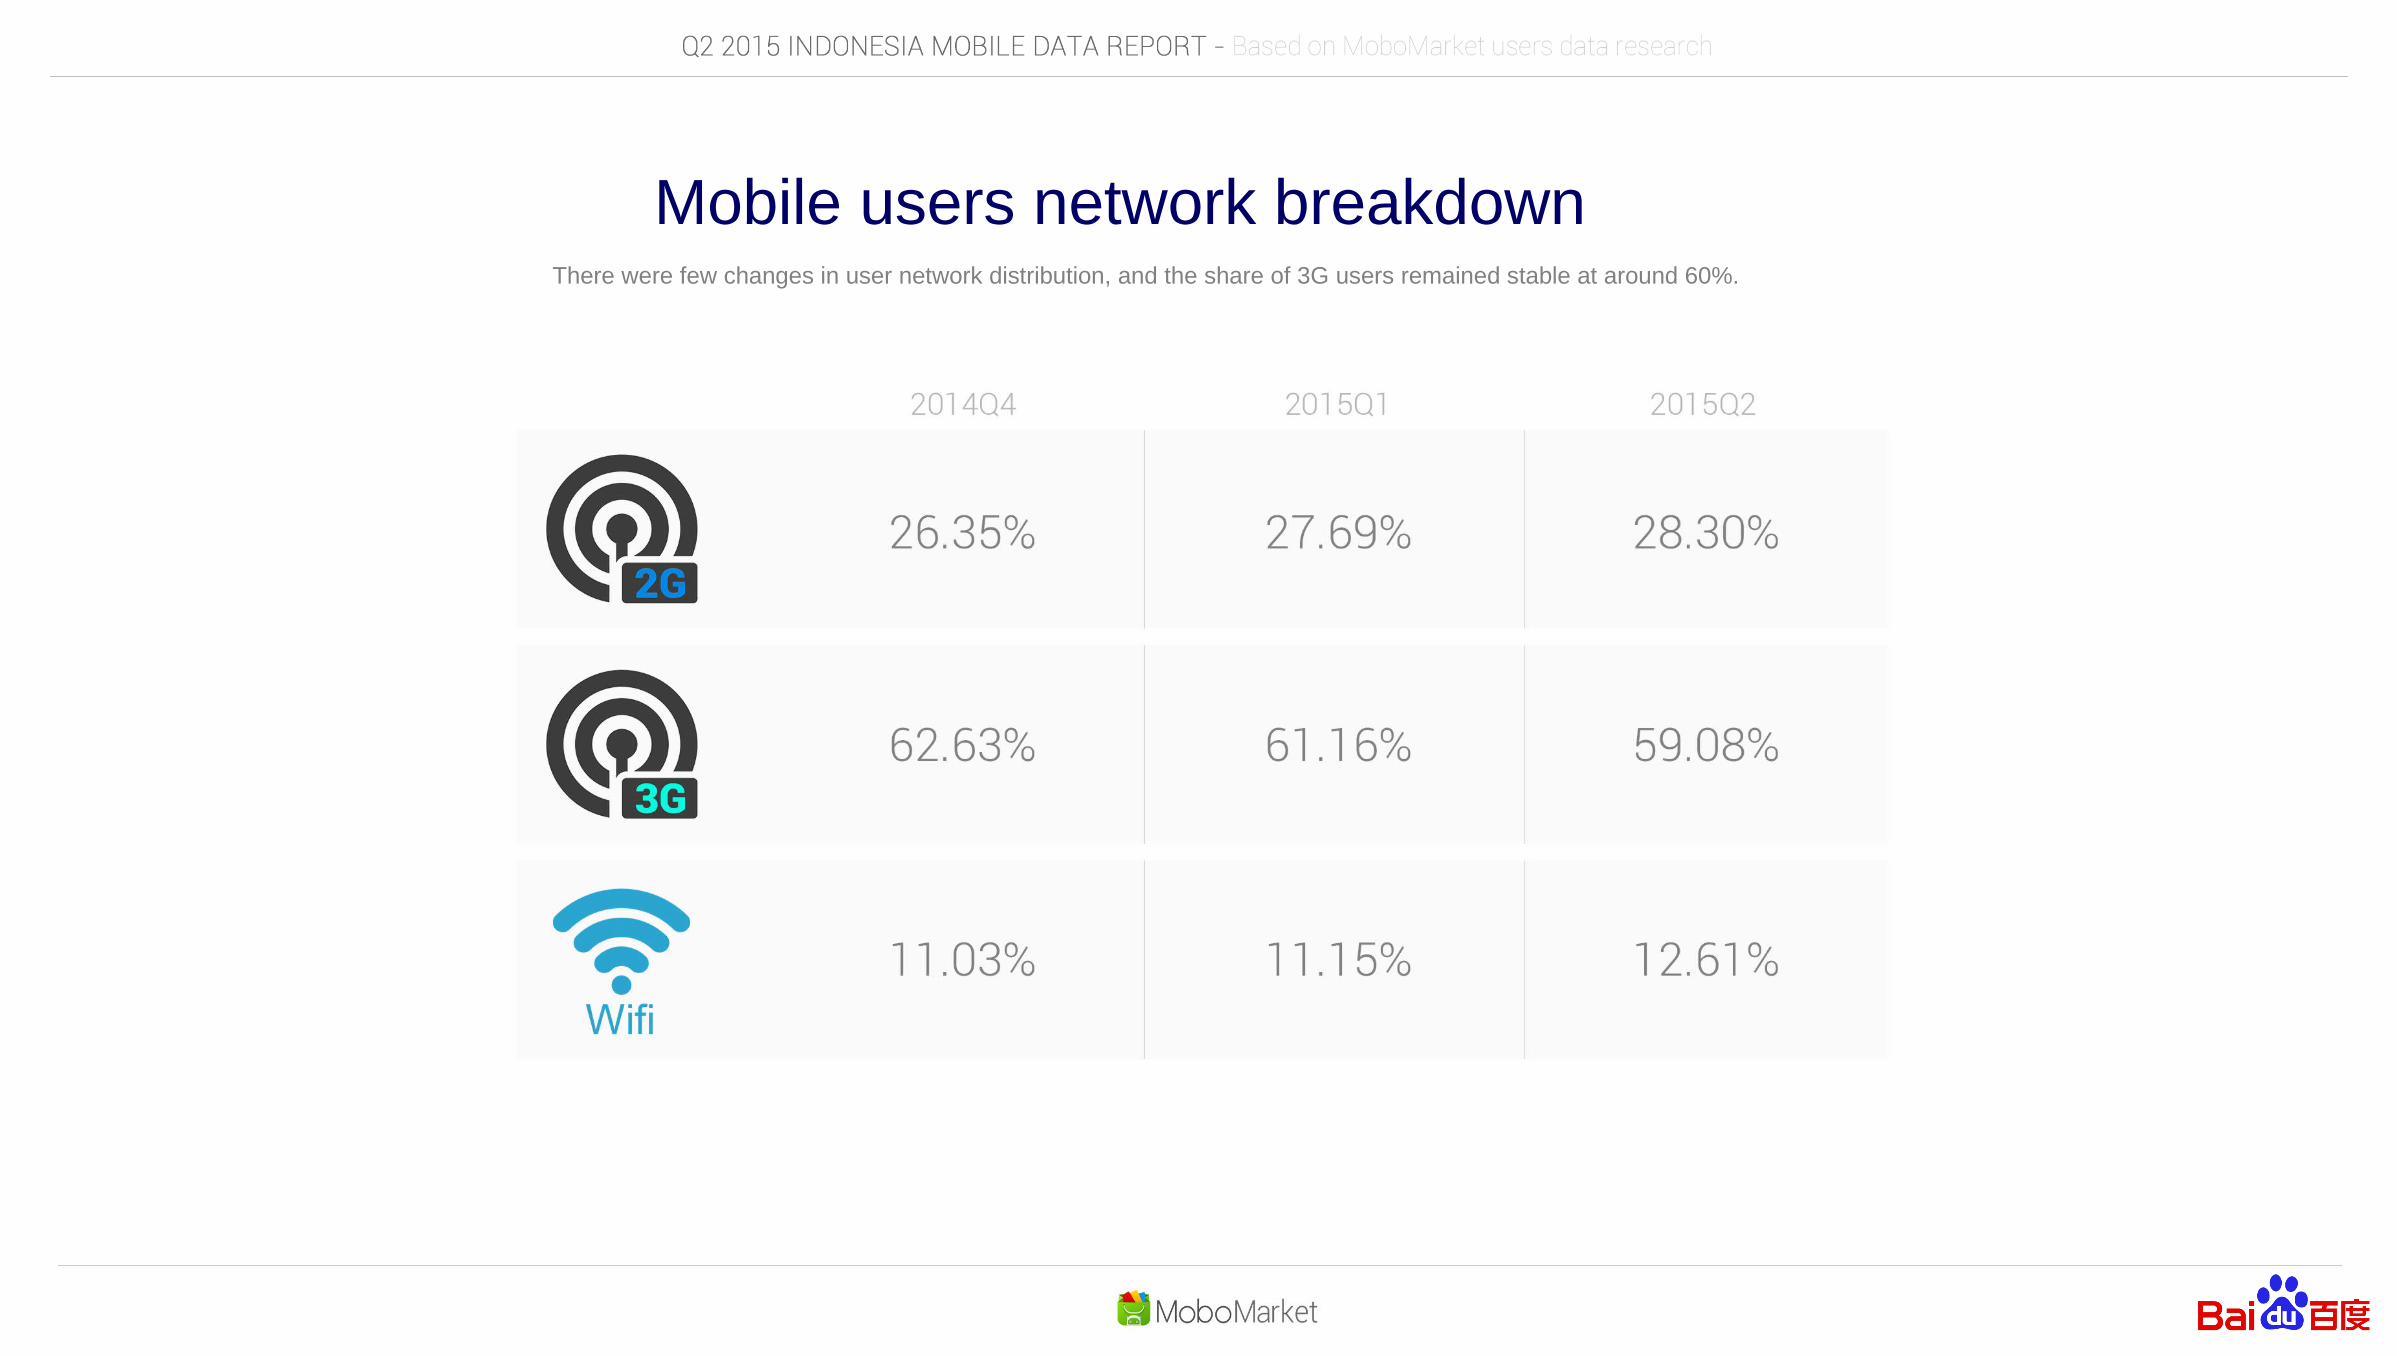
Mobile users network breakdownThere were few changes in user network distribution, and the share of 3G users remained stable at around 60%.

Android version distributionThere was a significant increase in the percentage of people using a higher version of Android. In 2014 Q4, 80.10% of people used lower than version 4.4, and this percentage dropped to 59.20% in 2015 Q2. However, 15% of the market share is still using version 2.X. It is thus still important to consider compatibility for lower OS versions when developing apps.
3 Search and downloads are continuously growing
App seekers tend to do a precise search for what they want
Top 20 popular search terms
Search behavior analysis
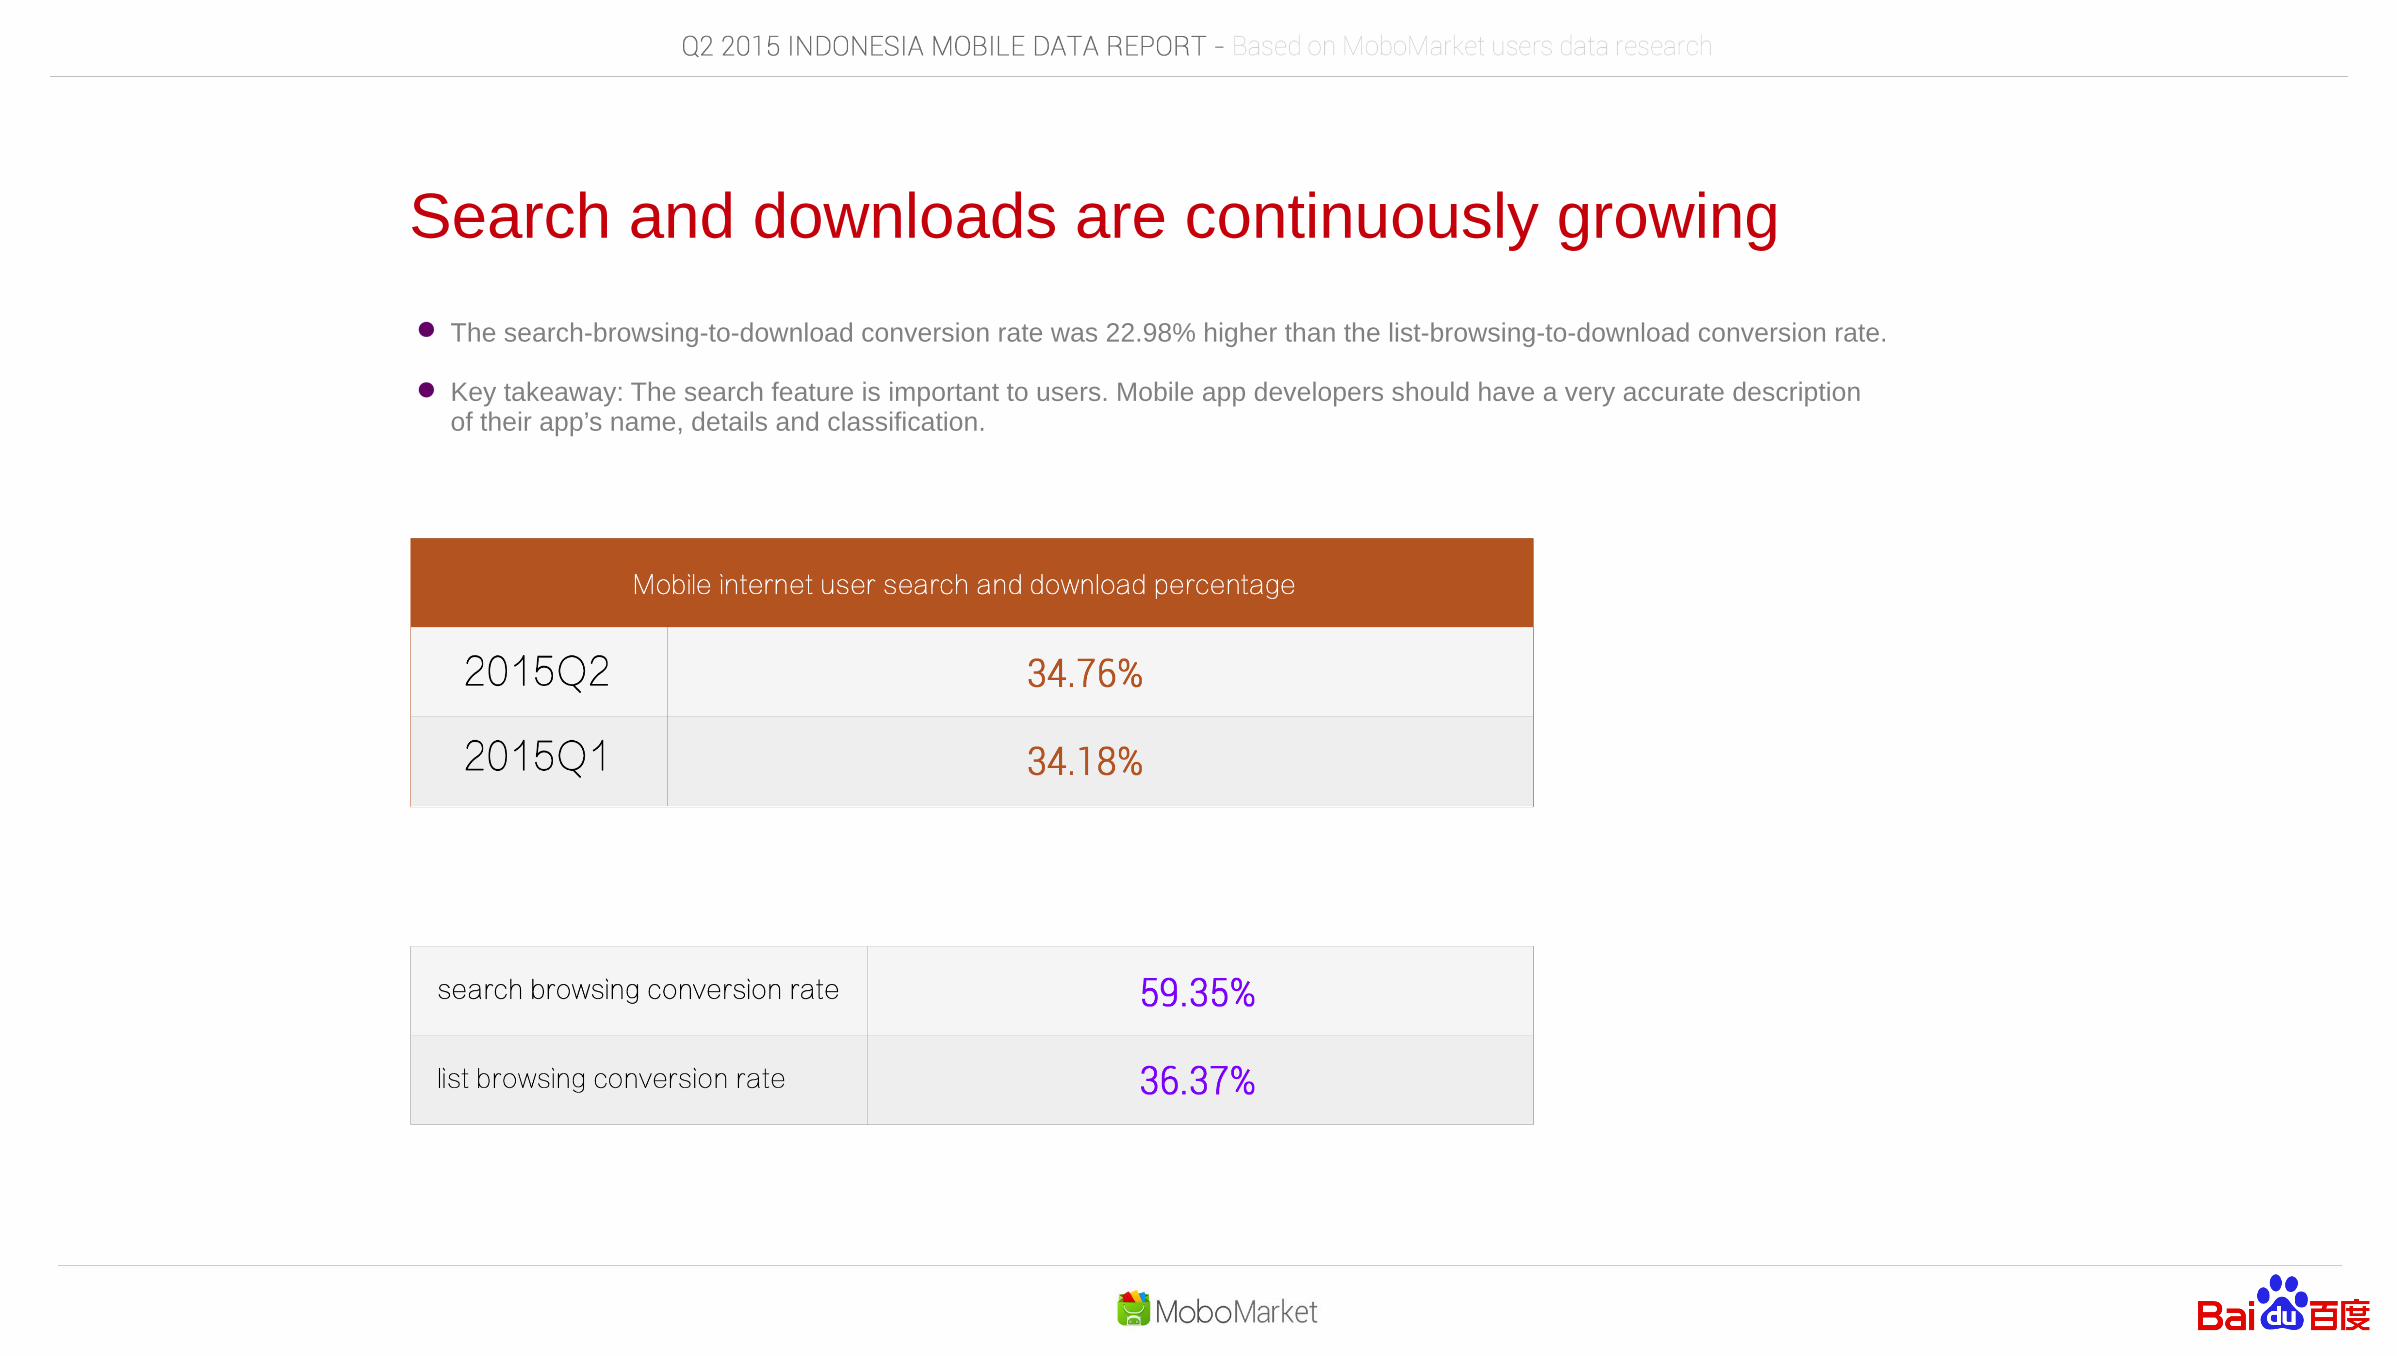
Search and downloads are continuously growing
The search-browsing-to-download conversion rate was 22.98% higher than the list-browsing-to-download conversion rate.
Key takeaway: The search feature is important to users. Mobile app developers should have a very accurate description of their app’s name, details and classification.
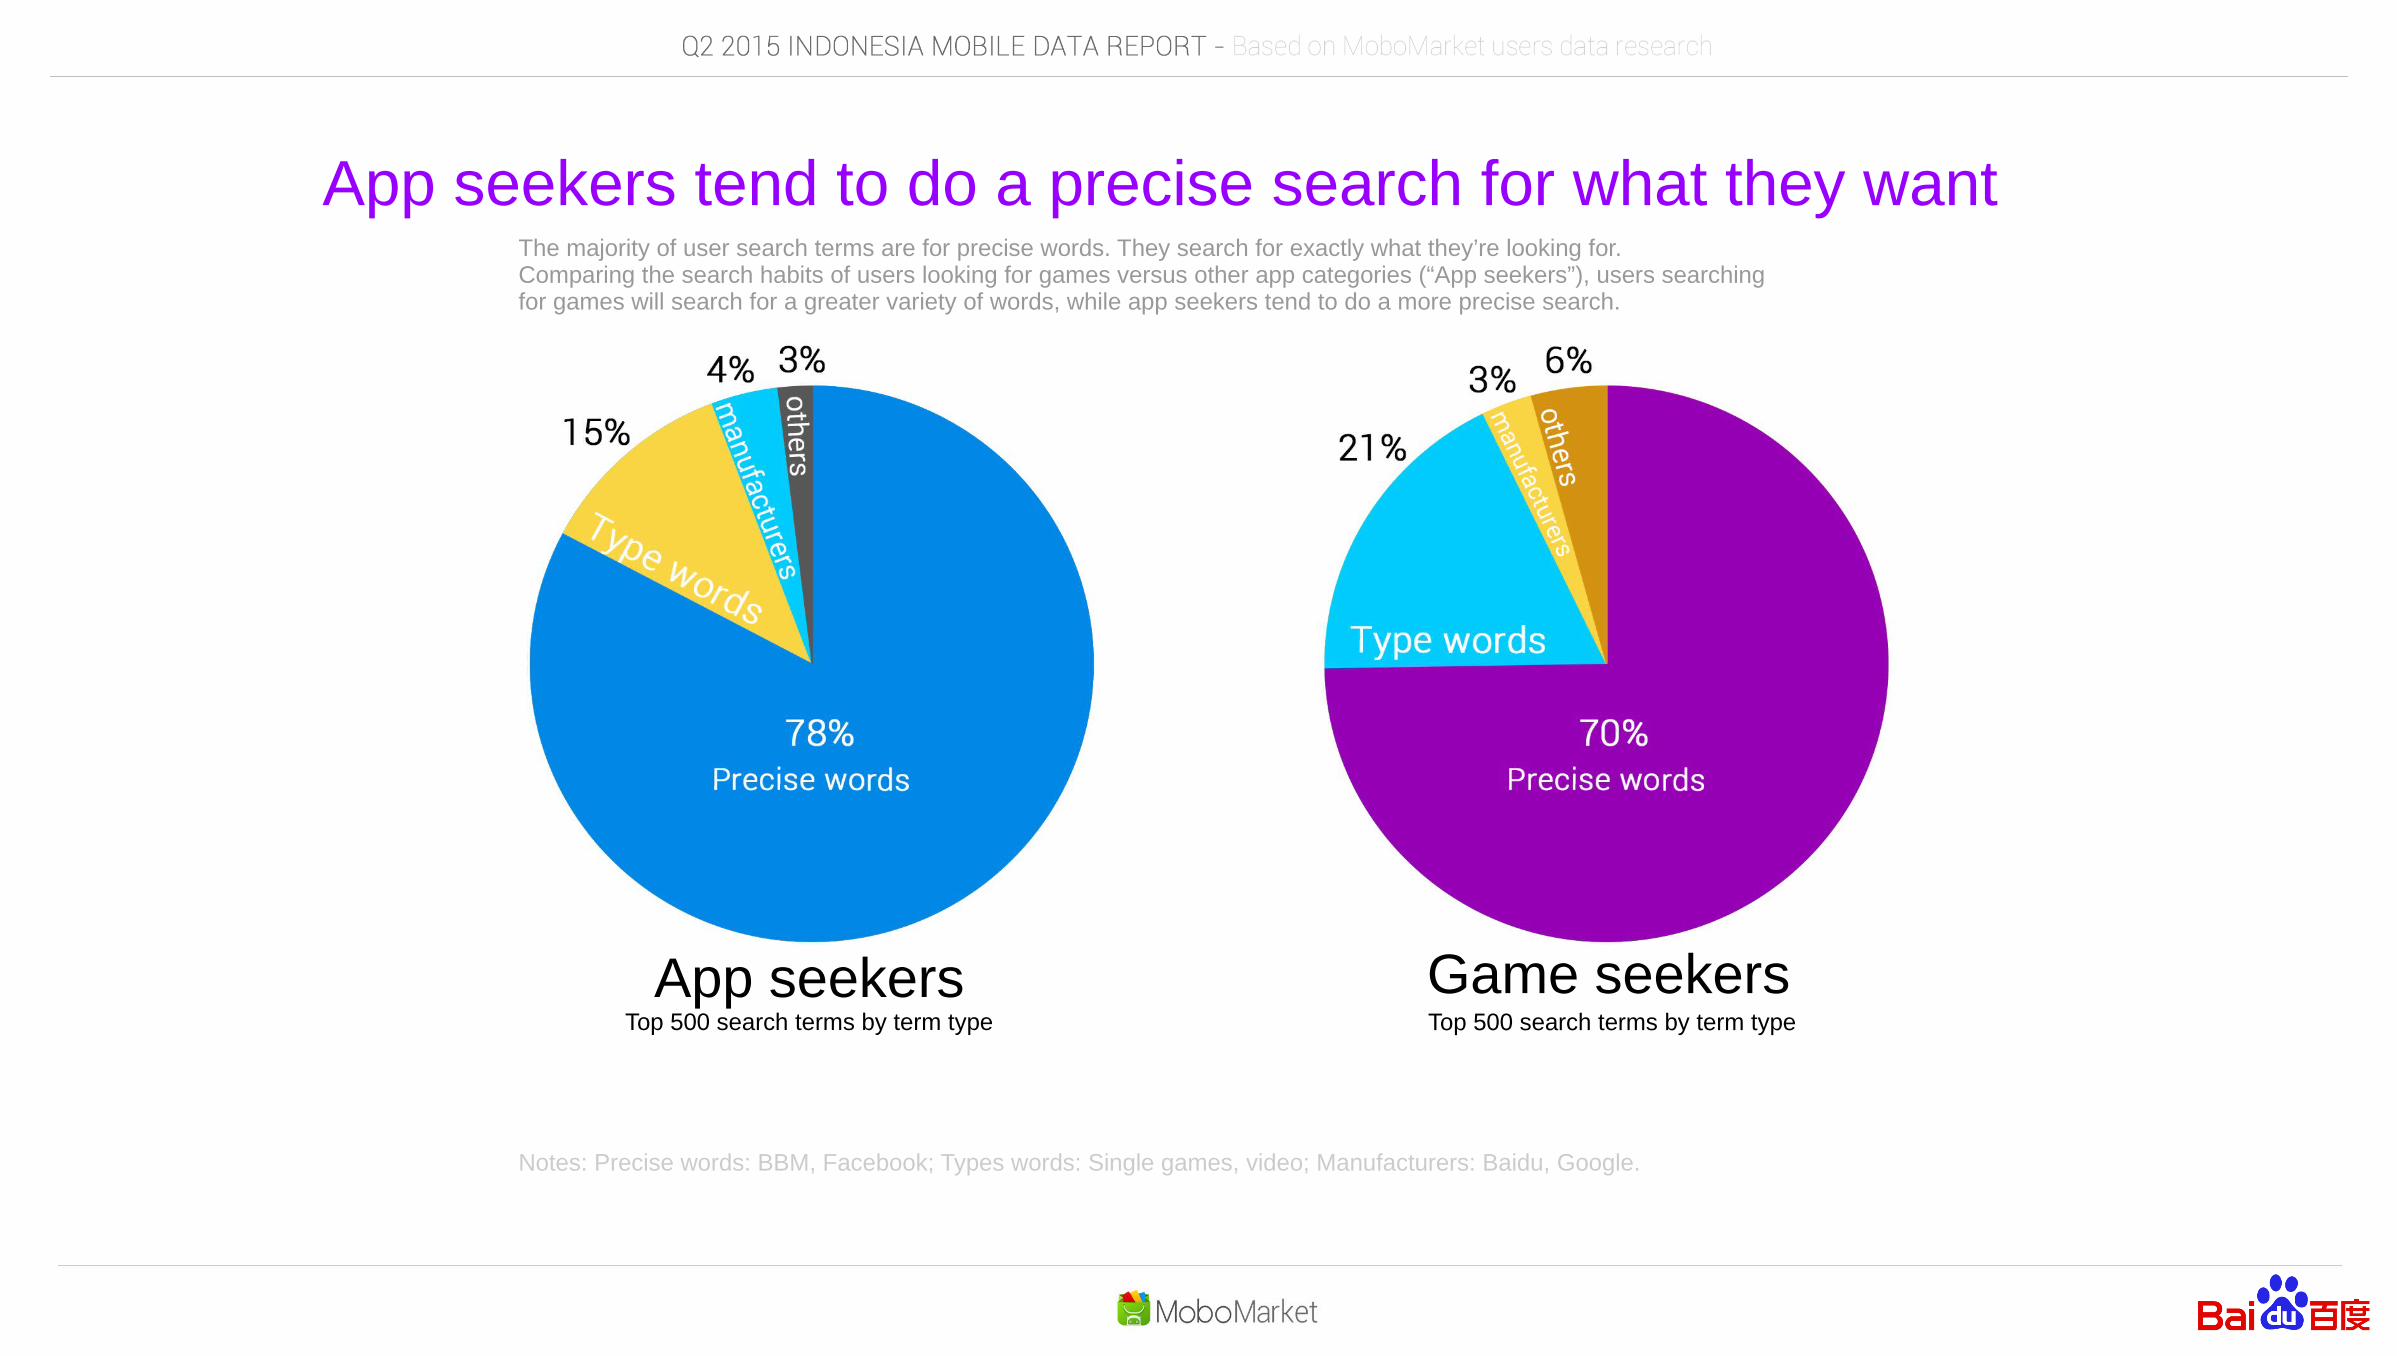
App seekers tend to do a precise search for what they wantThe majority of user search terms are for precise words. They search for exactly what they’re looking for.Comparing the search habits of users looking for games versus other app categories (“App seekers”), users searching for games will search for a greater variety of words, while app seekers tend to do a more precise search.
Notes: Precise words: BBM, Facebook; Types words: Single games, video; Manufacturers: Baidu, Google.
Top 500 search terms by term type Top 500 search terms by term type App seekers Game seekers
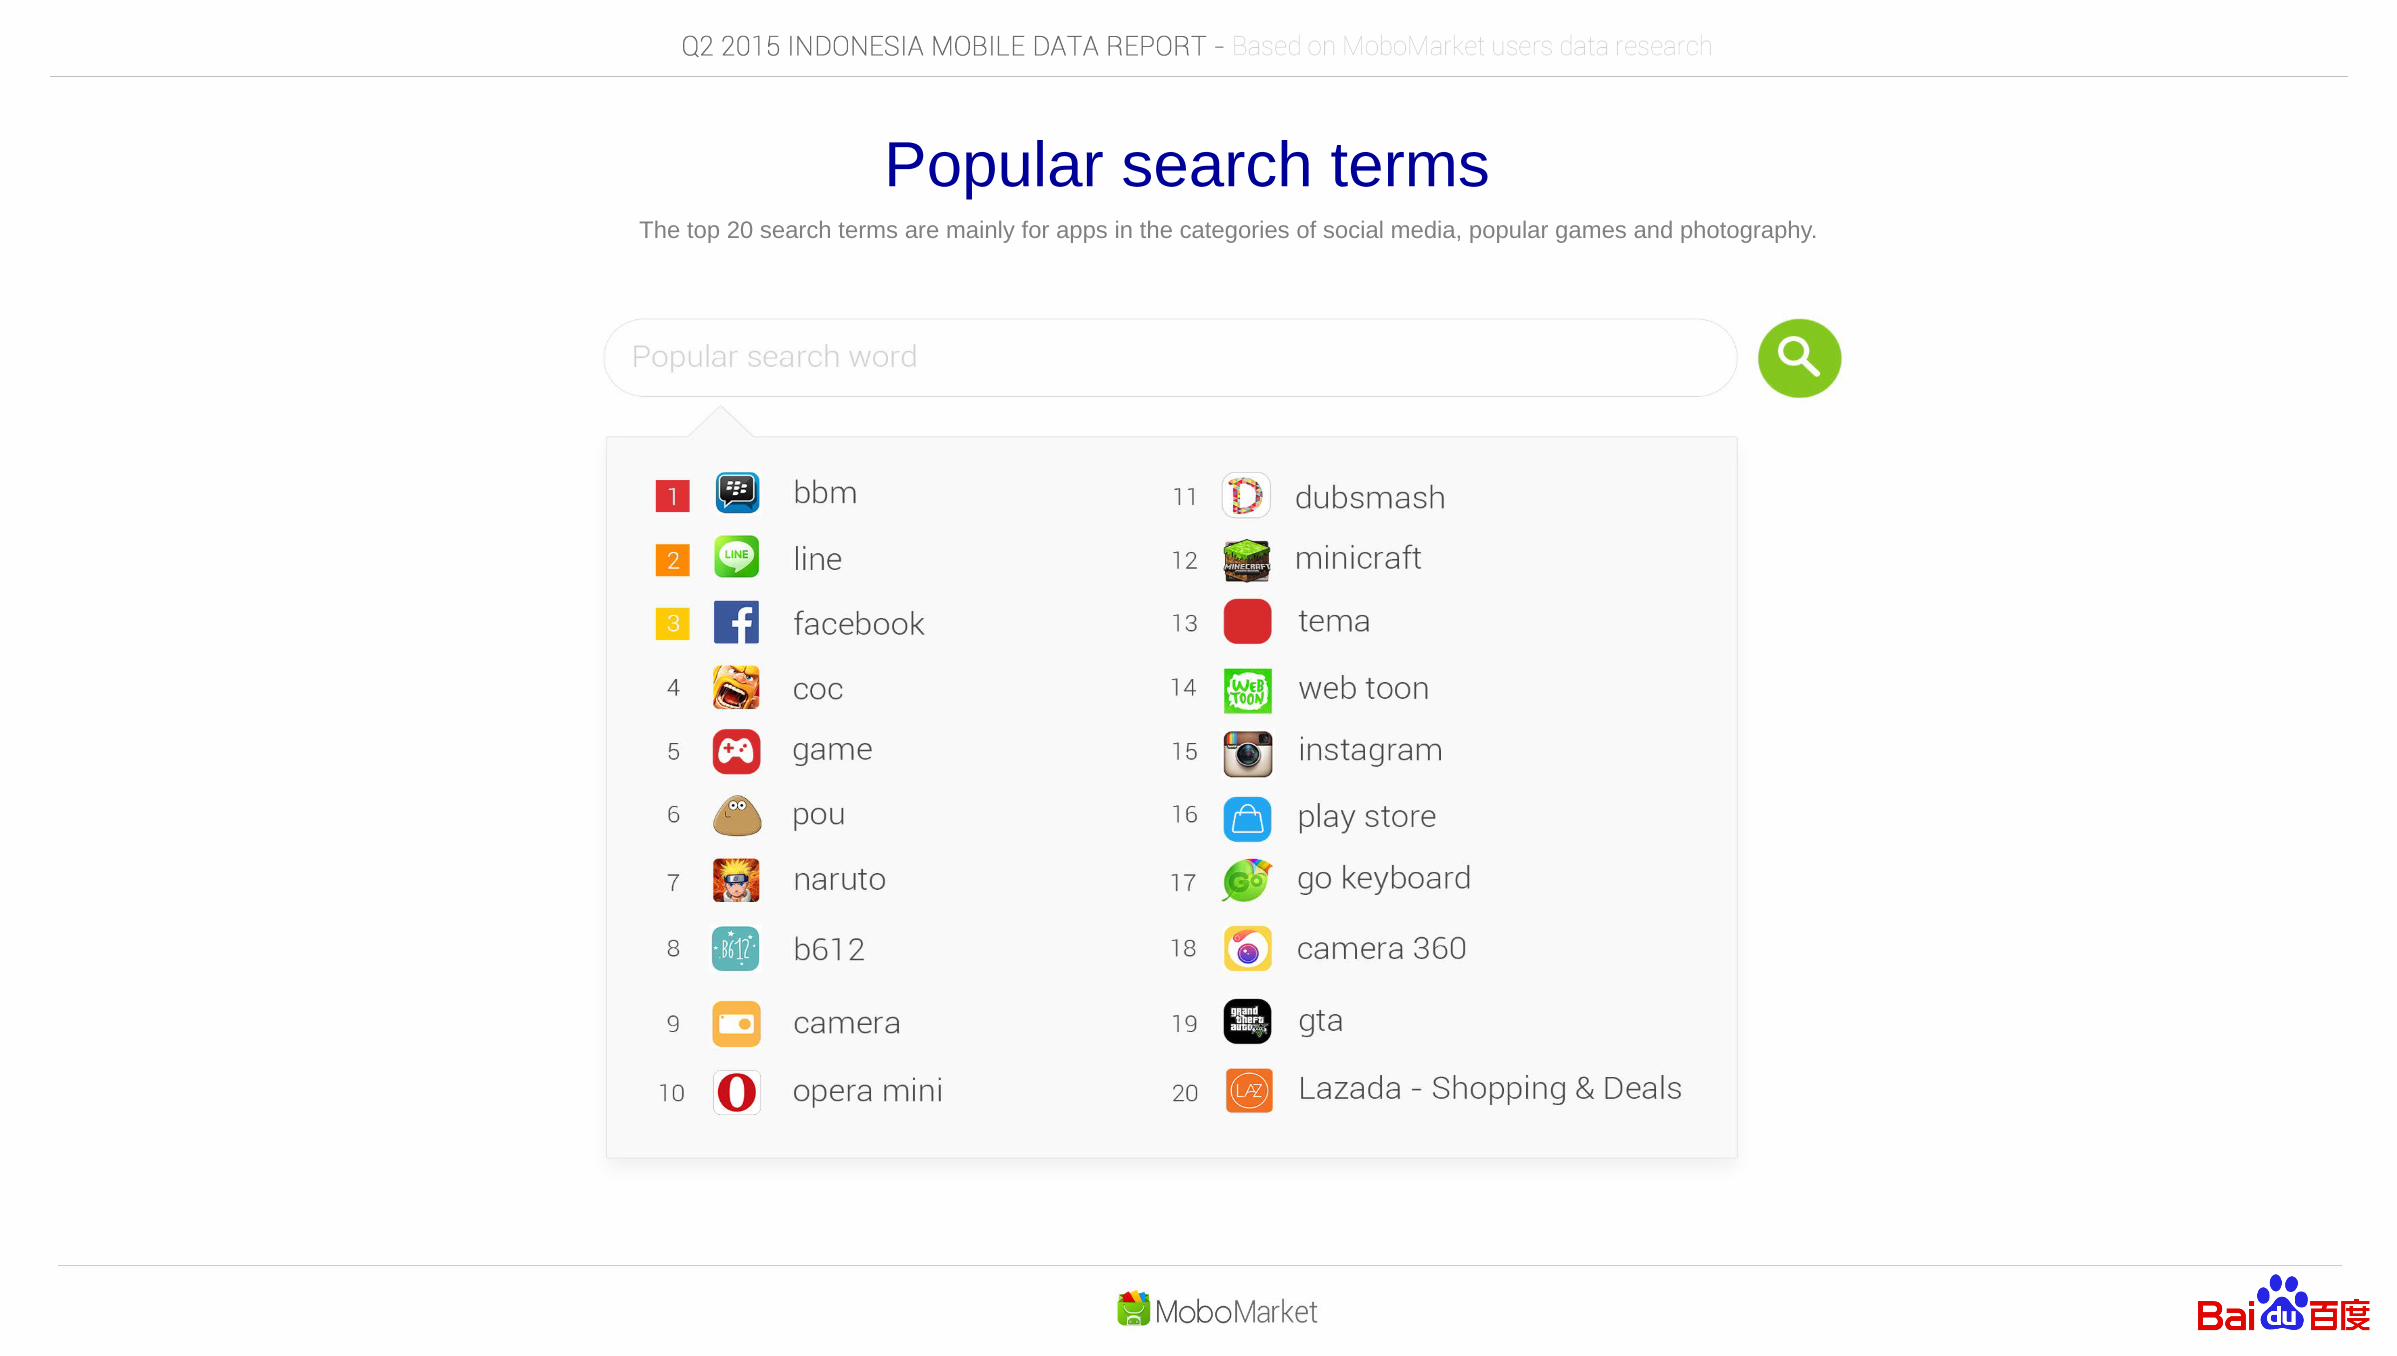
Popular search termsThe top 20 search terms are mainly for apps in the categories of social media, popular games and photography.
4 Popular download days
Download quantity
Infographic of mobile Internet users interests/habits
Game types downloaded
Top 200 most downloaded new apps
Top 200 most downloaded new games
Top 500 app types distribution
Top 500 game types distribution
App browsing conversion charts
Top 10 installed social apps
Top 10 installed photography apps
Top 10 installed tool apps
Top 10 installed games
Top 10 installation package sizes
Download behavior analysis
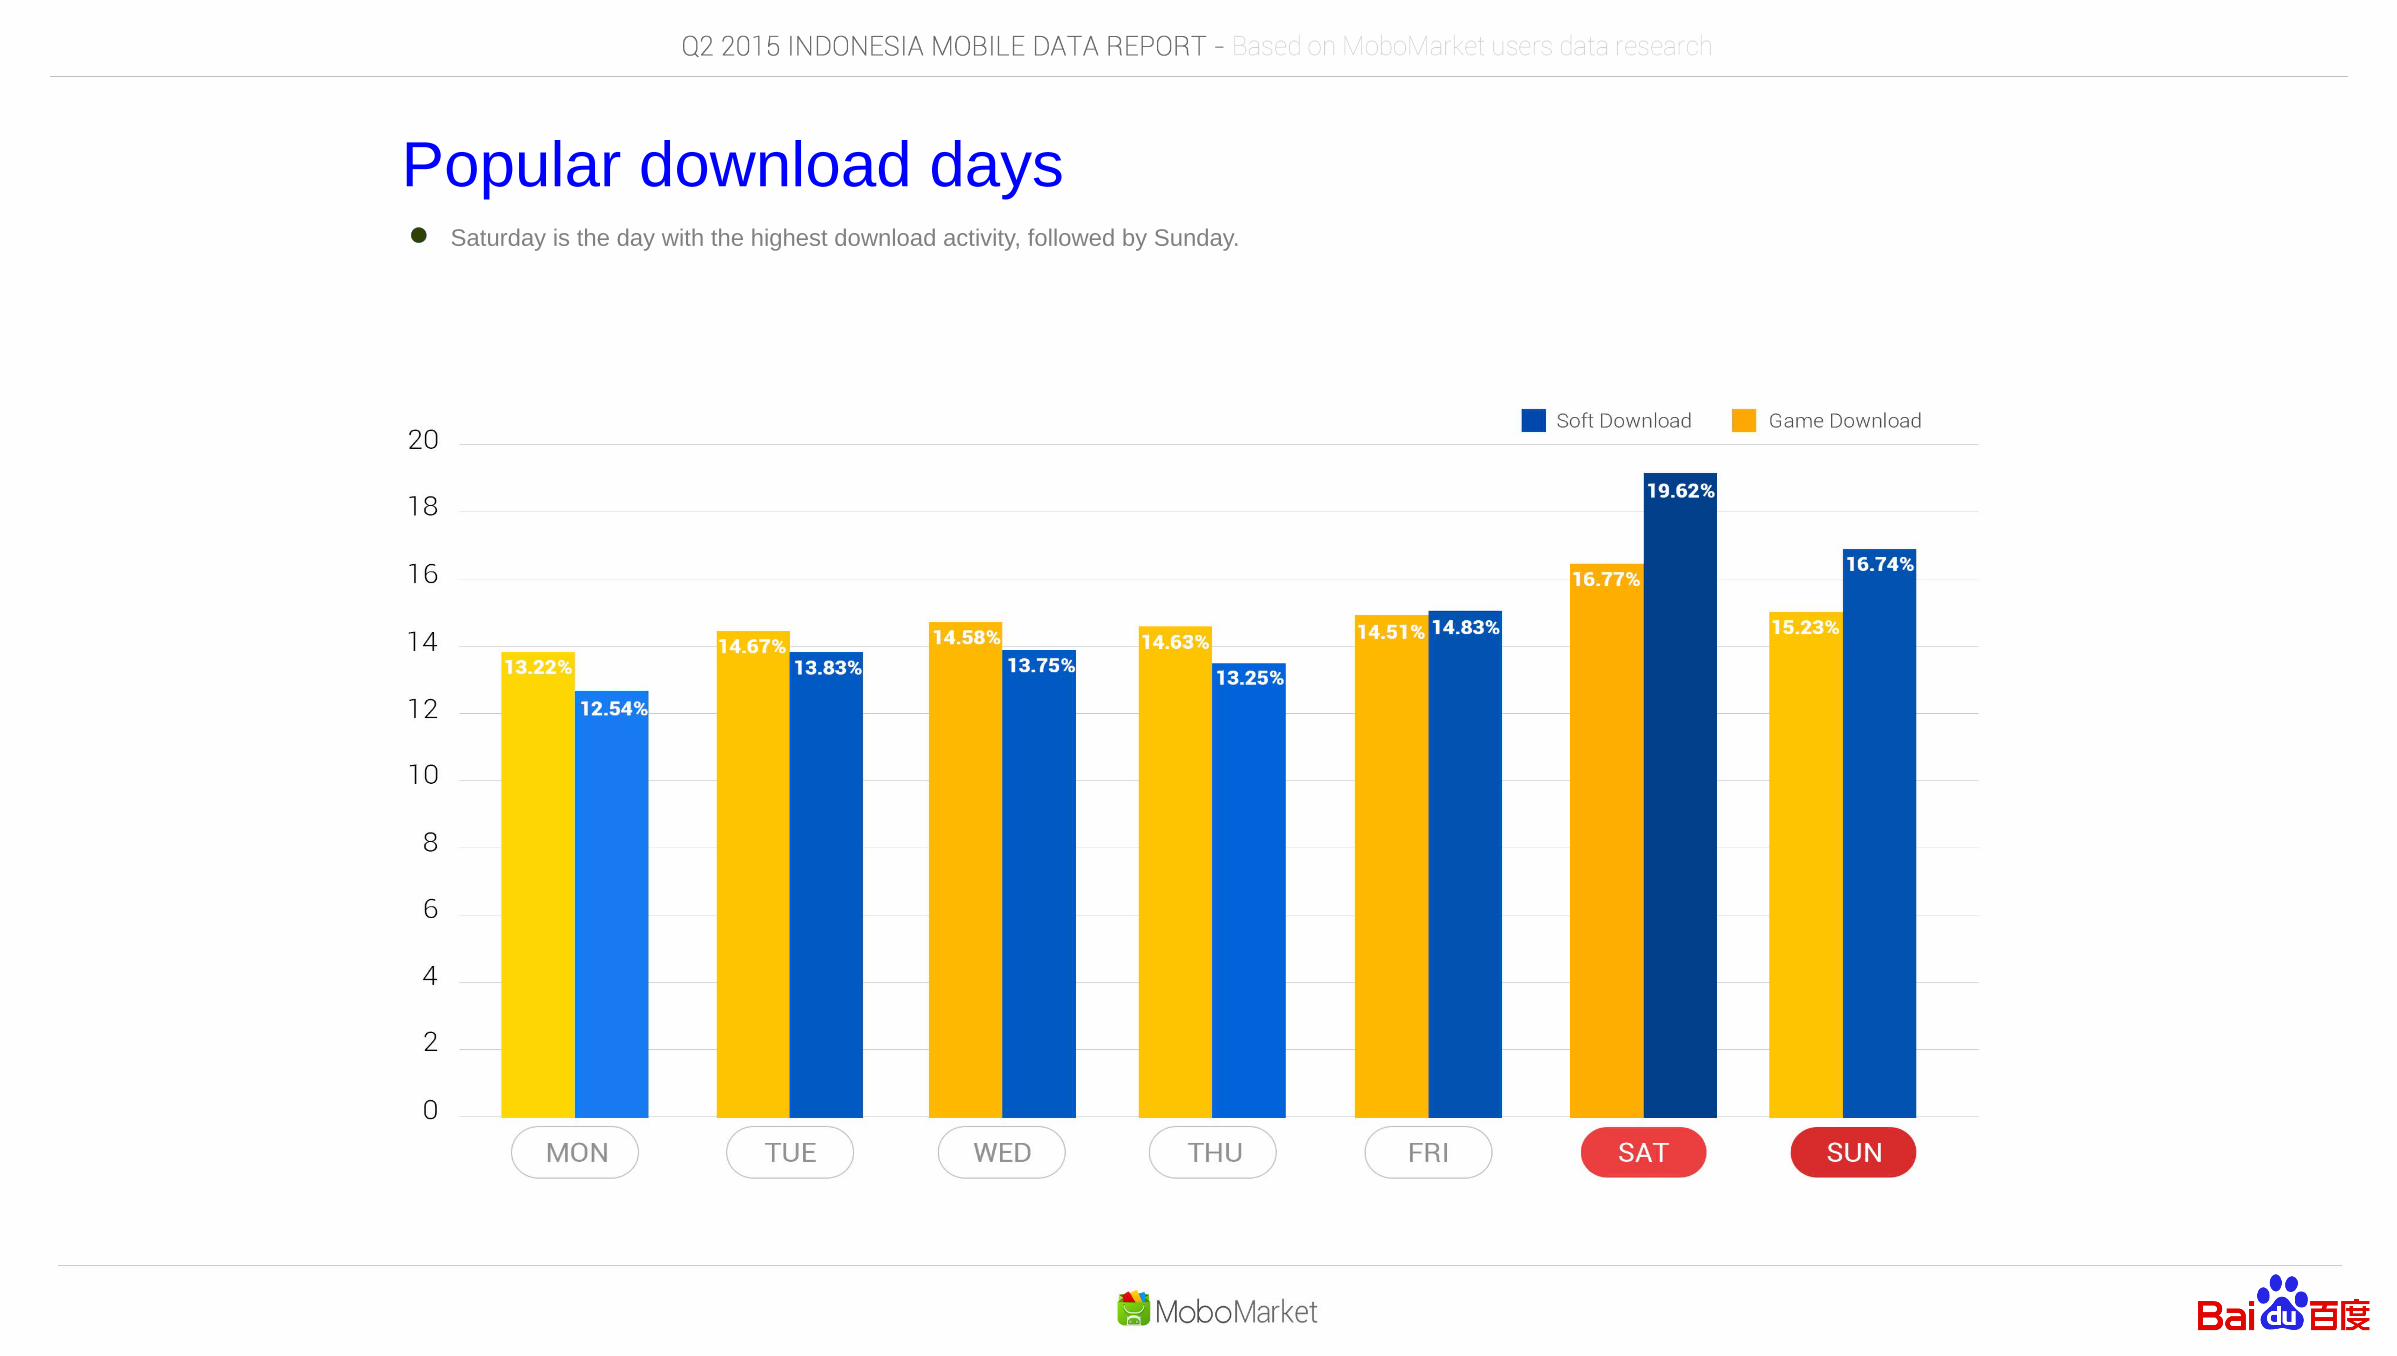
Popular download daysSaturday is the day with the highest download activity, followed by Sunday.
Download quantity
16.67% of users download apps on a daily basis.
On average, each user downloads 0.65 apps per day.
There is a large discrepancy in the number of apps individual users download per day. 39.84% of users download 1 app per day, while 22.73% of users download 5 or more apps per day.
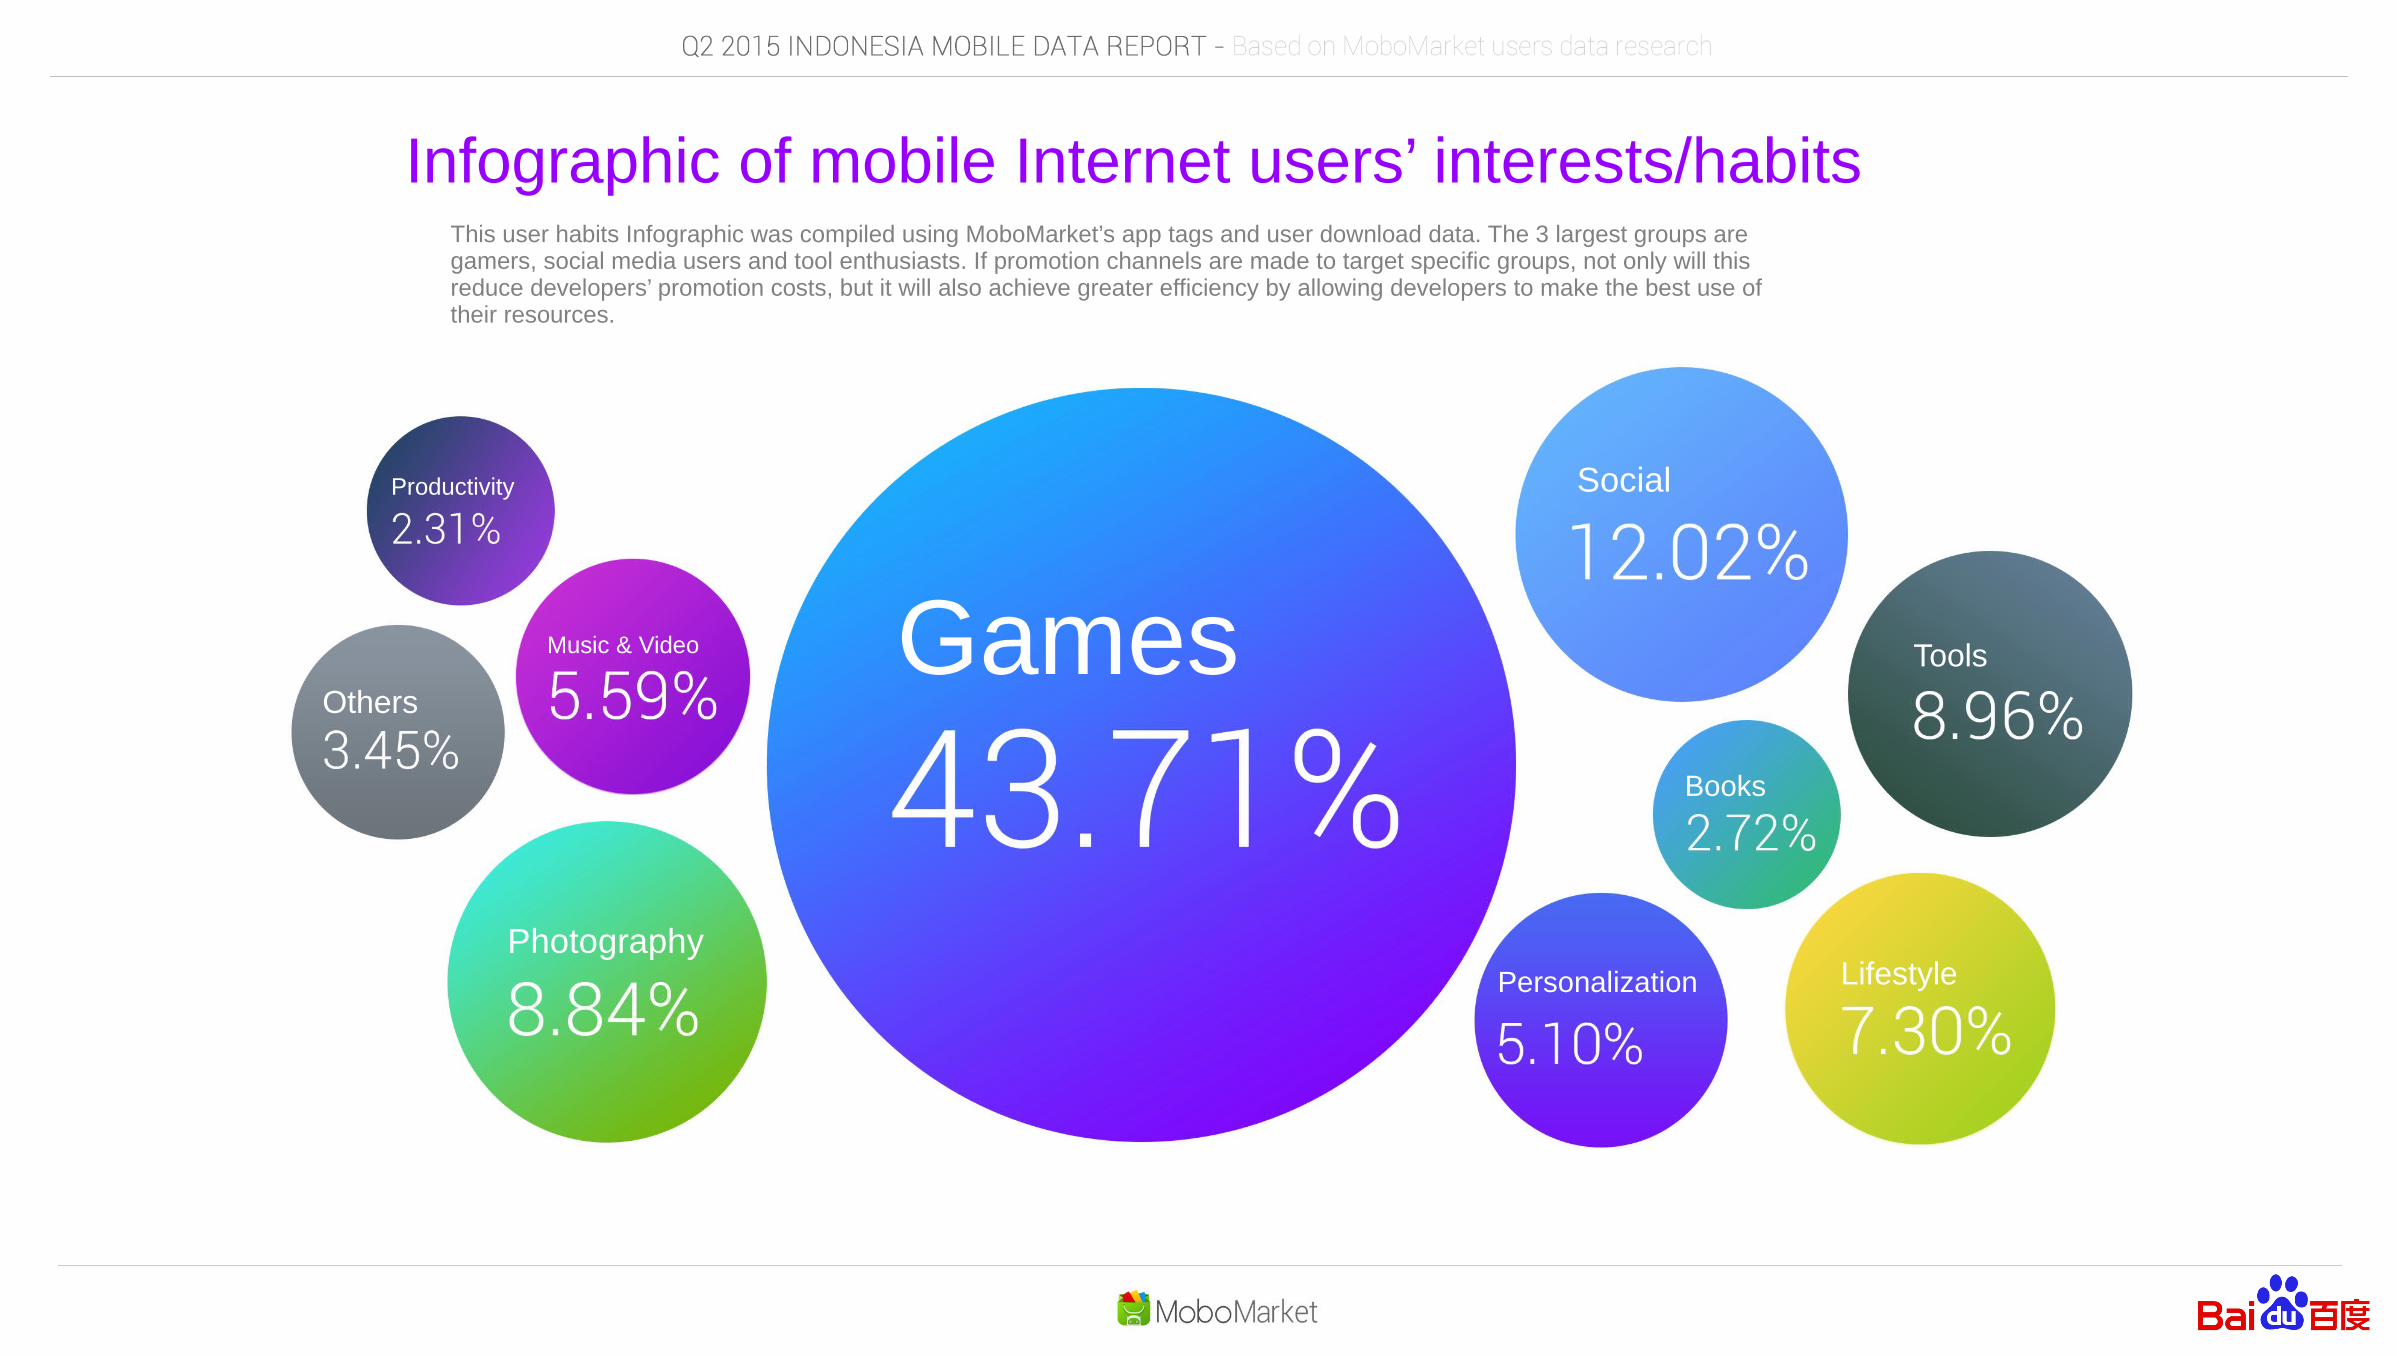
Infographic of mobile Internet users’ interests/habits This user habits Infographic was compiled using MoboMarket’s app tags and user download data. The 3 largest groups are gamers, social media users and tool enthusiasts. If promotion channels are made to target specific groups, not only will this reduce developers’ promotion costs, but it will also achieve greater efficiency by allowing developers to make the best use of their resources.
Games
Social
Tools
PhotographyLifestyle
Music & Video
Personalization
Books
Productivity
Others
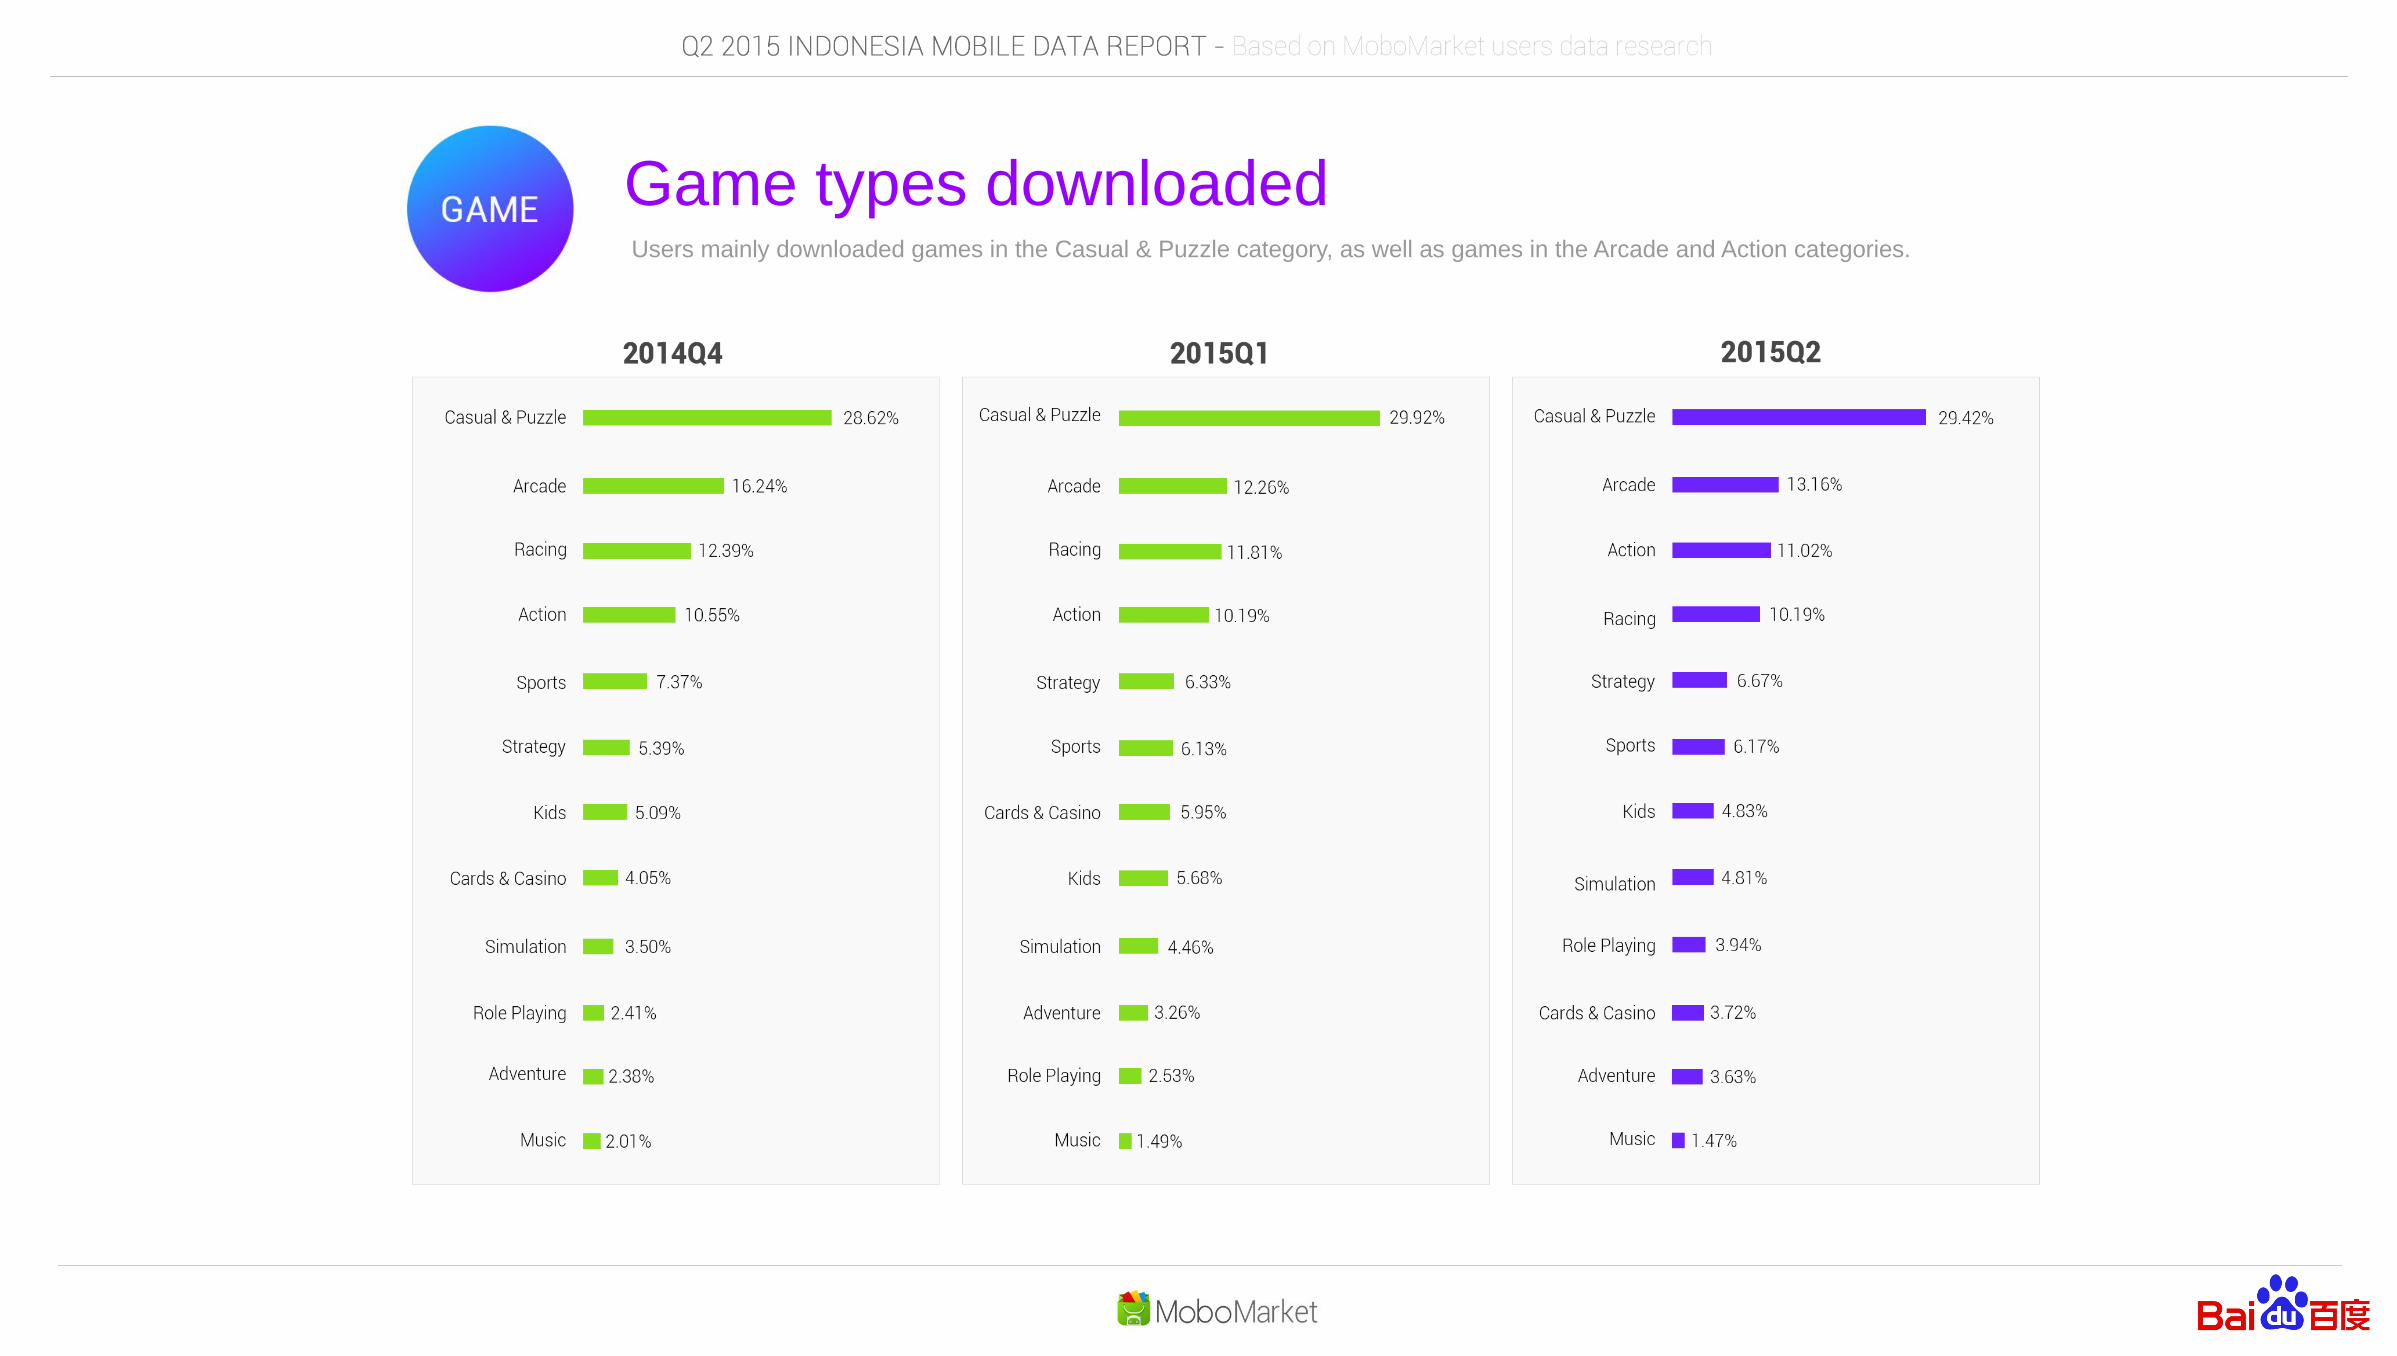
Game types downloadedUsers mainly downloaded games in the Casual & Puzzle category, as well as games in the Arcade and Action categories.
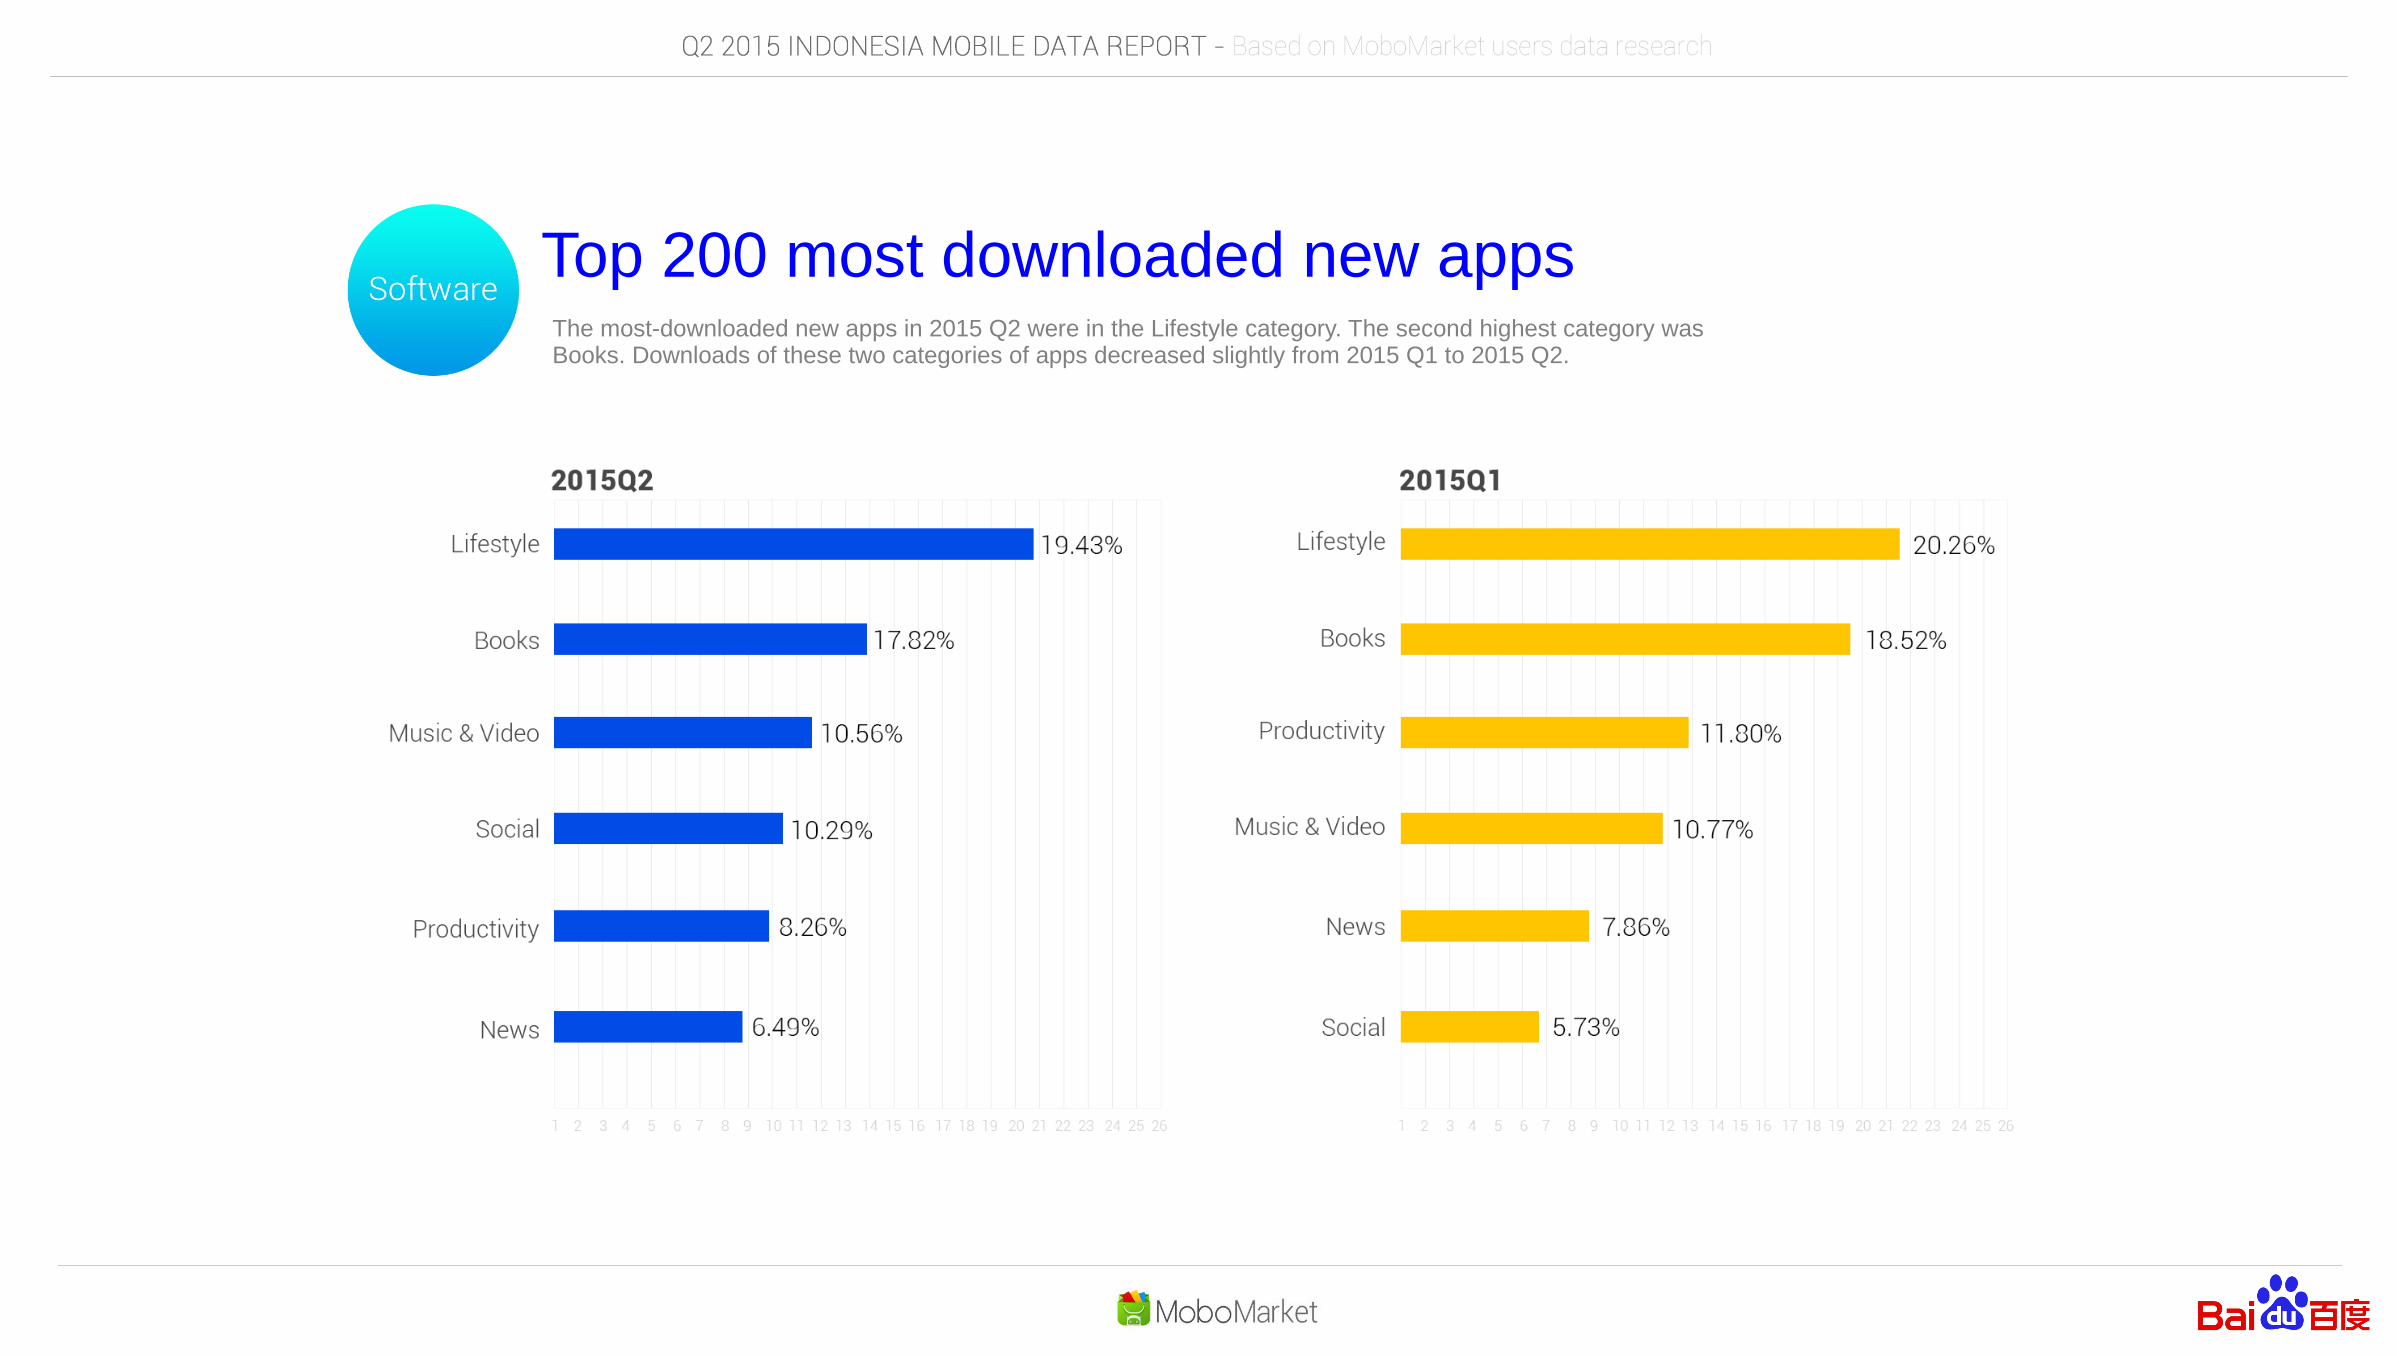
Top 200 most downloaded new appsThe most-downloaded new apps in 2015 Q2 were in the Lifestyle category. The second highest category was Books. Downloads of these two categories of apps decreased slightly from 2015 Q1 to 2015 Q2.
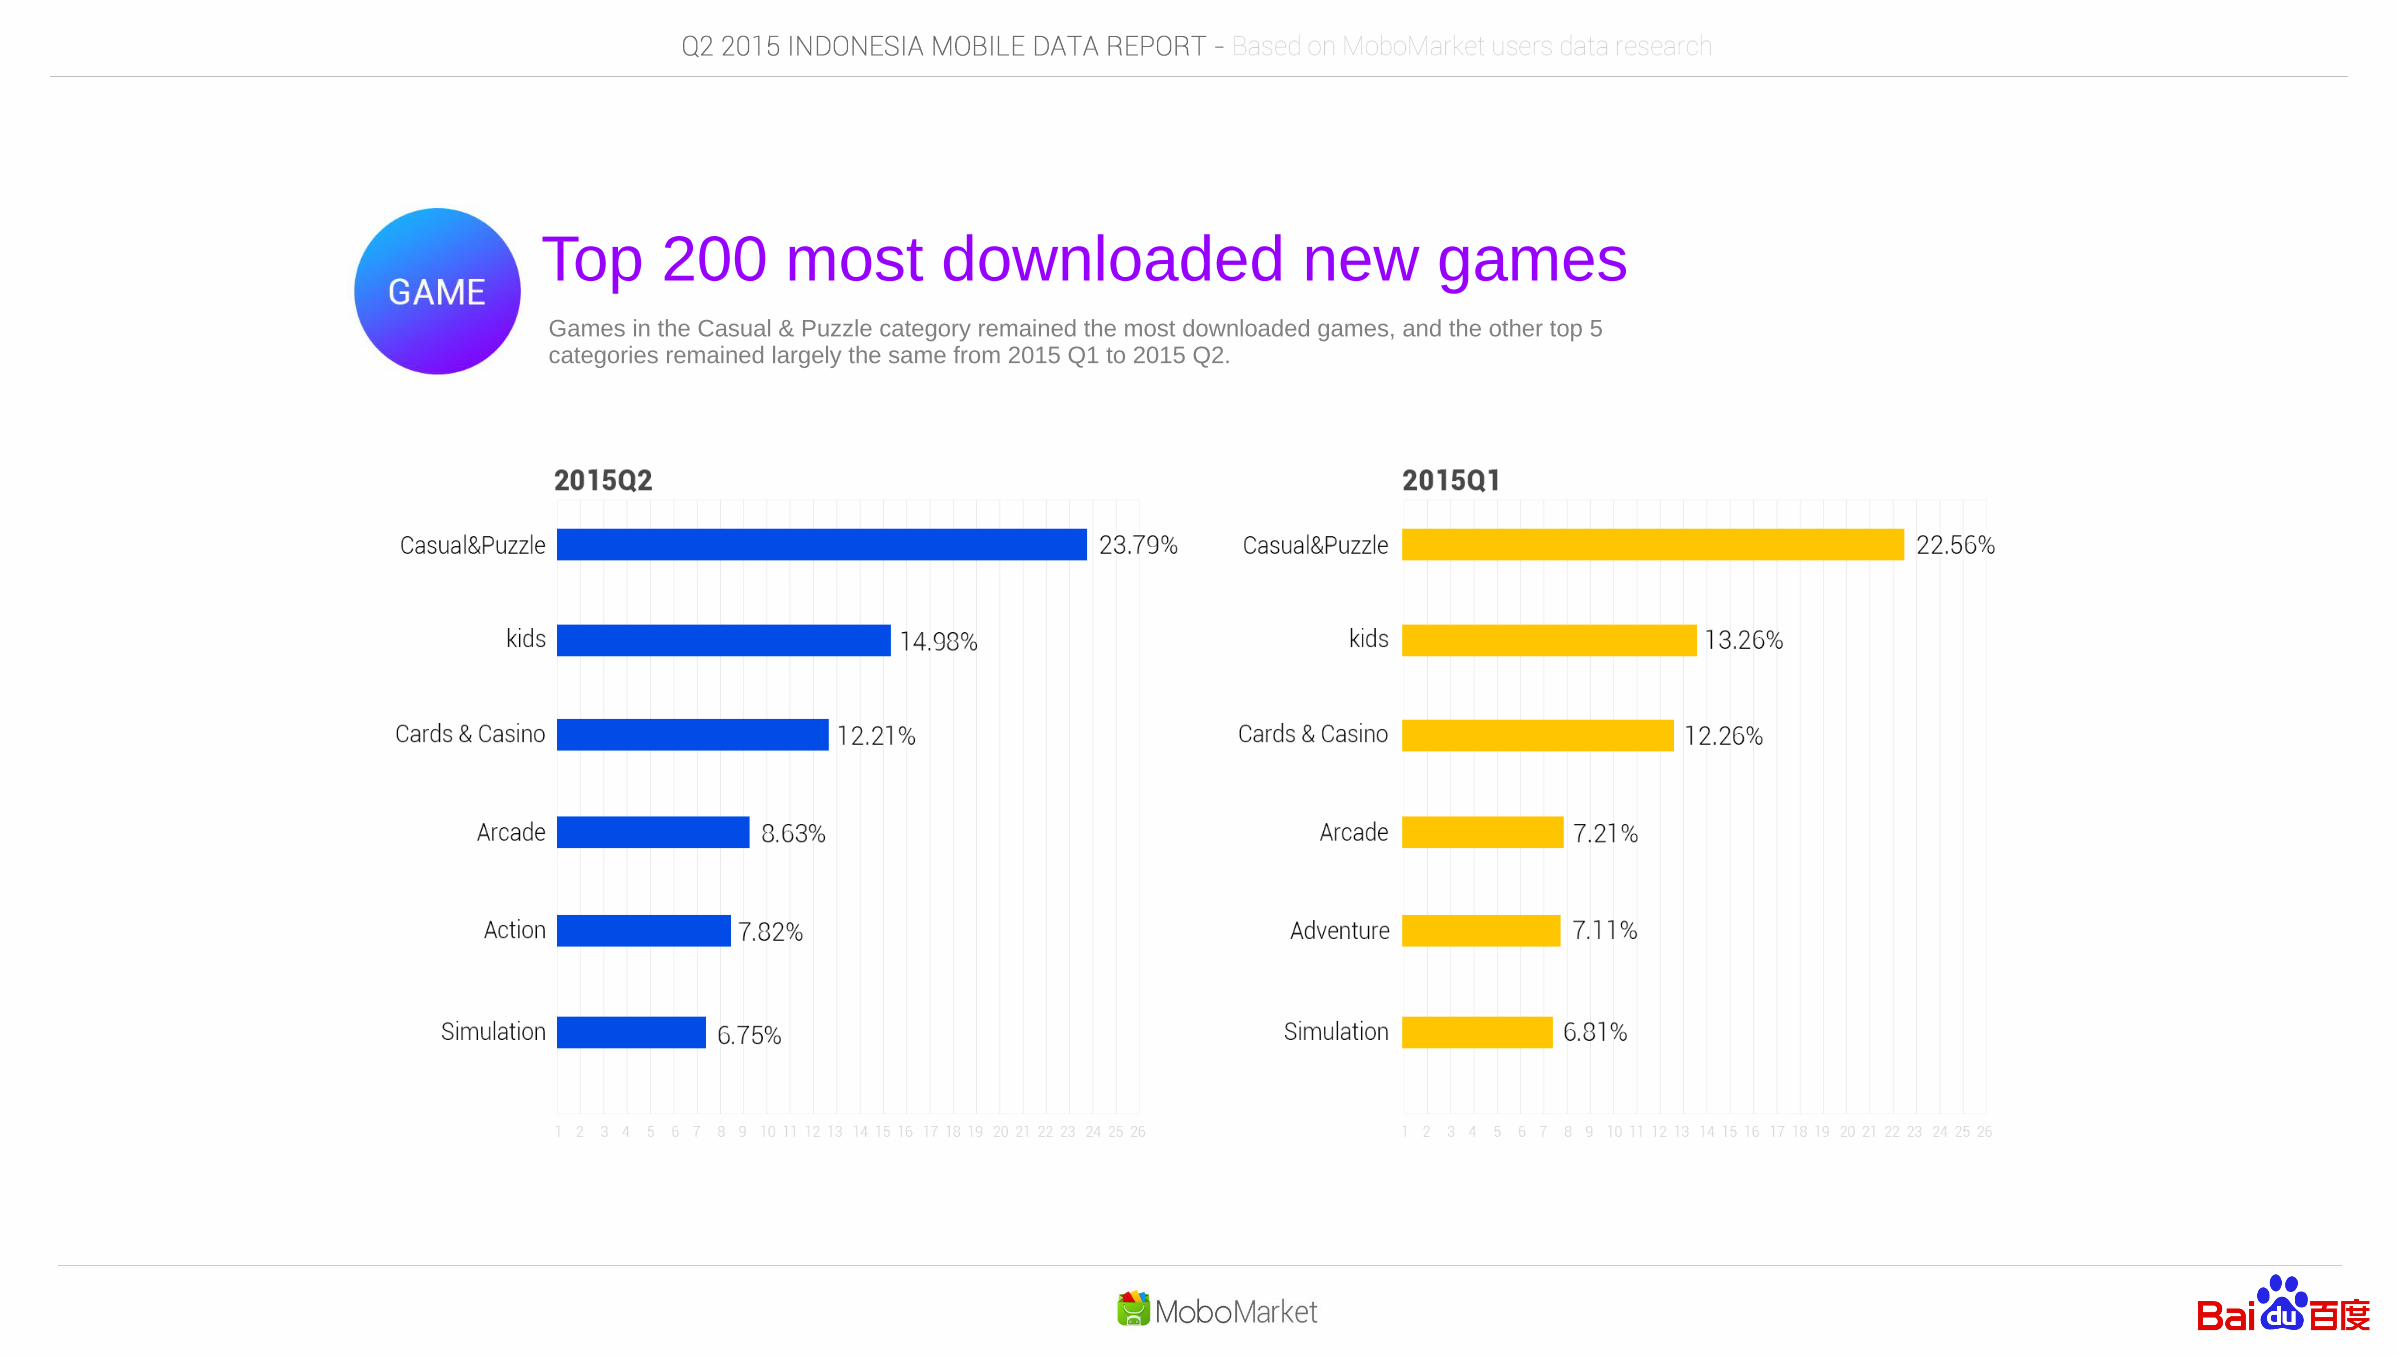
Top 200 most downloaded new gamesGames in the Casual & Puzzle category remained the most downloaded games, and the other top 5 categories remained largely the same from 2015 Q1 to 2015 Q2.
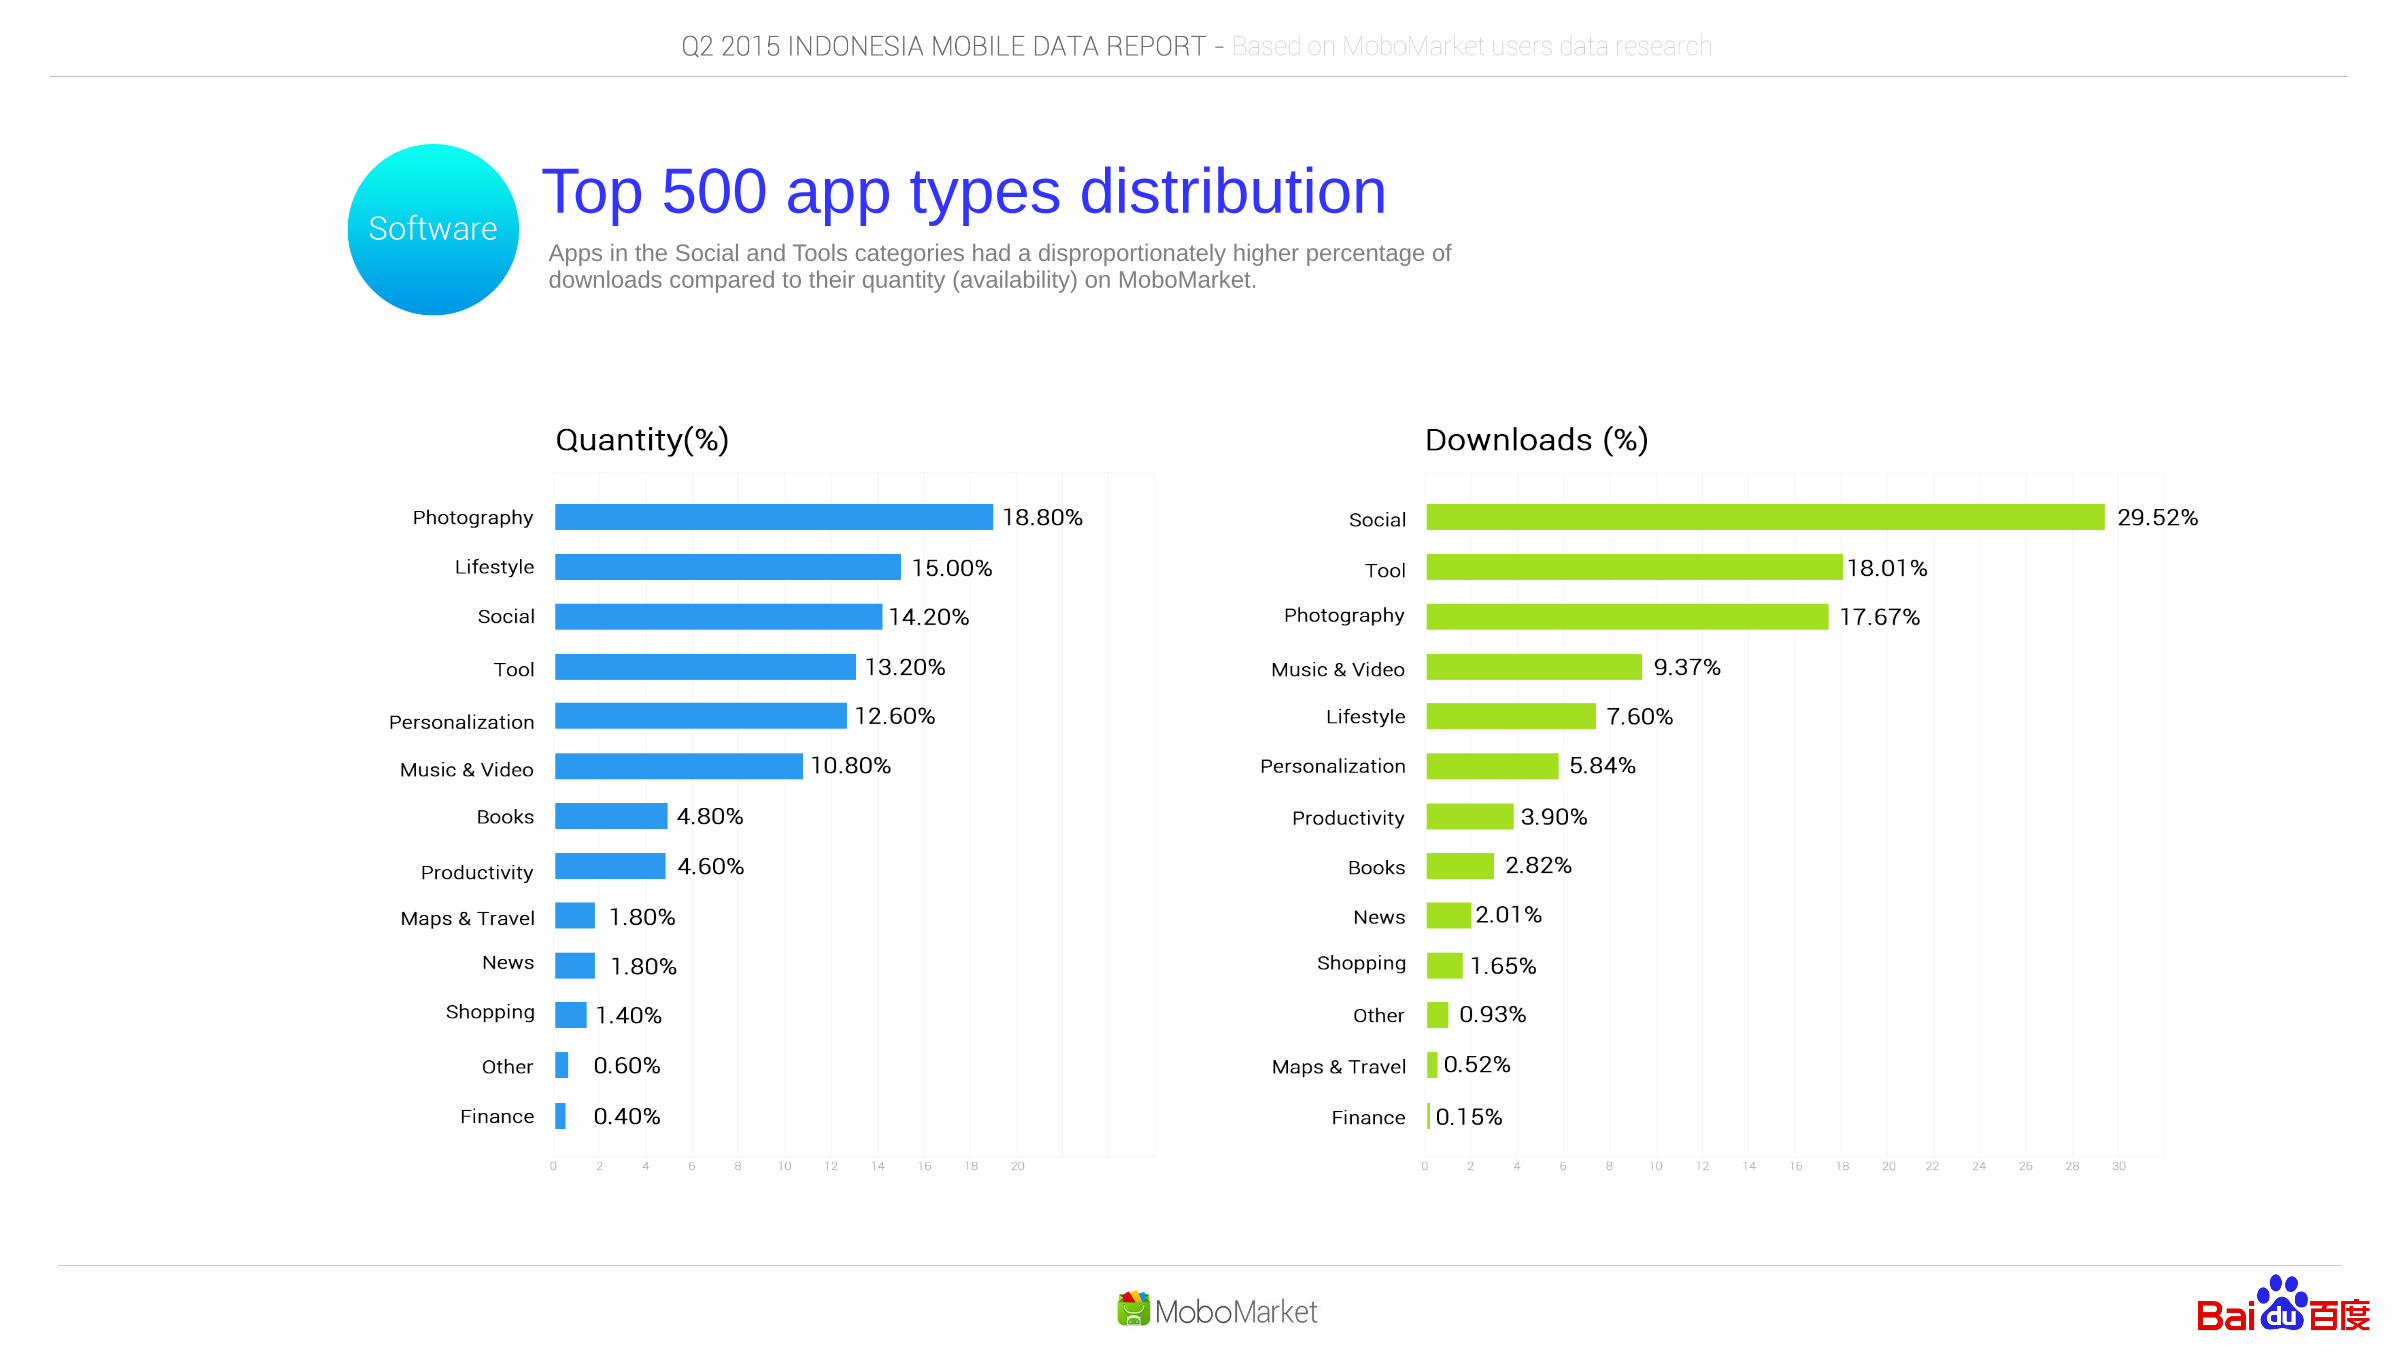
Top 500 app types distributionApps in the Social and Tools categories had a disproportionately higher percentage of downloads compared to their quantity (availability) on MoboMarket.
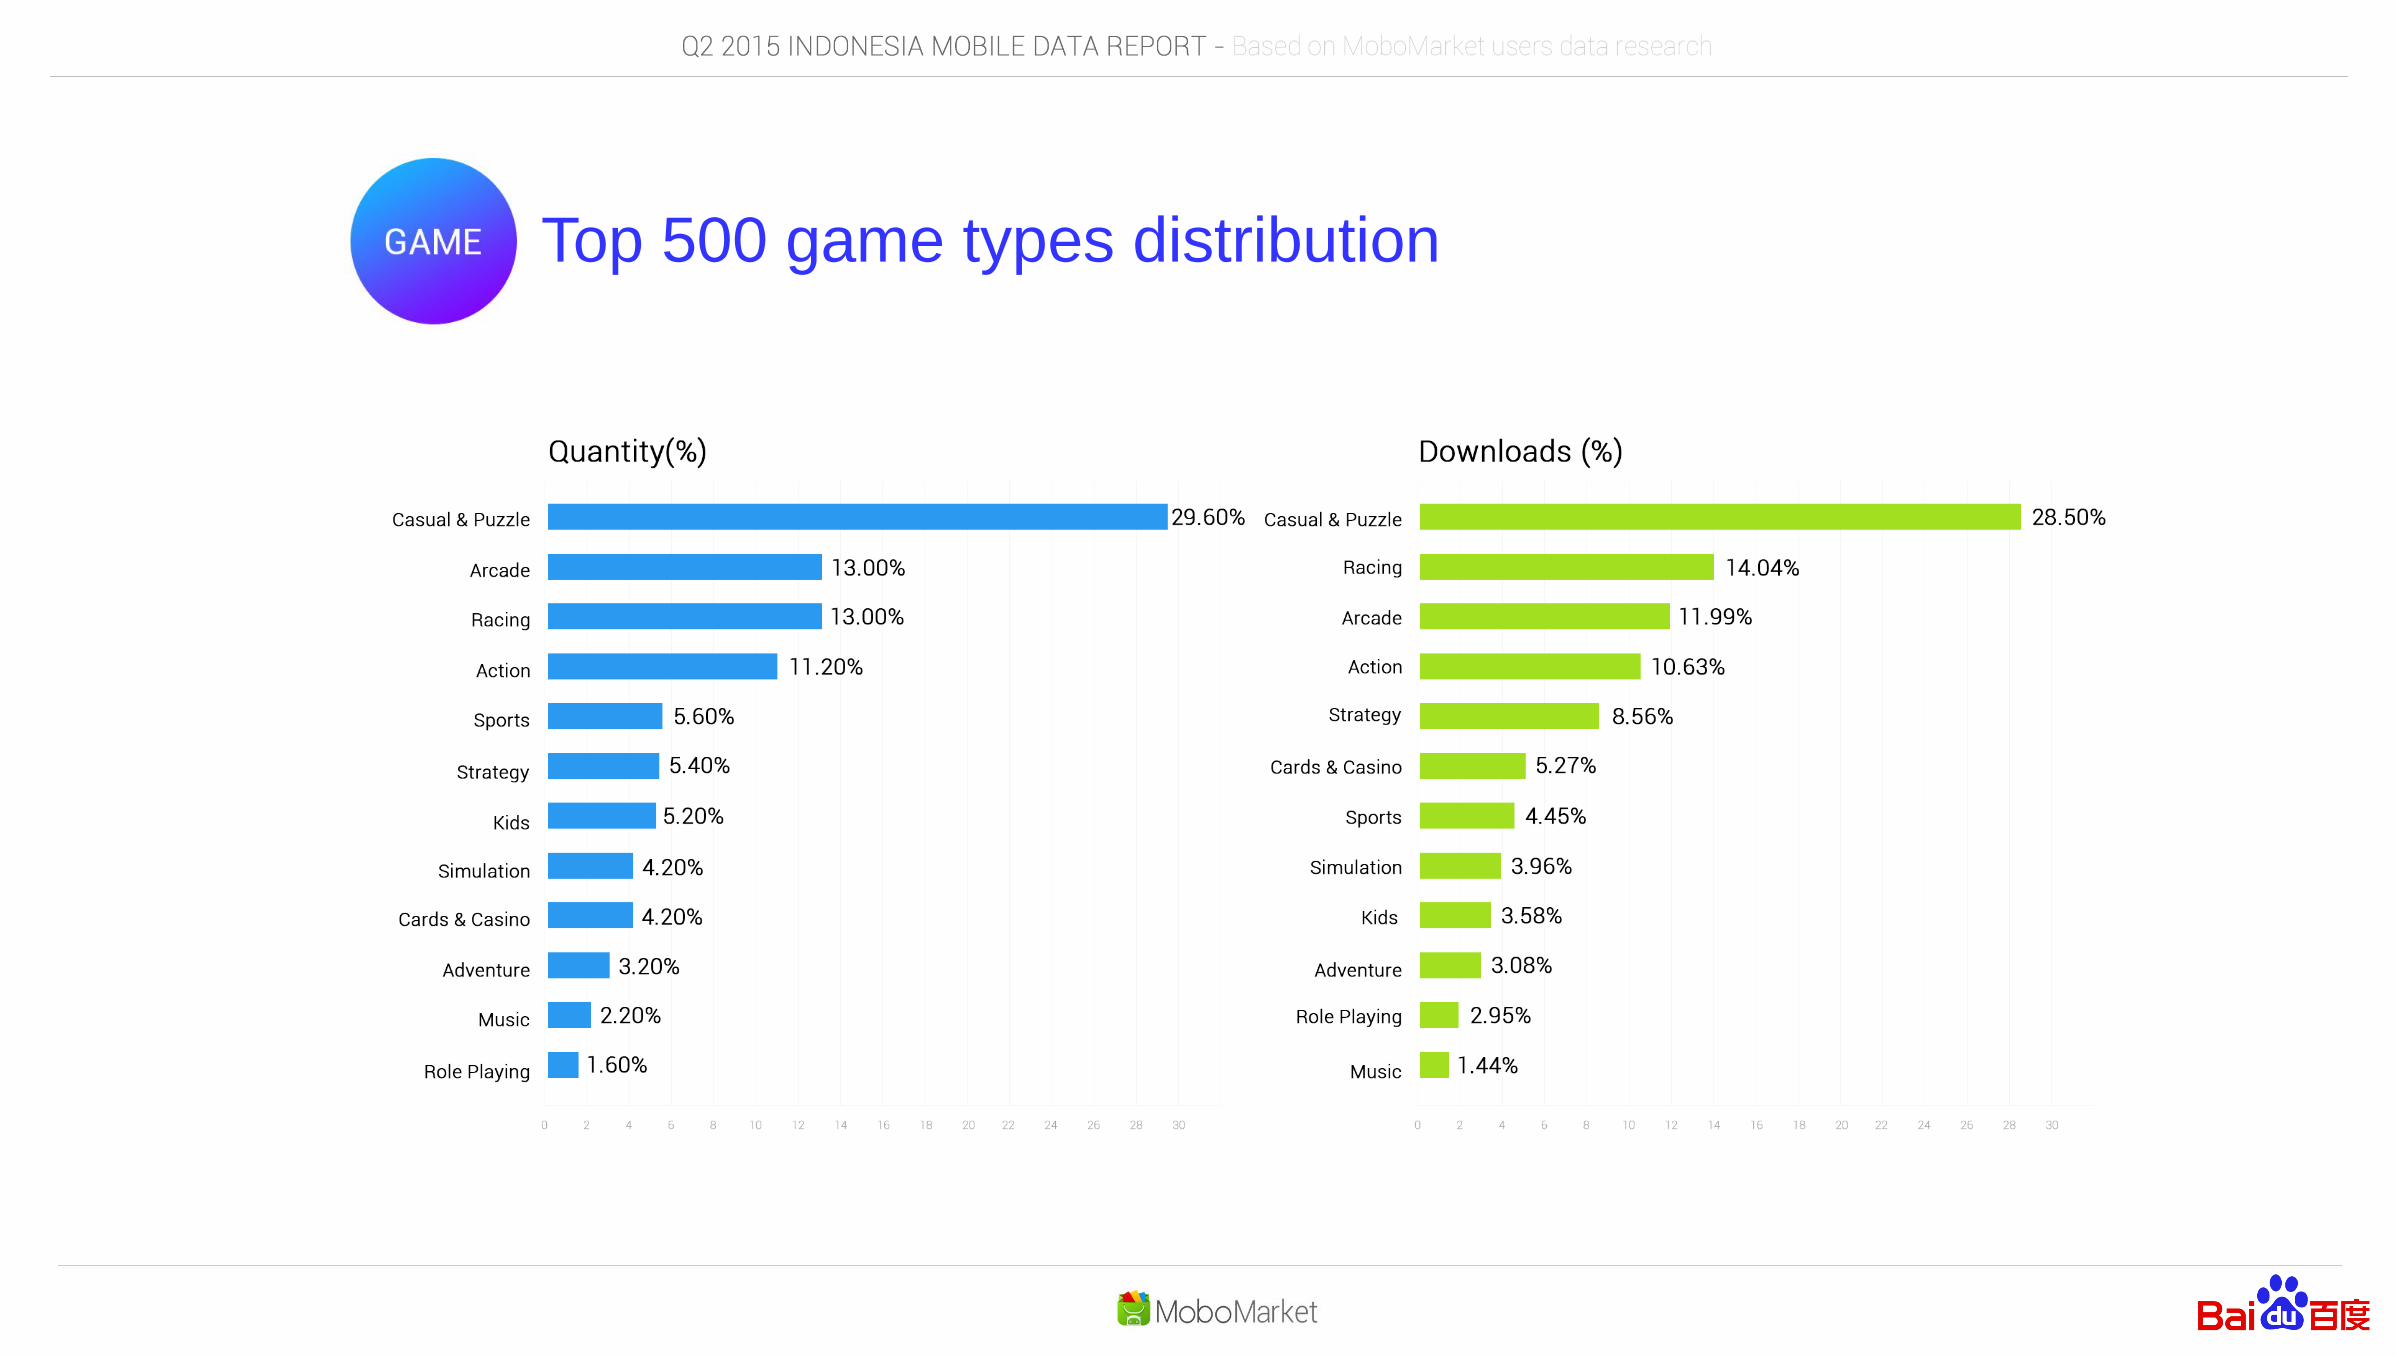
Top 500 game types distribution
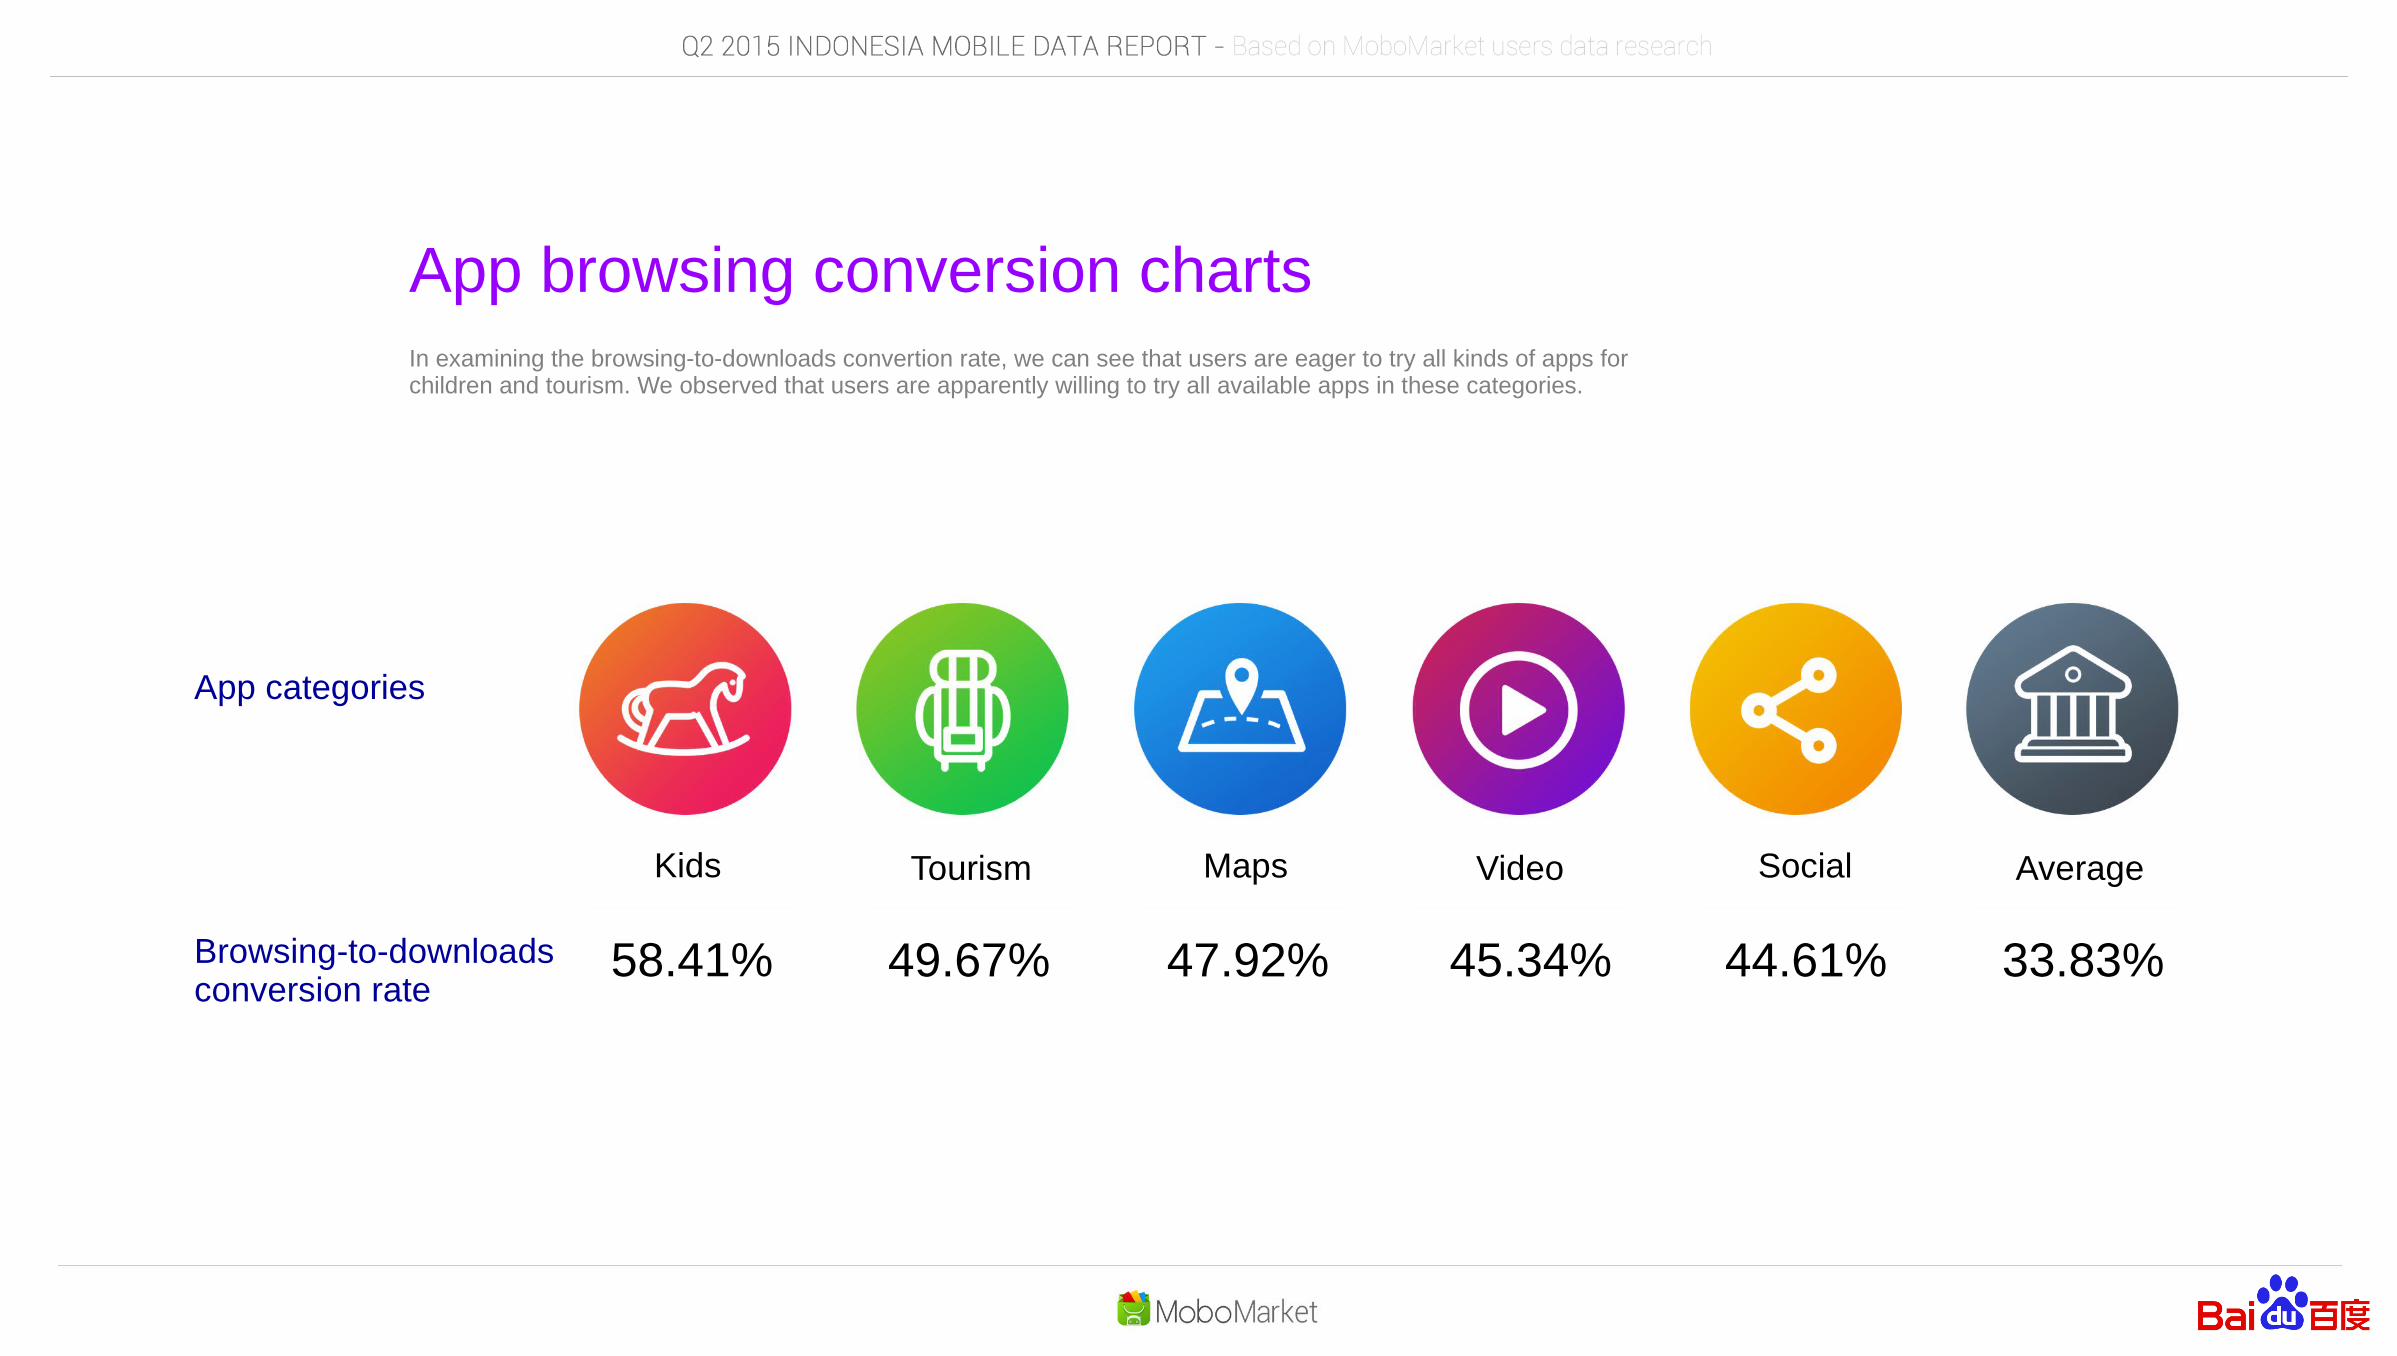
App browsing conversion chartsIn examining the browsing-to-downloads convertion rate, we can see that users are eager to try all kinds of apps for children and tourism. We observed that users are apparently willing to try all available apps in these categories.
Kids Tourism Maps Video Social Average
58.41% 49.67% 47.92% 45.34% 44.61% 33.83%
App categories
Browsing-to-downloads conversion rate

Top 10 installed social appsApps in the Social Media category remained relatively stable in terms of popularity, although there were some changes. Tema Transparan BBM is no longer in the list of top communication apps used by MoboMarket users. In addition, WeChat made an appearance for the first time in our user base.
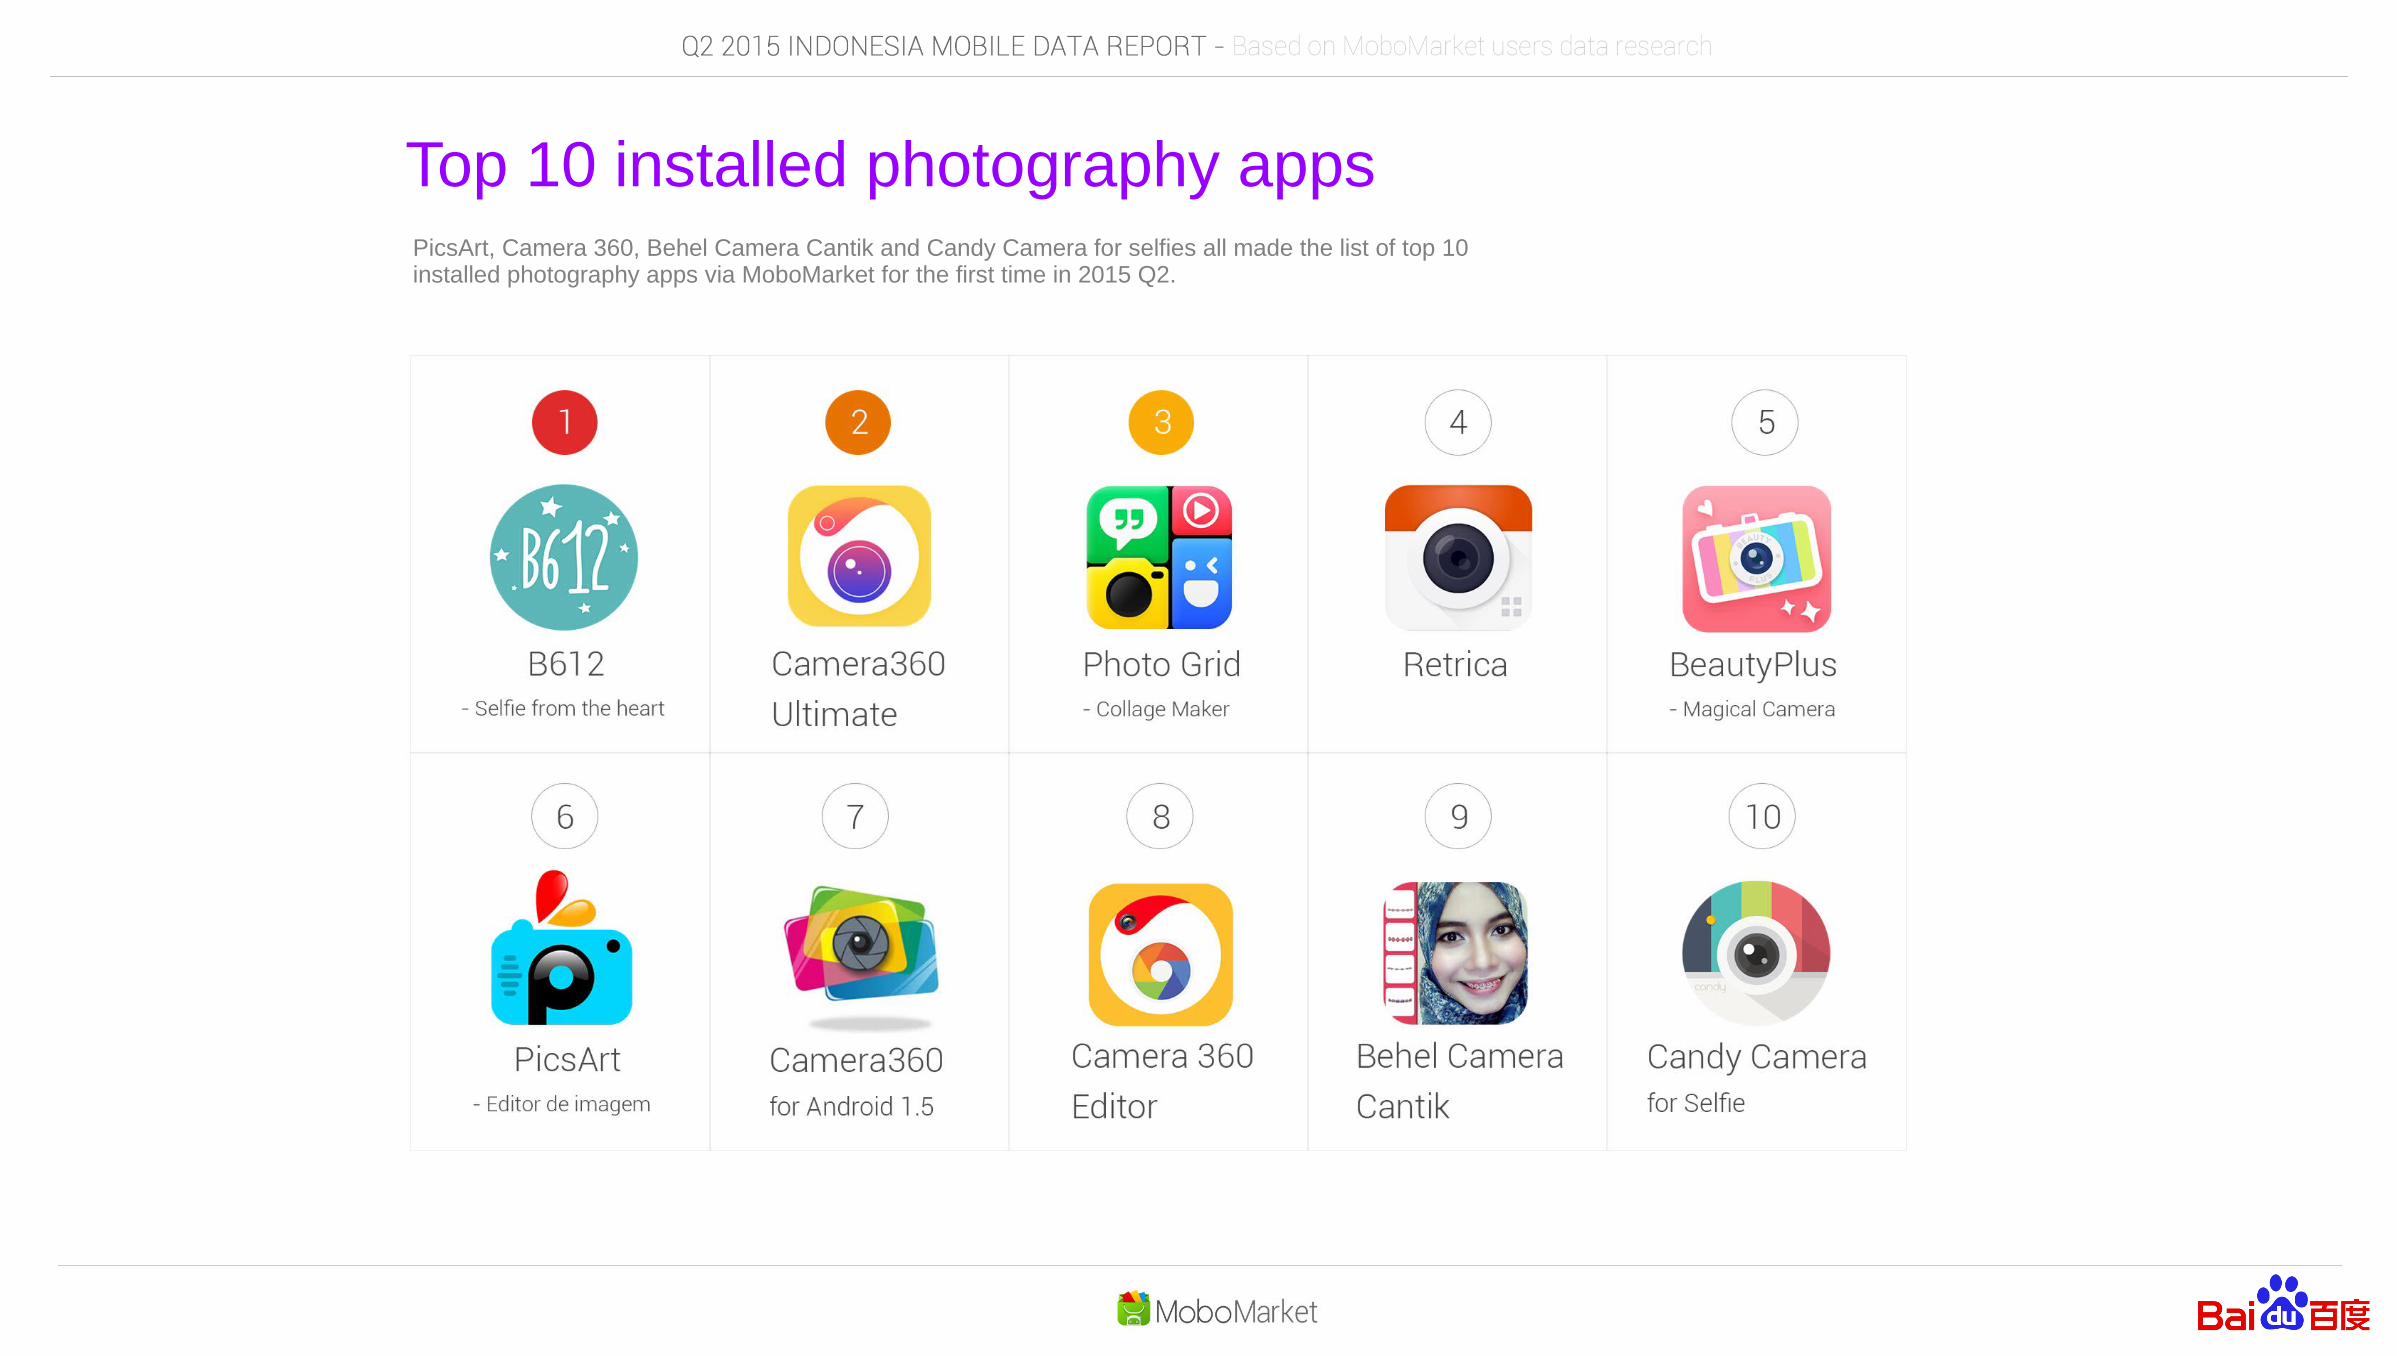
Top 10 installed photography appsPicsArt, Camera 360, Behel Camera Cantik and Candy Camera for selfies all made the list of top 10 installed photography apps via MoboMarket for the first time in 2015 Q2.
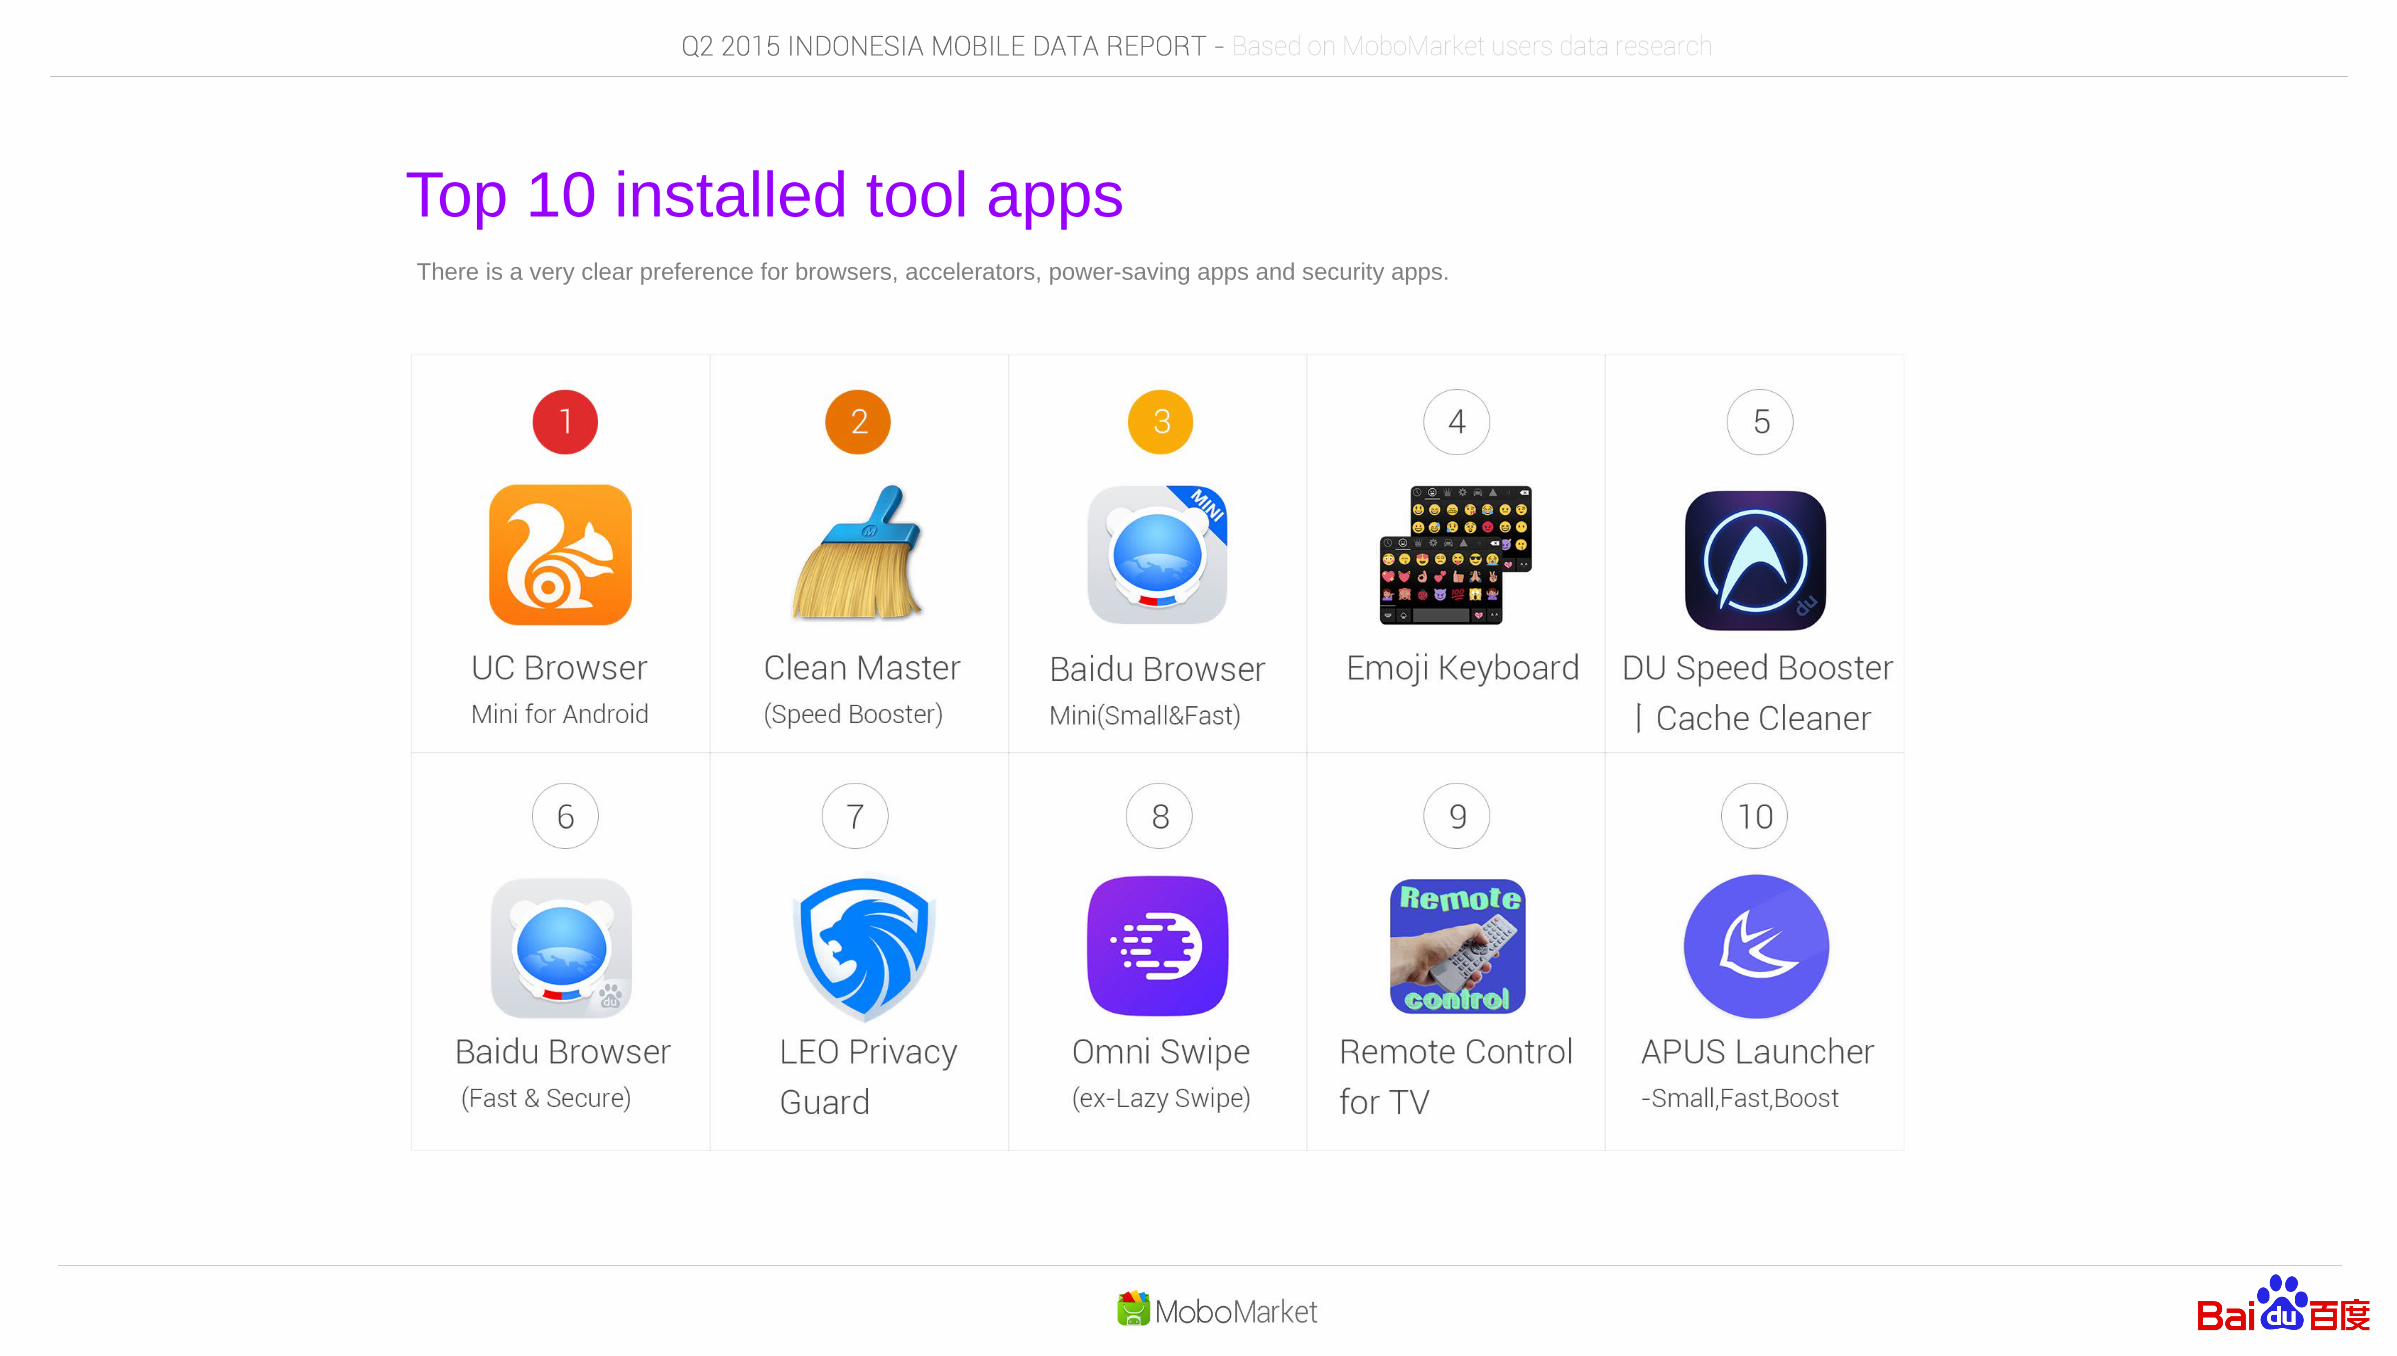
Top 10 installed tool appsThere is a very clear preference for browsers, accelerators, power-saving apps and security apps.
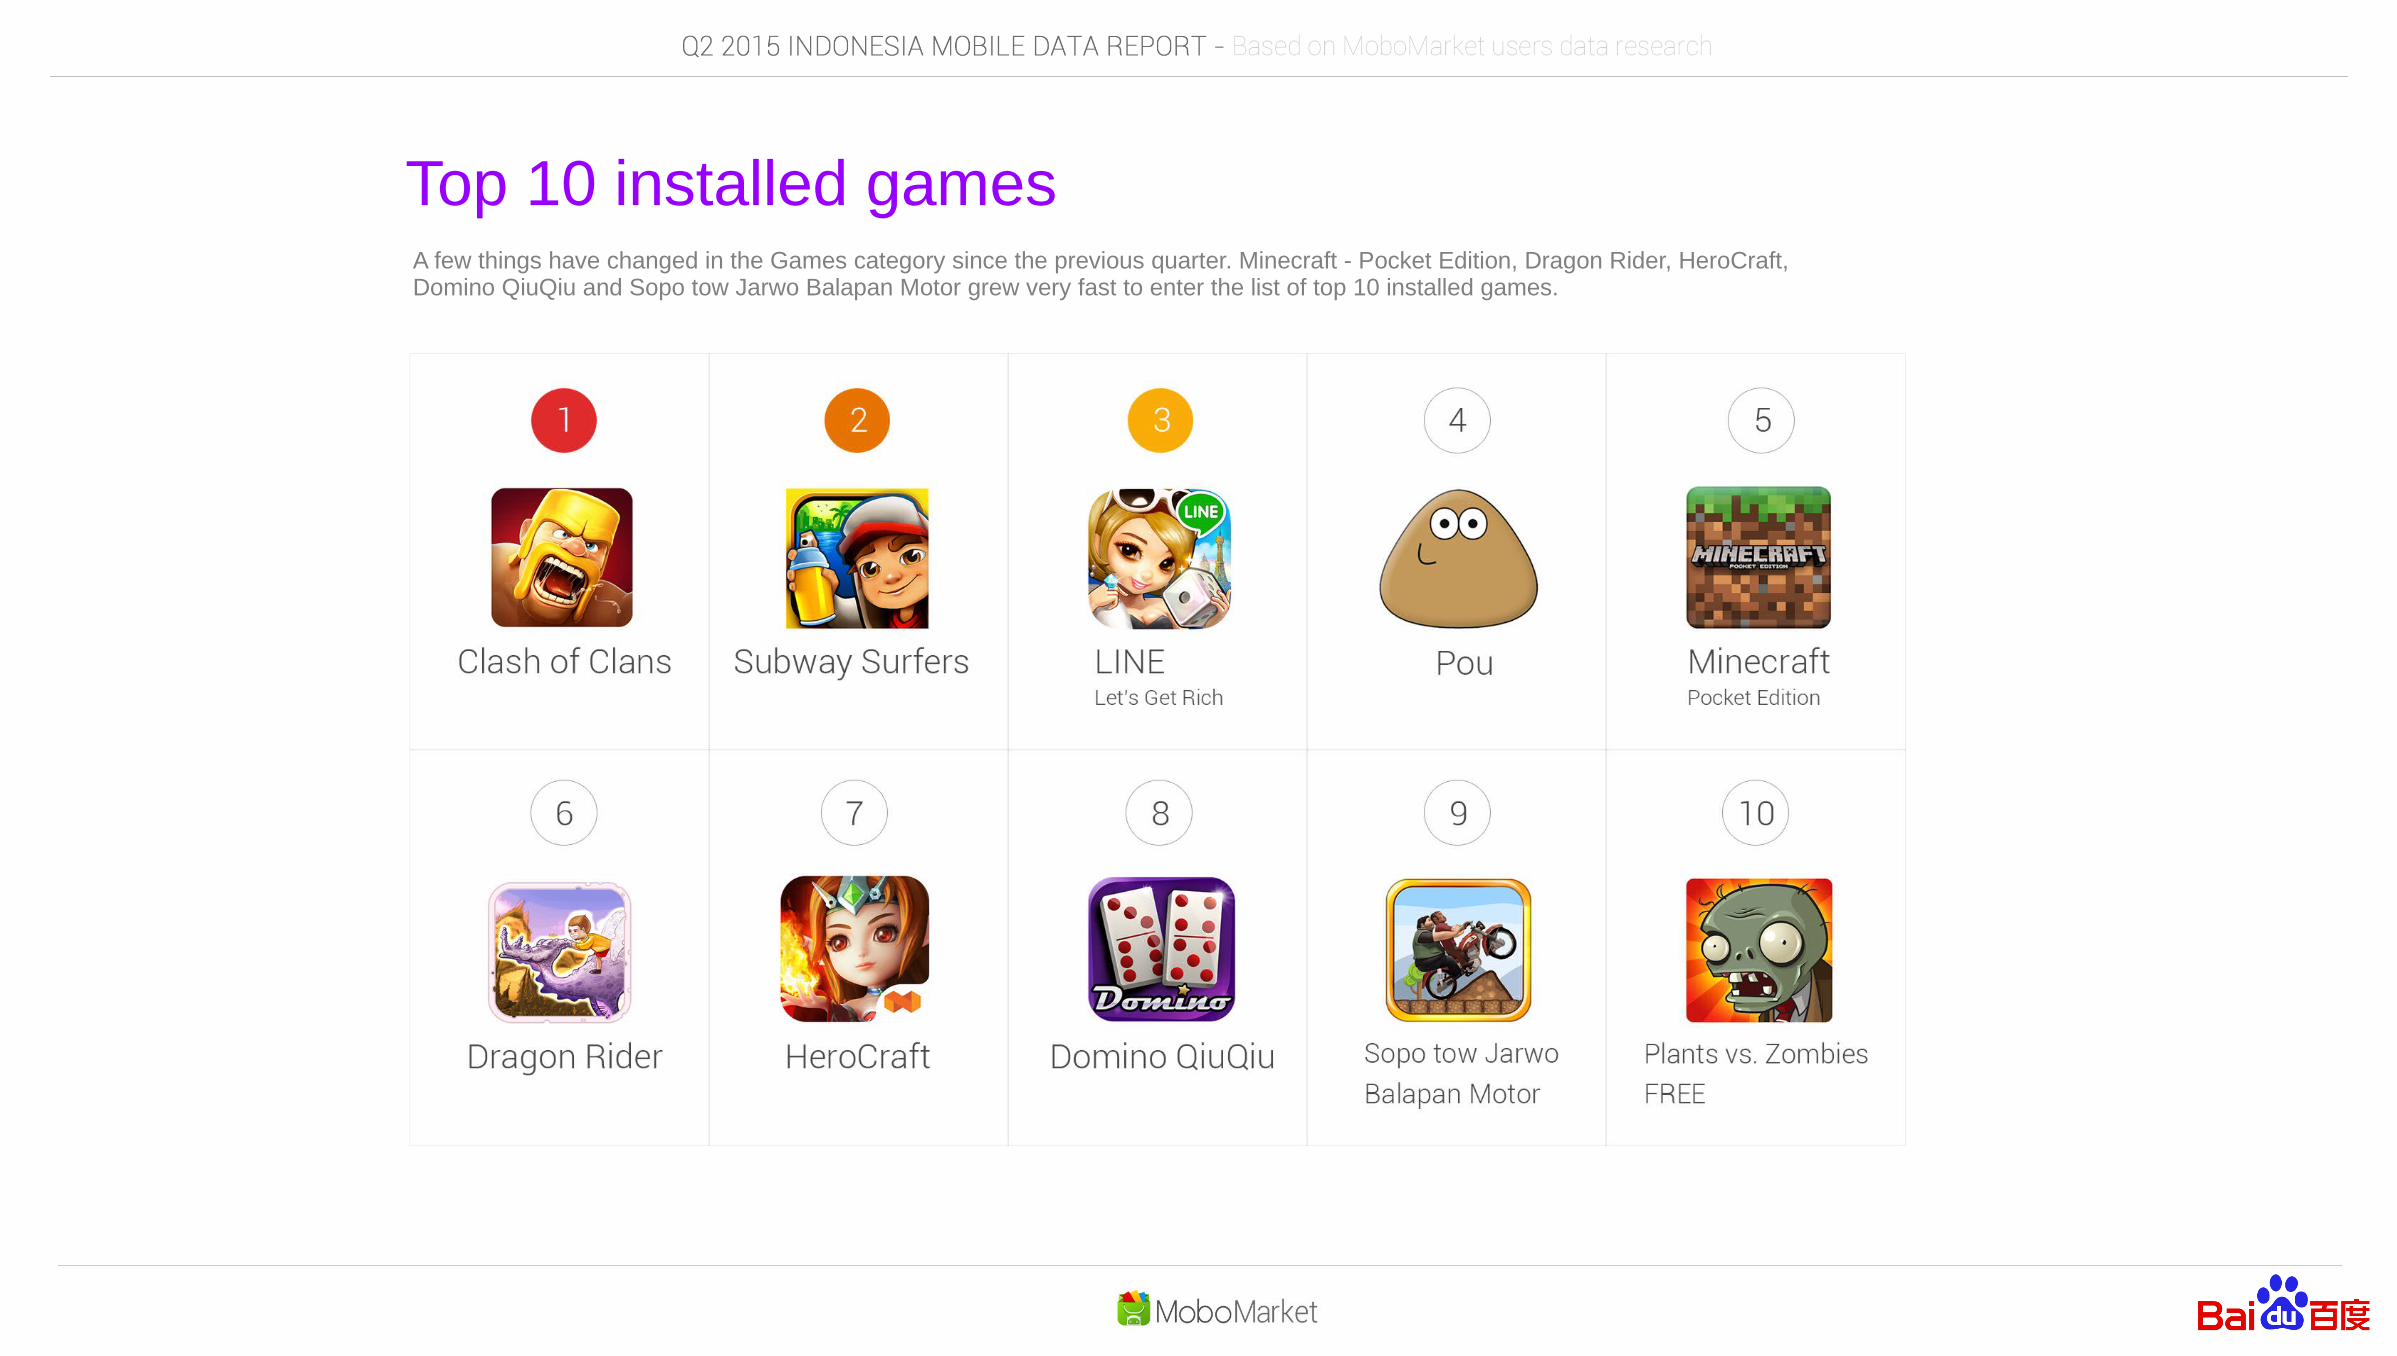
Top 10 installed gamesA few things have changed in the Games category since the previous quarter. Minecraft - Pocket Edition, Dragon Rider, HeroCraft, Domino QiuQiu and Sopo tow Jarwo Balapan Motor grew very fast to enter the list of top 10 installed games.
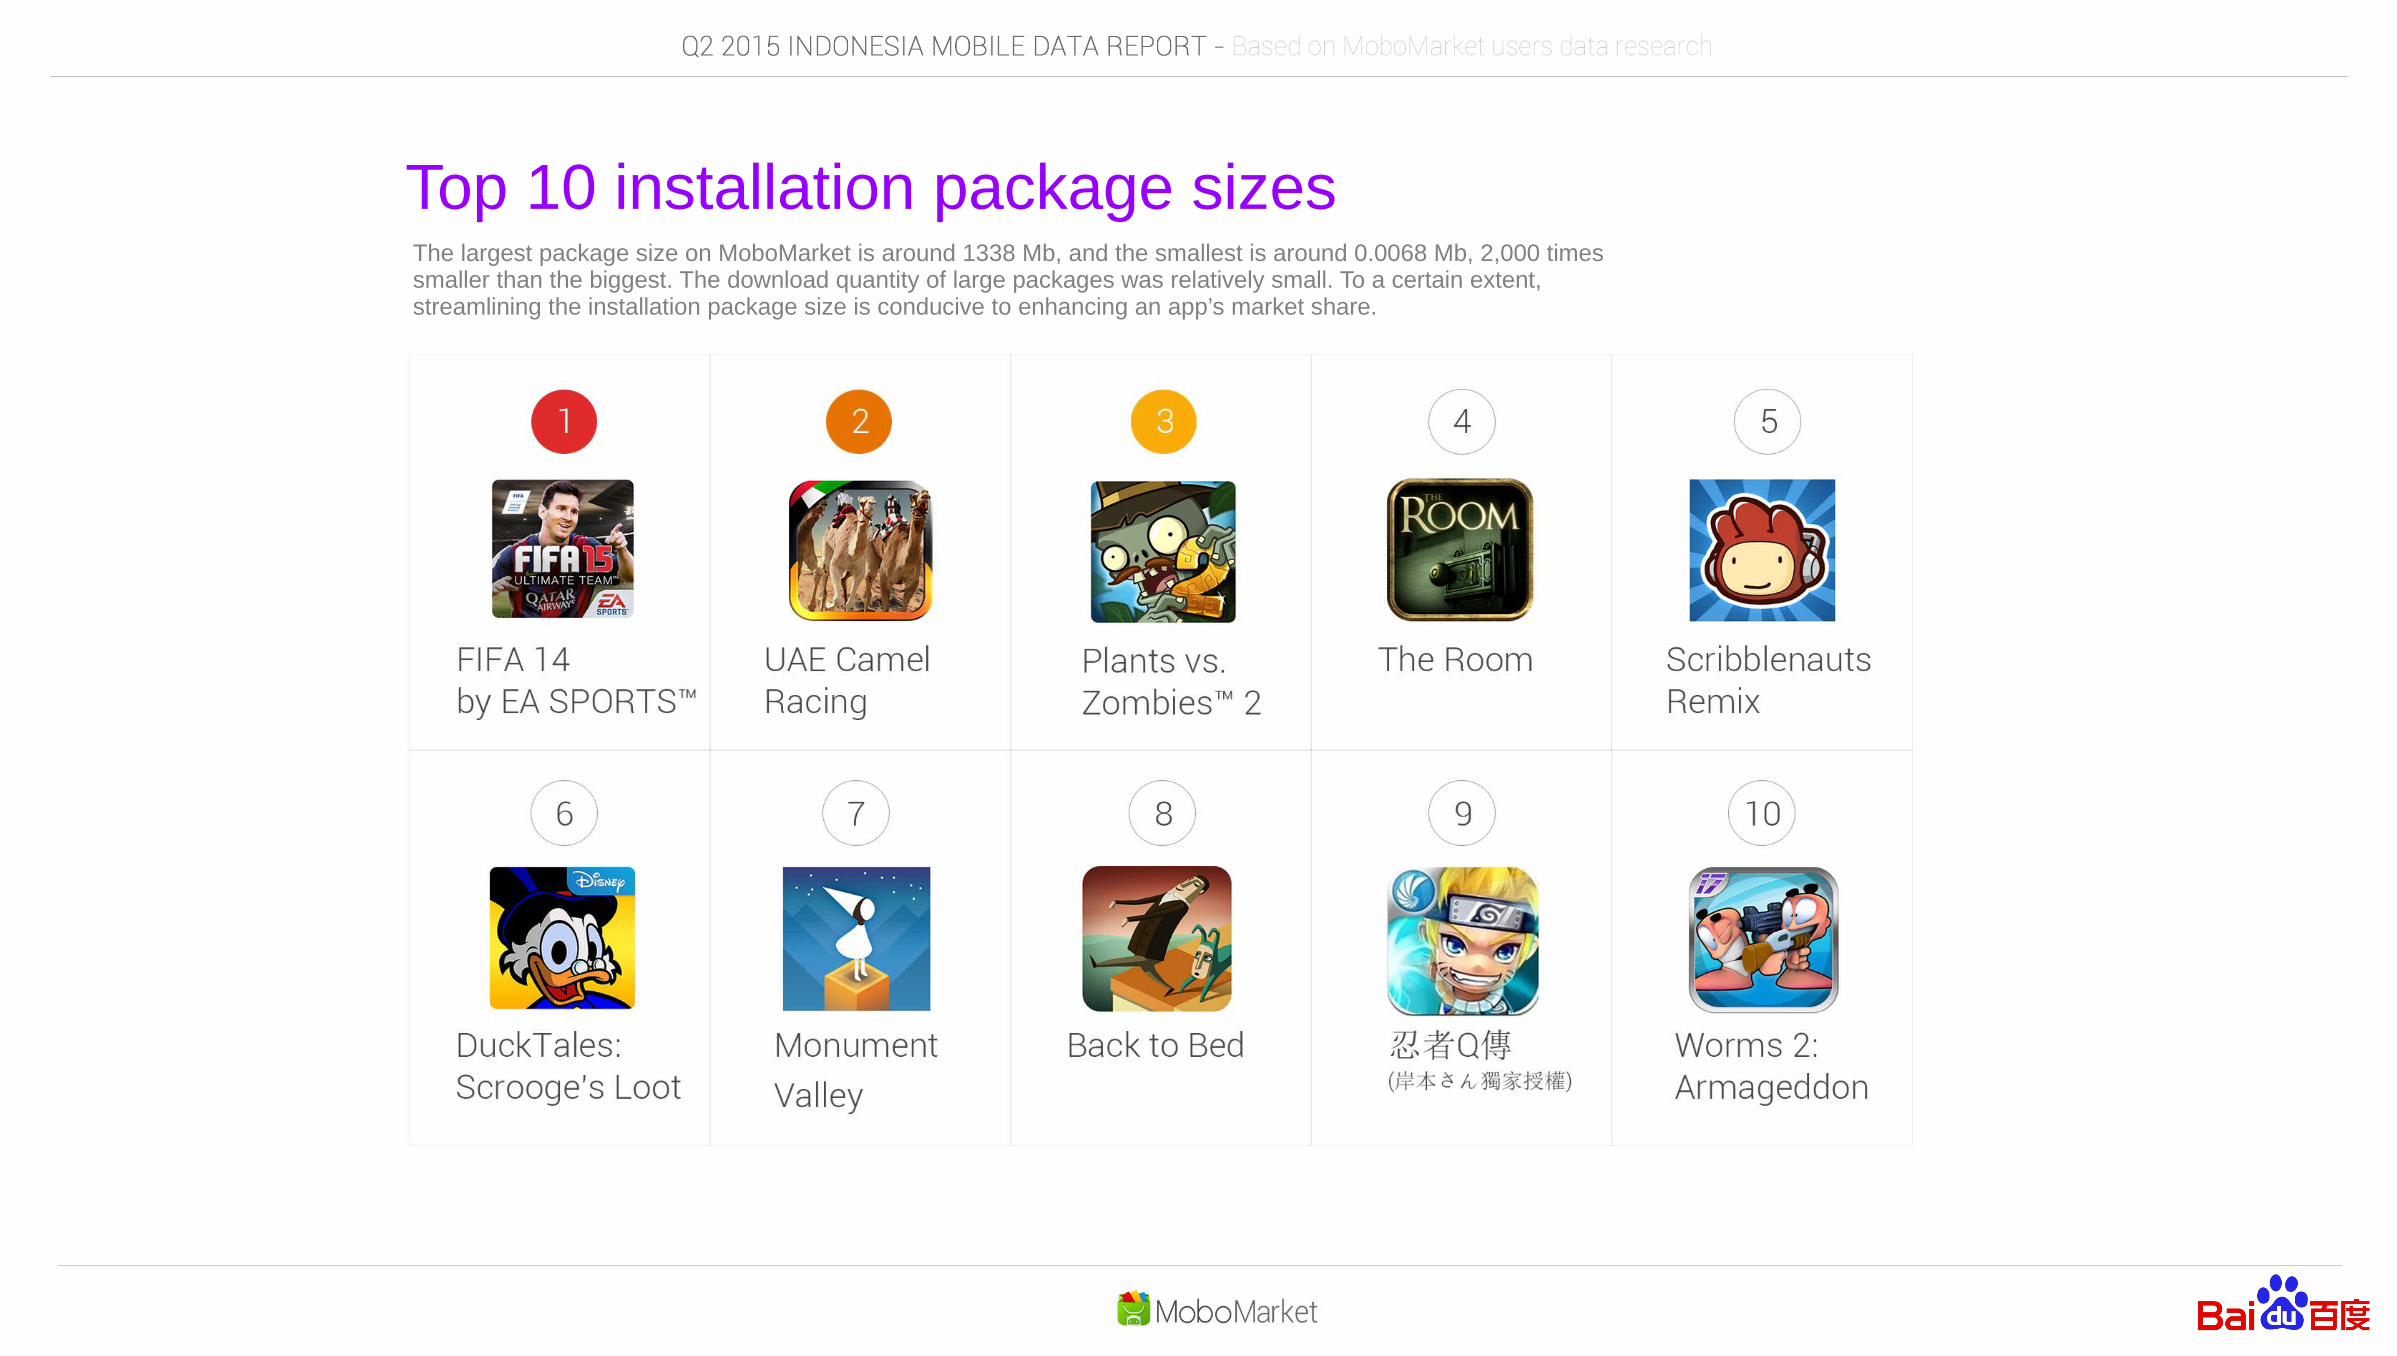
Top 10 installation package sizesThe largest package size on MoboMarket is around 1338 Mb, and the smallest is around 0.0068 Mb, 2,000 times smaller than the biggest. The download quantity of large packages was relatively small. To a certain extent, streamlining the installation package size is conducive to enhancing an app’s market share.
5 How many apps do users update?
What type of apps do users update?
Update behavior analysis
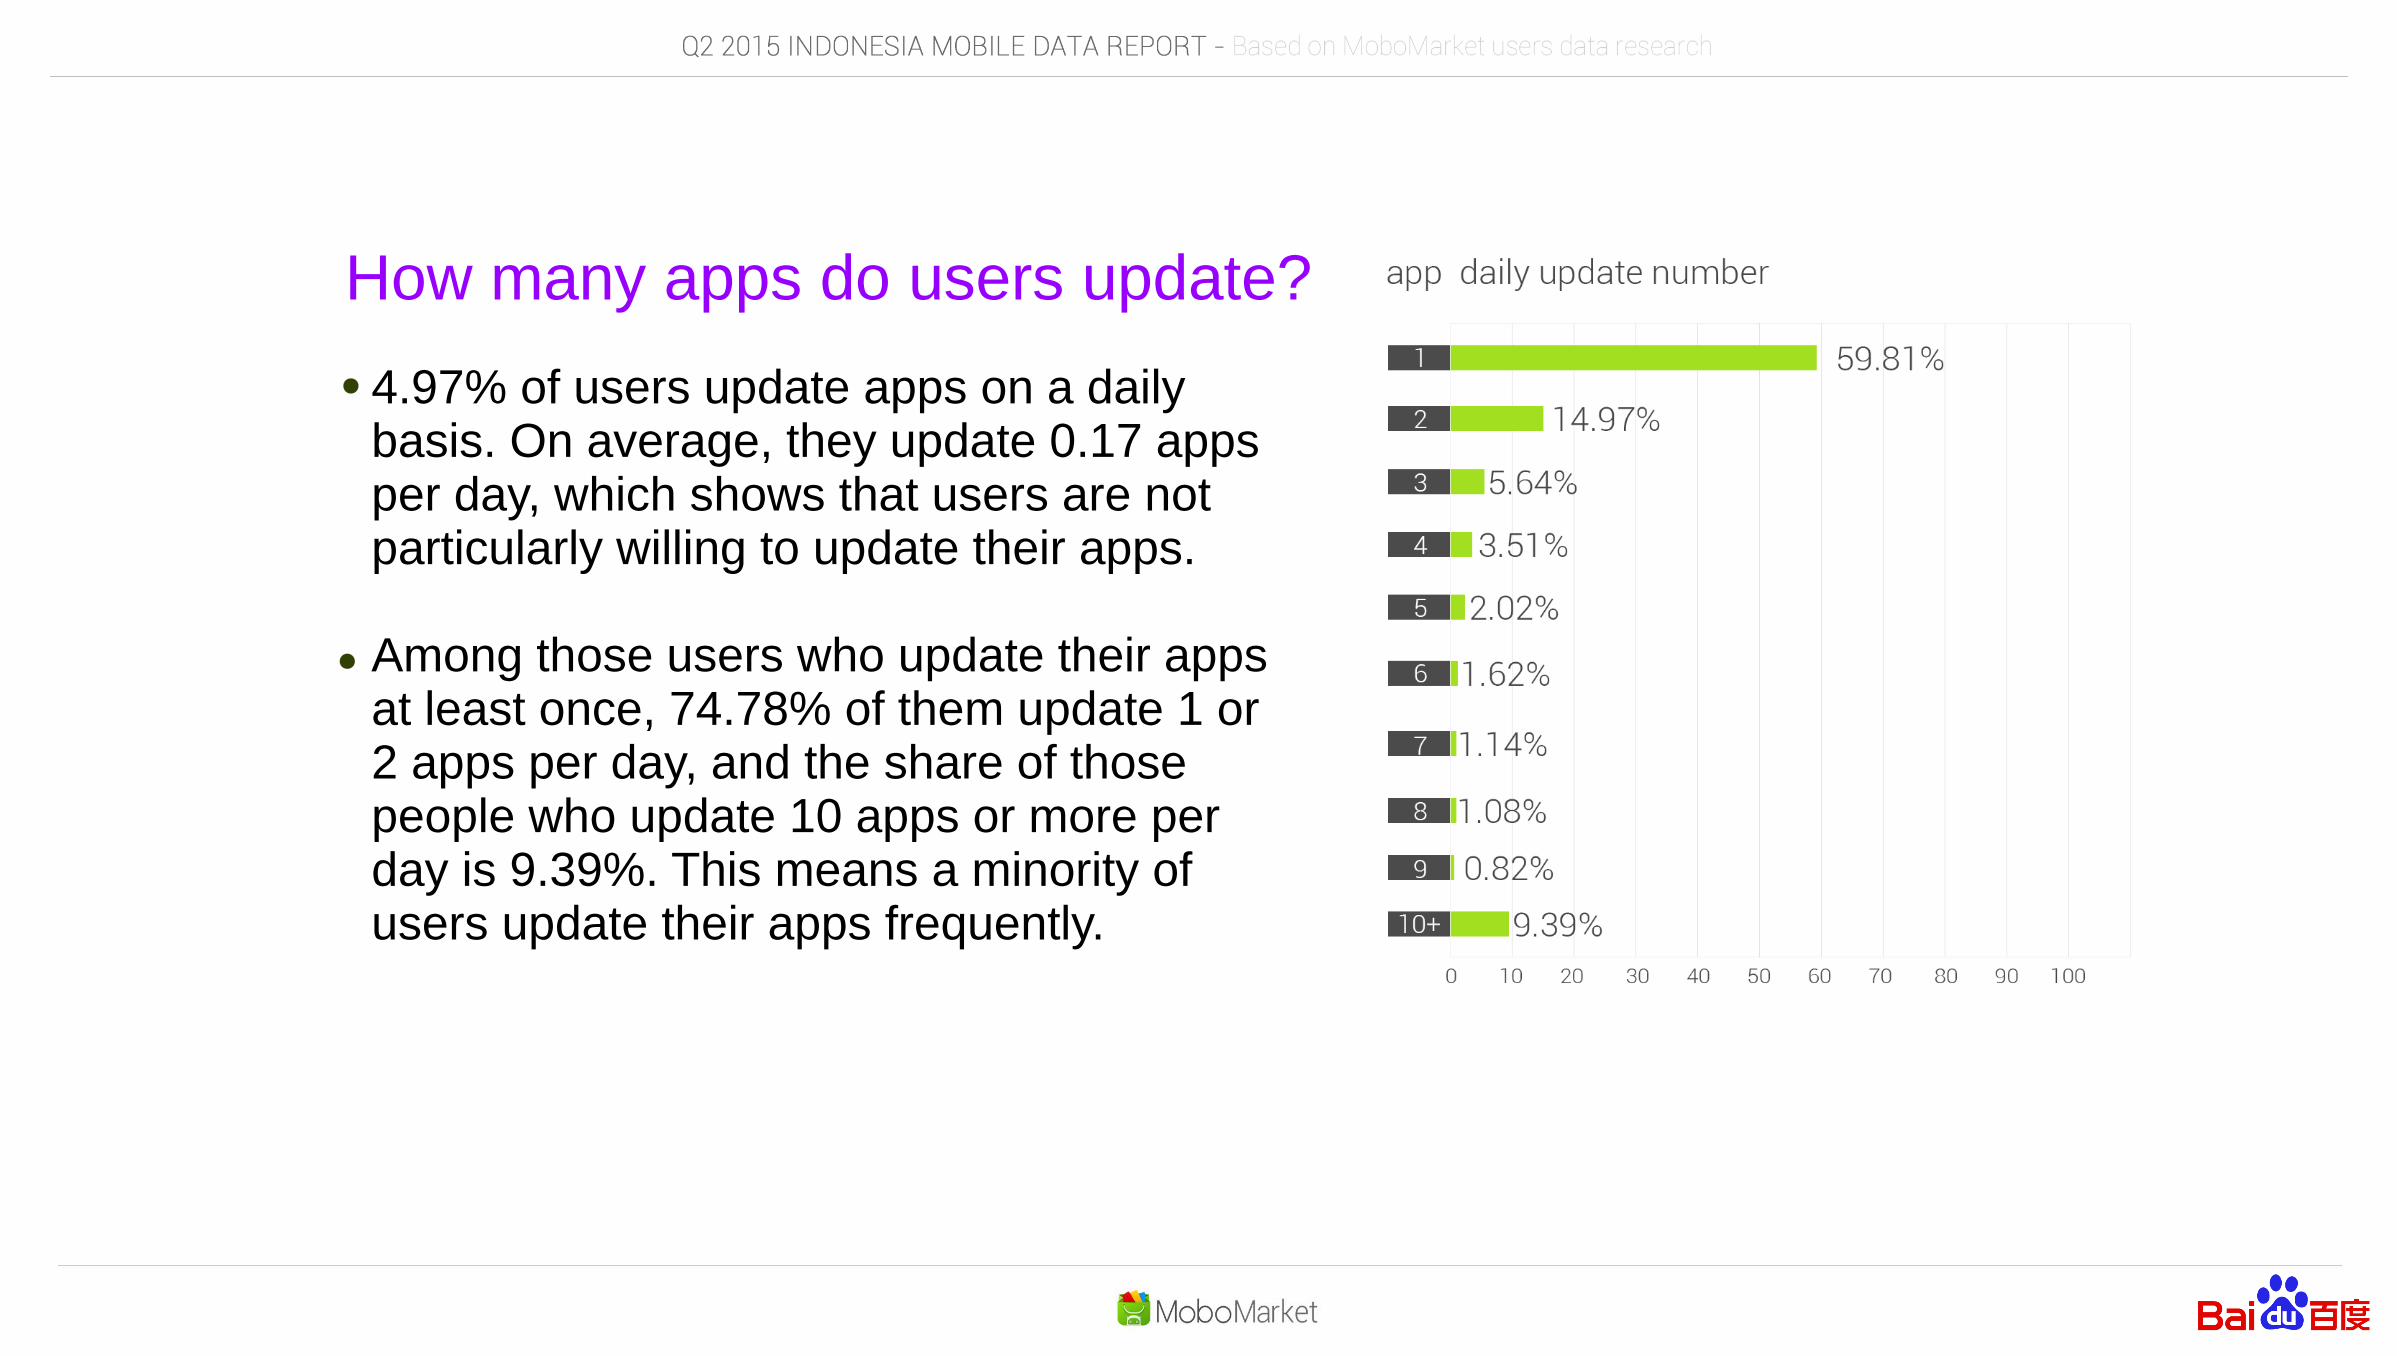
How many apps do users update?
4.97% of users update apps on a daily basis. On average, they update 0.17 apps per day, which shows that users are not particularly willing to update their apps.
Among those users who update their apps at least once, 74.78% of them update 1 or 2 apps per day, and the share of those people who update 10 apps or more per day is 9.39%. This means a minority of users update their apps frequently.
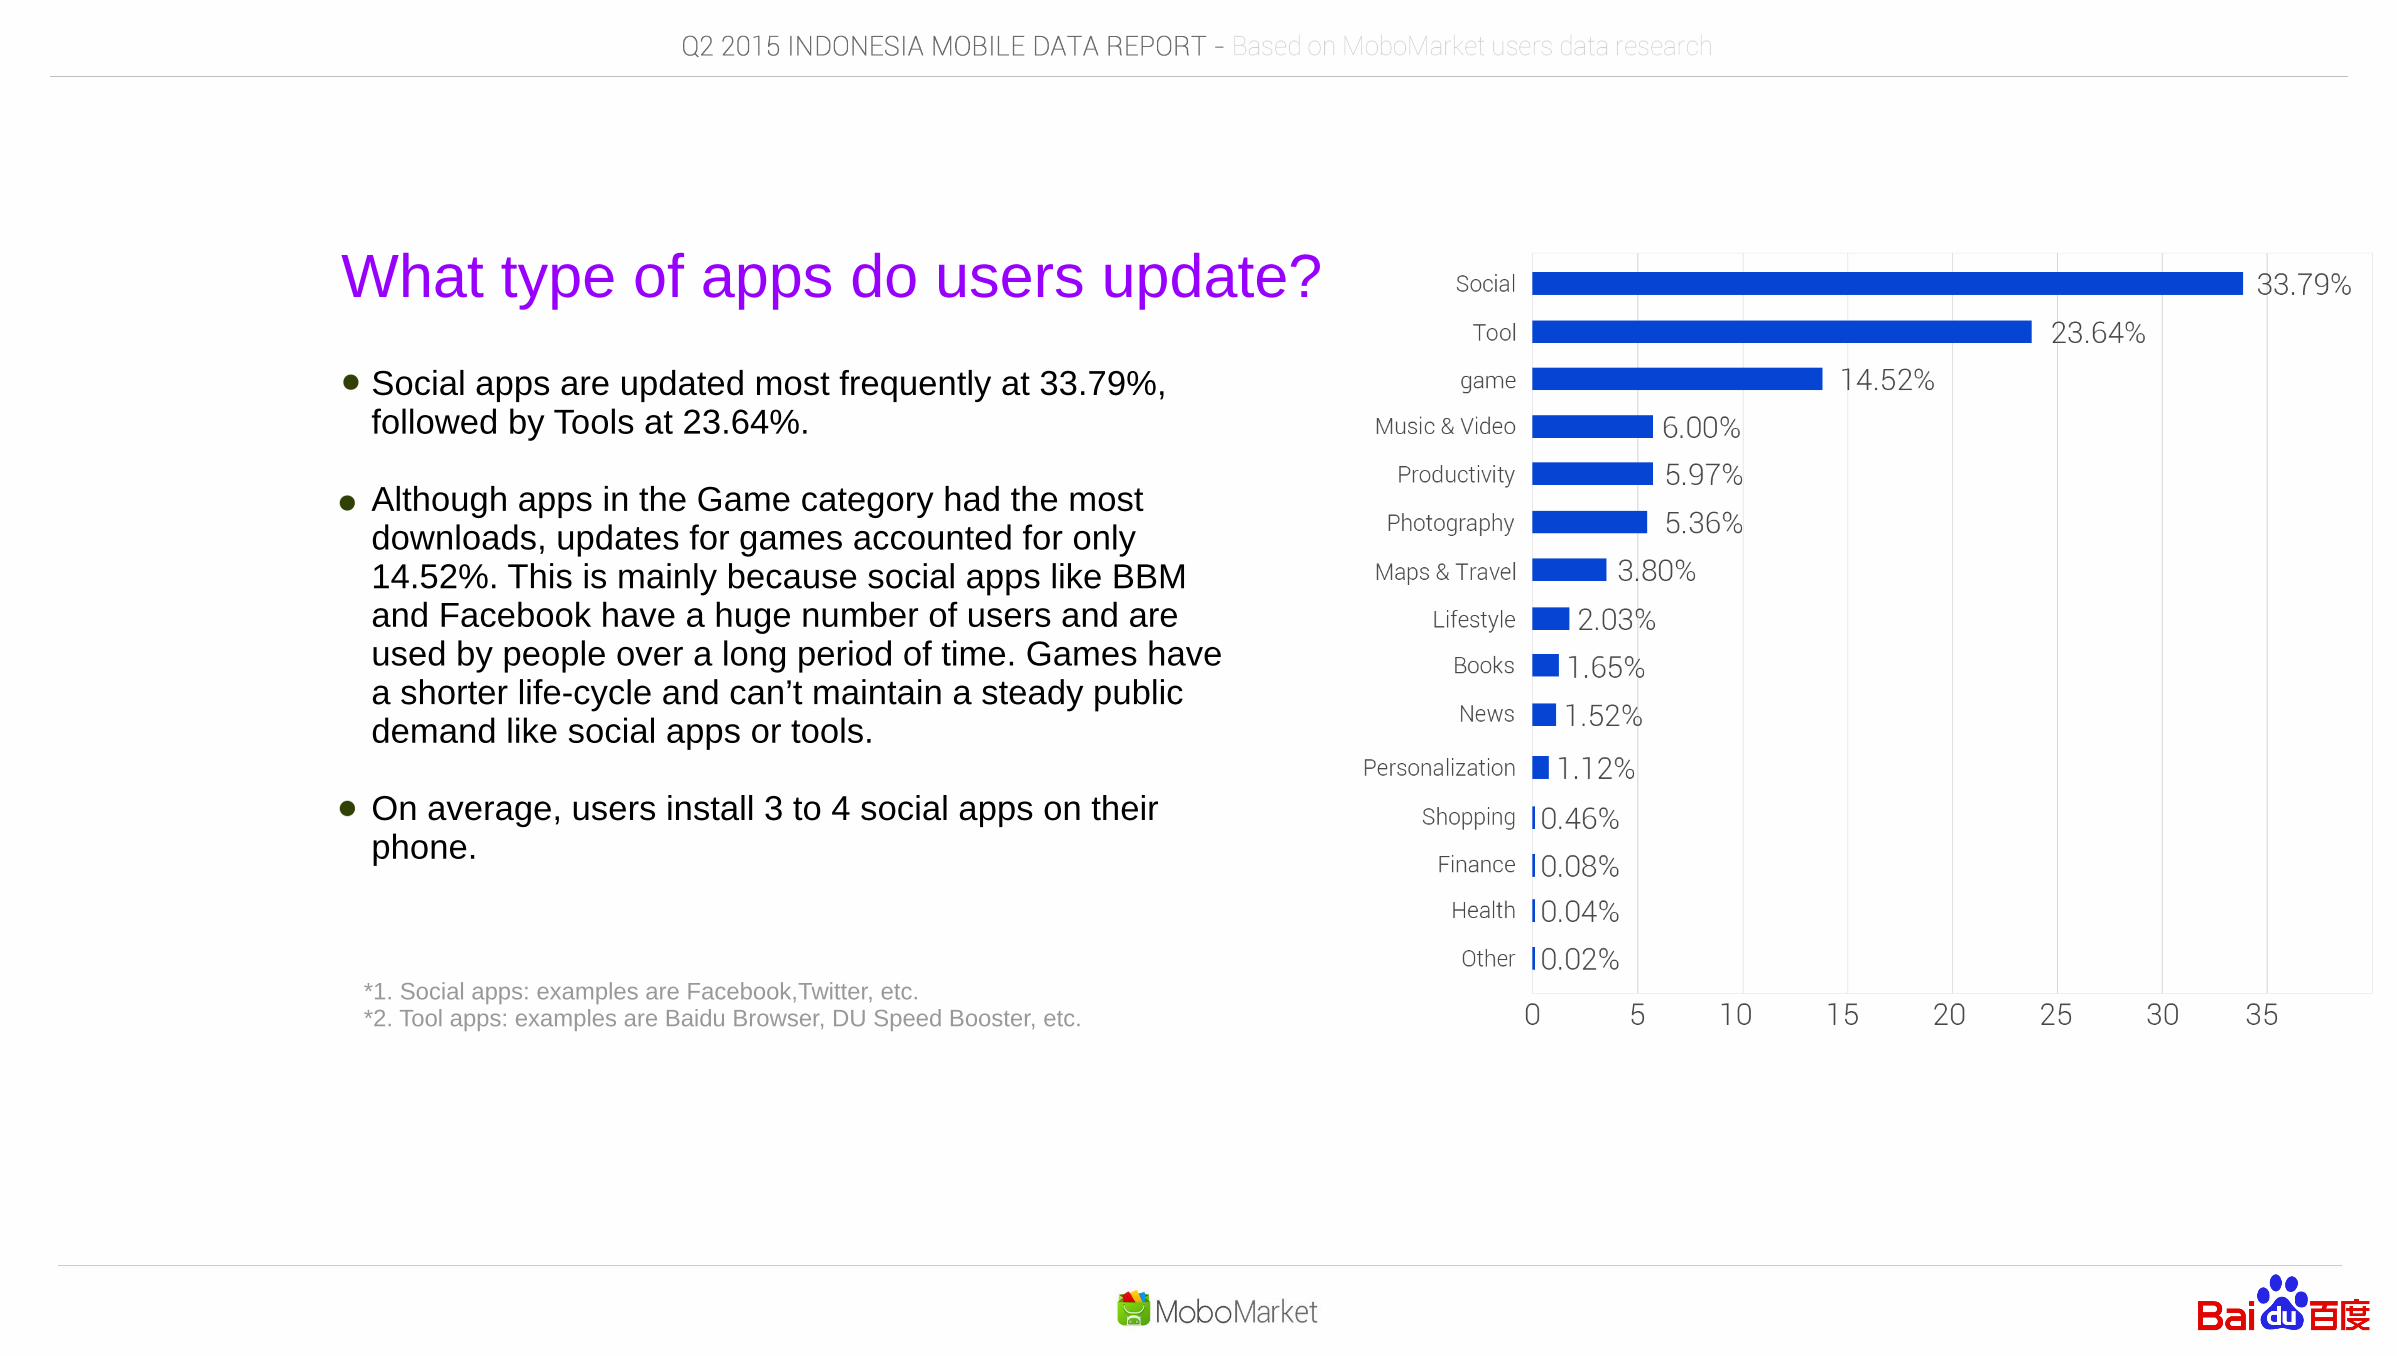
What type of apps do users update?
Social apps are updated most frequently at 33.79%, followed by Tools at 23.64%.
Although apps in the Game category had the most downloads, updates for games accounted for only 14.52%. This is mainly because social apps like BBM and Facebook have a huge number of users and are used by people over a long period of time. Games have a shorter life-cycle and can’t maintain a steady public demand like social apps or tools.
On average, users install 3 to 4 social apps on their phone.
*1. Social apps: examples are Facebook,Twitter, etc.*2. Tool apps: examples are Baidu Browser, DU Speed Booster, etc.
For further information, please visit:
Our official website for app downloads: http://m.mobomarket.co.id/Our developers platform to promote your app: http://dev.mobomarket.co.id/
Our news platform for further infomation:Facebook: MoboMarket IndonesiaTwitter: @MoboMarketIDBBM: C0042987ALine: @MoboMarketID
Contact us:Tel: (021) 5150538 10:00-17:00 WIBProduct e-mail: [email protected] contact: [email protected], [email protected], [email protected]