
Q1/2019 Oma Savings Bank Group Q - GlobeNewswire
68
Q1 /2019 Q Oma Savings Bank Group Interim Report 31 March 2019 1
Transcript of Q1/2019 Oma Savings Bank Group Q - GlobeNewswire
Q1/2019
QOma Savings Bank Group Interim Report 31 March 2019
1
2 Interim Report 31 March 2019
Contents
CEO Pasi Sydänlammi 3
Oma Savings Bank Group's report for January-March 2019 4
Operating environment 7
Financial statements 8
Solvency and risk status 13
Financial statements tables 15
Financial statements notes 25
Auditors report 67
The Interim Report 31 March 2019 is a translation of the original Finnish version "Osavuosikatsaus 31.3.2019". If discrepancies occur, the Finnish version is dominant.
3 Interim Report 31 March 2019
Renewal of the banking platform initiated
The planning and negotiation phase for a reform of the
banking platform was concluded in January. We are
confidently setting out to develop the next-generation
banking platform using Temenos banking system
technology, which is already in use in Finland. The project
has taken off according to plan and is proceeding one
step at a time. The roll-out of the new banking platform
is scheduled for 2021. For customers, the renewal of
the banking platform means new products and
services at a faster pace and an improved
service experience at branch offices and
in mobile and online banking.
Customer experience boosts profitable growth
New branch offices in Greater
Helsinki, Oulu and Turku were launched
in February 2019 and their operations were
fully up and running during the first quarter.
Our operations in Finland’s key growth centres
reinforces our operating conditions in the future.
The Kihniö branch operations were transferred to the
full-service branch in Parkano.
Our latest digital innovation, the OmaKonttori app,
has received positive feedback from customers. It allows
us to bring our banking agents and face-to-face visits to
customers’ smartphones all over Finland. This enables us
to establish a new customer relationship and customers
can choose to begin using bank services entirely
remotely. We feel it is important that the customer can
select the service channel that suits them best.
An excellent customer experience gave our profitable
growth a boost in the first quarter of the year 2019. This
was evident based on the increase in both the profit
and business volumes. Our net interest income grew by
17.3% and fee and commission income (net)
grew by 5.1% compared to comparative period.
Operating income rose due to the combined impact of
non-recurring items of net income on financial assets
and liabilities from the sale of the holding in Oy
Samlink Ab and dividends. As a result, our
profit before taxes grew by as much as
EUR 7.2 million, amounting to EUR 11.9
(4.7) million. Our comparable profit
grew strongly by 15.3%, totalling EUR
5.2 (4.5) million.
Our deposit portfolio showed excel-
lent growth during the first quarter,
which in part contributed to the growth
of the loan portfolio. Our loan portfolio
grew by some EUR 100 million, totalling EUR 2.6
(2.5) billion at the end of March.
Demand for both home mortgages and corporate loans
remained strong throughout Q1. Our housing loan
portfolio grew during the first quarter by 4.16%.
During Q1, some EUR 49.6 million in home mortgages
were issued and our housing loan portfolio came to
EUR 1.24 (1.19) billion at the end of March. The growth
of the corporate loan portfolio was also good at 3.99%.
Some EUR 33.5 million in new corporate loans were
issued and the corporate loan portfolio came to
EUR 874.6 (841.2) billion at the end of March.
In March, we issued a EUR 300 million covered bond,
which will improve our ability to meet the demand for
and pricing of customers’ home mortgages.
Our balance sheet rose to a record-high level and for
the first time we exceeded the EUR 3 billion limit.
Business volumes and profit growing strongly
Excellent start to the year
Demand for both home
mortgages and corporate loans
remained strong
throughout Q1
Pasi Sydänlammi
CEO
4 Interim Report 31 March 2019
Oma Savings Bank Plc Group's report for January–March 2019
January – March 2019
• Net interest income was EUR 13.2 (11.3) million, an
increase of 17.3% compared to the previous year’s
corresponding period.
• Fee and commission income (net) grew by 5.1%, total-
ling EUR 6.2 (5.9) million.
• Operating income came to approximately EUR 27.4
(17.5) million.
• The net income on financial assets and liabilities was
EUR 6.7 (0.2) million. The most significant non-recur-
ring items were Oy Samlink Ab’s additional dividend
and the change in the fair value of Samlink’s shares.
• Operating expenses came to a total of EUR 14.3 (11.3)
million. Operating expenses rose due to personnel
expenses, expenses resulting from the opening of new
branch offices, IT system development costs and the
recognition of annual Deposit Guarantee Fund and
Financial Stability Authority payments during the first
quarter.
• The total amount of impairment losses on financial
assets was EUR 1.2 (1.5) million.
• The Group’s profit before taxes was EUR 11.9 (4.7)
million.
• The company’s comparable profit before
taxes, which has been adjusted for net interest income
on financial assets and liabilities, was EUR 5.2 (4.5)
million.
Provided that profitable growth continues, the company
estimates that the Group’s comparable profit before
taxes for 2019 will grow compared to the previous ac-
counting period. At the same time, the profit before taxes
for 2019 is estimated to grow compared to the previous
accounting period.
More information available on page 11.
Outlook for the 2019 accounting period (unchanged)
5 Interim Report 31 March 2019
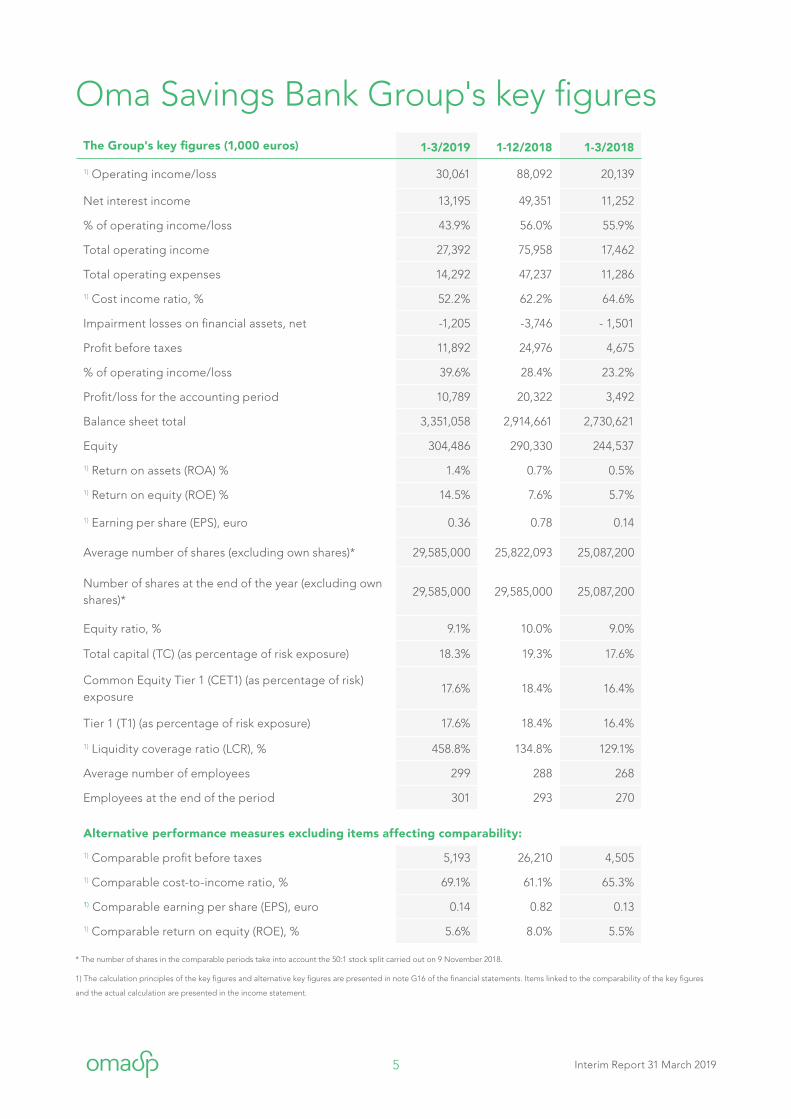
Oma Savings Bank Group's key figuresThe Group's key figures (1,000 euros) 1-3/2019 1-12/2018 1-3/2018
1) Operating income/loss 30,061 88,092 20,139
Net interest income 13,195 49,351 11,252
% of operating income/loss 43.9% 56.0% 55.9%
Total operating income 27,392 75,958 17,462
Total operating expenses 14,292 47,237 11,286
1) Cost income ratio, % 52.2% 62.2% 64.6%
Impairment losses on financial assets, net -1,205 -3,746 - 1,501
Profit before taxes 11,892 24,976 4,675
% of operating income/loss 39.6% 28.4% 23.2%
Profit/loss for the accounting period 10,789 20,322 3,492
Balance sheet total 3,351,058 2,914,661 2,730,621
Equity 304,486 290,330 244,537
1) Return on assets (ROA) % 1.4% 0.7% 0.5%
1) Return on equity (ROE) % 14.5% 7.6% 5.7%
1) Earning per share (EPS), euro 0.36 0.78 0.14
Average number of shares (excluding own shares)* 29,585,000 25,822,093 25,087,200
Number of shares at the end of the year (excluding own shares)*
29,585,000 29,585,000 25,087,200
Equity ratio, % 9.1% 10.0% 9.0%
Total capital (TC) (as percentage of risk exposure) 18.3% 19.3% 17.6%
Common Equity Tier 1 (CET1) (as percentage of risk) exposure
17.6% 18.4% 16.4%
Tier 1 (T1) (as percentage of risk exposure) 17.6% 18.4% 16.4%
1) Liquidity coverage ratio (LCR), % 458.8% 134.8% 129.1%
Average number of employees 299 288 268
Employees at the end of the period 301 293 270
Alternative performance measures excluding items affecting comparability:
1) Comparable profit before taxes 5,193 26,210 4,505
1) Comparable cost-to-income ratio, % 69.1% 61.1% 65.3%
1) Comparable earning per share (EPS), euro 0.14 0.82 0.13
1) Comparable return on equity (ROE), % 5.6% 8.0% 5.5% * The number of shares in the comparable periods take into account the 50:1 stock split carried out on 9 November 2018. 1) The calculation principles of the key figures and alternative key figures are presented in note G16 of the financial statements. Items linked to the comparability of the key figures
and the actual calculation are presented in the income statement.
6 Interim Report 31 March 2019
Reform of the banking platform using Temenos technology
In its stock exchange release on 23 January 2019, Oma
Savings Bank announced that the company will be
implementing a new banking platform using Temenos
technology together with Cognizant and at the same
time would be selling to Cognizant Technology Solutions
Finland Oy its 15.45% holding in the current IT services
provider Oy Samlink Ab together with the Savings Bank
Group, Aktia Bank Plc, Handelsbanken, Posti Group Plc,
POP Bank Group and other minority shareholders. The
transaction received the required regulatory approval and
was carried out on 1 April 2019.
On 23 January 2019, the company signed an agreement
with Oy Samlink Ab to develop a new banking platform
based on the Temenos T24 and Temenos Payment Hub
software, and a 10-year service agreement for the
provision and maintenance of the core banking services.
The delivery of the banking platform will cost Oma Savin-
gs Bank about EUR 20 million and the roll-out is schedu-
led for 2021.
As part of the renewal of the banking platform, the card
system will also be updated and Oma Savings Bank sign-
ed an agreement with Nets on 6 February 2019. The new
card system is scheduled for implementation in 2020.
New associate company GT Invest Oy
On 13 March 2019, YIT published an investor release
announcing that the company would be investing in a
new joint venture focussing on rental flats in Finland. Oma
Savings Bank Plc’s associate company GT Invest Oy owns
51% of the joint venture, which invests in rental flats built
by YIT in Finland. Oma Savings Bank Plc’c holding in GT
Invest Oy is nearly 49%.
Significant events in January–March
Bond issue
On 27 March 2019, Oma Savings Bank announced in a
stock exchange release that it would be issuing a EUR 300
million covered bond. The bond’s maturity is 5 years and
its maturity date is 3 April 2024. The bond has an annual
interest rate of 0.125%.
The issue of the bond strengthens the company’s
prerequisites for achieving growth and the covered bond
issue also impacts the decline in refinancing costs in the
future.
The bond’s issue took place under Oma Savings
Bank’s EUR 1,500 million bond programme. The Financial
Supervisory Authority approved Oma Savings Bank’s
bond programme prospectus on 20 November 2017, the
prospectus concerning the recently issued bond on 12
March 2019 and the supplement to the prospectus on 22
March 2019. The bond was listed on the stock exchange
on 9 April 2019.
7 Interim Report 31 March 2019
Oma Savings Bank Plc operates in a stable, business-
friendly environment in Finland. The gross domestic
product (GDP) of Finland has shown solid growth since
2015, increasing by 2.8% in 2016, 2.7% in 2017 and by 2.3%
in 2018 (1. Finland’s GDP is expected to continue to grow,
at an estimated average annual rate of 1.6% in the period
2019–2022.(2
According to Statistics Finland’s labour survey, there
were 34,000 more employed persons in February of 2019
than in the previous year’s corresponding period. In
February 2019, the employment rate was 70.7% (69.8%)
and the unemployment rate was on average 7.4% (8.6%).(3
In the company’s view, the Finnish business environ-
ment is also stable in terms of household indebtedness
and housing prices. According to Statistics Finland’s
preliminary data, the prices of old dwellings in housing
companies rose by 1.7% in February 2019 in Greater
Helsinki and by 2.4% in the rest of Finland. Year-on-year,
the prices of old dwellings rose by 2.5% in Greater Helsin-
ki and remained unchanged in the rest of Finland.(4
(1 Statistics Finland, Gross Domestic Product grew by 2.3 per cent in
2018. Published on 15 Mar 2019
(2 IMF, DataMapper 04/2019.
(3 Statistics Finland, Unemployment decreased and employment
increased in February. Published on 26 Mar 2019
In February of 2019, total loans to households increased
by 2.4% over the previous 12 months, of which the growth
in the housing loan stock was 1.9%. The number of
corporate loans grew 7.4% in the same period.(5
The loan stock for housing corporations has grown
rapidly in recent years. The growth in housing
company loans has been driven by the increase in
popularity, among home owners, of large shares in
housing company loans and long instalment-free periods
in new properties. This increase is most obvious in the
growth of the supply of new homes in blocks of flats.
Construction is, however, expected to fall due to
a decline in the number of new building permits issued
after spring 2018.(6
(4 Statistics Finland, Prices of old dwellings in housing companies rose in
February. Published on 28 Mar 2019
(5 Bank of Finland, MFI balance sheet (loans and deposits) and interest
rates. Published on 1 Apr 2019
(6 Financial Supervisory Authority, Macroeconomic Stability Report
WINTER 2-2018, Published 20 Dec 2018.
Operating environment
Credit ratingIn September 2018, Standard & Poor's has confirmed a credit rating for Oma Savings Bank's long-term
borrowing BBB + and A-2 for short-term borrowing.
8 Interim Report 31 March 2019
Financial statements
Result 1–3/2019
The Group’s profit before taxes for January–March 2019
was EUR 11.9 (4.7) million and the profit for the accounting
period was EUR 10.8 (3.5) million. The cost/income ratio
was 52.2% (64.6%).
The Q1 comparable profit before taxes grew by 15.3%,
totalling EUR 5.2 (4.5) million. The comparable profit has
been adjusted for EUR 6.7 (0.2) million in net income
on financial assets and liabilities. The item consists of a
non-recurring change in the fair value of Oy Samlink Ab’s
shares and the extra dividend paid by Oy Samlink Ab.
The comparable cost/income ratio was 69.1% (65.3%).
Income
Operating income came to approximately EUR 27.4
(17.5) million. Total operating income grew by 56.9% year-
on-year
Net interest income grew by 17.3%, totalling EUR 13.2
(11.3) million. During the review period interest income
grew by 12.9%, totalling EUR 14.7 (13.0) million. Interest
expenses decreased by 14.8% year-on-year, and were EUR
1.5 (1.8) million in the first quarter. The development of
net interest income was impacted especially by the inc-
rease in interest income resulting from the growth in the
loan portfolio and by a reduction in refinancing costs as a
result of the lower interest costs of issued covered bonds.
Fee and commission expenses (net) grew by 5.1% to
EUR 5.2 (5.9) million. The total amount of fee and
commission income was EUR 7.4 (6.8) million. The increase
in commission income was mainly due to the increase
in lending and card payments and payment transaction
fees. Fee and commission expenses were EUR 1.2 (0.9)
million.
The net income on financial assets and liabilities was
EUR 6.7 (0.2) million during the period. Of the growth,
EUR 5.3 million can be attributed to the change in fair
value of Oy Samlink Ab and EUR 1.2 million in dividend
income. Net income on financial assets and liabilities
are presented in more detail in note G10 of the interim
report.
Other operating income was EUR 1.3 (0.1) million. This
increase can be attributed to a 2019 refund from the old
Deposit Guarantee Fund. In 2018, the refund was
recognised in the second quarter.
Expenses
Total operating expenses grew by 26.6%, totalling EUR
14.3 (11.3) million. A significant amount of the increase
consisted of the EUR 0.8 million increase in personnel
expenses and the EUR 1.8 million increase in other
operating expenses.
Personnel expenses grew by 22.1%, totalling EUR 4.3
(3.5) million. This increase resulted mainly from the
recruitment of personnel for the new branch offices.
In the review period, the average number of employees
was 299 (268). Other operating expenses grew by 25.9%,
to EUR 8.9 (7.1) million. This growth results from the
increase in IT expenses and the recognition of Deposit
Guarantee Fund contributions and Financial Stability
Authority contributions during the first quarter. In 2018,
the contributions were recognised during the second
quarter.
Depreciation, amortisation and impairment losses on
tangible and intangible assets grew by 58.5% to EUR 1.1
(0.7) million. This growth is largely the result of changes
in accounting practices for leases in connection with the
adoption of the IFRS 16 Leases standard.
The period 1 January–31 March 2018
has been used as the comparable
period in i in income statement
items and the date 31 December
2018 as the comparable period
for the balance sheet and capital
adequacy.
11.9EUR mill.
Profit before taxes
Period 1–3/2019
5.2EUR mill.
Comparable profit before taxes
Period 1–3/2019
9 Interim Report 31 March 2019
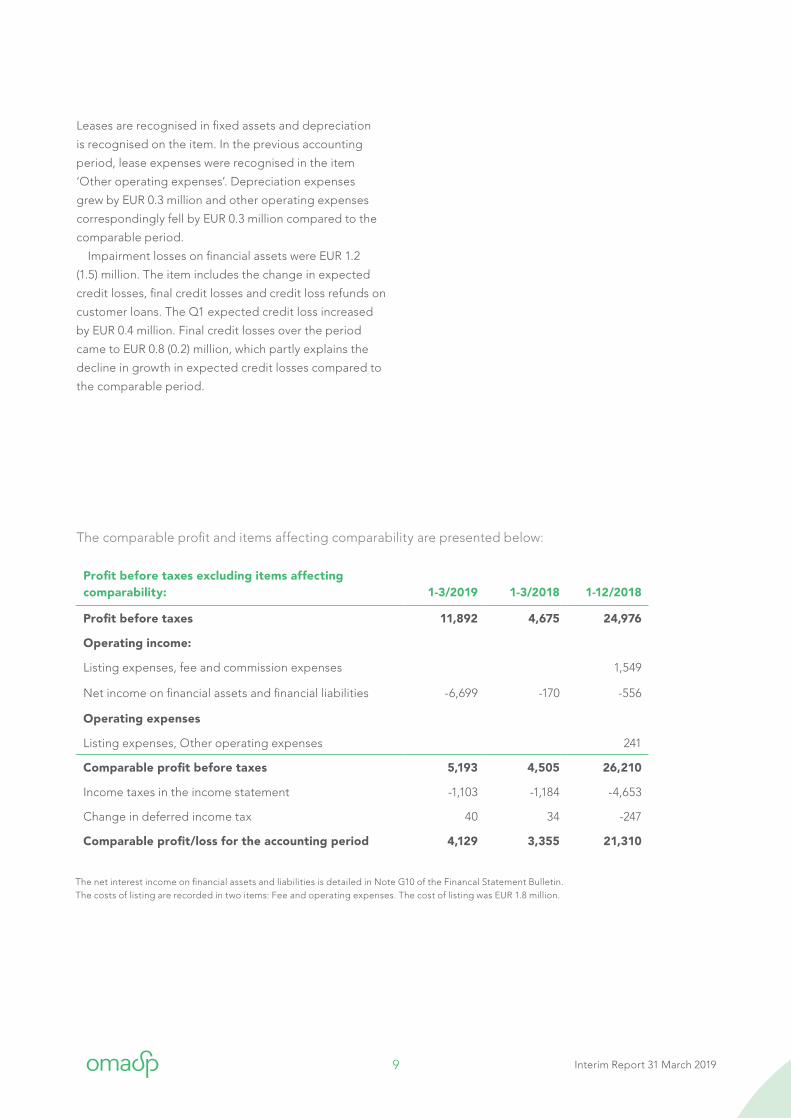
The comparable profit and items affecting comparability are presented below:
Profit before taxes excluding items affecting comparability: 1-3/2019 1-3/2018 1-12/2018
Profit before taxes 11,892 4,675 24,976
Operating income:
Listing expenses, fee and commission expenses 1,549
Net income on financial assets and financial liabilities -6,699 -170 -556
Operating expenses
Listing expenses, Other operating expenses 241
Comparable profit before taxes 5,193 4,505 26,210
Income taxes in the income statement -1,103 -1,184 -4,653
Change in deferred income tax 40 34 -247
Comparable profit/loss for the accounting period 4,129 3,355 21,310
Leases are recognised in fixed assets and depreciation
is recognised on the item. In the previous accounting
period, lease expenses were recognised in the item
‘Other operating expenses’. Depreciation expenses
grew by EUR 0.3 million and other operating expenses
correspondingly fell by EUR 0.3 million compared to the
comparable period.
Impairment losses on financial assets were EUR 1.2
(1.5) million. The item includes the change in expected
credit losses, final credit losses and credit loss refunds on
customer loans. The Q1 expected credit loss increased
by EUR 0.4 million. Final credit losses over the period
came to EUR 0.8 (0.2) million, which partly explains the
decline in growth in expected credit losses compared to
the comparable period.
The net interest income on financial assets and liabilities is detailed in Note G10 of the Financal Statement Bulletin. The costs of listing are recorded in two items: Fee and operating expenses. The cost of listing was EUR 1.8 million.
10 Interim Report 31 March 2019
The Group’s balance sheet total grew during
January–March 2019 by 15.0% to EUR 3,351.1 (2,914.7)
million. The key items on the balance sheet developed
during January–March as follows:
Cash and cash equivalents
The Group’s cash and cash equivalents came to EUR 6.4
(18.5) million at the end of the period.
Loans and other receivables
In total, loans and other receivables grew in January–
March by 3.9% to EUR 2,687.9 (2,585.8) million. The growth
was made up of loans for small companies, home
mortgages and consumer credits. In corporate loans,
growth was especially focussed on the real estate sector.
Investment assets
The Group’s investment assets grew by 12.0% during the
period, totalling EUR 305 (272.3) million. The change in
investment assets is largely the result of an increase in the
number of debt securities and the rise in the fair value of
Oy Samlink Ab’s shares.
Other assets
Other assets came to EUR 312.4 (12.3) million at the end of
the period. The payment of the assets of the bond issued
in March took place in April, which is why the assets were
receivables at the end of March in the item ‘Other assets’.
Liabilities to credit institutions and to the public and public sector entities
Liabilities to credit institutions and to the public and
public sector entities grew in January–March by 4.4% to
EUR 1,928.7 (1,847.7) million. The item consists mostly of
deposits received from the public, which came to EUR
1,838.0 (1,755.8) million at the end of March.
Balance sheet Debt securities issued to the public
Total debt securities issued to the public grew during
the period by 46.2% to EUR 1,045.3 (714.9) million. Oma
Savings Bank issued a EUR 300 million covered bond on
27 March 2019. Total debt securities issued to the public
are shown in more detail in note G7 Debt securities
issued to the public.
Equity
Group equity grew in January–March by 4.9% to EUR
304.9 (290.3) million during the year. The profit for the
accounting period accounted for EUR 10.8 million of the
increase in equity capital. The fair value reserve grew by
EUR 3.4 million.
Own shares
On 31 March 2019, the number of own shares held by
Oma Savings Bank was 11,700. All of the purchases took
place during 2018 and concerned shares subscribed
for in connection with the 2017 personnel offering. The
redemptions took place in connection with the ending of
employment contracts.
Off-balance-sheet commitments
Off-balance sheet commitments included commitments
given to a third party on behalf of a customer and
irrevocable commitments given to a customer.
Commitments given to a third party on behalf of a
customer, EUR 22.4 (22.0) million, were mostly made up
of bank guarantees and other guarantees. Irrevocable
commitments given to a customer, which totalled EUR
168.9 (187.2) million at the end of March, consisted mainly
of undrawn credit facilities.
In September 2018, Oma Savings Bank signed an
agreement on the acquisition of new premises to be
completed in Seinäjoki in 2019. The contract price was in
total EUR 2.3 million.
11 Interim Report 31 March 2019
Outlook for the 2019 accounting period
The company’s business volumes have grown strongly
in Q1 and are predicted to maintain their solid growth
during the 2019 accounting period. The company’s
profitable growth is supported by efforts in recent years
to improve the customer experience and the availability
of customer service through new digital service channels
and the opening of new units.
Oma Savings Bank Plc provides earnings guidance and
the comparable profit before taxes and the profit before
taxes. A verbal description is used to make a
comparison with the comparable period. Earnings
guidance is based on the forecast for the entire year,
which takes into account the current market and business
situation. Forecasts are based on the management’s
insight into the Group’s business development.
Provided that profitable growth continues, the
company estimates that the Group’s comparable profit
before taxes for 2019 will grow compared to the previous
accounting period. At the same time, the profit before
taxes for 2019 is estimated to grow compared to the
previous accounting period.
Significant events after the period
Cognizant transaction was approved by the relevant regulatory authorities
On 23 January 2019, Oma Savings Bank Plc announced
that it would be selling to Cognizant Technology
Solutions Finland Oy its 15.45% holding in the current
IT services provider Oy Samlink Ab together with the
Savings Bank Group, Aktia Bank Plc, Handelsbanken,
Posti Group Plc, POP Bank Group and other minority
shareholders. The transaction received the required
regulatory approval and was carried out on 1 April 2019.
The company recognised Samlink’s shares at the fair
value of their purchase price on 31 March 2019.
Changes in Oma Savings Bank Group’s management team
As of 1 April, Kimmo Tapionsalo M.Sc., eMBA started as
a new member of the management team of Oma Savings
Bank Group. He has held a position with the company
since 2014 and is its Chief Risk Officer. Oma Savings
Bank’s Chief Information Officer Kari-Mikael Markkanen
took on new duties outside the company on 7 May 2019.
The company has started up recruitment of a new CIO.
12 Interim Report 31 March 2019
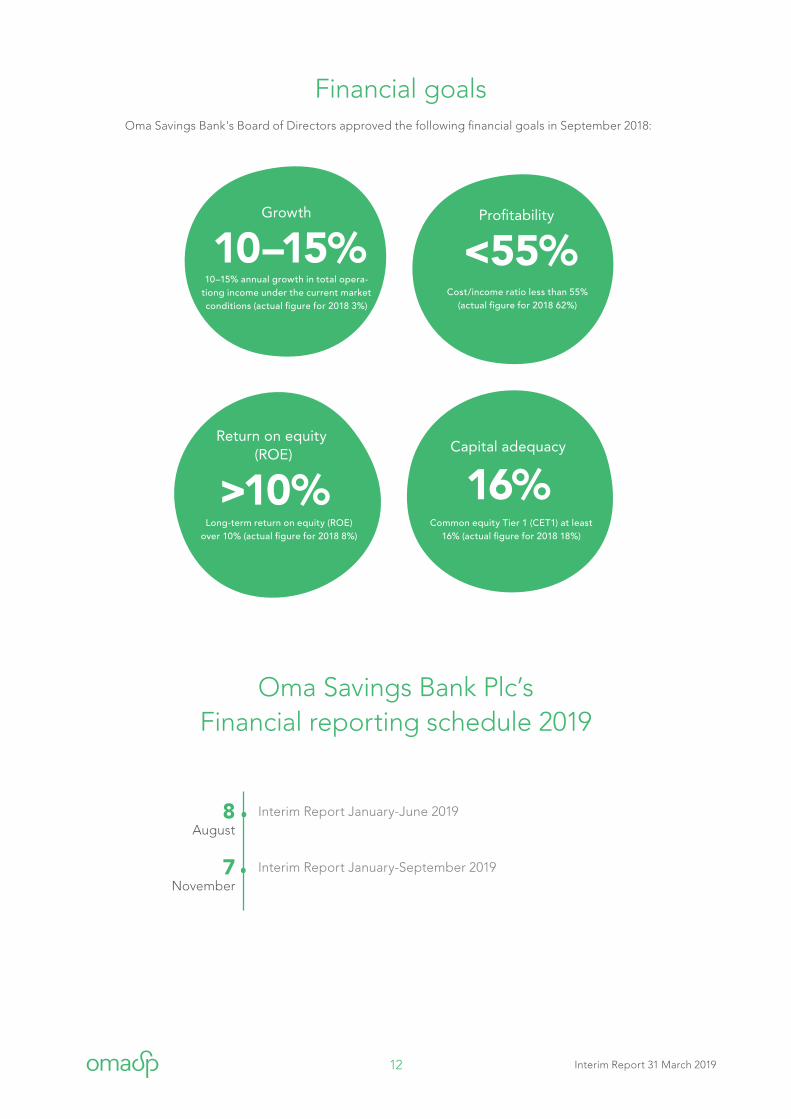
Oma Savings Bank's Board of Directors approved the following financial goals in September 2018:
Financial goals
10–15% <55%
Growth
Profitability
10–15% annual growth in total opera-tiong income under the current market conditions (actual figure for 2018 3%)
Cost/income ratio less than 55% (actual figure for 2018 62%)
16%>10%
Capital adequacy
Return on equity (ROE)
Common equity Tier 1 (CET1) at least 16% (actual figure for 2018 18%)
Long-term return on equity (ROE) over 10% (actual figure for 2018 8%)
Oma Savings Bank Plc’s Financial reporting schedule 2019
8 August
Interim Report January-June 2019
Interim Report January-September 20197 November
13 Interim Report 31 March 2019
Oma Savings Bank Group publishes its key capital
adequacy information in its interim report. Capital
adequacy and risk management information is presented
in more detail as part of the Annual Report, and the Pillar
III section based on the Regulation (EU) No 575/2013 of
the European Parliament and of the Council on prudential
requirements for credit institutions.
The total capital ratio (TC) of the Oma Savings Bank
Group remained strong and was 18.3% (19.3%) at the end
of the period. The common equity tier 1 capital's (CET1)
ratio to risk-weighted assets was 17.6% (18.4%), clear-
ly exceeding the minimum level for the financial goals
approved by the Board of Directors, 16%. Risk-weighted
assets, EUR 1,640.1 (1,498.7) million, rose by 9.4% on the
comparable period, contributing to the weakening of
the Group’s capital adequacy position. The growth of
risk-weighted assets was strengthened due to a
covered bond issued in March and the strong growth in
the private customer loan portfolio. In its capital
adequacy calculations, Oma Savings Bank Group applies
the standardised approach for credit risks and the basic
indicator approach for operative risk
In the standardised approach, exposures are divided
into exposure classes and the minimum limits for credit
spreading are determined in the retail receivables class.
The basic method is applied when calculating the capital
requirement for market risk for the foreign exchange
position.
At the end of the review period, the capital structure
of Oma Savings Bank Group was strong, consisting mostly
of common equity Tier 1 capital (CET1). The Group’s total
own funds (TC) were EUR 299.8 (288.8) million when the
capital
requirement for the bank’s own funds was EUR 172.3
(157.4) million. The capital requirement includes the
minimum capital requirement (8%) as well as a fixed capi-
tal buffer (2.5%) and a countercyclical buffer. Tier 1 capital
(T1) was EUR 288.0 (275.8) million, consisting entirely of
common equity Tier 1 capital (CET1). Tier 2 capital (T2)
was EUR 11.8 (13.0) million, consisting of debenture loans.
The increase in own funds was most significantly the
result of the profit for the accounting period. The retained
earnings for the 2019 accounting period, EUR 10.8 million,
is included in the common equity Tier 1 capital based on
the permission granted by the Finnish Financial
Supervisory Authority. The leverage ratio was 8.4% (9.3%)
at the end of the period.
As of 2015, the bank’s capital requirement in Finland
has been 10.5%, calculated from risk-weighted assets.
The countercyclical buffer requirement varies between
0 and 2.5%. The size of the countercyclical buffer
requirement and its activation are decided each quarter
by the Board of the Financial Supervisory Authority based
on its macroprudential analysis. In 2019, the Financial
Supervisory Authority did not activate the countercyclical
buffer requirement for Finnish credit institutions. As of
1 January 2018, the Financial Supervisory Authority has
had the right to activate the buffer requirement (systemic
risk buffer) for credit institutions based on the structural
characteristics of the financial system. On 29 June 2018,
the Financial Supervisory Authority imposed a 1–3%
capital buffer requirement for all credit institutions to
strengthen the risk tolerance of the credit institutions in
case of structural systemic risks. A systemic risk buffer of
1% to be covered by the consolidated common equity
Tier 1 capital was set for Oma Savings Bank Plc. The
decision will come into force on 1 July 2019.
Capital adequacy and risk position
14 Interim Report 31 March 2019
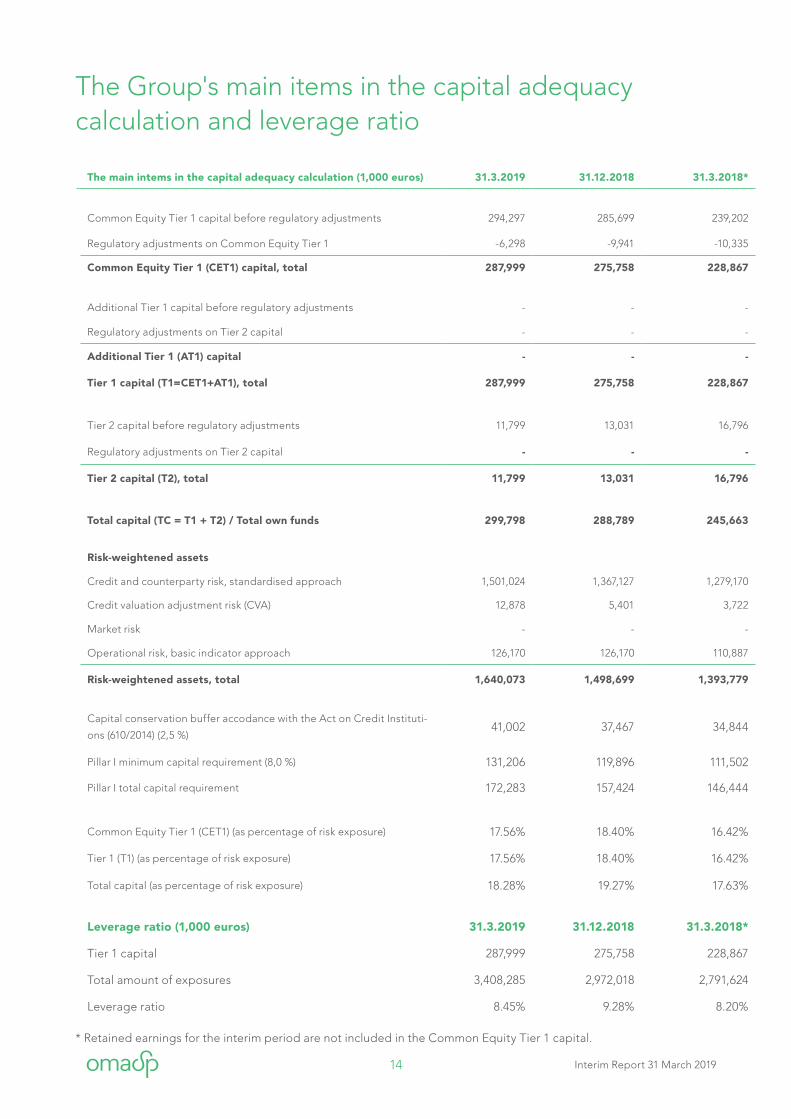
The Group's main items in the capital adequacy calculation and leverage ratio
The main intems in the capital adequacy calculation (1,000 euros) 31.3.2019 31.12.2018 31.3.2018*
Common Equity Tier 1 capital before regulatory adjustments 294,297 285,699 239,202
Regulatory adjustments on Common Equity Tier 1 -6,298 -9,941 -10,335
Common Equity Tier 1 (CET1) capital, total 287,999 275,758 228,867
Additional Tier 1 capital before regulatory adjustments - - -
Regulatory adjustments on Tier 2 capital - - -
Additional Tier 1 (AT1) capital - - -
Tier 1 capital (T1=CET1+AT1), total 287,999 275,758 228,867
Tier 2 capital before regulatory adjustments 11,799 13,031 16,796
Regulatory adjustments on Tier 2 capital - - -
Tier 2 capital (T2), total 11,799 13,031 16,796
Total capital (TC = T1 + T2) / Total own funds 299,798 288,789 245,663
Risk-weightened assets
Credit and counterparty risk, standardised approach 1,501,024 1,367,127 1,279,170
Credit valuation adjustment risk (CVA) 12,878 5,401 3,722
Market risk - - -
Operational risk, basic indicator approach 126,170 126,170 110,887
Risk-weightened assets, total 1,640,073 1,498,699 1,393,779
Capital conservation buffer accodance with the Act on Credit Instituti-
ons (610/2014) (2,5 %)41,002 37,467 34,844
Pillar I minimum capital requirement (8,0 %) 131,206 119,896 111,502
Pillar I total capital requirement 172,283 157,424 146,444
Common Equity Tier 1 (CET1) (as percentage of risk exposure) 17.56% 18.40% 16.42%
Tier 1 (T1) (as percentage of risk exposure) 17.56% 18.40% 16.42%
Total capital (as percentage of risk exposure) 18.28% 19.27% 17.63%
Leverage ratio (1,000 euros) 31.3.2019 31.12.2018 31.3.2018*
Tier 1 capital 287,999 275,758 228,867
Total amount of exposures 3,408,285 2,972,018 2,791,624
Leverage ratio 8.45% 9.28% 8.20%
* Retained earnings for the interim period are not included in the Common Equity Tier 1 capital.
15 Interim Report 31 March 2019
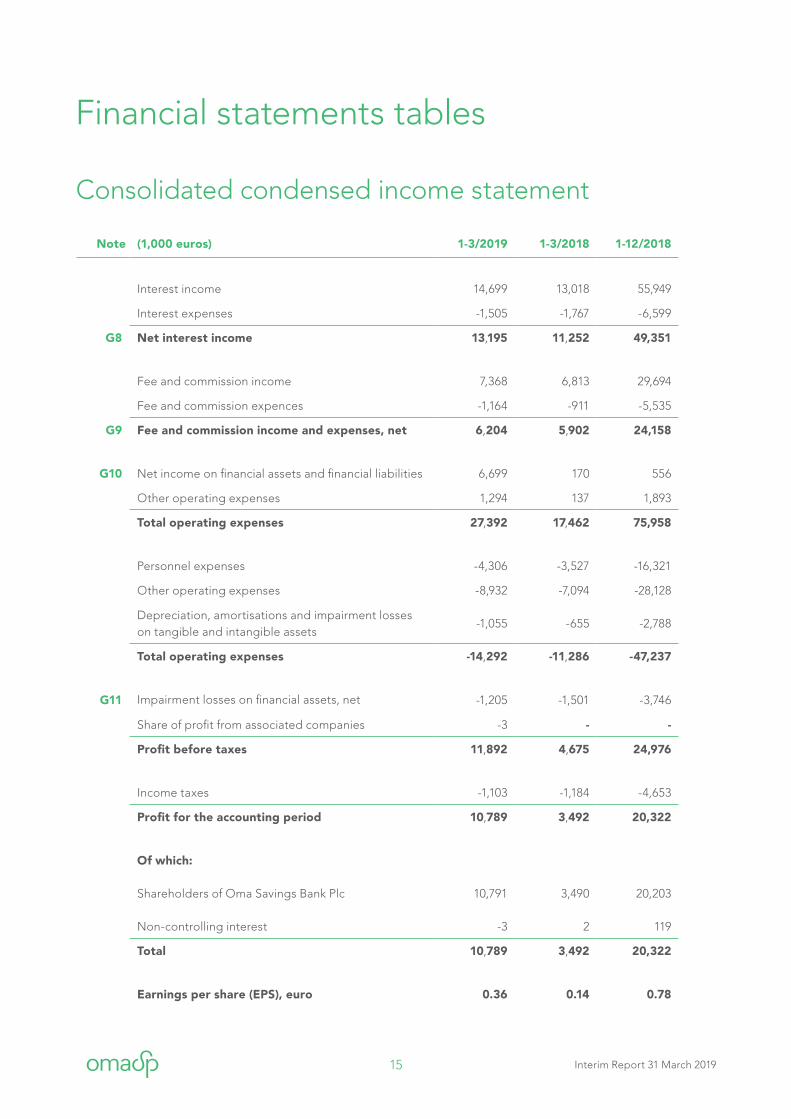
Consolidated condensed income statement
Note (1,000 euros) 1-3/2019 1-3/2018 1-12/2018
Interest income 14,699 13,018 55,949
Interest expenses -1,505 -1,767 -6,599
G8 Net interest income 13,195 11,252 49,351
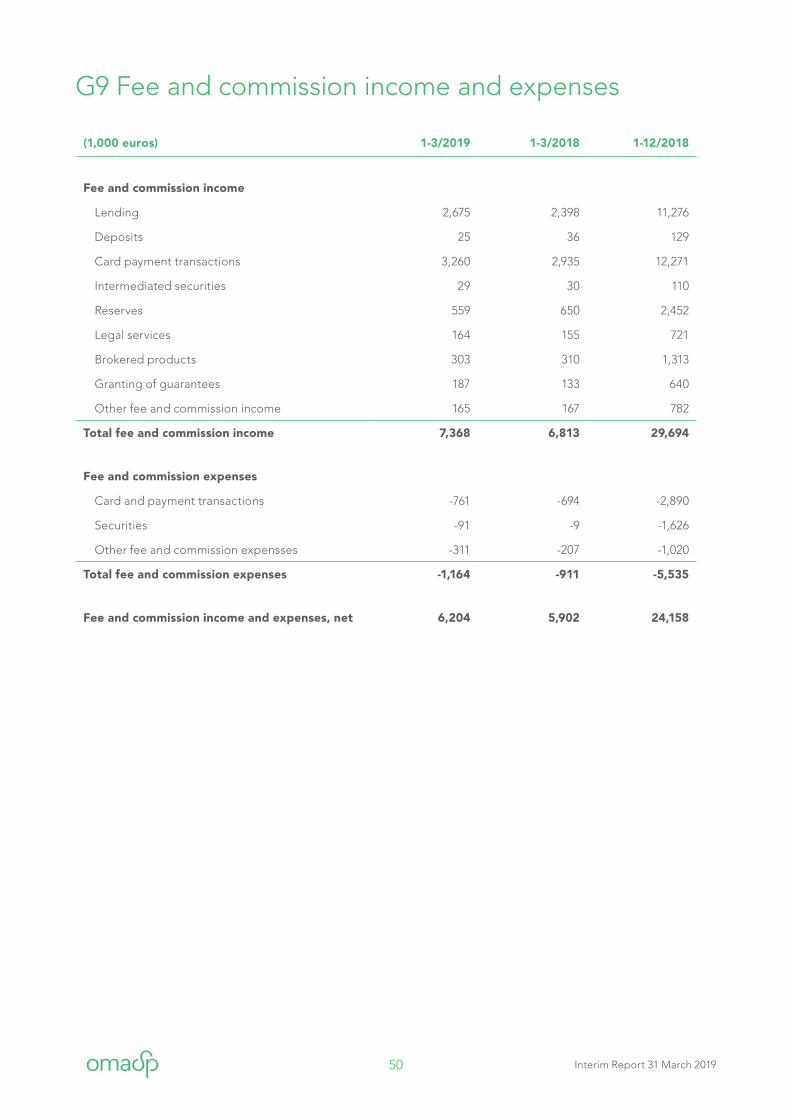
Fee and commission income 7,368 6,813 29,694
Fee and commission expences -1,164 -911 -5,535
G9 Fee and commission income and expenses, net 6,204 5,902 24,158
G10 Net income on financial assets and financial liabilities 6,699 170 556
Other operating expenses 1,294 137 1,893
Total operating expenses 27,392 17,462 75,958
Personnel expenses -4,306 -3,527 -16,321
Other operating expenses -8,932 -7,094 -28,128
Depreciation, amortisations and impairment losses on tangible and intangible assets
-1,055 -655 -2,788
Total operating expenses -14,292 -11,286 -47,237
G11 Impairment losses on financial assets, net -1,205 -1,501 -3,746
Share of profit from associated companies -3 - -
Profit before taxes 11,892 4,675 24,976
Income taxes -1,103 -1,184 -4,653
Profit for the accounting period 10,789 3,492 20,322
Of which:
Shareholders of Oma Savings Bank Plc 10,791 3,490 20,203
Non-controlling interest -3 2 119
Total 10,789 3,492 20,322
Earnings per share (EPS), euro 0.36 0.14 0.78
Financial statements tables

16 Interim Report 31 March 2019
Profit before taxes excluding items affecting comparability: 1-3/2019 1-3/2018 1-12/2018
Profit before taxes 11,892 4,675 24,976
Operating income:
Listing expenses, fee and commission expenses 1,549
Net income on financial assets and financial liabilities -6,699 -170 -556
Operating expenses
Listing expenses, Other operating expenses 241
Comparable profit before taxes 5,193 4,505 26,210
Income taxes in the income statement -1,103 -1,184 -4,653
Change in deferred income tax 40 34 -247
Comparable profit/loss for the accounting period 4,129 3,355 21,310
The net interest income on financial assets and liabilities is detailed in Note G10 of the Financal Statement Bulletin. The costs of listing are recorded in two items: Fee and operating expenses. The cost of listing was EUR 1.8 million.
17 Interim Report 31 March 2019
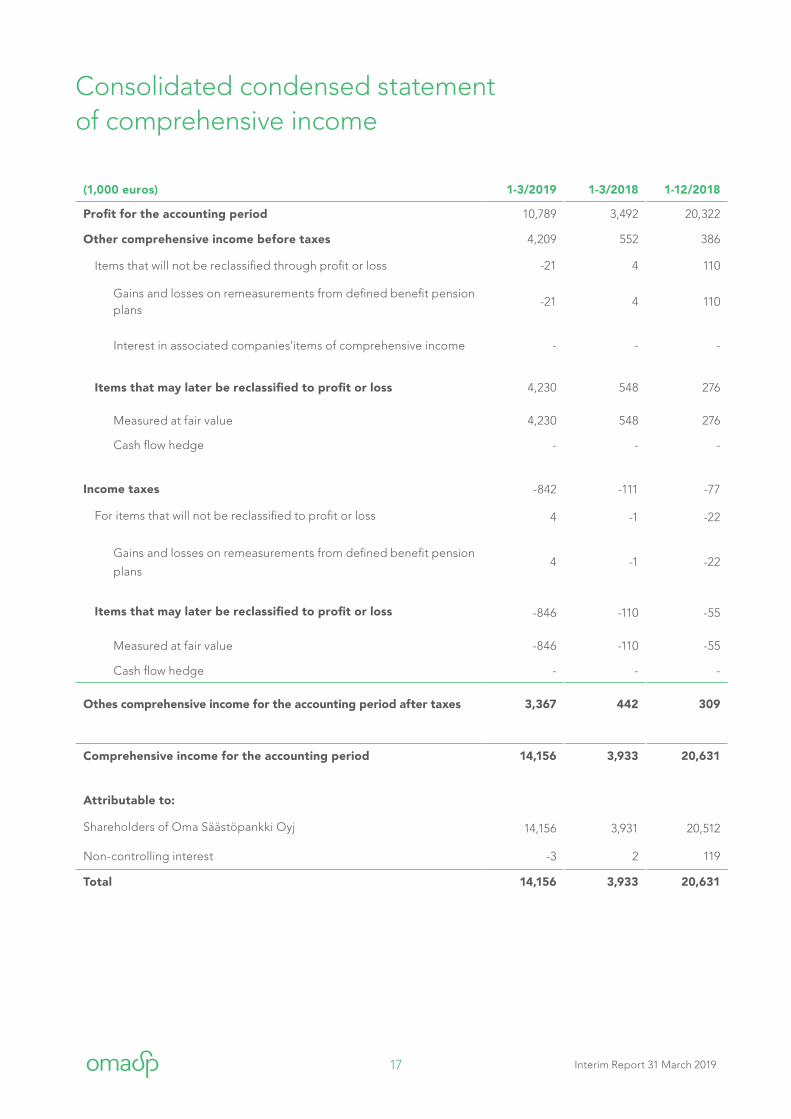
(1,000 euros) 1-3/2019 1-3/2018 1-12/2018
Profit for the accounting period 10,789 3,492 20,322
Other comprehensive income before taxes 4,209 552 386
Items that will not be reclassified through profit or loss -21 4 110
Gains and losses on remeasurements from defined benefit pension plans
-21 4 110
Interest in associated companies'items of comprehensive income - - -
Items that may later be reclassified to profit or loss 4,230 548 276
Measured at fair value 4,230 548 276
Cash flow hedge - - -
Income taxes -842 -111 -77
For items that will not be reclassified to profit or loss 4 -1 -22
Gains and losses on remeasurements from defined benefit pension
plans4 -1 -22
Items that may later be reclassified to profit or loss -846 -110 -55
Measured at fair value -846 -110 -55
Cash flow hedge - - -
Othes comprehensive income for the accounting period after taxes 3,367 442 309
Comprehensive income for the accounting period 14,156 3,933 20,631
Attributable to:
Shareholders of Oma Säästöpankki Oyj 14,156 3,931 20,512
Non-controlling interest -3 2 119
Total 14,156 3,933 20,631
Consolidated condensed statement of comprehensive income
18 Interim Report 31 March 2019
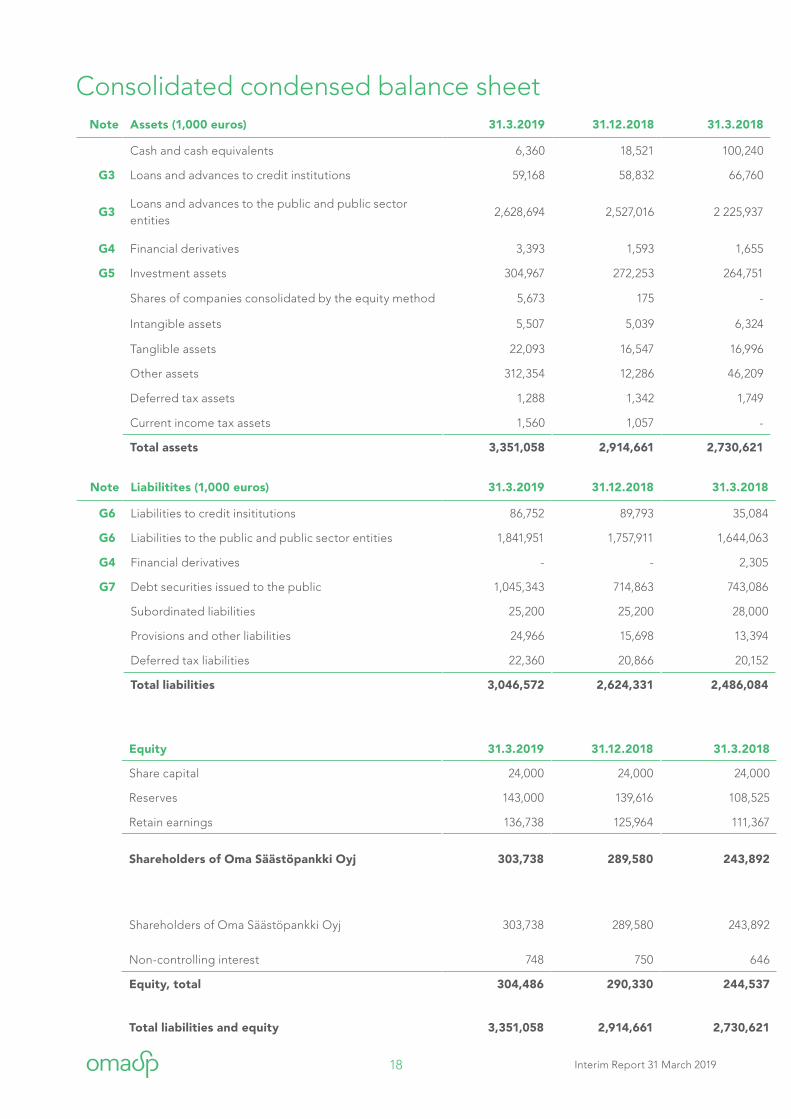
Consolidated condensed balance sheetNote Assets (1,000 euros) 31.3.2019 31.12.2018 31.3.2018
Cash and cash equivalents 6,360 18,521 100,240
G3 Loans and advances to credit institutions 59,168 58,832 66,760
G3Loans and advances to the public and public sector entities
2,628,694 2,527,016 2 225,937
G4 Financial derivatives 3,393 1,593 1,655
G5 Investment assets 304,967 272,253 264,751
Shares of companies consolidated by the equity method 5,673 175 -
Intangible assets 5,507 5,039 6,324
Tanglible assets 22,093 16,547 16,996
Other assets 312,354 12,286 46,209
Deferred tax assets 1,288 1,342 1,749
Current income tax assets 1,560 1,057 -
Total assets 3,351,058 2,914,661 2,730,621
Note Liabilitites (1,000 euros) 31.3.2019 31.12.2018 31.3.2018
G6 Liabilities to credit insititutions 86,752 89,793 35,084
G6 Liabilities to the public and public sector entities 1,841,951 1,757,911 1,644,063
G4 Financial derivatives - - 2,305
G7 Debt securities issued to the public 1,045,343 714,863 743,086
Subordinated liabilities 25,200 25,200 28,000
Provisions and other liabilities 24,966 15,698 13,394
Deferred tax liabilities 22,360 20,866 20,152
Total liabilities 3,046,572 2,624,331 2,486,084
Equity 31.3.2019 31.12.2018 31.3.2018
Share capital 24,000 24,000 24,000
Reserves 143,000 139,616 108,525
Retain earnings 136,738 125,964 111,367
Shareholders of Oma Säästöpankki Oyj 303,738 289,580 243,892
Shareholders of Oma Säästöpankki Oyj 303,738 289,580 243,892
Non-controlling interest 748 750 646
Equity, total 304,486 290,330 244,537
Total liabilities and equity 3,351,058 2,914,661 2,730,621
19 Interim Report 31 March 2019
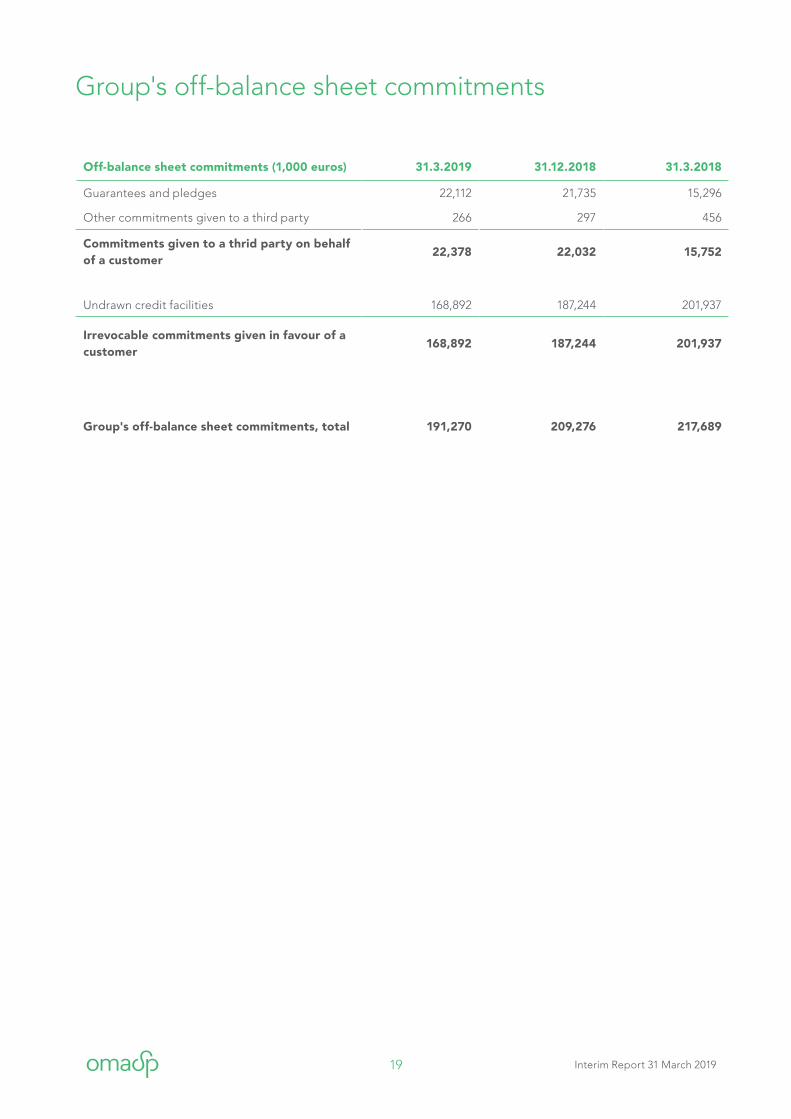
Off-balance sheet commitments (1,000 euros) 31.3.2019 31.12.2018 31.3.2018
Guarantees and pledges 22,112 21,735 15,296
Other commitments given to a third party 266 297 456
Commitments given to a thrid party on behalf of a customer
22,378 22,032 15,752
Undrawn credit facilities 168,892 187,244 201,937
Irrevocable commitments given in favour of a customer
168,892 187,244 201,937
Group's off-balance sheet commitments, total 191,270 209,276 217,689
Group's off-balance sheet commitments
20 Interim Report 31 March 2019
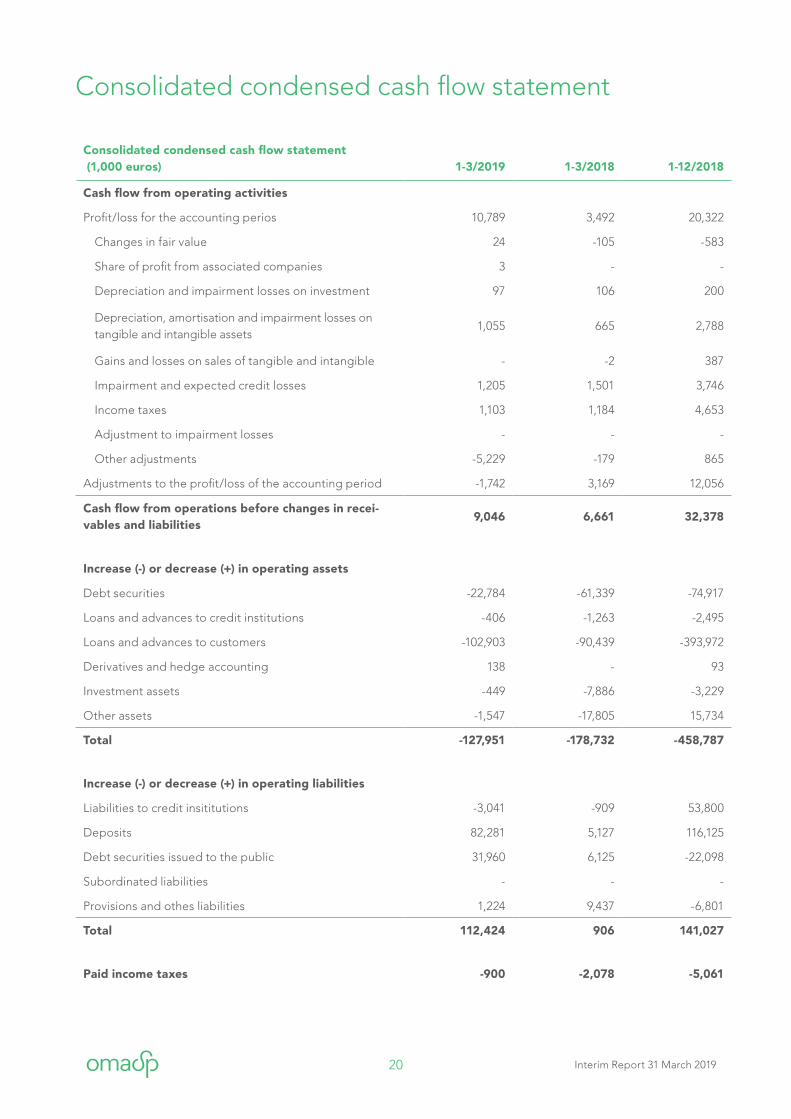
Consolidated condensed cash flow statement (1,000 euros) 1-3/2019 1-3/2018 1-12/2018
Cash flow from operating activities
Profit/loss for the accounting perios 10,789 3,492 20,322
Changes in fair value 24 -105 -583
Share of profit from associated companies 3 - -
Depreciation and impairment losses on investment 97 106 200
Depreciation, amortisation and impairment losses on tangible and intangible assets
1,055 665 2,788
Gains and losses on sales of tangible and intangible - -2 387
Impairment and expected credit losses 1,205 1,501 3,746
Income taxes 1,103 1,184 4,653
Adjustment to impairment losses - - -
Other adjustments -5,229 -179 865
Adjustments to the profit/loss of the accounting period -1,742 3,169 12,056
Cash flow from operations before changes in recei-vables and liabilities
9,046 6,661 32,378
Increase (-) or decrease (+) in operating assets
Debt securities -22,784 -61,339 -74,917
Loans and advances to credit institutions -406 -1,263 -2,495
Loans and advances to customers -102,903 -90,439 -393,972
Derivatives and hedge accounting 138 - 93
Investment assets -449 -7,886 -3,229
Other assets -1,547 -17,805 15,734
Total -127,951 -178,732 -458,787
Increase (-) or decrease (+) in operating liabilities
Liabilities to credit insititutions -3,041 -909 53,800
Deposits 82,281 5,127 116,125
Debt securities issued to the public 31,960 6,125 -22,098
Subordinated liabilities - - -
Provisions and othes liabilities 1,224 9,437 -6,801
Total 112,424 906 141,027
Paid income taxes -900 -2,078 -5,061
Consolidated condensed cash flow statement
21 Interim Report 31 March 2019
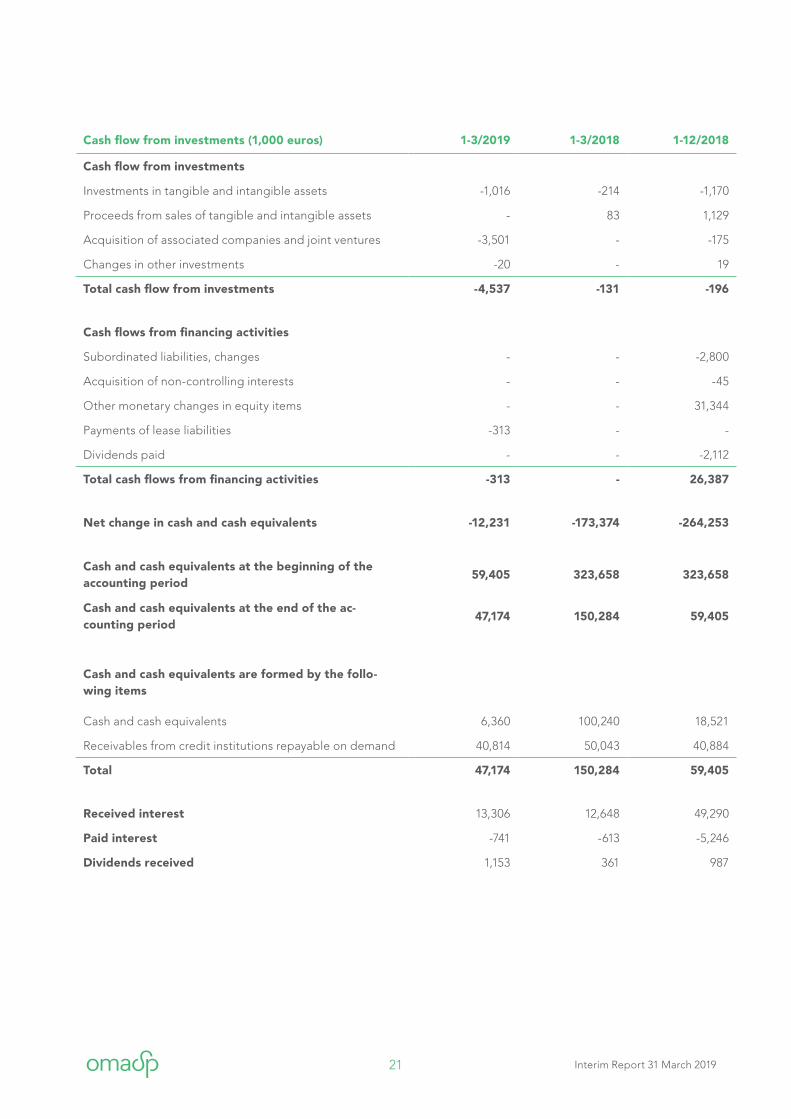
Cash flow from investments (1,000 euros) 1-3/2019 1-3/2018 1-12/2018
Cash flow from investments
Investments in tangible and intangible assets -1,016 -214 -1,170
Proceeds from sales of tangible and intangible assets - 83 1,129
Acquisition of associated companies and joint ventures -3,501 - -175
Changes in other investments -20 - 19
Total cash flow from investments -4,537 -131 -196
Cash flows from financing activities
Subordinated liabilities, changes - - -2,800
Acquisition of non-controlling interests - - -45
Other monetary changes in equity items - - 31,344
Payments of lease liabilities -313 - -
Dividends paid - - -2,112
Total cash flows from financing activities -313 - 26,387
Net change in cash and cash equivalents -12,231 -173,374 -264,253
Cash and cash equivalents at the beginning of the accounting period
59,405 323,658 323,658
Cash and cash equivalents at the end of the ac-counting period
47,174 150,284 59,405
Cash and cash equivalents are formed by the follo-wing items
Cash and cash equivalents 6,360 100,240 18,521
Receivables from credit institutions repayable on demand 40,814 50,043 40,884
Total 47,174 150,284 59,405
Received interest 13,306 12,648 49,290
Paid interest -741 -613 -5,246
Dividends received 1,153 361 987
22 Interim Report 31 March 2019
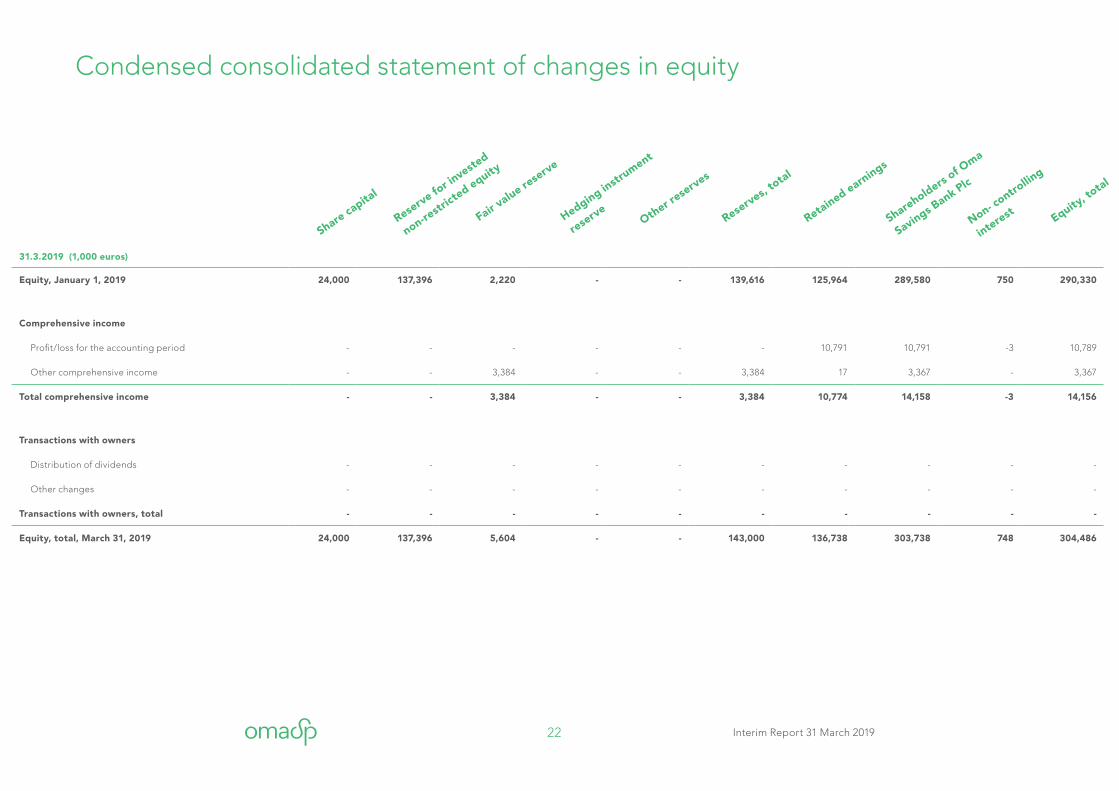
31.3.2019 (1,000 euros)
Equity, January 1, 2019 24,000 137,396 2,220 - - 139,616 125,964 289,580 750 290,330
Comprehensive income
Profit/loss for the accounting period - - - - - - 10,791 10,791 -3 10,789
Other comprehensive income - - 3,384 - - 3,384 17 3,367 - 3,367
Total comprehensive income - - 3,384 - - 3,384 10,774 14,158 -3 14,156
Transactions with owners
Distribution of dividends - - - - - - - - - -
Other changes - - - - - - - - - -
Transactions with owners, total - - - - - - - - - -
Equity, total, March 31, 2019 24,000 137,396 5,604 - - 143,000 136,738 303,738 748 304,486
Share capita
l
Reserve fo
r investe
d
non-restr
icted equity
Fair value re
serve
Hedging instr
ument
reserve
Other rese
rves
Reserves,
total
Retained earnings
Shareholders of O
ma
Savings Bank Plc
Non- contro
lling
interest Equity, to
tal
Condensed consolidated statement of changes in equity
23 Interim Report 31 March 2019
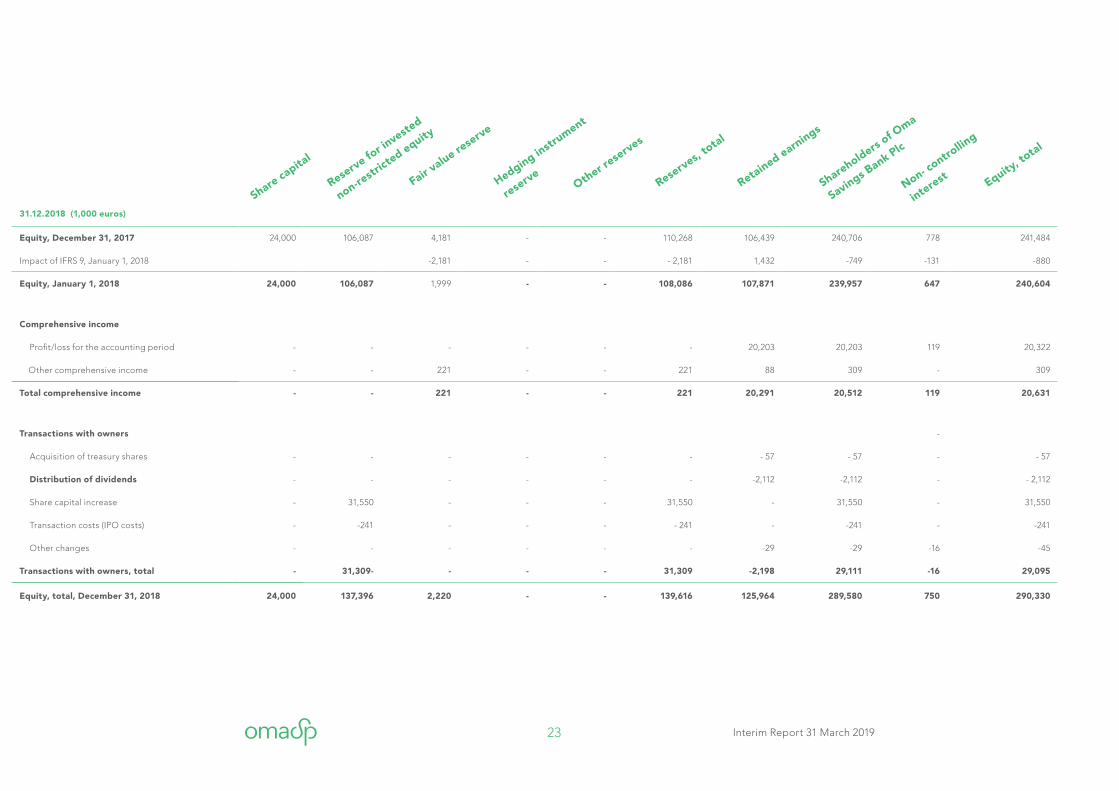
31.12.2018 (1,000 euros)
Equity, December 31, 2017 24,000 106,087 4,181 - - 110,268 106,439 240,706 778 241,484
Impact of IFRS 9, January 1, 2018 -2,181 - - - 2,181 1,432 -749 -131 -880
Equity, January 1, 2018 24,000 106,087 1,999 - - 108,086 107,871 239,957 647 240,604
Comprehensive income
Profit/loss for the accounting period - - - - - - 20,203 20,203 119 20,322
Other comprehensive income - - 221 - - 221 88 309 - 309
Total comprehensive income - - 221 - - 221 20,291 20,512 119 20,631
Transactions with owners -
Acquisition of treasury shares - - - - - - - 57 - 57 - - 57
Distribution of dividends - - - - - - -2,112 -2,112 - - 2,112
Share capital increase - 31,550 - - - 31,550 - 31,550 - 31,550
Transaction costs (IPO costs) - -241 - - - - 241 - -241 - -241
Other changes - - - - - - -29 -29 -16 -45
Transactions with owners, total - 31,309- - - - 31,309 -2,198 29,111 -16 29,095
Equity, total, December 31, 2018 24,000 137,396 2,220 - - 139,616 125,964 289,580 750 290,330
Share capita
l
Reserve fo
r investe
d
non-restr
icted equity
Fair value re
serve
Hedging instr
ument
reserve
Other rese
rves
Reserves,
total
Retained earnings
Shareholders of O
ma
Savings Bank Plc
Non- contro
lling
interest Equity, to
tal
24 Interim Report 31 March 2019
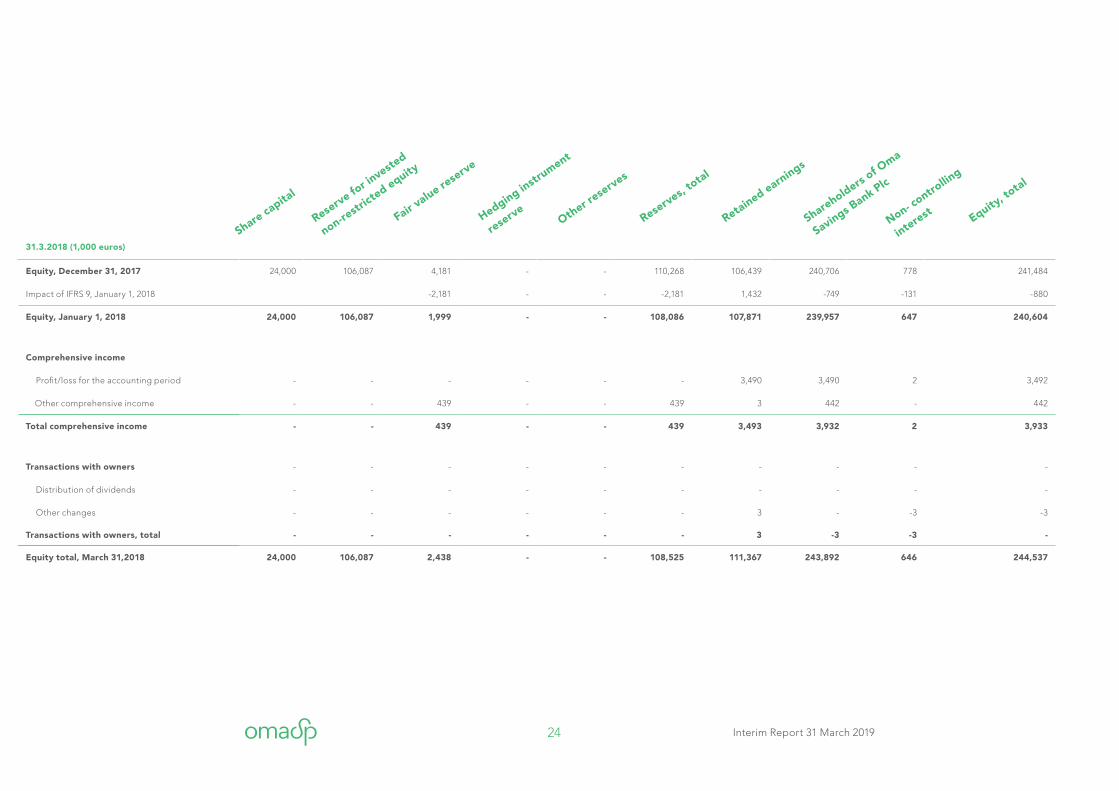
31.3.2018 (1,000 euros)
Equity, December 31, 2017 24,000 106,087 4,181 - - 110,268 106,439 240,706 778 241,484
Impact of IFRS 9, January 1, 2018 -2,181 - - -2,181 1,432 -749 -131 -880
Equity, January 1, 2018 24,000 106,087 1,999 - - 108,086 107,871 239,957 647 240,604
Comprehensive income
Profit/loss for the accounting period - - - - - - 3,490 3,490 2 3,492
Other comprehensive income - - 439 - - 439 3 442 - 442
Total comprehensive income - - 439 - - 439 3,493 3,932 2 3,933
Transactions with owners - - - - - - - - - -
Distribution of dividends - - - - - - - - - -
Other changes - - - - - - 3 - -3 -3
Transactions with owners, total - - - - - - 3 -3 -3 -
Equity total, March 31,2018 24,000 106,087 2,438 - - 108,525 111,367 243,892 646 244,537
Share capita
l
Reserve fo
r investe
d
non-restr
icted equity
Fair value re
serve
Hedging instr
ument
reserve
Other rese
rves
Reserves,
total
Retained earnings
Shareholders of O
ma
Savings Bank Plc
Non- contro
lling
interest Equity, to
tal
25 Interim Report 31 March 2019
Financial statements notes
G1 Accounting principles
G2 Gategorisation on financial assets and liabilities
G3 Loans and other receivables
G4 Financial derivatives
G5 Investment assets
G6 Liabilities to public and public sector entities and liabilities to credit institutions
G7 Debit securities issued to the public
G8 Net interest income
G9 Fee and commission income and expenses
G10 Net income on financial assets and financial liabilities
G11 Impairment losses on financial assets
G12 Fair values in accordance with the valuation method
G13 Business combinations
G14 Leases
G15 Significant events since the interim report date
G16 Alternative performance measures and calculation of key figures
26 Interim Report 31 March 2019
1 About the accounting principles
The Group’s parent company is Oma Savings Bank
Plc, whose domicile is in Seinäjoki and head office is in
Lappeenranta, Valtakatu 32, 53100 Lappeenranta. A copy
of the financial statements and interim reports is available
on the Bank’s website at www.omasp.fi.
Oma Savings Bank Group comprises the parent compa-
ny Oma Savings Bank Plc, its two subsidiaries (real estate
company Lappeenrannan Säästökeskus, 100% holding,
and SAV-Rahoitus Oyj, 50.7% holding). The Group has an
associate company GT Invest Oy (holding 48.7%) and a
joint venture Paikallispankkien PP-Laskenta Oy (holding
25%).
The interim report is drawn up in accordance with the
IAS 34 Interim Financial Reporting standard. The
accounting principles for the interim report are the same
as in the 2018 financial statements, apart from the
changes resulting from the adoption of the IFRS 16 Leases
standard.
The interim report figures are presented in thousands
of euros unless otherwise specified. The figures in the
notes are rounded so the combined amount of single
figures may deviate from the figures presented in a table
or a calculation. The accounting and functional currency
of the Group and its companies is the euro.
The Board of Directors has approved the interim report
for 1 January–31 March 2019 in its meeting on 9 May 2019.
2 Leases
The Group has adopted IFRS 16 Leases standard for the
annual reporting period commencing 1 January 2019.
The standard replaces the IAS 17 standard and the
IFRIC 4 Determining Whether an Arrangement Contains
a Lease. In connection with the implementation, earlier
accounting periods have not been adjusted to
correspond with the new standard. The impacts of the
G1 Accounting principles for the interim report
standard implementation on the Group’s income
statement and balance sheet are detailed in note G14.
Leases in which the Group functions as the lessee are
entered in the balance sheet as lease liability and as a
right-of-use asset of equal size. The right-of-use assets
recognised in the Group’s balance sheet are related to
the leases on properties, flats and machines and
equipment. On the starting date of the lease, the
right-of-use asset is valued at acquisition cost, which
includes the amount of lease liability in accordance with
the initial value and any initial direct costs and the asset
item’s restoration costs and any rent paid by the starting
date of the lease, minus received incentives. A right-of-
use asset is amortised and interest on lease liability is
expensed. The amortisation is carried out during the
period between the starting date of the lease and the
earlier of the end of the right-of-use asset’s financially
useful life or the end of the lease term. The company’s
management has decided that the duration of offices’
permanent leases is five years.
At the start of the lease, the lease liability is the current
value of the rent to be paid during the lease term. When
a variable lease is based on the index or price, these are
taken into account in determining the lease liability. The
Group recognises the lease liability in later periods based
on the effective interest method. Rent consists of fixed
payments and variable lease payments, which depend on
the index. The Group applies IFRS 16’s exemptions and
recognises leases of no more than 12 months and
low-value assets as expenditure in equal instalments
during the lease term.
Oma Savings Bank Group, when functioning as the
lessor, does not have agreements that are classified as
finance leasing. Leases handled as operating leases are
recognised in equal instalments over the lease term in
the income statement item ‘Net income from investment
assets’ or ‘Other operating income’.
27 Interim Report 31 March 2019
3 Accounting principles for the financial statements requiring management’s discretion and factors of uncertainty related to estimates
Preparing this interim report in compliance with the
IFRS standards has required the Group’s management
to make certain estimates and assumptions that impact
the amounts of items presented in the interim report and
the information included in the accompanying notes.
The essential estimates by the management team relate
to the future and the material factors of uncertainty in
terms of the date of reporting. They are closely related
to, for example, the determination of fair value and the
impairment of financial assets, loans and other receivab-
les as well as tangible and intangible assets. Even though
the estimates are based on management’s best current
perception, it is possible that the results deviate from the
estimates used in the interim report.
Accounting principles requiring management’s discre-
tion and factors of uncertainty related to estimates have
not changed significantly compared to the 2018 financial
statements.
28 Interim Report 31 March 2019
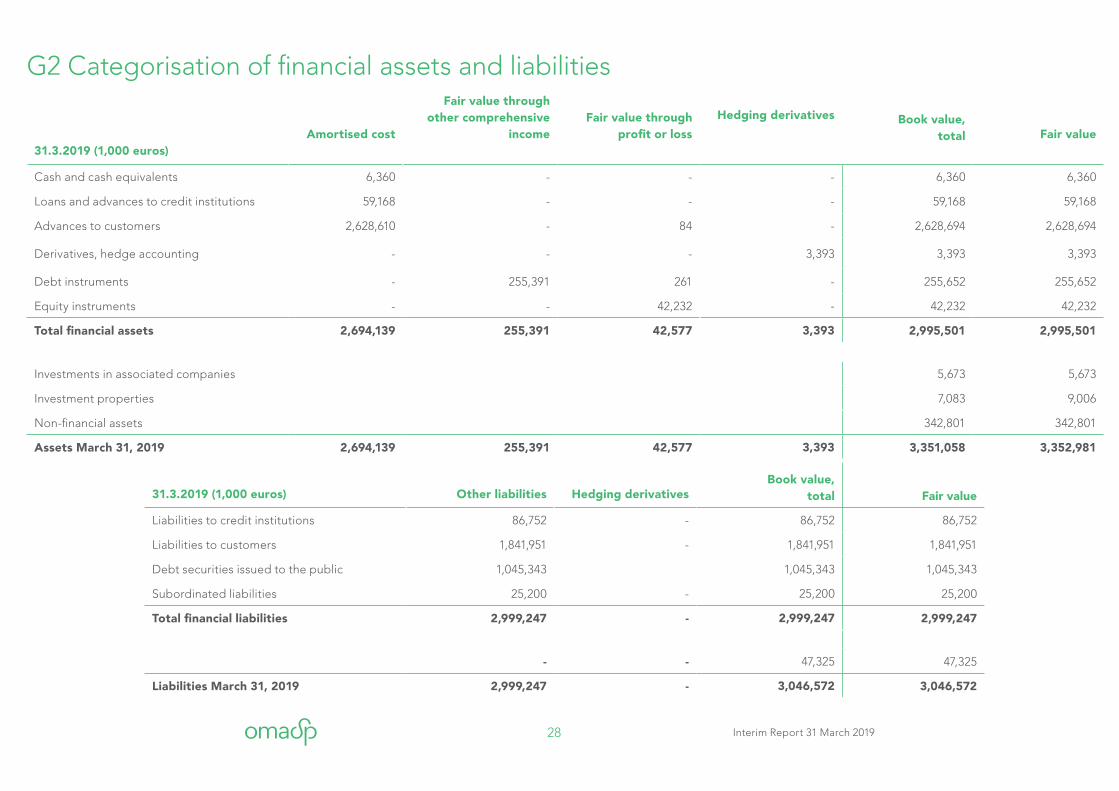
31.3.2019 (1,000 euros)Amortised cost
Fair value through other comprehensive
incomeFair value through
profit or loss
Hedging derivatives Book value, total Fair value
Cash and cash equivalents 6,360 - - - 6,360 6,360
Loans and advances to credit institutions 59,168 - - - 59,168 59,168
Advances to customers 2,628,610 - 84 - 2,628,694 2,628,694
Derivatives, hedge accounting - - - 3,393 3,393 3,393
Debt instruments - 255,391 261 - 255,652 255,652
Equity instruments - - 42,232 - 42,232 42,232
Total financial assets 2,694,139 255,391 42,577 3,393 2,995,501 2,995,501
Investments in associated companies 5,673 5,673
Investment properties 7,083 9,006
Non-financial assets 342,801 342,801
Assets March 31, 2019 2,694,139 255,391 42,577 3,393 3,351,058 3,352,981
31.3.2019 (1,000 euros) Other liabilities Hedging derivativesBook value,
total Fair value
Liabilities to credit institutions 86,752 - 86,752 86,752
Liabilities to customers 1,841,951 - 1,841,951 1,841,951
Debt securities issued to the public 1,045,343 1,045,343 1,045,343
Subordinated liabilities 25,200 - 25,200 25,200
Total financial liabilities 2,999,247 - 2,999,247 2,999,247
- - 47,325 47,325
Liabilities March 31, 2019 2,999,247 - 3,046,572 3,046,572
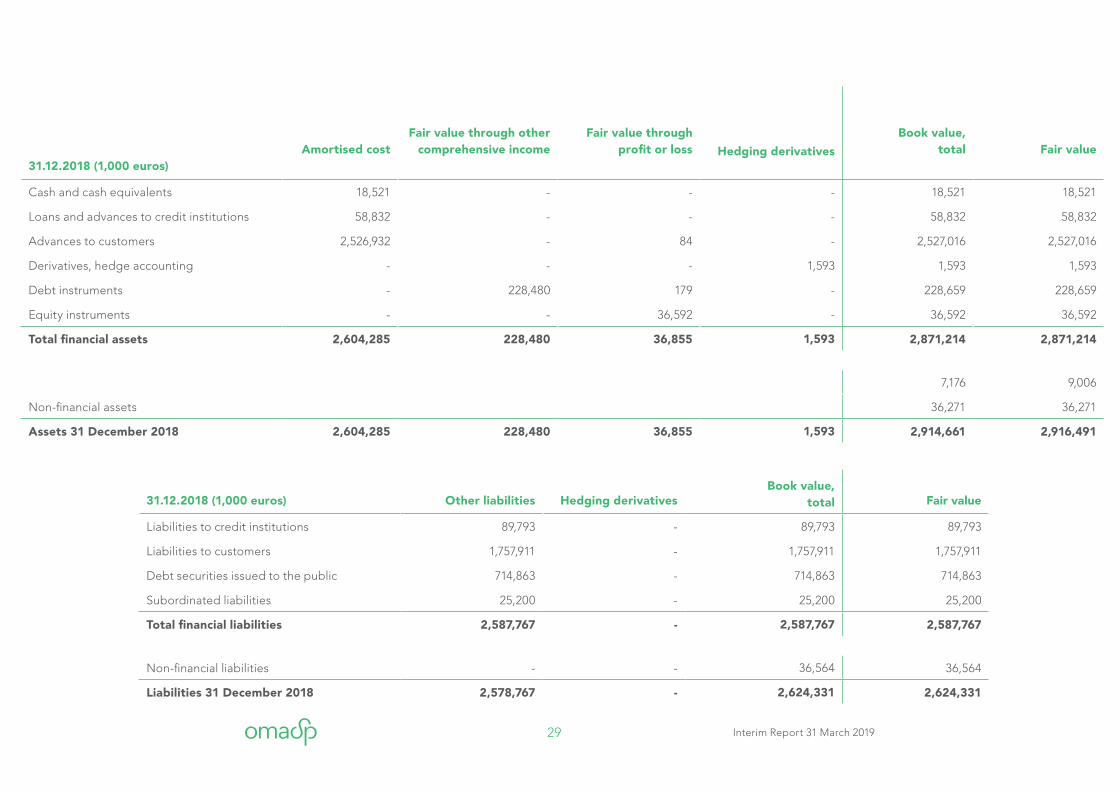
G2 Categorisation of financial assets and liabilities
29 Interim Report 31 March 2019
31.3.2019 (1,000 euros)Amortised cost
Fair value through other comprehensive
incomeFair value through
profit or loss
Hedging derivatives Book value, total Fair value
Cash and cash equivalents 6,360 - - - 6,360 6,360
Loans and advances to credit institutions 59,168 - - - 59,168 59,168
Advances to customers 2,628,610 - 84 - 2,628,694 2,628,694
Derivatives, hedge accounting - - - 3,393 3,393 3,393
Debt instruments - 255,391 261 - 255,652 255,652
Equity instruments - - 42,232 - 42,232 42,232
Total financial assets 2,694,139 255,391 42,577 3,393 2,995,501 2,995,501
Investments in associated companies 5,673 5,673
Investment properties 7,083 9,006
Non-financial assets 342,801 342,801
Assets March 31, 2019 2,694,139 255,391 42,577 3,393 3,351,058 3,352,981
31.12.2018 (1,000 euros)Amortised cost
Fair value through other comprehensive income
Fair value through profit or loss Hedging derivatives
Book value, total Fair value
Cash and cash equivalents 18,521 - - - 18,521 18,521
Loans and advances to credit institutions 58,832 - - - 58,832 58,832
Advances to customers 2,526,932 - 84 - 2,527,016 2,527,016
Derivatives, hedge accounting - - - 1,593 1,593 1,593
Debt instruments - 228,480 179 - 228,659 228,659
Equity instruments - - 36,592 - 36,592 36,592
Total financial assets 2,604,285 228,480 36,855 1,593 2,871,214 2,871,214
7,176 9,006
Non-financial assets 36,271 36,271
Assets 31 December 2018 2,604,285 228,480 36,855 1,593 2,914,661 2,916,491
31.12.2018 (1,000 euros) Other liabilities Hedging derivativesBook value,
total Fair value
Liabilities to credit institutions 89,793 - 89,793 89,793
Liabilities to customers 1,757,911 - 1,757,911 1,757,911
Debt securities issued to the public 714,863 - 714,863 714,863
Subordinated liabilities 25,200 - 25,200 25,200
Total financial liabilities 2,587,767 - 2,587,767 2,587,767
Non-financial liabilities - - 36,564 36,564
Liabilities 31 December 2018 2,578,767 - 2,624,331 2,624,331
30 Interim Report 31 March 2019
31.12.2018 (1,000 euros)Amortised cost
Fair value through other comprehensive income
Fair value through profit or loss Hedging derivatives
Book value, total Fair value
Cash and cash equivalents 18,521 - - - 18,521 18,521
Loans and advances to credit institutions 58,832 - - - 58,832 58,832
Advances to customers 2,526,932 - 84 - 2,527,016 2,527,016
Derivatives, hedge accounting - - - 1,593 1,593 1,593
Debt instruments - 228,480 179 - 228,659 228,659
Equity instruments - - 36,592 - 36,592 36,592
Total financial assets 2,604,285 228,480 36,855 1,593 2,871,214 2,871,214
7,176 9,006
Non-financial assets 36,271 36,271
Assets 31 December 2018 2,604,285 228,480 36,855 1,593 2,914,661 2,916,491
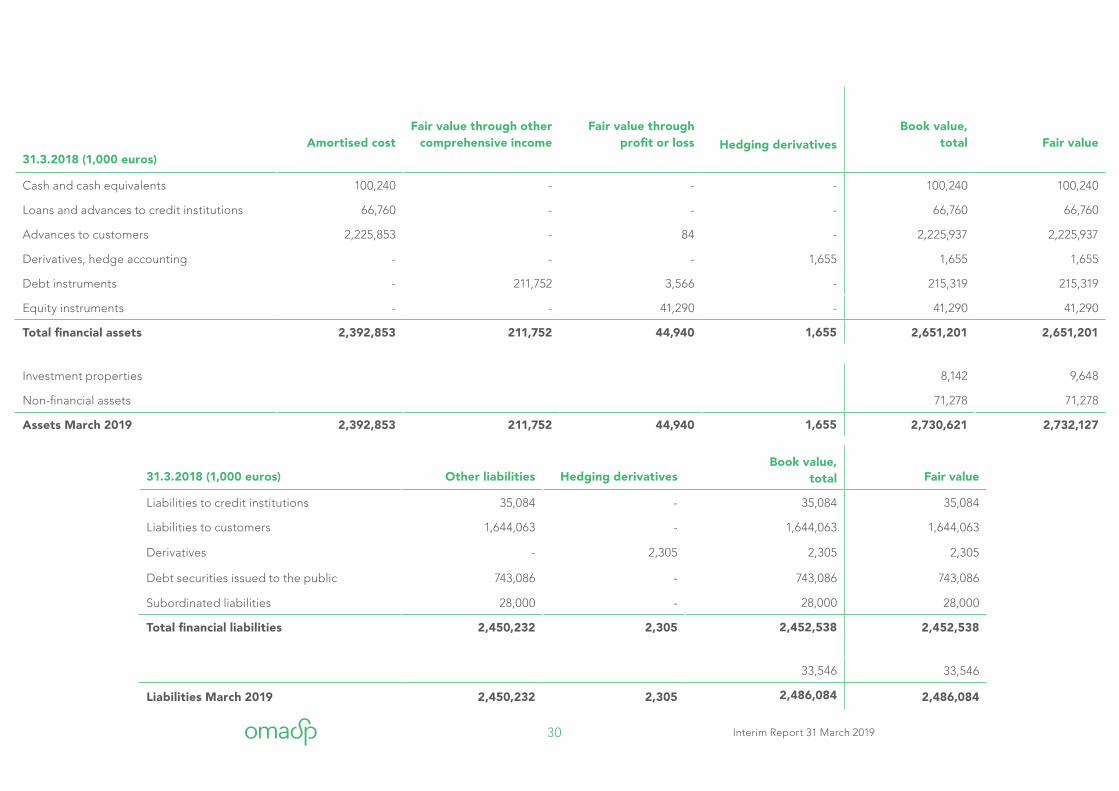
31.3.2018 (1,000 euros)Amortised cost
Fair value through other comprehensive income
Fair value through profit or loss Hedging derivatives
Book value, total Fair value
Cash and cash equivalents 100,240 - - - 100,240 100,240
Loans and advances to credit institutions 66,760 - - - 66,760 66,760
Advances to customers 2,225,853 - 84 - 2,225,937 2,225,937
Derivatives, hedge accounting - - - 1,655 1,655 1,655
Debt instruments - 211,752 3,566 - 215,319 215,319
Equity instruments - - 41,290 - 41,290 41,290
Total financial assets 2,392,853 211,752 44,940 1,655 2,651,201 2,651,201
Investment properties 8,142 9,648
Non-financial assets 71,278 71,278
Assets March 2019 2,392,853 211,752 44,940 1,655 2,730,621 2,732,127
31.3.2018 (1,000 euros) Other liabilities Hedging derivativesBook value,
total Fair value
Liabilities to credit institutions 35,084 - 35,084 35,084
Liabilities to customers 1,644,063 - 1,644,063 1,644,063
Derivatives - 2,305 2,305 2,305
Debt securities issued to the public 743,086 - 743,086 743,086
Subordinated liabilities 28,000 - 28,000 28,000
Total financial liabilities 2,450,232 2,305 2,452,538 2,452,538
33,546 33,546
Liabilities March 2019 2,450,232 2,305 2,486,084 2,486,084
31 Interim Report 31 March 2019
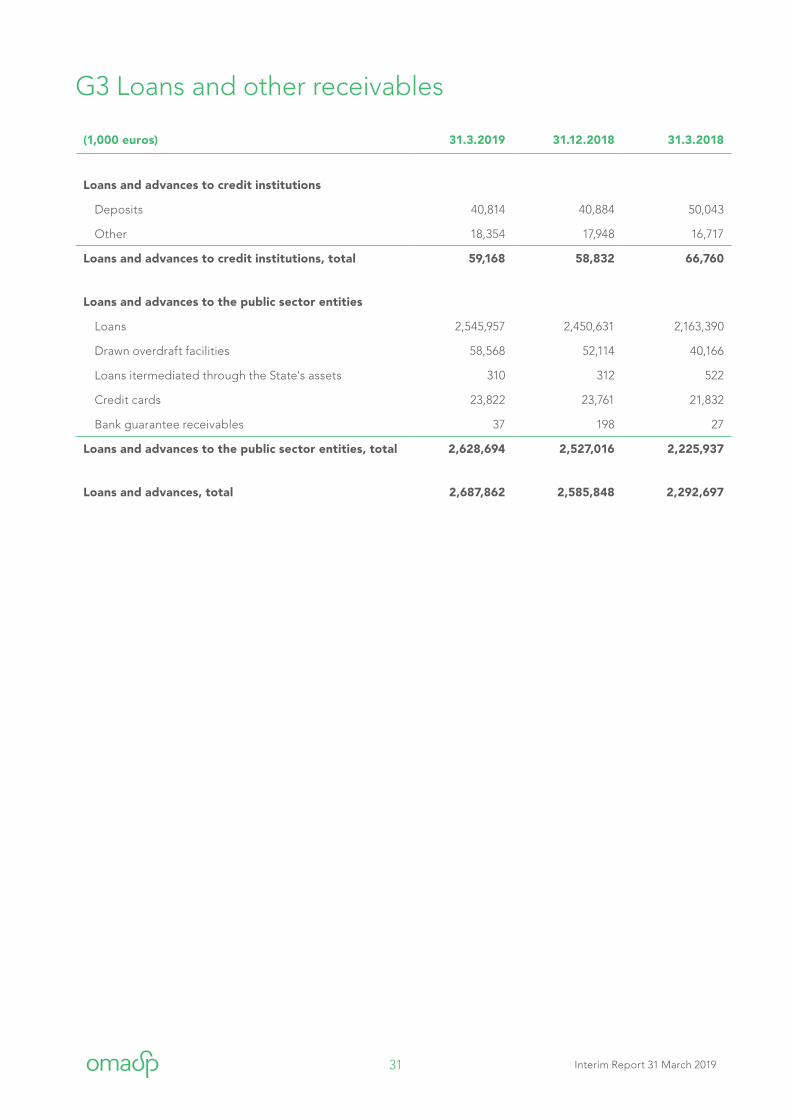
(1,000 euros) 31.3.2019 31.12.2018 31.3.2018
Loans and advances to credit institutions
Deposits 40,814 40,884 50,043
Other 18,354 17,948 16,717
Loans and advances to credit institutions, total 59,168 58,832 66,760
Loans and advances to the public sector entities
Loans 2,545,957 2,450,631 2,163,390
Drawn overdraft facilities 58,568 52,114 40,166
Loans itermediated through the State's assets 310 312 522
Credit cards 23,822 23,761 21,832
Bank guarantee receivables 37 198 27
Loans and advances to the public sector entities, total 2,628,694 2,527,016 2,225,937
Loans and advances, total 2,687,862 2,585,848 2,292,697
G3 Loans and other receivables
32 Interim Report 31 March 2019
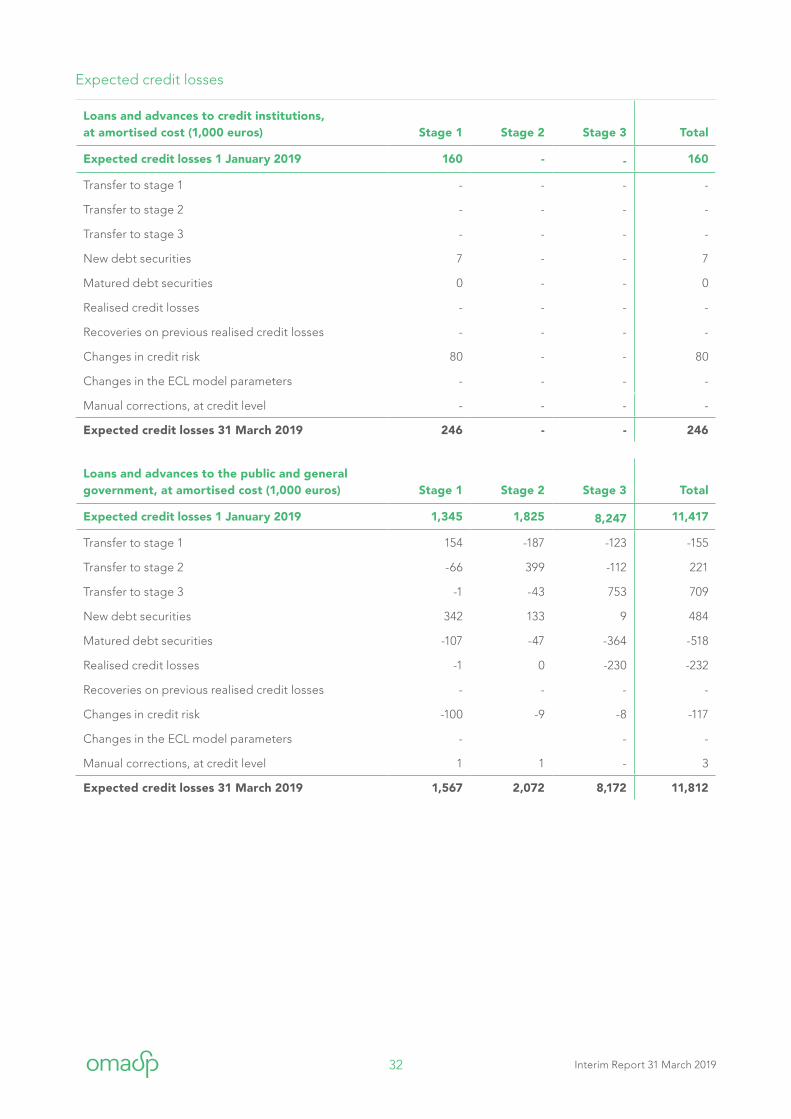
Loans and advances to credit institutions, at amortised cost (1,000 euros) Stage 1 Stage 2 Stage 3 Total
Expected credit losses 1 January 2019 160 - - 160
Transfer to stage 1 - - - -
Transfer to stage 2 - - - -
Transfer to stage 3 - - - -
New debt securities 7 - - 7
Matured debt securities 0 - - 0
Realised credit losses - - - -
Recoveries on previous realised credit losses - - - -
Changes in credit risk 80 - - 80
Changes in the ECL model parameters - - - -
Manual corrections, at credit level - - - -
Expected credit losses 31 March 2019 246 - - 246
Loans and advances to the public and general government, at amortised cost (1,000 euros) Stage 1 Stage 2 Stage 3 Total
Expected credit losses 1 January 2019 1,345 1,825 8,247 11,417
Transfer to stage 1 154 -187 -123 -155
Transfer to stage 2 -66 399 -112 221
Transfer to stage 3 -1 -43 753 709
New debt securities 342 133 9 484
Matured debt securities -107 -47 -364 -518
Realised credit losses -1 0 -230 -232
Recoveries on previous realised credit losses - - - -
Changes in credit risk -100 -9 -8 -117
Changes in the ECL model parameters - - -
Manual corrections, at credit level 1 1 - 3
Expected credit losses 31 March 2019 1,567 2,072 8,172 11,812
Expected credit losses
33 Interim Report 31 March 2019
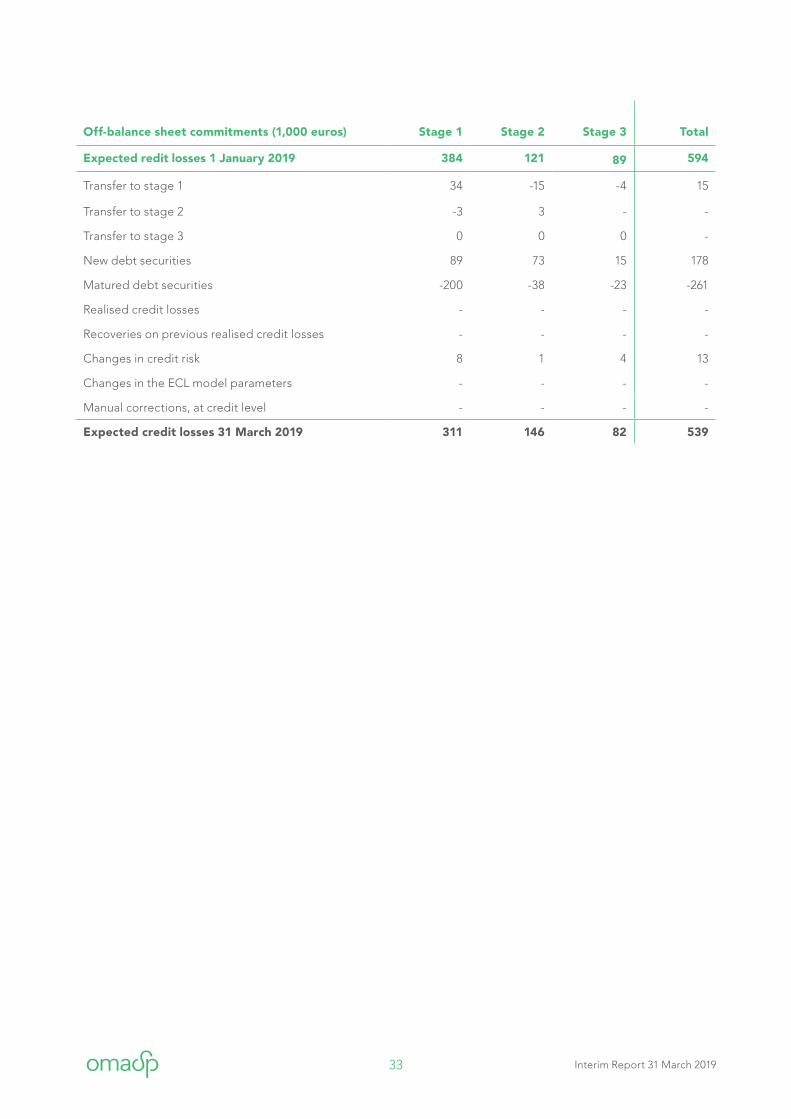
Off-balance sheet commitments (1,000 euros) Stage 1 Stage 2 Stage 3 Total
Expected redit losses 1 January 2019 384 121 89 594
Transfer to stage 1 34 -15 -4 15
Transfer to stage 2 -3 3 - -
Transfer to stage 3 0 0 0 -
New debt securities 89 73 15 178
Matured debt securities -200 -38 -23 -261
Realised credit losses - - - -
Recoveries on previous realised credit losses - - - -
Changes in credit risk 8 1 4 13
Changes in the ECL model parameters - - - -
Manual corrections, at credit level - - - -
Expected credit losses 31 March 2019 311 146 82 539
34 Interim Report 31 March 2019
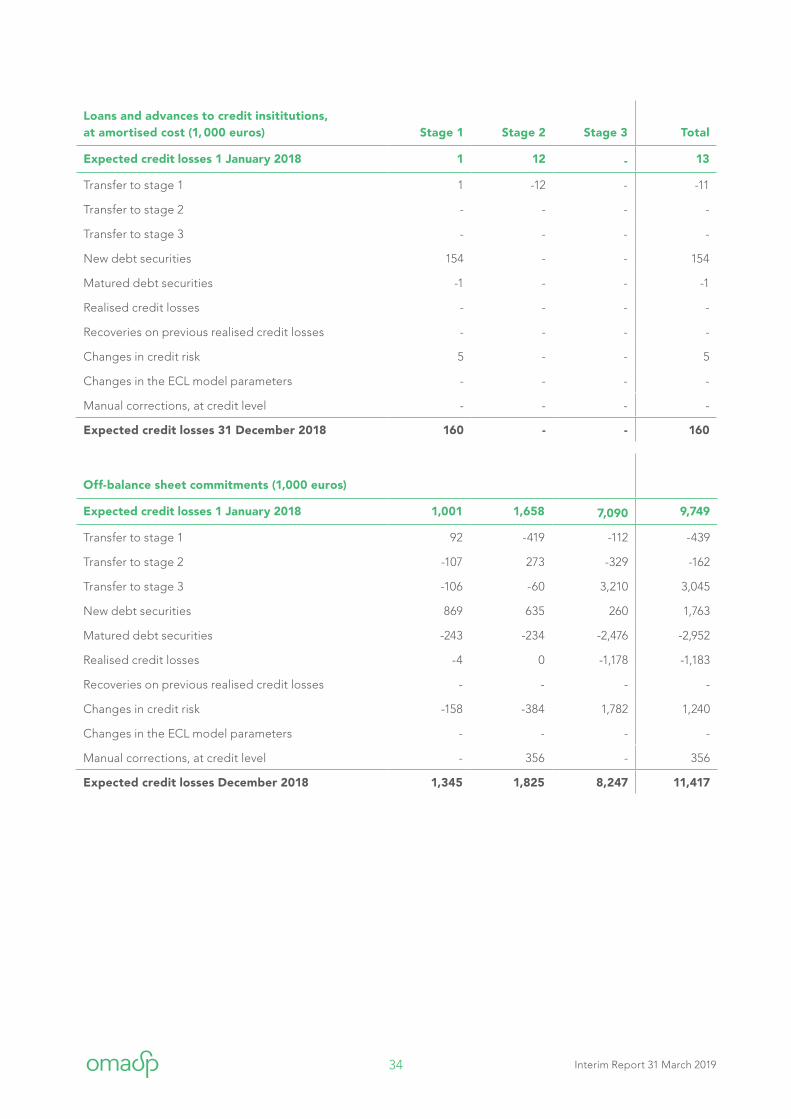
Loans and advances to credit insititutions, at amortised cost (1, 000 euros) Stage 1 Stage 2 Stage 3 Total
Expected credit losses 1 January 2018 1 12 - 13
Transfer to stage 1 1 -12 - -11
Transfer to stage 2 - - - -
Transfer to stage 3 - - - -
New debt securities 154 - - 154
Matured debt securities -1 - - -1
Realised credit losses - - - -
Recoveries on previous realised credit losses - - - -
Changes in credit risk 5 - - 5
Changes in the ECL model parameters - - - -
Manual corrections, at credit level - - - -
Expected credit losses 31 December 2018 160 - - 160
Off-balance sheet commitments (1,000 euros)
Expected credit losses 1 January 2018 1,001 1,658 7,090 9,749
Transfer to stage 1 92 -419 -112 -439
Transfer to stage 2 -107 273 -329 -162
Transfer to stage 3 -106 -60 3,210 3,045
New debt securities 869 635 260 1,763
Matured debt securities -243 -234 -2,476 -2,952
Realised credit losses -4 0 -1,178 -1,183
Recoveries on previous realised credit losses - - - -
Changes in credit risk -158 -384 1,782 1,240
Changes in the ECL model parameters - - - -
Manual corrections, at credit level - 356 - 356
Expected credit losses December 2018 1,345 1,825 8,247 11,417
35 Interim Report 31 March 2019
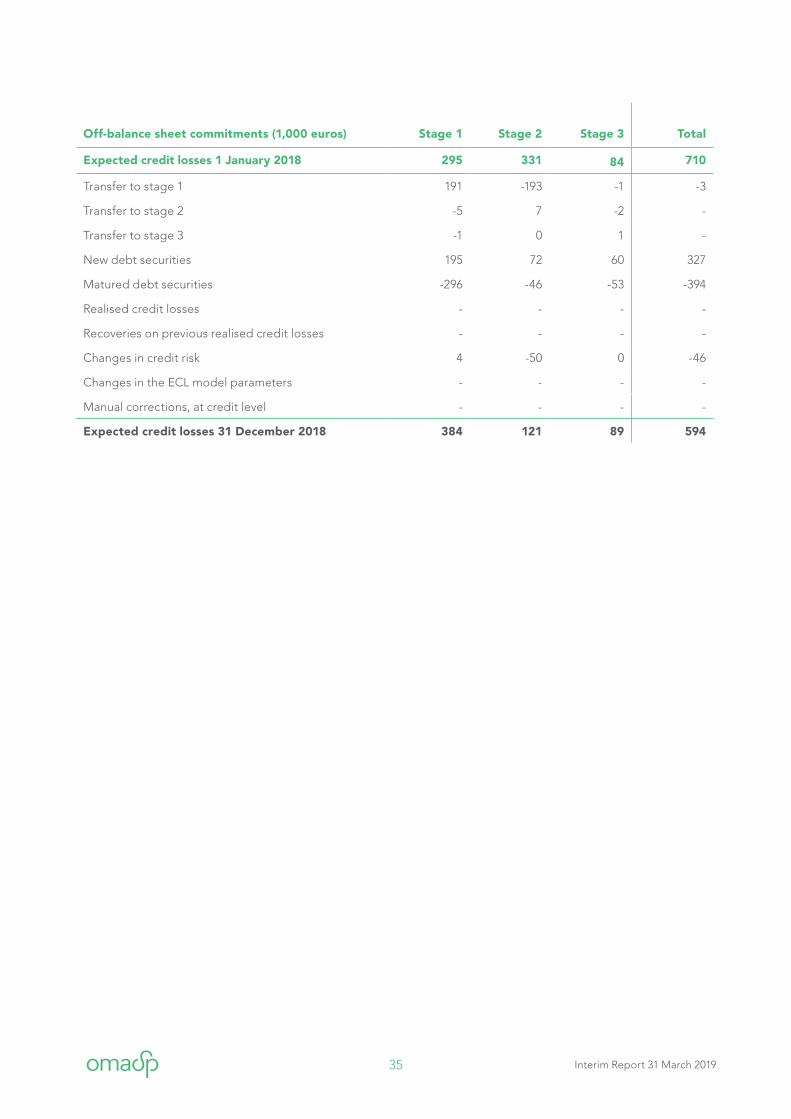
Off-balance sheet commitments (1,000 euros) Stage 1 Stage 2 Stage 3 Total
Expected credit losses 1 January 2018 295 331 84 710
Transfer to stage 1 191 -193 -1 -3
Transfer to stage 2 -5 7 -2 -
Transfer to stage 3 -1 0 1 -
New debt securities 195 72 60 327
Matured debt securities -296 -46 -53 -394
Realised credit losses - - - -
Recoveries on previous realised credit losses - - - -
Changes in credit risk 4 -50 0 -46
Changes in the ECL model parameters - - - -
Manual corrections, at credit level - - - -
Expected credit losses 31 December 2018 384 121 89 594
36 Interim Report 31 March 2019
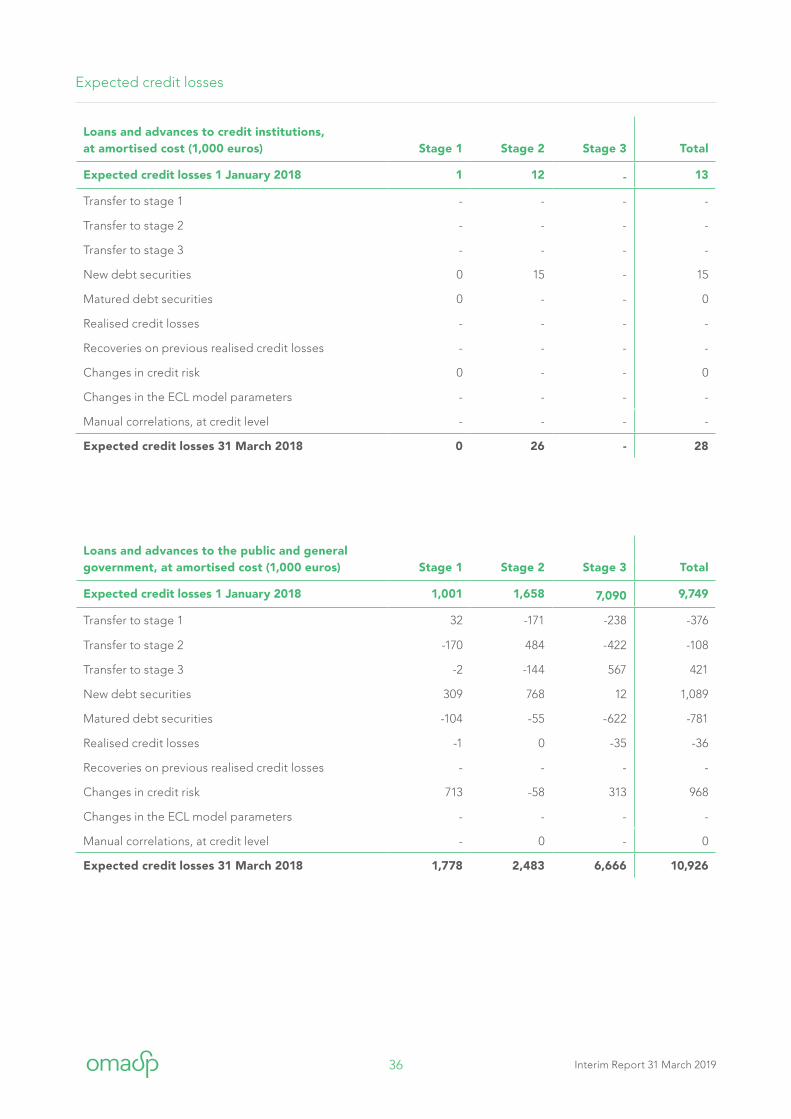
Loans and advances to credit institutions, at amortised cost (1,000 euros) Stage 1 Stage 2 Stage 3 Total
Expected credit losses 1 January 2018 1 12 - 13
Transfer to stage 1 - - - -
Transfer to stage 2 - - - -
Transfer to stage 3 - - - -
New debt securities 0 15 - 15
Matured debt securities 0 - - 0
Realised credit losses - - - -
Recoveries on previous realised credit losses - - - -
Changes in credit risk 0 - - 0
Changes in the ECL model parameters - - - -
Manual correlations, at credit level - - - -
Expected credit losses 31 March 2018 0 26 - 28
Loans and advances to the public and general government, at amortised cost (1,000 euros) Stage 1 Stage 2 Stage 3 Total
Expected credit losses 1 January 2018 1,001 1,658 7,090 9,749
Transfer to stage 1 32 -171 -238 -376
Transfer to stage 2 -170 484 -422 -108
Transfer to stage 3 -2 -144 567 421
New debt securities 309 768 12 1,089
Matured debt securities -104 -55 -622 -781
Realised credit losses -1 0 -35 -36
Recoveries on previous realised credit losses - - - -
Changes in credit risk 713 -58 313 968
Changes in the ECL model parameters - - - -
Manual correlations, at credit level - 0 - 0
Expected credit losses 31 March 2018 1,778 2,483 6,666 10,926
Expected credit losses
37 Interim Report 31 March 2019
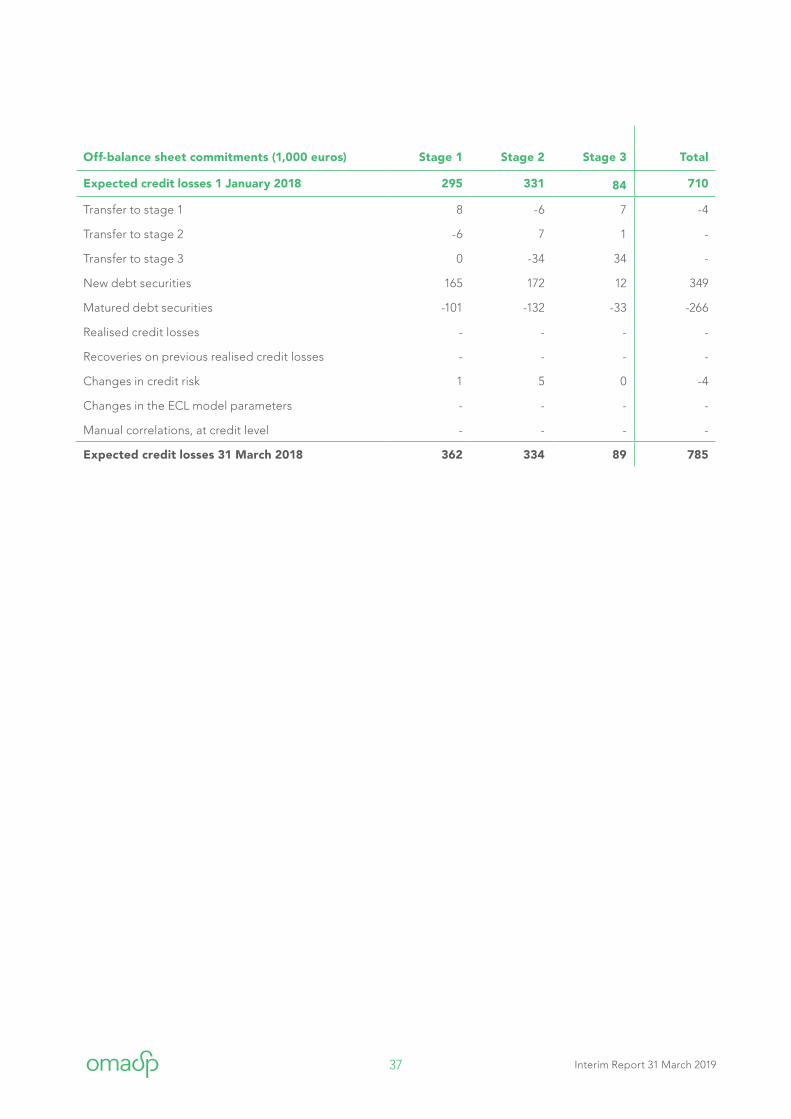
Off-balance sheet commitments (1,000 euros) Stage 1 Stage 2 Stage 3 Total
Expected credit losses 1 January 2018 295 331 84 710
Transfer to stage 1 8 -6 7 -4
Transfer to stage 2 -6 7 1 -
Transfer to stage 3 0 -34 34 -
New debt securities 165 172 12 349
Matured debt securities -101 -132 -33 -266
Realised credit losses - - - -
Recoveries on previous realised credit losses - - - -
Changes in credit risk 1 5 0 -4
Changes in the ECL model parameters - - - -
Manual correlations, at credit level - - - -
Expected credit losses 31 March 2018 362 334 89 785
38 Interim Report 31 March 2019
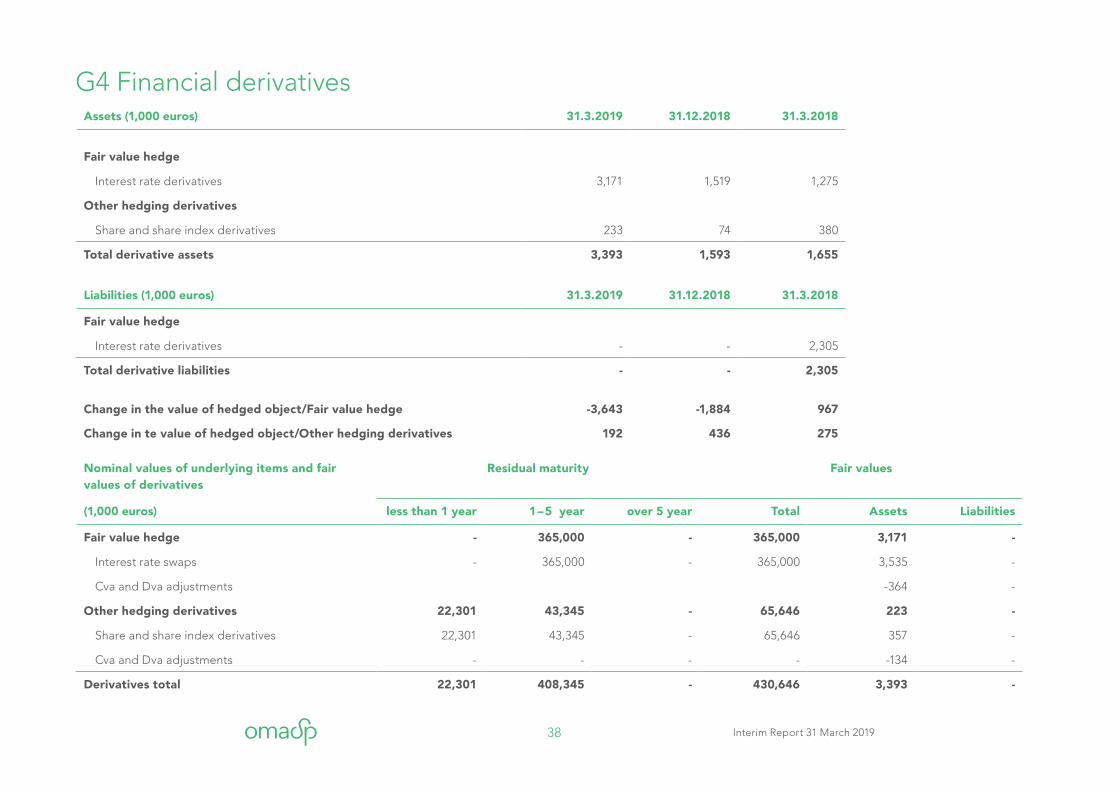
Nominal values of underlying items and fair values of derivatives
Residual maturity Fair values
(1,000 euros) less than 1 year 1 – 5 year over 5 year Total Assets Liabilities
Fair value hedge - 365,000 - 365,000 3,171 -
Interest rate swaps - 365,000 - 365,000 3,535 -
Cva and Dva adjustments -364 -
Other hedging derivatives 22,301 43,345 - 65,646 223 -
Share and share index derivatives 22,301 43,345 - 65,646 357 -
Cva and Dva adjustments - - - - -134 -
Derivatives total 22,301 408,345 - 430,646 3,393 -
Assets (1,000 euros) 31.3.2019 31.12.2018 31.3.2018
Fair value hedge
Interest rate derivatives 3,171 1,519 1,275
Other hedging derivatives
Share and share index derivatives 233 74 380
Total derivative assets 3,393 1,593 1,655
Liabilities (1,000 euros) 31.3.2019 31.12.2018 31.3.2018
Fair value hedge
Interest rate derivatives - - 2,305
Total derivative liabilities - - 2,305
Change in the value of hedged object/Fair value hedge -3,643 -1,884 967
Change in te value of hedged object/Other hedging derivatives 192 436 275
G4 Financial derivatives
39 Interim Report 31 March 2019
Nominal values of underlying items and fair values of derivatives
Residual maturity Fair values
(1,000 euros) less than 1 year 1 – 5 year over 5 year Total Assets Liabilities
Fair value hedge - 365,000 - 365,000 3,171 -
Interest rate swaps - 365,000 - 365,000 3,535 -
Cva and Dva adjustments -364 -
Other hedging derivatives 22,301 43,345 - 65,646 223 -
Share and share index derivatives 22,301 43,345 - 65,646 357 -
Cva and Dva adjustments - - - - -134 -
Derivatives total 22,301 408,345 - 430,646 3,393 -
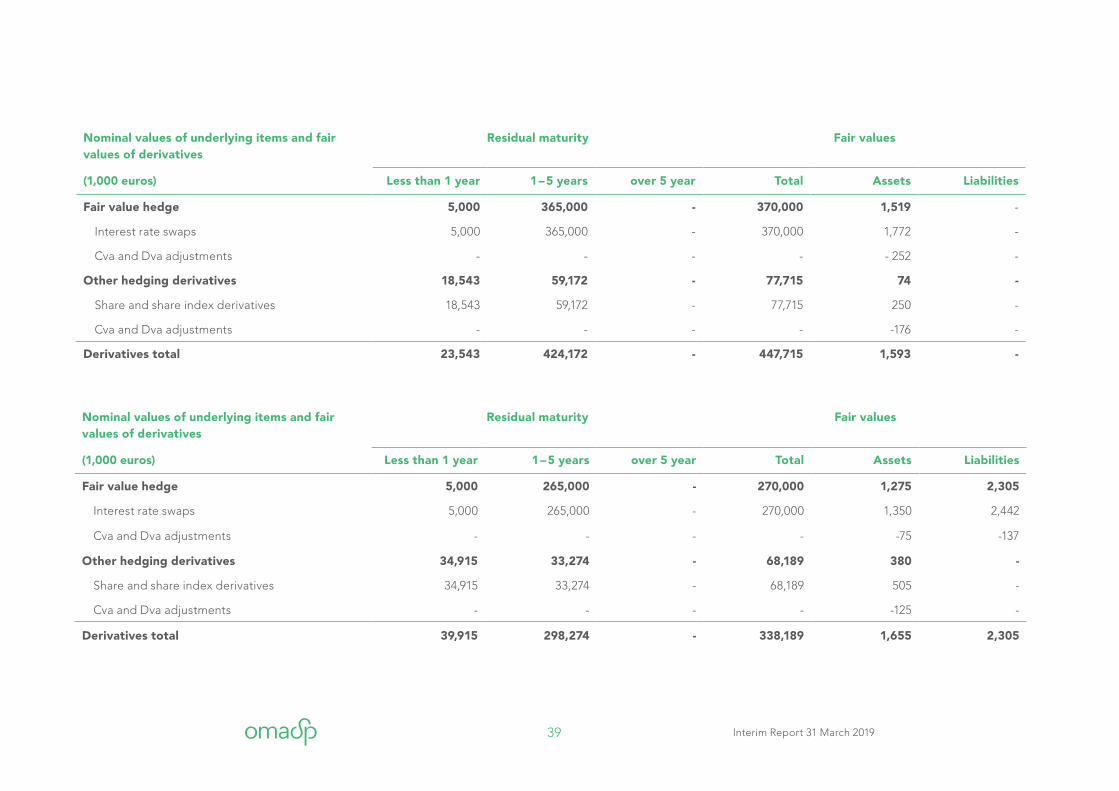
Nominal values of underlying items and fair values of derivatives
Residual maturity Fair values
(1,000 euros) Less than 1 year 1 – 5 years over 5 year Total Assets Liabilities
Fair value hedge 5,000 365,000 - 370,000 1,519 -
Interest rate swaps 5,000 365,000 - 370,000 1,772 -
Cva and Dva adjustments - - - - - 252 -
Other hedging derivatives 18,543 59,172 - 77,715 74 -
Share and share index derivatives 18,543 59,172 - 77,715 250 -
Cva and Dva adjustments - - - - -176 -
Derivatives total 23,543 424,172 - 447,715 1,593 -
Nominal values of underlying items and fair values of derivatives
Residual maturity Fair values
(1,000 euros) Less than 1 year 1 – 5 years over 5 year Total Assets Liabilities
Fair value hedge 5,000 265,000 - 270,000 1,275 2,305
Interest rate swaps 5,000 265,000 - 270,000 1,350 2,442
Cva and Dva adjustments - - - - -75 -137
Other hedging derivatives 34,915 33,274 - 68,189 380 -
Share and share index derivatives 34,915 33,274 - 68,189 505 -
Cva and Dva adjustments - - - - -125 -
Derivatives total 39,915 298,274 - 338,189 1,655 2,305
40 Interim Report 31 March 2019
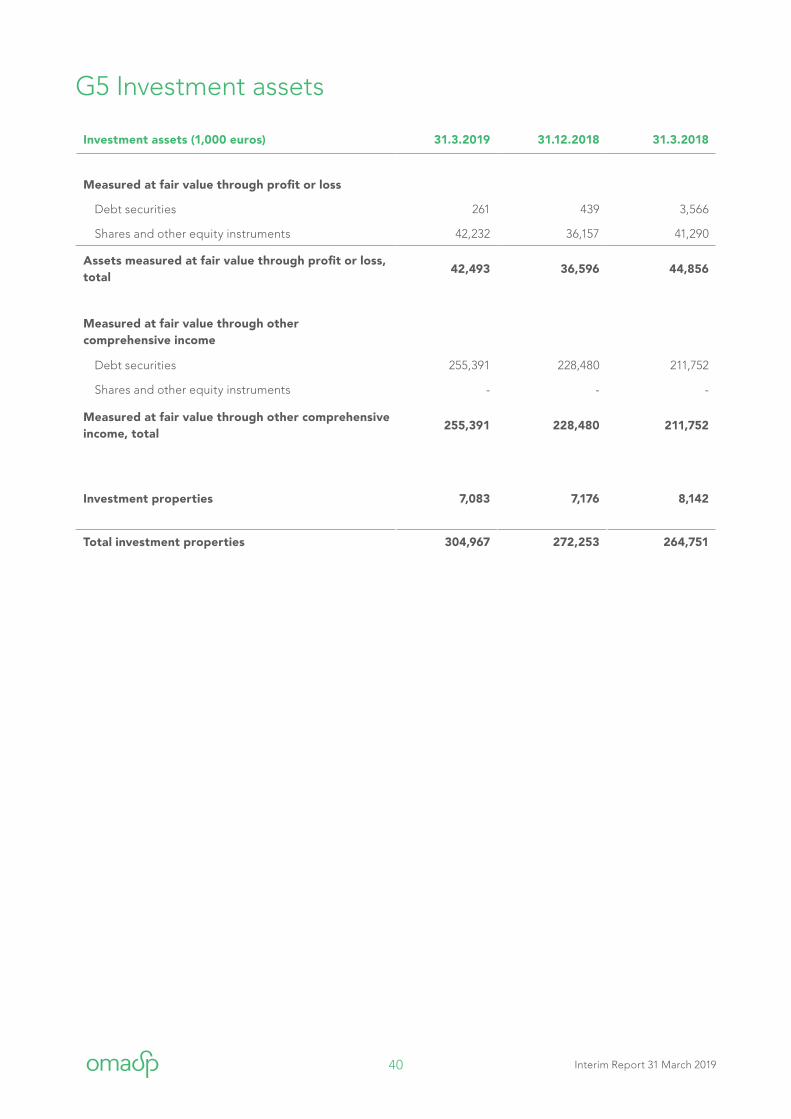
Investment assets (1,000 euros) 31.3.2019 31.12.2018 31.3.2018
Measured at fair value through profit or loss
Debt securities 261 439 3,566
Shares and other equity instruments 42,232 36,157 41,290
Assets measured at fair value through profit or loss, total
42,493 36,596 44,856
Measured at fair value through other comprehensive income
Debt securities 255,391 228,480 211,752
Shares and other equity instruments - - -
Measured at fair value through other comprehensive income, total
255,391 228,480 211,752
Investment properties 7,083 7,176 8,142
Total investment properties 304,967 272,253 264,751
G5 Investment assets
41 Interim Report 31 March 2019
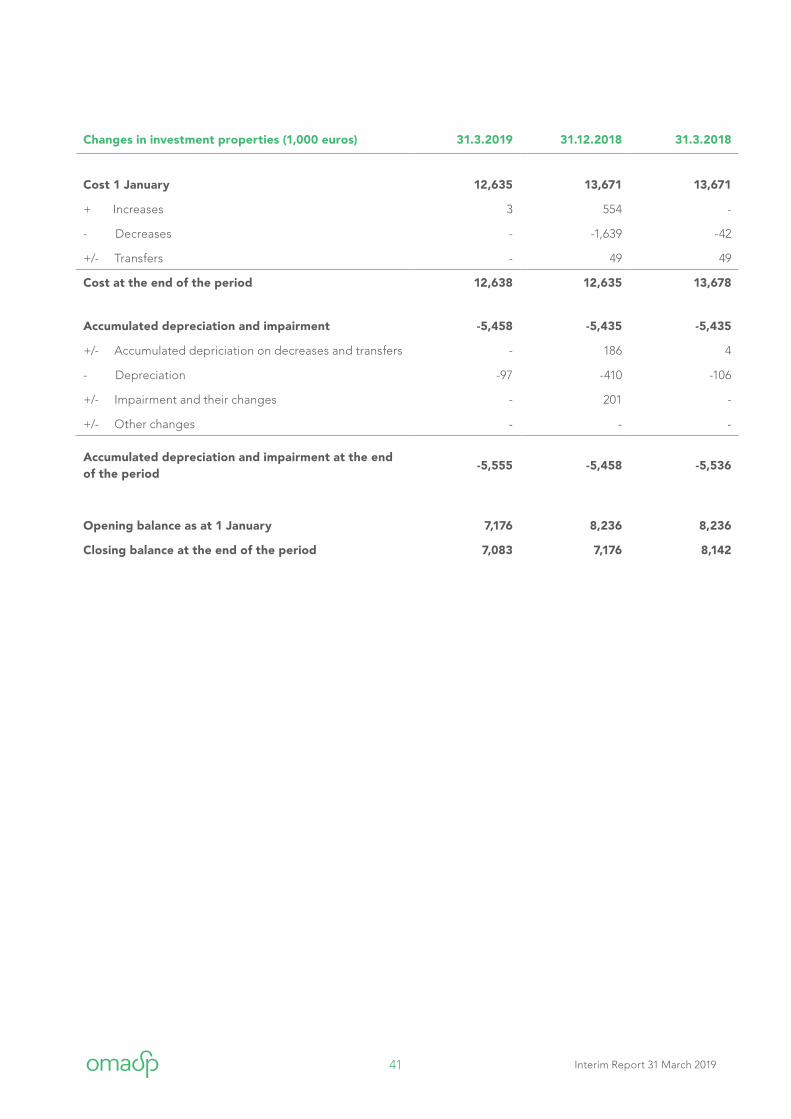
Changes in investment properties (1,000 euros) 31.3.2019 31.12.2018 31.3.2018
Cost 1 January 12,635 13,671 13,671
+ Increases 3 554 -
- Decreases - -1,639 -42
+/- Transfers - 49 49
Cost at the end of the period 12,638 12,635 13,678
Accumulated depreciation and impairment -5,458 -5,435 -5,435
+/- Accumulated depriciation on decreases and transfers - 186 4
- Depreciation -97 -410 -106
+/- Impairment and their changes - 201 -
+/- Other changes - - -
Accumulated depreciation and impairment at the end of the period
-5,555 -5,458 -5,536
Opening balance as at 1 January 7,176 8,236 8,236
Closing balance at the end of the period 7,083 7,176 8,142
42 Interim Report 31 March 2019
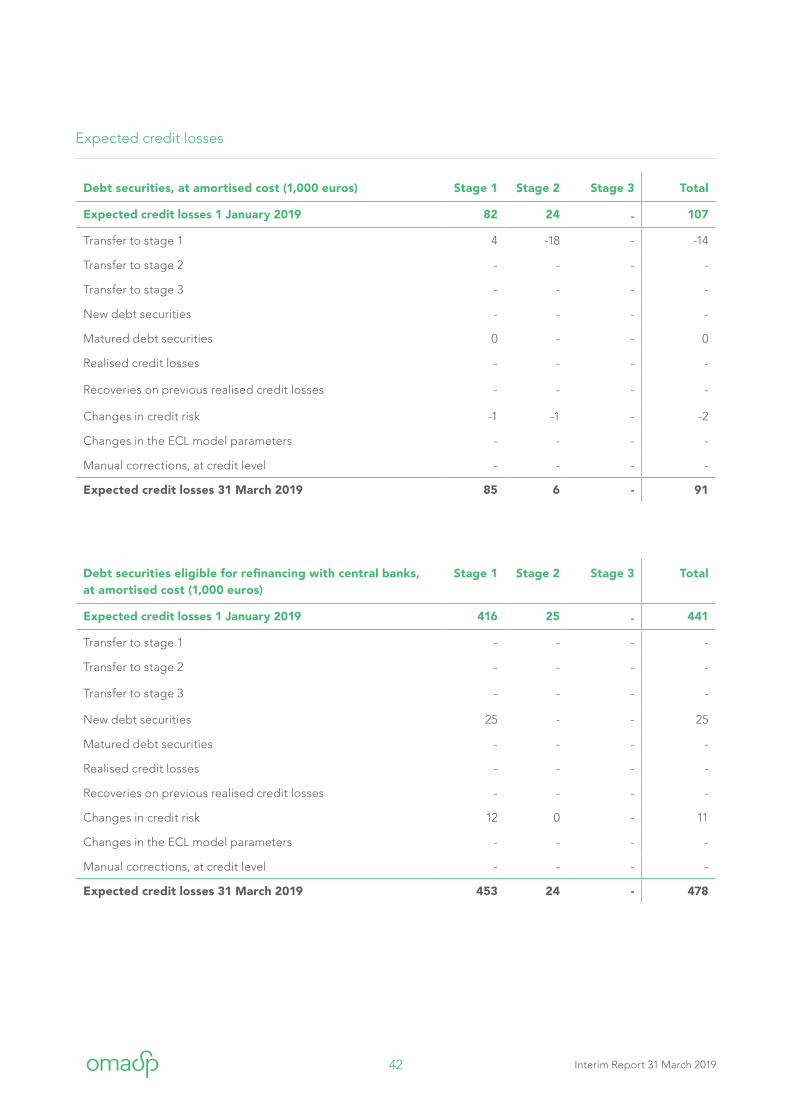
Debt securities, at amortised cost (1,000 euros) Stage 1 Stage 2 Stage 3 Total
Expected credit losses 1 January 2019 82 24 - 107
Transfer to stage 1 4 -18 - -14
Transfer to stage 2 - - - -
Transfer to stage 3 - - - -
New debt securities - - - -
Matured debt securities 0 - - 0
Realised credit losses - - - -
Recoveries on previous realised credit losses - - - -
Changes in credit risk -1 -1 - -2
Changes in the ECL model parameters - - - -
Manual corrections, at credit level - - - -
Expected credit losses 31 March 2019 85 6 - 91
Debt securities eligible for refinancing with central banks, at amortised cost (1,000 euros)
Stage 1 Stage 2 Stage 3 Total
Expected credit losses 1 January 2019 416 25 - 441
Transfer to stage 1 - - - -
Transfer to stage 2 - - - -
Transfer to stage 3 - - - -
New debt securities 25 - - 25
Matured debt securities - - - -
Realised credit losses - - - -
Recoveries on previous realised credit losses - - - -
Changes in credit risk 12 0 - 11
Changes in the ECL model parameters - - - -
Manual corrections, at credit level - - - -
Expected credit losses 31 March 2019 453 24 - 478
Expected credit losses

43 Interim Report 31 March 2019
Debt securities, at amortised cost (1,000 euros) Stage 1 Stage 2 Stage 3 Total
Expected credit losses 1 January 2018 84 11 - 95
Transfer to stage 1 - - - -
Transfer to stage 2 -1 14 - 13
Transfer to stage 3 - - - -
New debt securities 12 2 - 13
Matured debt securities -40 -4 - -44
Realised credit losses - - - -
Recoveries on previous realised credit losses - - - -
Changes in credit risk 4 2 - 6
Changes in the ECL model parameters - - - -
Manual corrections, at credit level - - - -
Expected credit losses 31 March 2019 59 24 - 83
Debt securities eligible for refinancing with central banks, at amortised cost (1,000 euros)
Stage 1 Stage 2 Stage 3 Total
Expected credit losses 1 January 2018 389 - - 389
Transfer to stage 1 - - - -
Transfer to stage 2 -1 9 - 7
Transfer to stage 3 - - - -
New debt securities 161 16 - 176
Matured debt securities - - - -
Realised credit losses - - - -
Recoveries on previous realised credit losses - - - -
Changes in credit risk -108 - - -108
Changes in the ECL model parameters - - - -
Manual corrections, at credit level - - - -
Expected credit losses 31 March 2019 440 25 - 464
Expected credit losses
44 Interim Report 31 March 2019
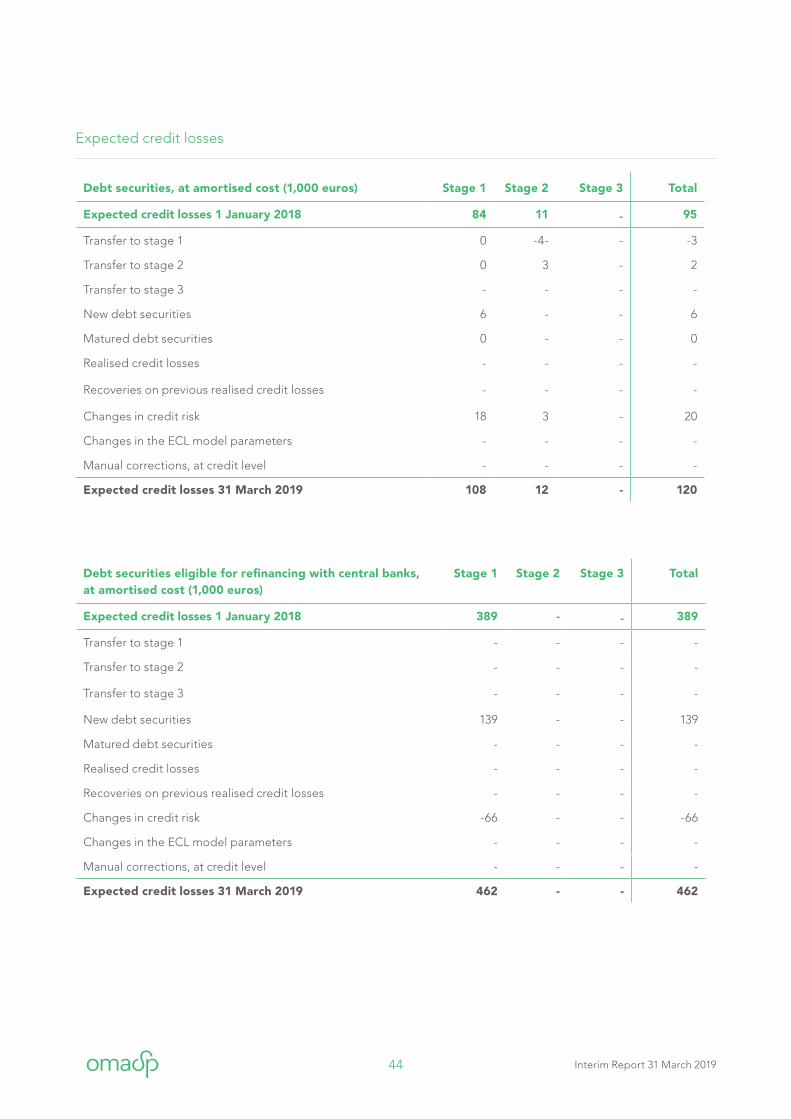
Debt securities, at amortised cost (1,000 euros) Stage 1 Stage 2 Stage 3 Total
Expected credit losses 1 January 2018 84 11 - 95
Transfer to stage 1 0 -4- - -3
Transfer to stage 2 0 3 - 2
Transfer to stage 3 - - - -
New debt securities 6 - - 6
Matured debt securities 0 - - 0
Realised credit losses - - - -
Recoveries on previous realised credit losses - - - -
Changes in credit risk 18 3 - 20
Changes in the ECL model parameters - - - -
Manual corrections, at credit level - - - -
Expected credit losses 31 March 2019 108 12 - 120
Debt securities eligible for refinancing with central banks, at amortised cost (1,000 euros)
Stage 1 Stage 2 Stage 3 Total
Expected credit losses 1 January 2018 389 - - 389
Transfer to stage 1 - - - -
Transfer to stage 2 - - - -
Transfer to stage 3 - - - -
New debt securities 139 - - 139
Matured debt securities - - - -
Realised credit losses - - - -
Recoveries on previous realised credit losses - - - -
Changes in credit risk -66 - - -66
Changes in the ECL model parameters - - - -
Manual corrections, at credit level - - - -
Expected credit losses 31 March 2019 462 - - 462
Expected credit losses
45 Interim Report 31 March 2019
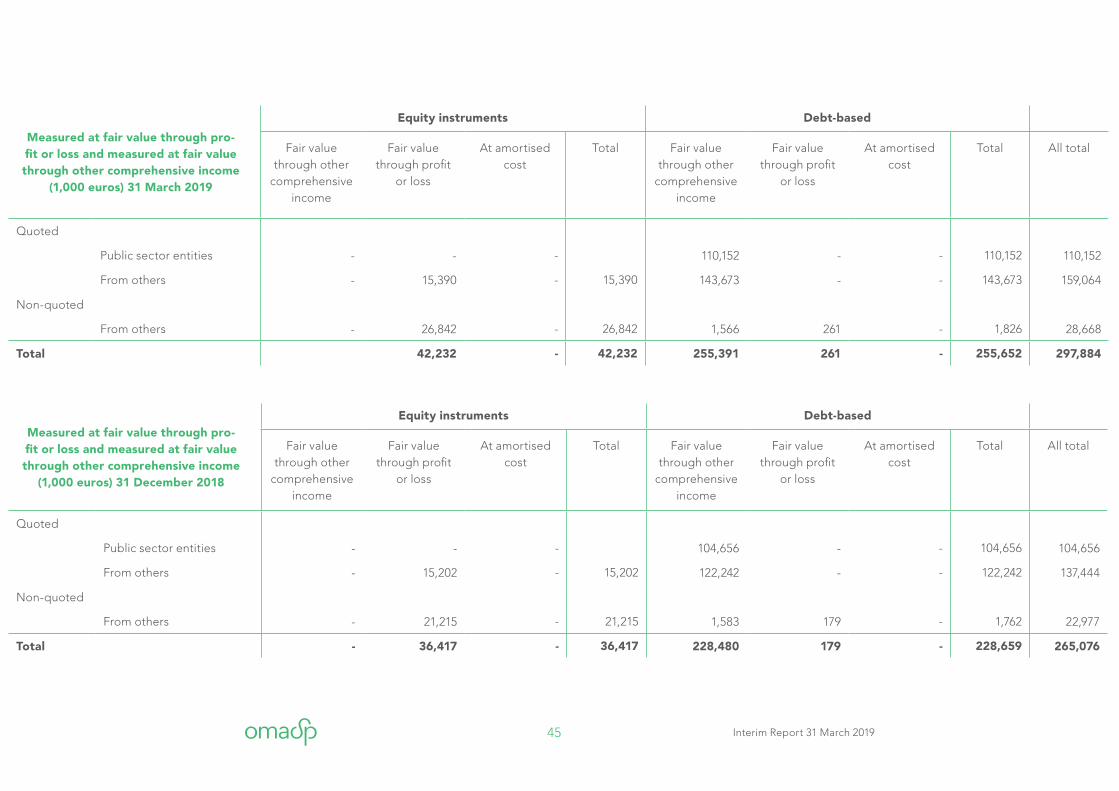
Measured at fair value through pro-fit or loss and measured at fair value through other comprehensive income
(1,000 euros) 31 December 2018
Equity instruments Debt-based
Fair value through other
comprehensive income
Fair value through profit
or loss
At amortised cost
Total Fair value through other
comprehensive income
Fair value through profit
or loss
At amortised cost
Total All total
Quoted
Public sector entities - - - 104,656 - - 104,656 104,656
From others - 15,202 - 15,202 122,242 - - 122,242 137,444
Non-quoted
From others - 21,215 - 21,215 1,583 179 - 1,762 22,977
Total - 36,417 - 36,417 228,480 179 - 228,659 265,076
Measured at fair value through pro-fit or loss and measured at fair value through other comprehensive income
(1,000 euros) 31 March 2019
Equity instruments Debt-based
Fair value through other
comprehensive income
Fair value through profit
or loss
At amortised cost
Total Fair value through other
comprehensive income
Fair value through profit
or loss
At amortised cost
Total All total
Quoted
Public sector entities - - - 110,152 - - 110,152 110,152
From others - 15,390 - 15,390 143,673 - - 143,673 159,064
Non-quoted
From others - 26,842 - 26,842 1,566 261 - 1,826 28,668
Total 42,232 - 42,232 255,391 261 - 255,652 297,884
46 Interim Report 31 March 2019
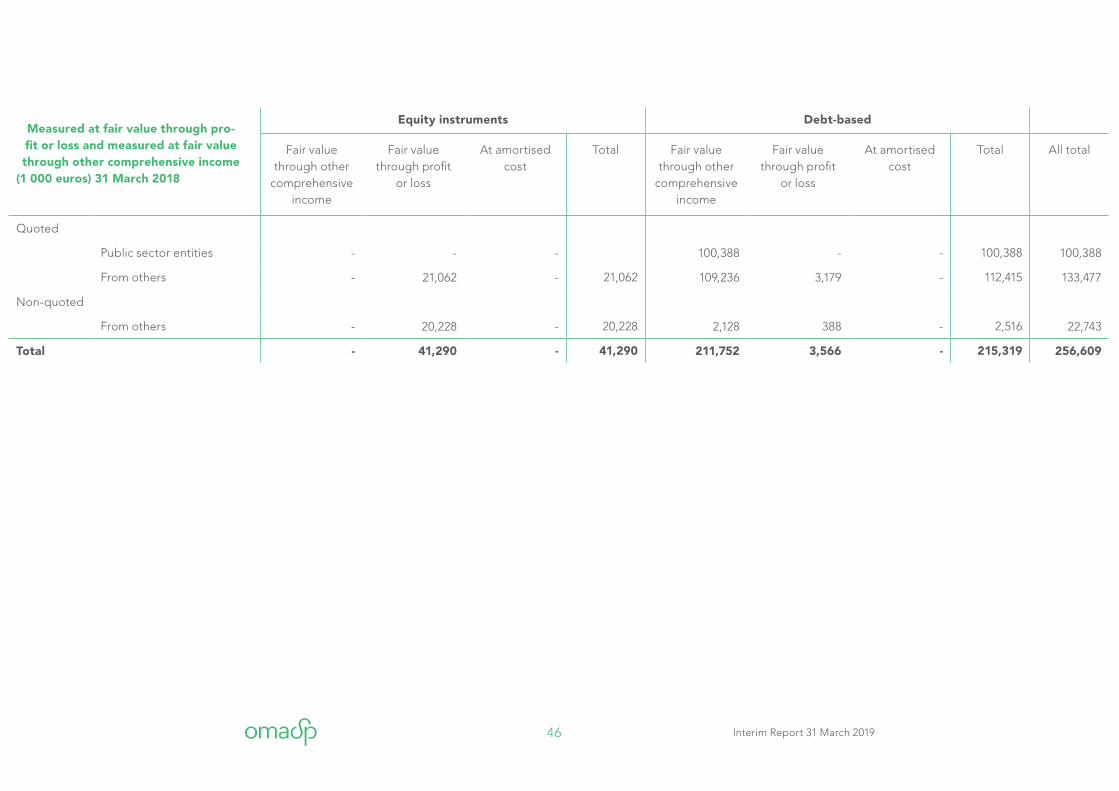
Measured at fair value through pro-fit or loss and measured at fair value through other comprehensive income
(1 000 euros) 31 March 2018
Equity instruments Debt-based
Fair value through other
comprehensive income
Fair value through profit
or loss
At amortised cost
Total Fair value through other
comprehensive income
Fair value through profit
or loss
At amortised cost
Total All total
Quoted
Public sector entities - - - 100,388 - - 100,388 100,388
From others - 21,062 - 21,062 109,236 3,179 - 112,415 133,477
Non-quoted
From others - 20,228 - 20,228 2,128 388 - 2,516 22,743
Total - 41,290 - 41,290 211,752 3,566 - 215,319 256,609
47 Interim Report 31 March 2019
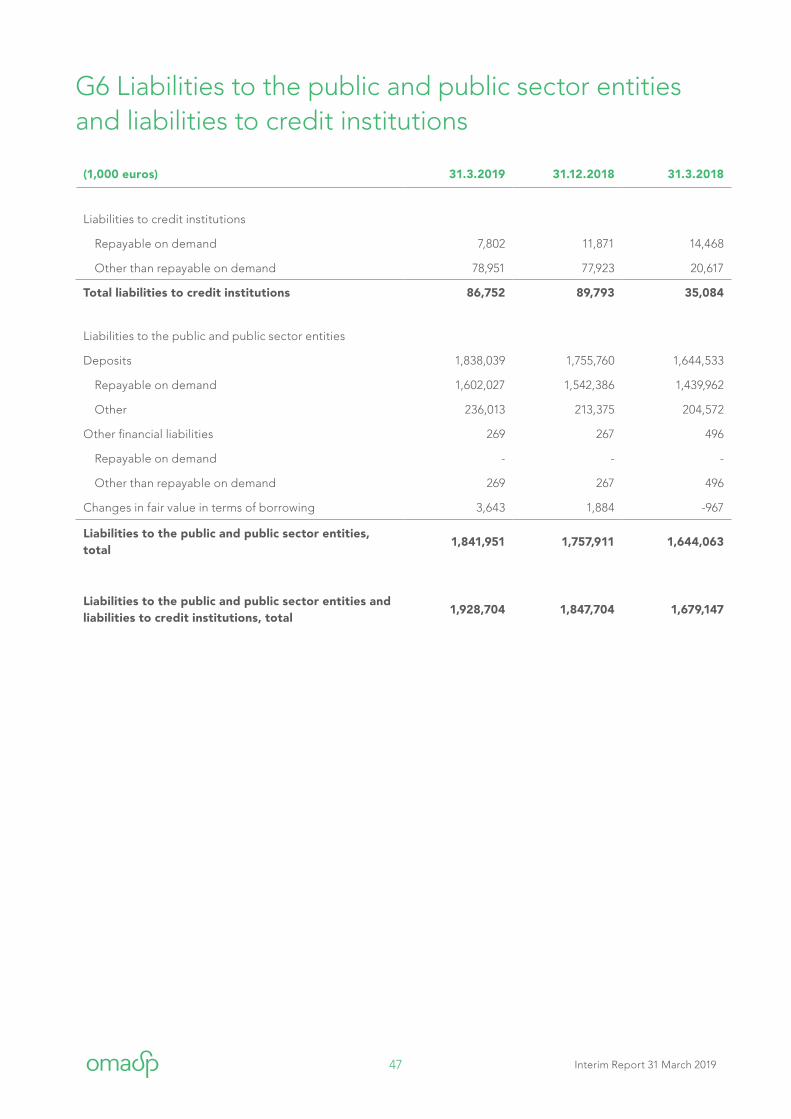
(1,000 euros) 31.3.2019 31.12.2018 31.3.2018
Liabilities to credit institutions
Repayable on demand 7,802 11,871 14,468
Other than repayable on demand 78,951 77,923 20,617
Total liabilities to credit institutions 86,752 89,793 35,084
Liabilities to the public and public sector entities
Deposits 1,838,039 1,755,760 1,644,533
Repayable on demand 1,602,027 1,542,386 1,439,962
Other 236,013 213,375 204,572
Other financial liabilities 269 267 496
Repayable on demand - - -
Other than repayable on demand 269 267 496
Changes in fair value in terms of borrowing 3,643 1,884 -967
Liabilities to the public and public sector entities, total
1,841,951 1,757,911 1,644,063
Liabilities to the public and public sector entities and liabilities to credit institutions, total
1,928,704 1,847,704 1,679,147
G6 Liabilities to the public and public sector entities and liabilities to credit institutions
48 Interim Report 31 March 2019
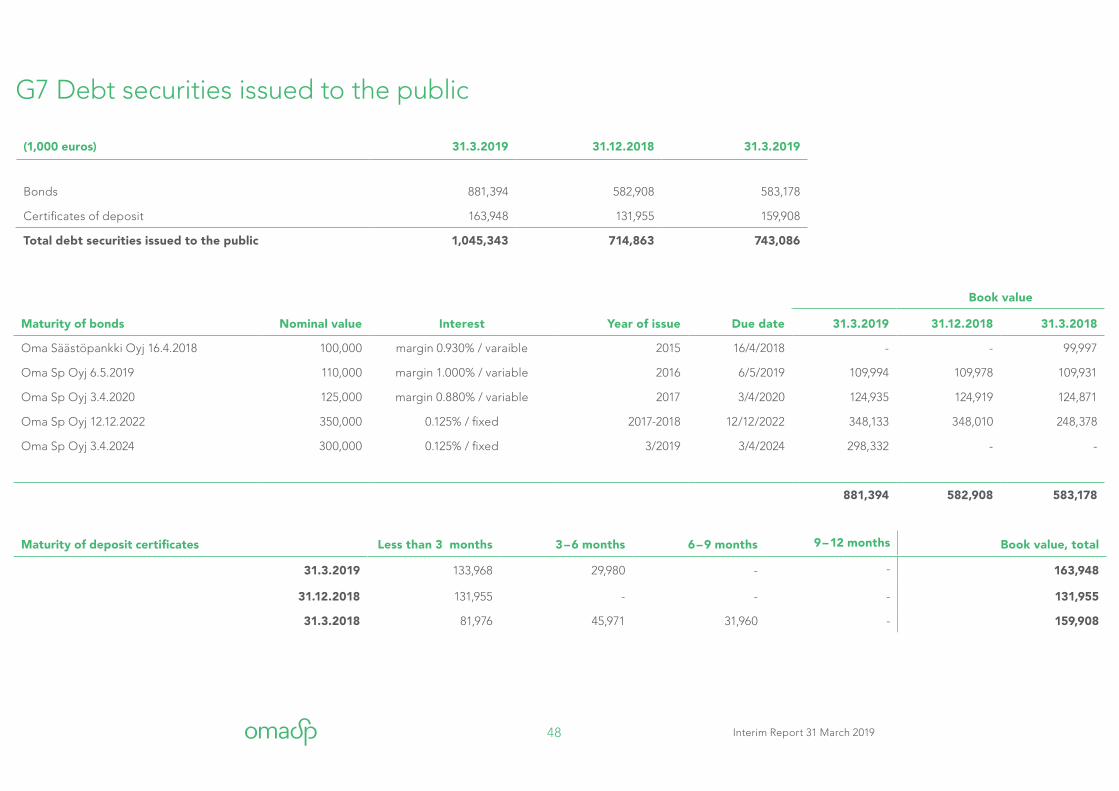
G7 Debt securities issued to the public
Book value
Maturity of bonds Nominal value Interest Year of issue Due date 31.3.2019 31.12.2018 31.3.2018
Oma Säästöpankki Oyj 16.4.2018 100,000 margin 0.930% / varaible 2015 16/4/2018 - - 99,997
Oma Sp Oyj 6.5.2019 110,000 margin 1.000% / variable 2016 6/5/2019 109,994 109,978 109,931
Oma Sp Oyj 3.4.2020 125,000 margin 0.880% / variable 2017 3/4/2020 124,935 124,919 124,871
Oma Sp Oyj 12.12.2022 350,000 0.125% / fixed 2017-2018 12/12/2022 348,133 348,010 248,378
Oma Sp Oyj 3.4.2024 300,000 0.125% / fixed 3/2019 3/4/2024 298,332 - -
881,394 582,908 583,178
Maturity of deposit certificates Less than 3 months 3 – 6 months 6 – 9 months 9 – 12 months Book value, total
31.3.2019 133,968 29,980 - - 163,948
31.12.2018 131,955 - - - 131,955
31.3.2018 81,976 45,971 31,960 - 159,908
(1,000 euros) 31.3.2019 31.12.2018 31.3.2019
Bonds 881,394 582,908 583,178
Certificates of deposit 163,948 131,955 159,908
Total debt securities issued to the public 1,045,343 714,863 743,086
49 Interim Report 31 March 2019
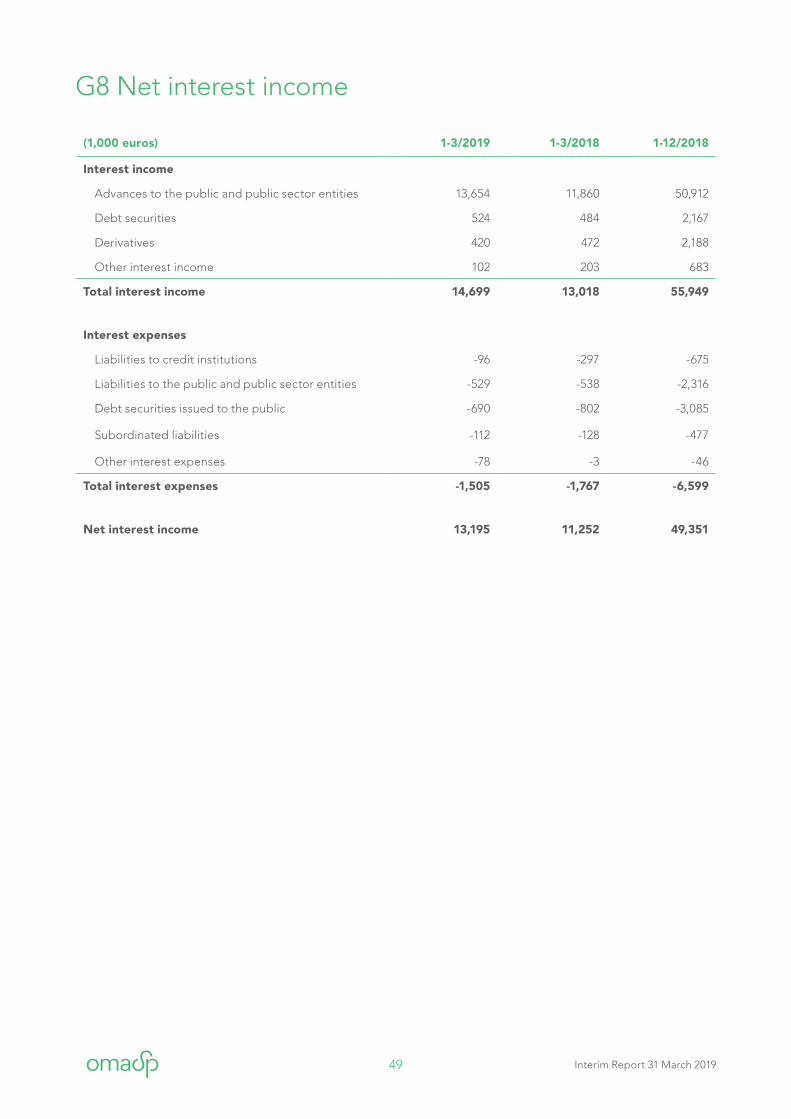
(1,000 euros) 1-3/2019 1-3/2018 1-12/2018
Interest income
Advances to the public and public sector entities 13,654 11,860 50,912
Debt securities 524 484 2,167
Derivatives 420 472 2,188
Other interest income 102 203 683
Total interest income 14,699 13,018 55,949
Interest expenses
Liabilities to credit institutions -96 -297 -675
Liabilities to the public and public sector entities -529 -538 -2,316
Debt securities issued to the public -690 -802 -3,085
Subordinated liabilities -112 -128 -477
Other interest expenses -78 -3 -46
Total interest expenses -1,505 -1,767 -6,599
Net interest income 13,195 11,252 49,351
G8 Net interest income
50 Interim Report 31 March 2019
(1,000 euros) 1-3/2019 1-3/2018 1-12/2018
Fee and commission income
Lending 2,675 2,398 11,276
Deposits 25 36 129
Card payment transactions 3,260 2,935 12,271
Intermediated securities 29 30 110
Reserves 559 650 2,452
Legal services 164 155 721
Brokered products 303 310 1,313
Granting of guarantees 187 133 640
Other fee and commission income 165 167 782
Total fee and commission income 7,368 6,813 29,694
Fee and commission expenses
Card and payment transactions -761 -694 -2,890
Securities -91 -9 -1,626
Other fee and commission expensses -311 -207 -1,020
Total fee and commission expenses -1,164 -911 -5,535
Fee and commission income and expenses, net 6,204 5,902 24,158
G9 Fee and commission income and expenses
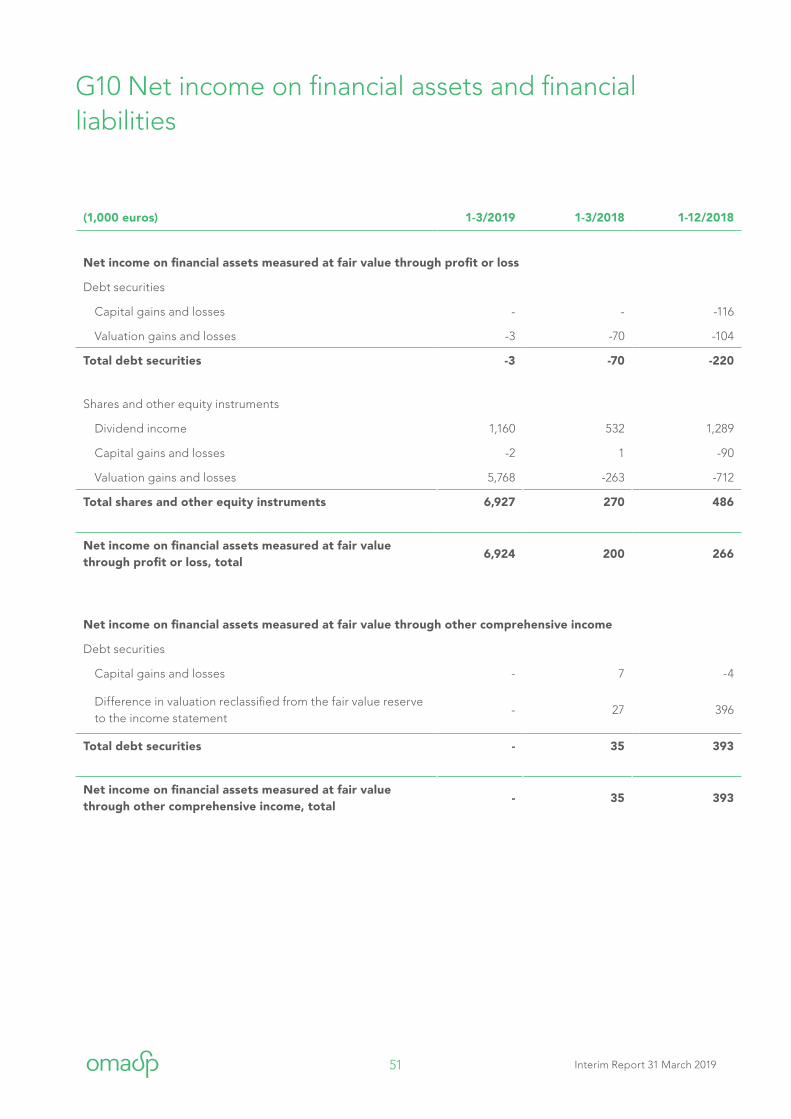
51 Interim Report 31 March 2019
(1,000 euros) 1-3/2019 1-3/2018 1-12/2018
Net income on financial assets measured at fair value through profit or loss
Debt securities
Capital gains and losses - - -116
Valuation gains and losses -3 -70 -104
Total debt securities -3 -70 -220
Shares and other equity instruments
Dividend income 1,160 532 1,289
Capital gains and losses -2 1 -90
Valuation gains and losses 5,768 -263 -712
Total shares and other equity instruments 6,927 270 486
Net income on financial assets measured at fair value through profit or loss, total
6,924 200 266
Net income on financial assets measured at fair value through other comprehensive income
Debt securities
Capital gains and losses - 7 -4
Difference in valuation reclassified from the fair value reserve to the income statement
- 27 396
Total debt securities - 35 393
Net income on financial assets measured at fair value through other comprehensive income, total
- 35 393
G10 Net income on financial assets and financial liabilities
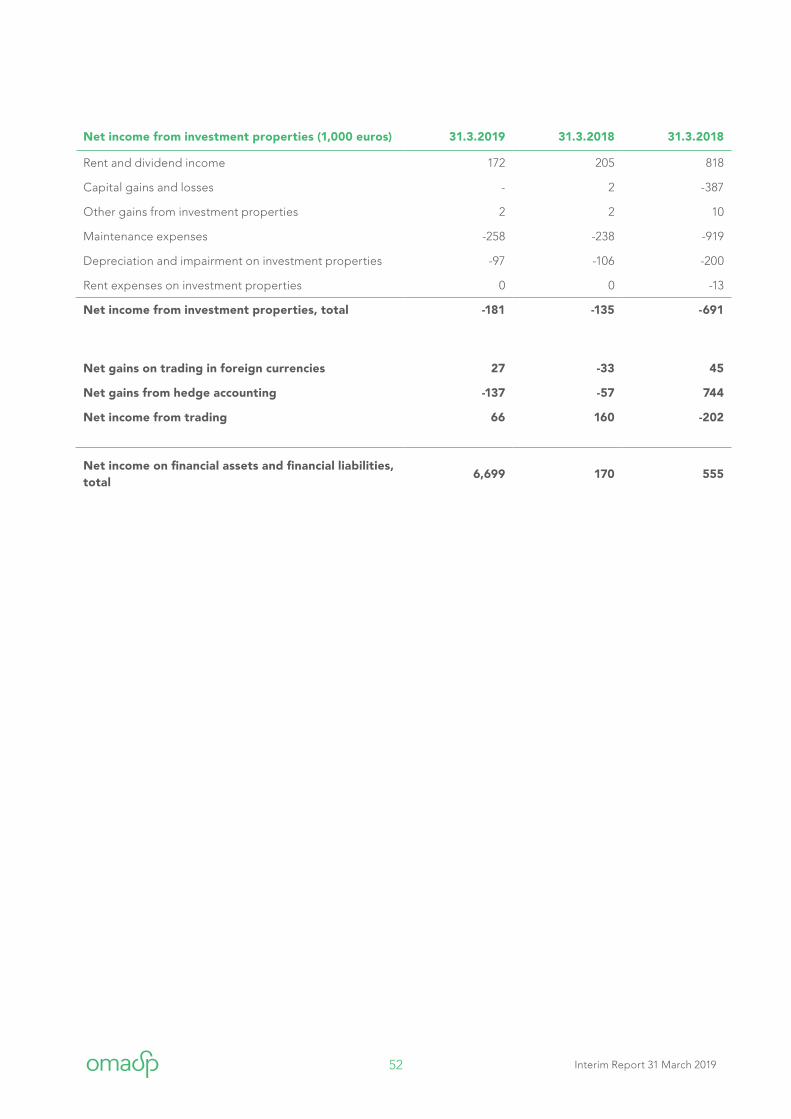
52 Interim Report 31 March 2019
Net income from investment properties (1,000 euros) 31.3.2019 31.3.2018 31.3.2018
Rent and dividend income 172 205 818
Capital gains and losses - 2 -387
Other gains from investment properties 2 2 10
Maintenance expenses -258 -238 -919
Depreciation and impairment on investment properties -97 -106 -200
Rent expenses on investment properties 0 0 -13
Net income from investment properties, total -181 -135 -691
Net gains on trading in foreign currencies 27 -33 45
Net gains from hedge accounting -137 -57 744
Net income from trading 66 160 -202
Net income on financial assets and financial liabilities, total
6,699 170 555
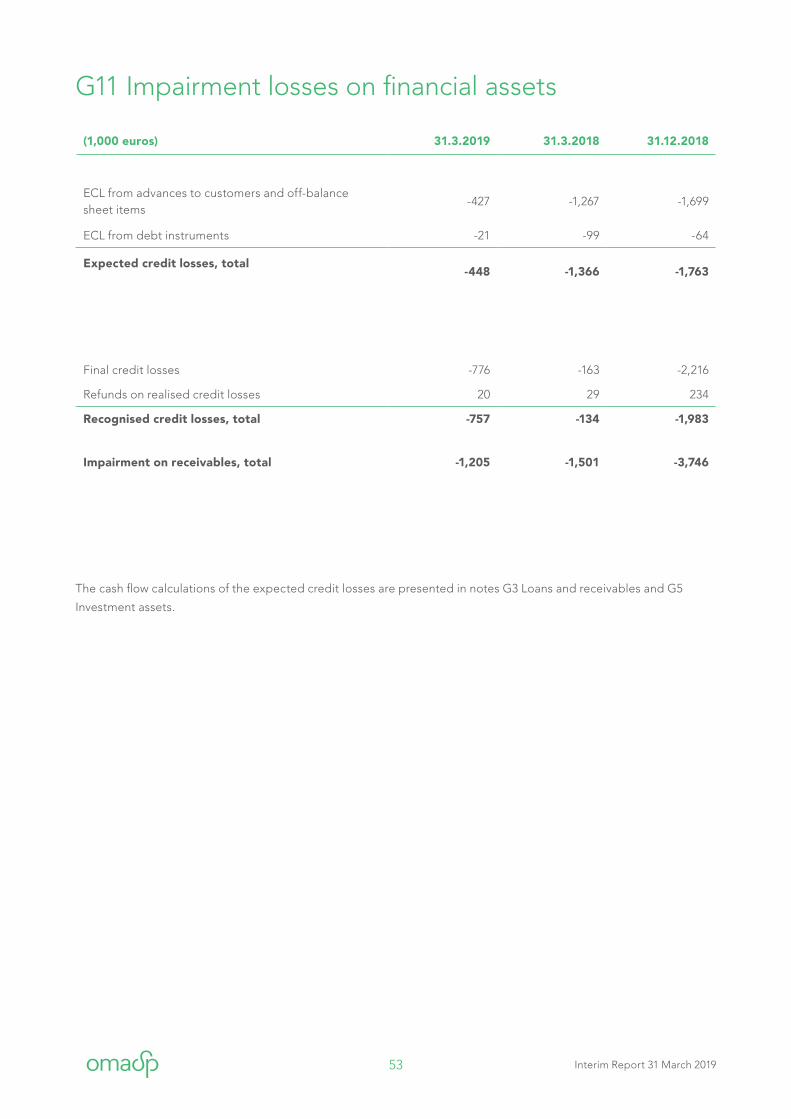
53 Interim Report 31 March 2019
(1,000 euros) 31.3.2019 31.3.2018 31.12.2018
ECL from advances to customers and off-balance sheet items
-427 -1,267 -1,699
ECL from debt instruments -21 -99 -64
Expected credit losses, total -448 -1,366 -1,763
Final credit losses -776 -163 -2,216
Refunds on realised credit losses 20 29 234
Recognised credit losses, total -757 -134 -1,983
Impairment on receivables, total -1,205 -1,501 -3,746
G11 Impairment losses on financial assets
The cash flow calculations of the expected credit losses are presented in notes G3 Loans and receivables and G5
Investment assets.
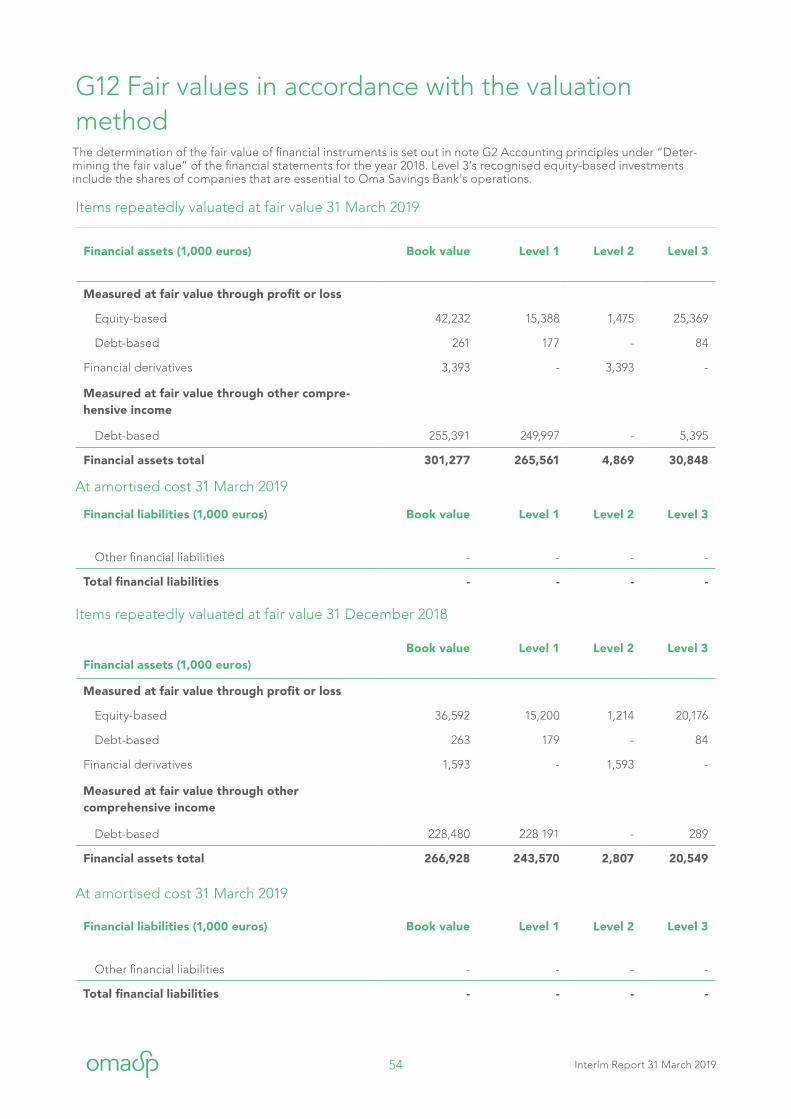
54 Interim Report 31 March 2019
Financial assets (1,000 euros)Book value Level 1 Level 2 Level 3
Measured at fair value through profit or loss
Equity-based 36,592 15,200 1,214 20,176
Debt-based 263 179 - 84
Financial derivatives 1,593 - 1,593 -
Measured at fair value through other comprehensive income
Debt-based 228,480 228 191 - 289
Financial assets total 266,928 243,570 2,807 20,549
G12 Fair values in accordance with the valuation methodThe determination of the fair value of financial instruments is set out in note G2 Accounting principles under “Deter-mining the fair value” of the financial statements for the year 2018. Level 3’s recognised equity-based investments include the shares of companies that are essential to Oma Savings Bank's operations.
Items repeatedly valuated at fair value 31 December 2018
Financial assets (1,000 euros) Book value Level 1 Level 2 Level 3
Measured at fair value through profit or loss
Equity-based 42,232 15,388 1,475 25,369
Debt-based 261 177 - 84
Financial derivatives 3,393 - 3,393 -
Measured at fair value through other compre-hensive income
Debt-based 255,391 249,997 - 5,395
Financial assets total 301,277 265,561 4,869 30,848
Items repeatedly valuated at fair value 31 March 2019
Financial liabilities (1,000 euros) Book value Level 1 Level 2 Level 3
Other financial liabilities - - - -
Total financial liabilities - - - -
At amortised cost 31 March 2019
Financial liabilities (1,000 euros) Book value Level 1 Level 2 Level 3
Other financial liabilities - - - -
Total financial liabilities - - - -
At amortised cost 31 March 2019
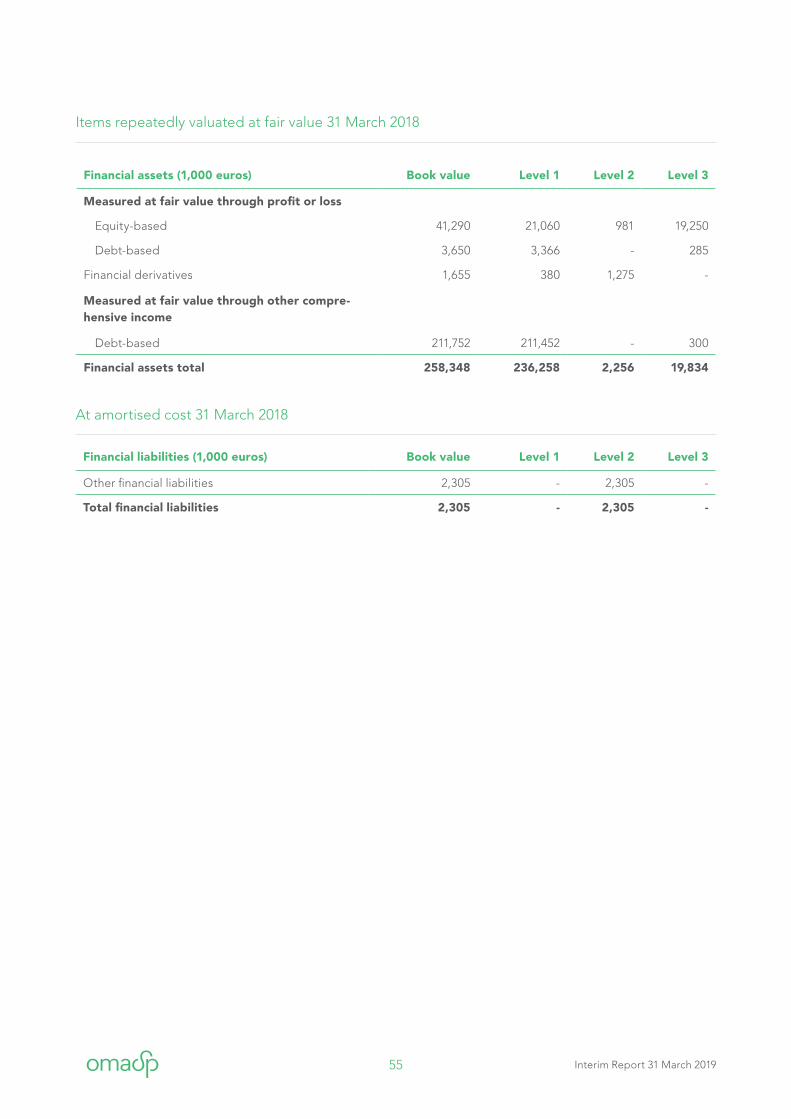
55 Interim Report 31 March 2019
Financial liabilities (1,000 euros) Book value Level 1 Level 2 Level 3
Other financial liabilities 2,305 - 2,305 -
Total financial liabilities 2,305 - 2,305 -
Financial assets (1,000 euros) Book value Level 1 Level 2 Level 3
Measured at fair value through profit or loss
Equity-based 41,290 21,060 981 19,250
Debt-based 3,650 3,366 - 285
Financial derivatives 1,655 380 1,275 -
Measured at fair value through other compre-hensive income
Debt-based 211,752 211,452 - 300
Financial assets total 258,348 236,258 2,256 19,834
Items repeatedly valuated at fair value 31 March 2018
At amortised cost 31 March 2018
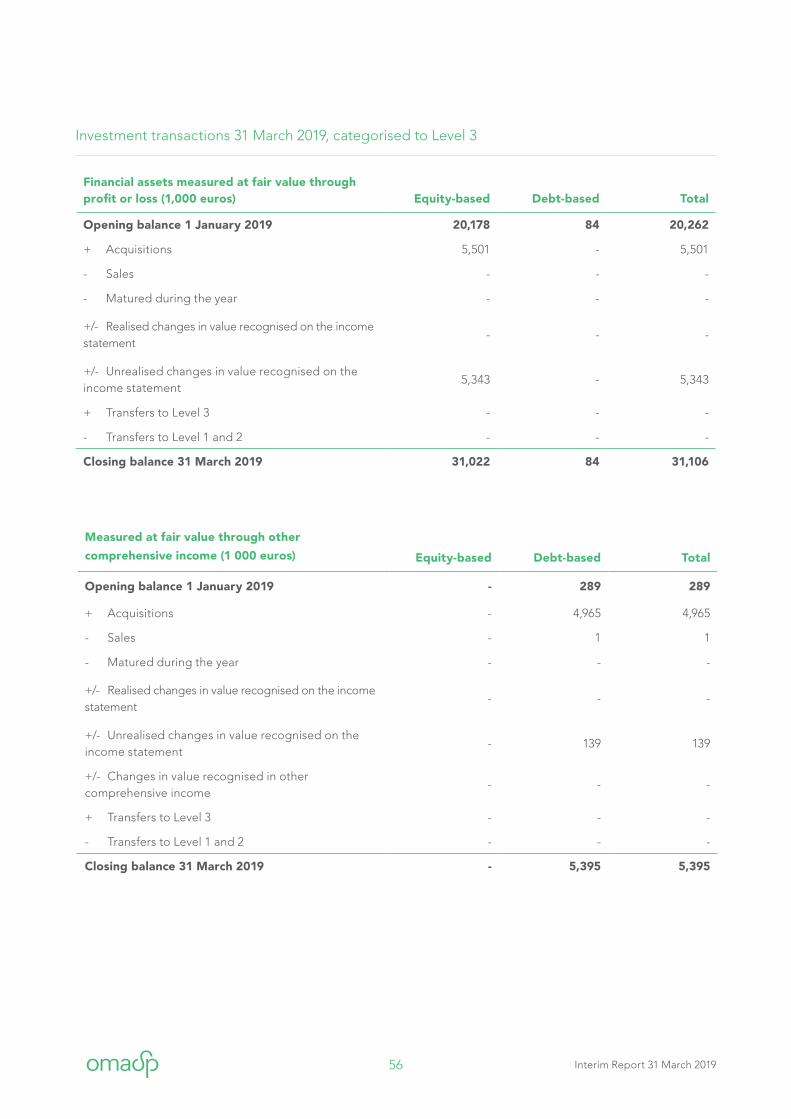
56 Interim Report 31 March 2019
Financial assets measured at fair value through profit or loss (1,000 euros) Equity-based Debt-based Total
Opening balance 1 January 2019 20,178 84 20,262
+ Acquisitions 5,501 - 5,501
- Sales - - -
- Matured during the year - - -
+/- Realised changes in value recognised on the income statement
- - -
+/- Unrealised changes in value recognised on the income statement
5,343 - 5,343
+ Transfers to Level 3 - - -
- Transfers to Level 1 and 2 - - -
Closing balance 31 March 2019 31,022 84 31,106
Investment transactions 31 March 2019, categorised to Level 3
Measured at fair value through other
comprehensive income (1 000 euros) Equity-based Debt-based Total
Opening balance 1 January 2019 - 289 289
+ Acquisitions - 4,965 4,965
- Sales - 1 1
- Matured during the year - - -
+/- Realised changes in value recognised on the income statement
- - -
+/- Unrealised changes in value recognised on the income statement
- 139 139
+/- Changes in value recognised in other comprehensive income
- - -
+ Transfers to Level 3 - - -
- Transfers to Level 1 and 2 - - -
Closing balance 31 March 2019 - 5,395 5,395
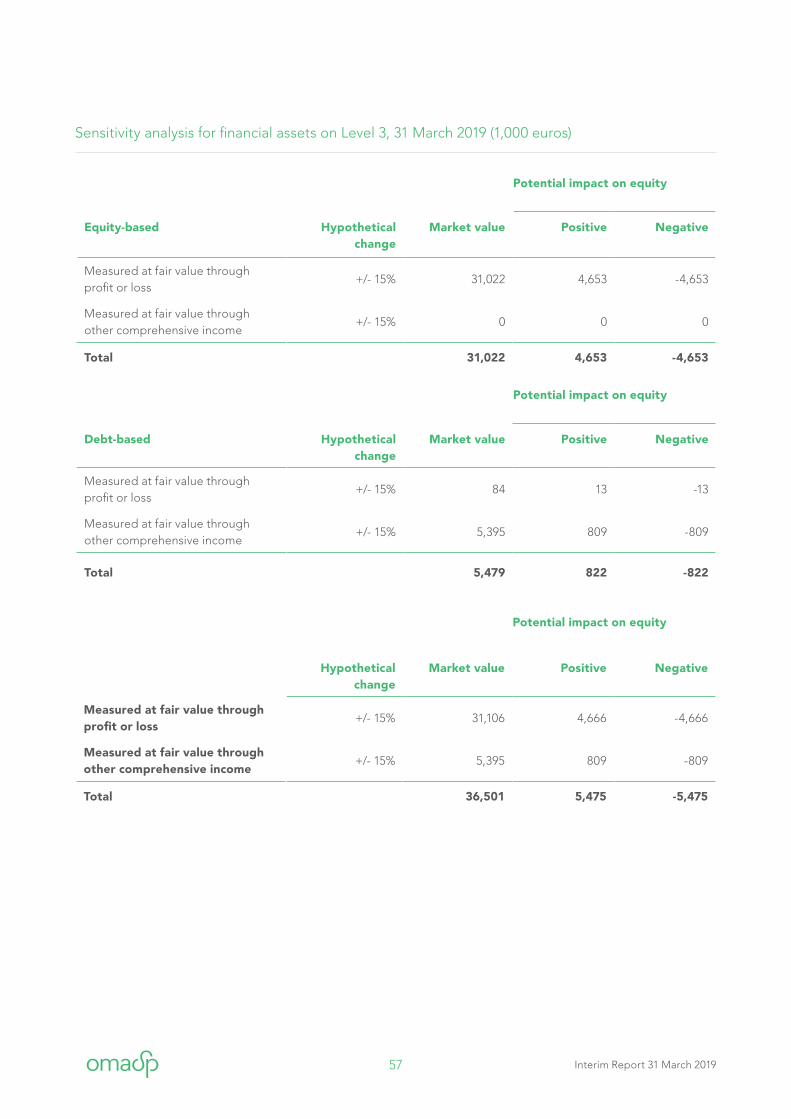
57 Interim Report 31 March 2019
Sensitivity analysis for financial assets on Level 3, 31 March 2019 (1,000 euros)
Potential impact on equity
Equity-based Hypothetical change
Market value Positive Negative
Measured at fair value through profit or loss
+/- 15% 31,022 4,653 -4,653
Measured at fair value through other comprehensive income
+/- 15% 0 0 0
Total 31,022 4,653 -4,653
Potential impact on equity
Debt-based Hypothetical change
Market value Positive Negative
Measured at fair value through profit or loss
+/- 15% 84 13 -13
Measured at fair value through other comprehensive income
+/- 15% 5,395 809 -809
Total 5,479 822 -822
Potential impact on equity
Hypothetical change
Market value Positive Negative
Measured at fair value through profit or loss
+/- 15% 31,106 4,666 -4,666
Measured at fair value through other comprehensive income
+/- 15% 5,395 809 -809
Total 36,501 5,475 -5,475
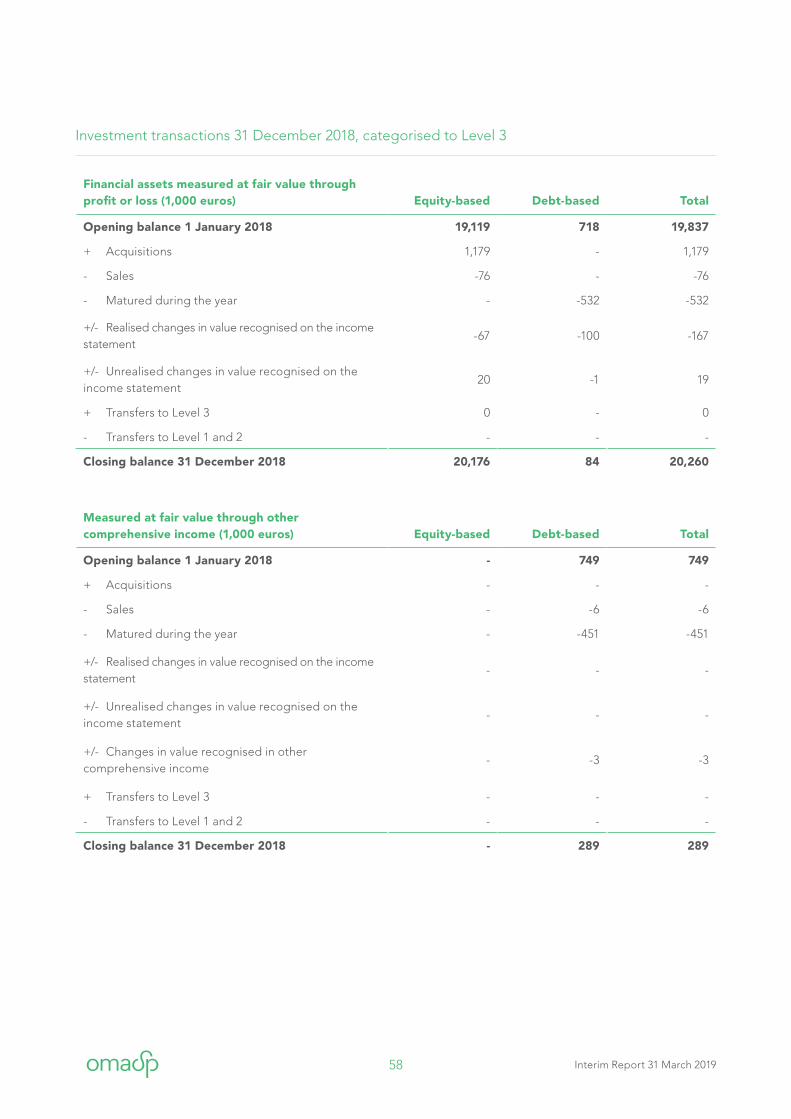
58 Interim Report 31 March 2019
Financial assets measured at fair value through profit or loss (1,000 euros) Equity-based Debt-based Total
Opening balance 1 January 2018 19,119 718 19,837
+ Acquisitions 1,179 - 1,179
- Sales -76 - -76
- Matured during the year - -532 -532
+/- Realised changes in value recognised on the income statement
-67 -100 -167
+/- Unrealised changes in value recognised on the income statement
20 -1 19
+ Transfers to Level 3 0 - 0
- Transfers to Level 1 and 2 - - -
Closing balance 31 December 2018 20,176 84 20,260
Investment transactions 31 December 2018, categorised to Level 3
Measured at fair value through other comprehensive income (1,000 euros) Equity-based Debt-based Total
Opening balance 1 January 2018 - 749 749
+ Acquisitions - - -
- Sales - -6 -6
- Matured during the year - -451 -451
+/- Realised changes in value recognised on the income statement
- - -
+/- Unrealised changes in value recognised on the income statement
- - -
+/- Changes in value recognised in other comprehensive income
- -3 -3
+ Transfers to Level 3 - - -
- Transfers to Level 1 and 2 - - -
Closing balance 31 December 2018 - 289 289
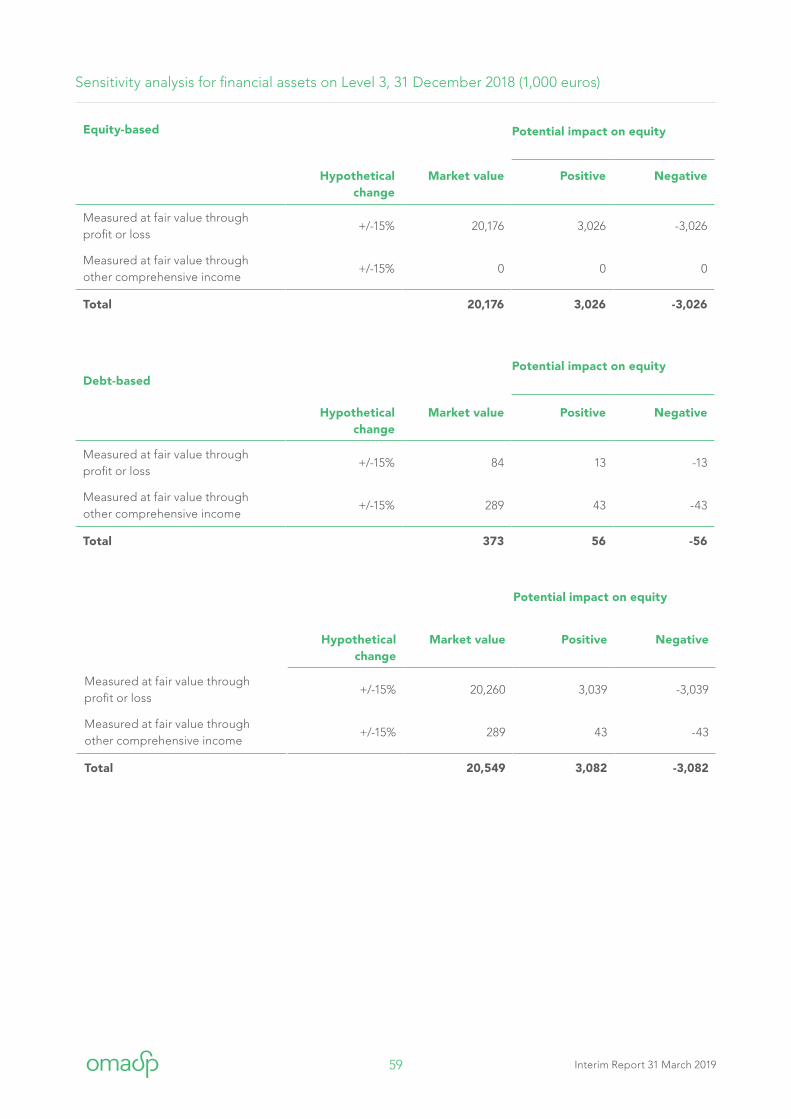
59 Interim Report 31 March 2019
Sensitivity analysis for financial assets on Level 3, 31 December 2018 (1,000 euros)
Equity-based Potential impact on equity
Hypothetical change
Market value Positive Negative
Measured at fair value through profit or loss
+/-15% 20,176 3,026 -3,026
Measured at fair value through other comprehensive income
+/-15% 0 0 0
Total 20,176 3,026 -3,026
Debt-basedPotential impact on equity
Hypothetical change
Market value Positive Negative
Measured at fair value through profit or loss
+/-15% 84 13 -13
Measured at fair value through other comprehensive income
+/-15% 289 43 -43
Total 373 56 -56
Potential impact on equity
Hypothetical change
Market value Positive Negative
Measured at fair value through profit or loss
+/-15% 20,260 3,039 -3,039
Measured at fair value through other comprehensive income
+/-15% 289 43 -43
Total 20,549 3,082 -3,082
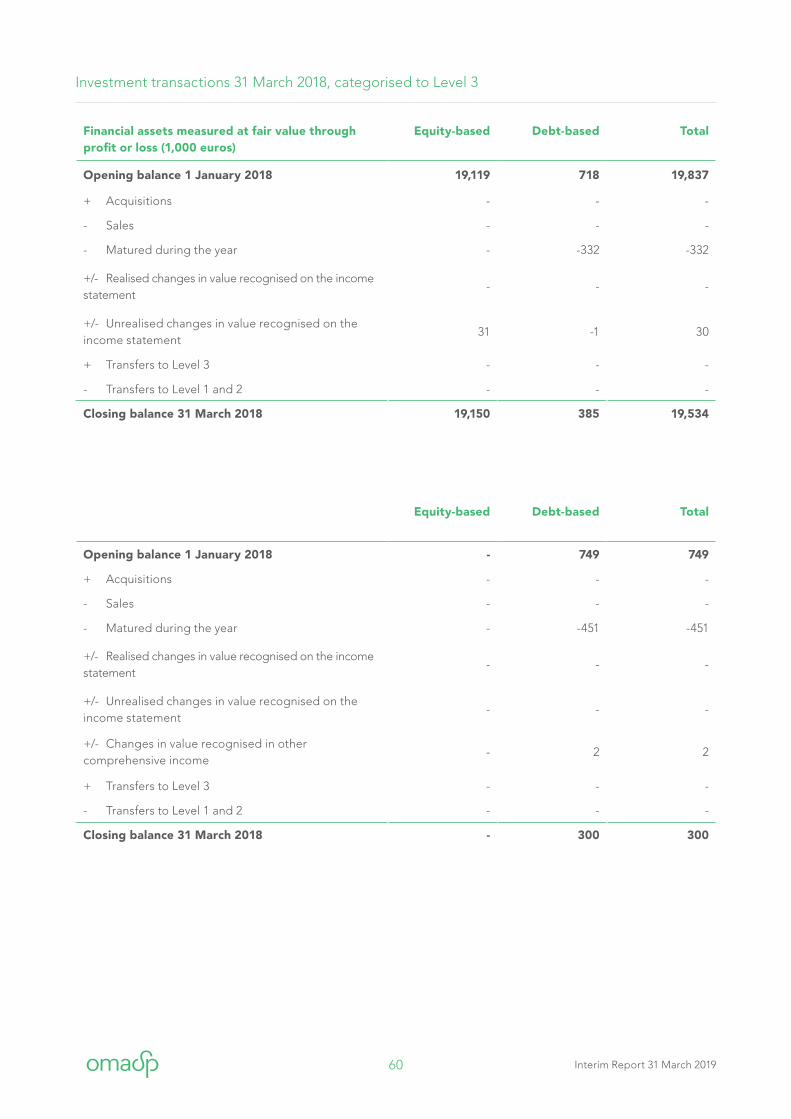
60 Interim Report 31 March 2019
Financial assets measured at fair value through profit or loss (1,000 euros)
Equity-based Debt-based Total
Opening balance 1 January 2018 19,119 718 19,837
+ Acquisitions - - -
- Sales - - -
- Matured during the year - -332 -332
+/- Realised changes in value recognised on the income statement
- - -
+/- Unrealised changes in value recognised on the income statement
31 -1 30
+ Transfers to Level 3 - - -
- Transfers to Level 1 and 2 - - -
Closing balance 31 March 2018 19,150 385 19,534
Investment transactions 31 March 2018, categorised to Level 3
Equity-based Debt-based Total
Opening balance 1 January 2018 - 749 749
+ Acquisitions - - -
- Sales - - -
- Matured during the year - -451 -451
+/- Realised changes in value recognised on the income statement
- - -
+/- Unrealised changes in value recognised on the income statement
- - -
+/- Changes in value recognised in other comprehensive income
- 2 2
+ Transfers to Level 3 - - -
- Transfers to Level 1 and 2 - - -
Closing balance 31 March 2018 - 300 300
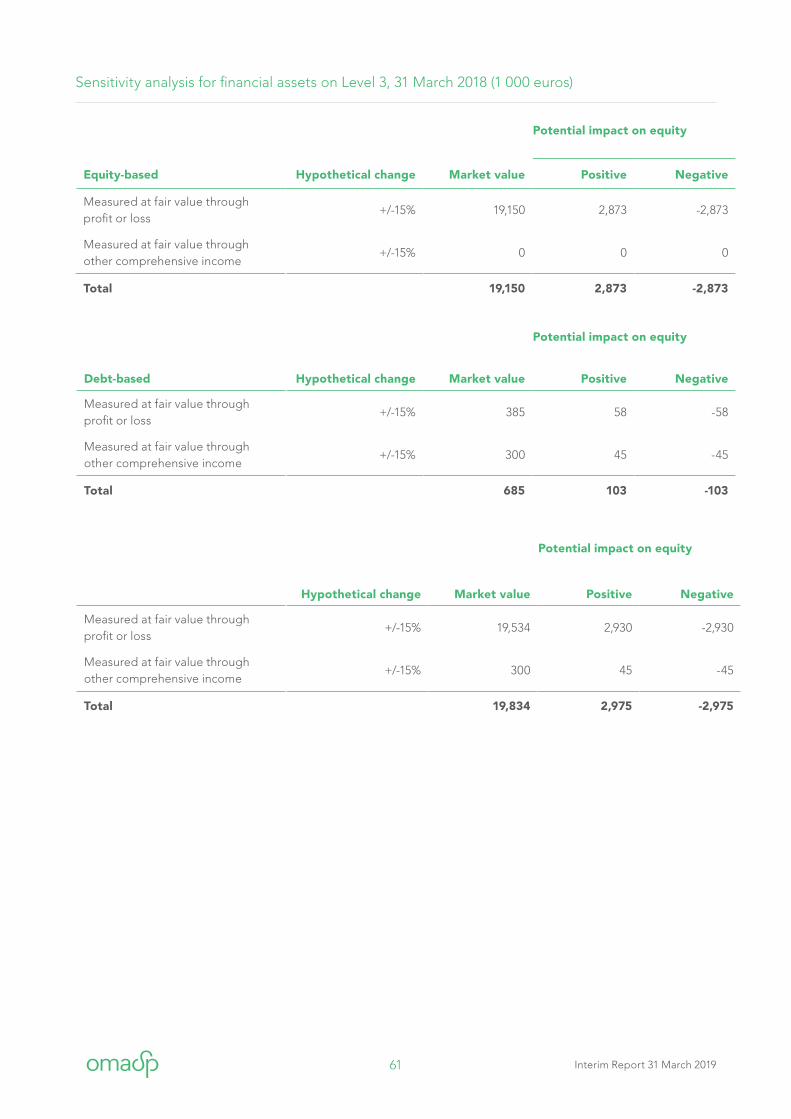
61 Interim Report 31 March 2019
Sensitivity analysis for financial assets on Level 3, 31 March 2018 (1 000 euros)
Potential impact on equity
Equity-based Hypothetical change Market value Positive Negative
Measured at fair value through profit or loss
+/-15% 19,150 2,873 -2,873
Measured at fair value through other comprehensive income
+/-15% 0 0 0
Total 19,150 2,873 -2,873
Potential impact on equity
Debt-based Hypothetical change Market value Positive Negative
Measured at fair value through profit or loss
+/-15% 385 58 -58
Measured at fair value through other comprehensive income
+/-15% 300 45 -45
Total 685 103 -103
Potential impact on equity
Hypothetical change Market value Positive Negative
Measured at fair value through profit or loss
+/-15% 19,534 2,930 -2,930
Measured at fair value through other comprehensive income
+/-15% 300 45 -45
Total 19,834 2,975 -2,975
62 Interim Report 31 March 2019
G13 Business combinations
Acquisition during the 2019 accounting period
Oma Savings Bank acquired 48,7 % of share capital of GT Invest Oy. GT Invest Oy owns 51% of the joint
venture, which invests in rental flats built in Finland. The acquired shares and private equity are recogni-
sed in the consolidated balance sheet in the item ‘Shares of companies consolidated by the equity
method’. The total value of the private equity and equity holdings is EUR 5.5 million.
Acquisitions during the 2018 accounting period
On 31 August 2018, Oma Savings Bank, together with Aktia Bank, the POP Bank Group and the Savings
Bank Group acquired the entire share capital of PP-Laskenta Oy. PP-Laskenta Oy for local banks is a
nationally operating financial administration service centre, which produces financial administration
and regulatory reporting services for financial operators. PP-Laskenta’s new owners are PP-Laskenta’s
customers. Oma Savings Bank owns 25.0% of the acquired company. The acquired shares and goodwill
are recognised in the consolidated balance sheet and classified under ‘Shares of companies
consolidated by the equity method’.
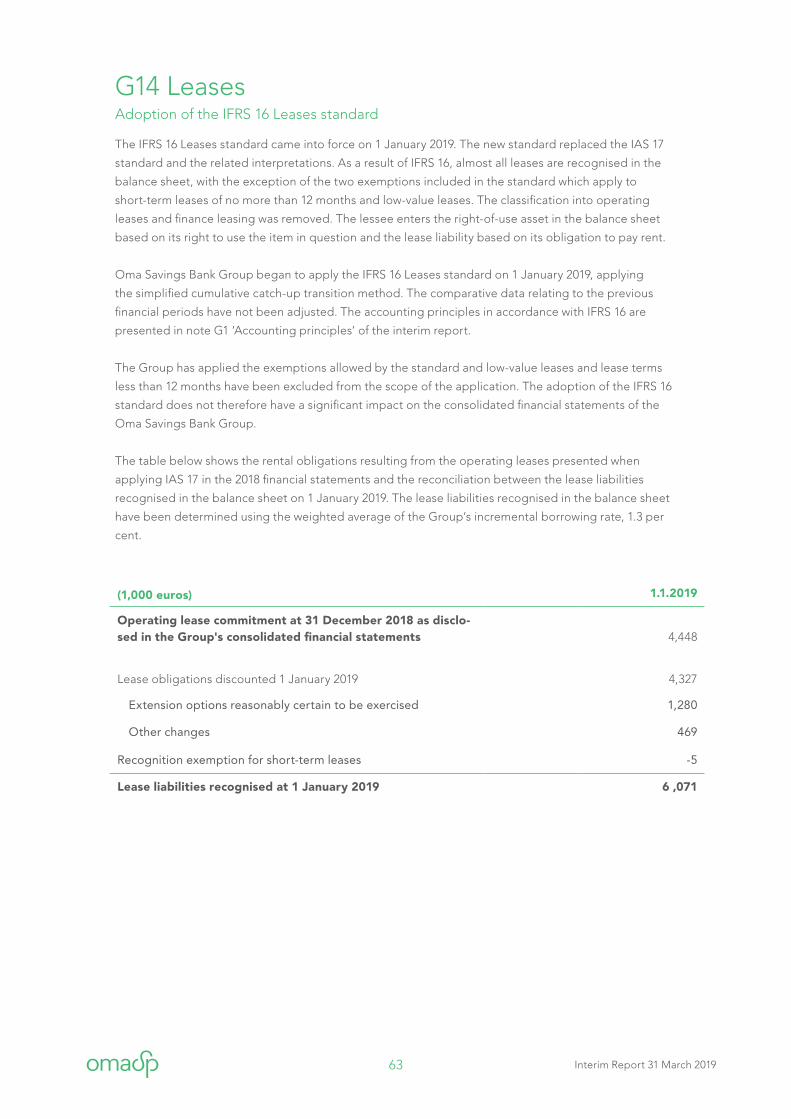
63 Interim Report 31 March 2019
G14 Leases
Adoption of the IFRS 16 Leases standard
The IFRS 16 Leases standard came into force on 1 January 2019. The new standard replaced the IAS 17
standard and the related interpretations. As a result of IFRS 16, almost all leases are recognised in the
balance sheet, with the exception of the two exemptions included in the standard which apply to
short-term leases of no more than 12 months and low-value leases. The classification into operating
leases and finance leasing was removed. The lessee enters the right-of-use asset in the balance sheet
based on its right to use the item in question and the lease liability based on its obligation to pay rent.
Oma Savings Bank Group began to apply the IFRS 16 Leases standard on 1 January 2019, applying
the simplified cumulative catch-up transition method. The comparative data relating to the previous
financial periods have not been adjusted. The accounting principles in accordance with IFRS 16 are
presented in note G1 ‘Accounting principles’ of the interim report.
The Group has applied the exemptions allowed by the standard and low-value leases and lease terms
less than 12 months have been excluded from the scope of the application. The adoption of the IFRS 16
standard does not therefore have a significant impact on the consolidated financial statements of the
Oma Savings Bank Group.
The table below shows the rental obligations resulting from the operating leases presented when
applying IAS 17 in the 2018 financial statements and the reconciliation between the lease liabilities
recognised in the balance sheet on 1 January 2019. The lease liabilities recognised in the balance sheet
have been determined using the weighted average of the Group’s incremental borrowing rate, 1.3 per
cent.
(1,000 euros) 1.1.2019
Operating lease commitment at 31 December 2018 as disclo-sed in the Group's consolidated financial statements 4,448
Lease obligations discounted 1 January 2019 4,327
Extension options reasonably certain to be exercised 1,280
Other changes 469
Recognition exemption for short-term leases -5
Lease liabilities recognised at 1 January 2019 6 ,071
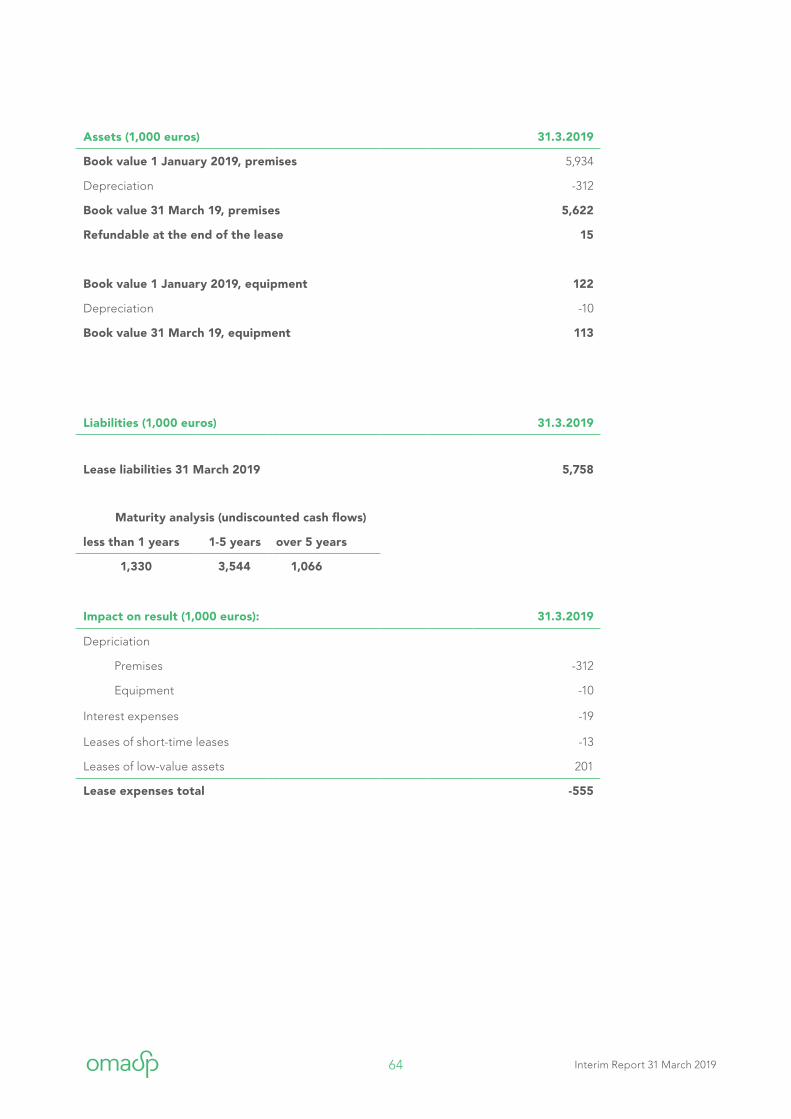
64 Interim Report 31 March 2019
Assets (1,000 euros) 31.3.2019
Book value 1 January 2019, premises 5,934
Depreciation -312
Book value 31 March 19, premises 5,622
Refundable at the end of the lease 15
Book value 1 January 2019, equipment 122
Depreciation -10
Book value 31 March 19, equipment 113
Liabilities (1,000 euros) 31.3.2019
Lease liabilities 31 March 2019 5,758
Maturity analysis (undiscounted cash flows)
less than 1 years 1-5 years over 5 years
1,330 3,544 1,066
Impact on result (1,000 euros): 31.3.2019
Depriciation
Premises -312
Equipment -10
Interest expenses -19
Leases of short-time leases -13
Leases of low-value assets 201
Lease expenses total -555
(1,000 euros) 1.1.2019
Operating lease commitment at 31 December 2018 as disclo-sed in the Group's consolidated financial statements 4,448
Lease obligations discounted 1 January 2019 4,327
Extension options reasonably certain to be exercised 1,280
Other changes 469
Recognition exemption for short-term leases -5
Lease liabilities recognised at 1 January 2019 6 ,071
65 Interim Report 31 March 2019
G15 Significant events since the report date
On 23 January 2019, Oma Savings Bank Plc announced that it would be selling to Cognizant Technology
Solutions Finland Oy its 15.45% holding in the current IT services provider Oy Samlink Ab together with
the Savings Bank Group, Aktia Bank Plc, Handelsbanken, Posti Group Plc, POP Bank Group and other
minority shareholders. The transaction received the required regulatory approval and was carried out
on 1 April 2019. The company recognised Samlink’s shares at the fair value of their purchase price on 31
March 2019.
Changes in Oma Savings Bank Group’s management team
As of 1 April, Kimmo Tapionsalo M.Sc., eMBA started as a new member of the management team of
Oma Savings Bank Group. He has held a position with the company since 2014 and is its Chief Risk Of-
ficer. Oma Savings Bank’s Chief Information Officer Kari-Mikael Markkanen took on new duties outside
the company on 7 May 2019. The company has started up recruitment of a new CIO.
Cognizant transaction was approved by the relevant regulatory authorities
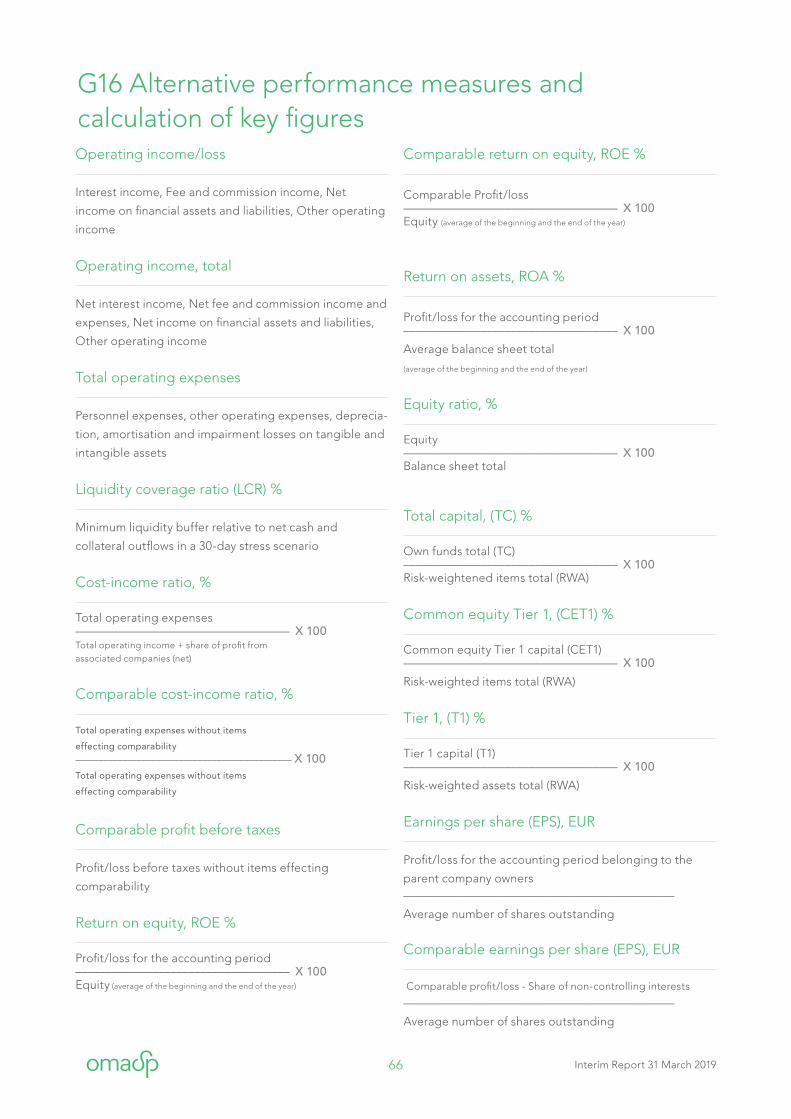
66 Interim Report 31 March 2019
G16 Alternative performance measures and calculation of key figures
Comparable return on equity, ROE %
Comparable Profit/loss –––––––––––––––––––––––––––––––––––– X 100 Equity (average of the beginning and the end of the year)
Return on assets, ROA %
Profit/loss for the accounting period –––––––––––––––––––––––––––––––––––– X 100
Average balance sheet total
(average of the beginning and the end of the year)
Equity ratio, %
Equity –––––––––––––––––––––––––––––––––––– X 100 Balance sheet total
Total capital, (TC) %
Own funds total (TC) –––––––––––––––––––––––––––––––––––– X 100 Risk-weightened items total (RWA)
Common equity Tier 1, (CET1) %
Common equity Tier 1 capital (CET1) –––––––––––––––––––––––––––––––––––– X 100
Risk-weighted items total (RWA)
Tier 1, (T1) %
Tier 1 capital (T1) –––––––––––––––––––––––––––––––––––– X 100
Risk-weighted assets total (RWA)
Earnings per share (EPS), EUR
Profit/loss for the accounting period belonging to the
parent company owners––––––––––––––––––––––––––––––––––––––––––––––
Average number of shares outstanding
Comparable earnings per share (EPS), EUR
Comparable profit/loss - Share of non-controlling interests
––––––––––––––––––––––––––––––––––––––––––––––
Average number of shares outstanding
Operating income/loss
Interest income, Fee and commission income, Net
income on financial assets and liabilities, Other operating
income
Operating income, total
Net interest income, Net fee and commission income and
expenses, Net income on financial assets and liabilities,
Other operating income
Total operating expenses
Personnel expenses, other operating expenses, deprecia-
tion, amortisation and impairment losses on tangible and
intangible assets
Liquidity coverage ratio (LCR) %
Minimum liquidity buffer relative to net cash and
collate ral outflows in a 30-day stress scenario
Cost-income ratio, %
Total operating expenses –––––––––––––––––––––––––––––––––––– X 100 Total operating income + share of profit from associated companies (net)
Comparable cost-income ratio, %
Total operating expenses without items
effecting comparability –––––––––––––––––––––––––––––––––––––––––––––– X 100
Total operating expenses without items
effecting comparability
Comparable profit before taxes
Profit/loss before taxes without items effecting
comparability
Return on equity, ROE %
Profit/loss for the accounting period –––––––––––––––––––––––––––––––––––– X 100 Equity (average of the beginning and the end of the year)

67 Interim Report 31 March 2019
This document is an English translation of the Finnish auditor’s report. Only the Finnish version of the report
is legally binding.
lndependent Auditor's Report on Review of Consolidated lnterim Report of Oma Savings Bank Plc to the
Board of Directors of Oma Savings Bank Plc.
Introduction
We have reviewed the accompanying consolidated interim report of Oma Savings Bank Plc which comprise
the condensed consolidated balance sheet as at 31 March 2019, condensed consolidated income state-
ment, statement of comprehensive income, changes in equity, and cash flows for the three
months ended 31 March 2019 and notes to the condensed interim information. The Board of Directors
and the CEO are responsible for the preparation and presentation of the condensed consolidated interim
report in accordance with IAS 34 "lnterim Financial Reporting". Our responsibility is to express a conclusion
on this condensed consolidated interim financial information based on our review.
Scope of review
We conducted our review in accordance with lnternational Standards on Review Engagements ISRE 2410
"Review of lnterim Financial Information Performed by the lndependent Auditor of the Entity". A review of
interim financial information consists of making inquiries, primarily of persons responsible for financial and
accounting matters, and applying analytical and other review procedures. A review is substantially less in
scope than an audit conducted in accordance with lnternational Standards on Auditing and consequently
does not enable us to obtain assurance that we would become aware of all significant matters that might be
identified in an audit. Accordingly, we do not express an audit opinion.
Conclusion
Based on our review, nothing has come to our attention that causes us to believe that the accompanying
consolidated interim report of Oma Savings Bank Plc as at 31 March 2019 and for the three month period
ended 31 March 2019 has not been prepared, in all material respects, in accordance with IAS 34 lnterim
Financial Reporting.
KPMG OY AB
Helsinki, 9 May 2019
FREDRIK WESTERHOLM
Authorised Public Accountant, KHT
Auditor's report