Q1 Results of FY 2012-2013
20
Q1 Results of FY 2012-2013
Transcript of Q1 Results of FY 2012-2013

Q1 Results of
FY 2012-2013

Disclaimer
This presentation has been prepared by Nilkamal Limited (“Company”) solely for your information and for your use andmay not be taken away, reproduced, redistributed or passed on, directly or indirectly, to any other person (whether withinor outside your organization or firm) or published in whole or in part, for any purpose. By accessing this presentation, youare agreeing to be bound by the trailing restrictions and to maintain absolute confidentiality regarding the informationdisclosed in these materials. The information contained in this presentation does not constitute or form any part of anyoffer, invitation or recommendation to purchase or subscribe for any securities in any jurisdiction, and neither the issue ofthe information nor anything contained herein shall form the basis of, or be relied upon in connection with, any contract orcommitment on the part of any person to proceed with any transaction. The information contained in these materials hasnot been independently verified and no representation or warranty, express or implied, is made and no reliance should beplaced on the accuracy, fairness or completeness of the information presented or contained in these materials. Certainstatements contained in this presentation may be statements of future expectations and other forward-looking statementsthat are based on third party sources and involve known and unknown risks and uncertainties. Forward-lookingstatements contained in this presentation regarding past trends or activities should not be taken as a representation thatsuch trends or activities will continue in the future. There is no obligation to update or revise any forward-lookingstatements, whether as a result of new information, future events or otherwise. You should not place undue reliance onforward-looking statements, which speak only as of the date of this presentation. This presentation may not be allinclusive and may not contain all of the information that you may consider material. The information presented orcontained in these materials is subject to change without notice and its accuracy is not guaranteed. Neither the Companynor any of its affiliates, advisers or representatives accepts liability whatsoever for any loss howsoever arising from anyinformation presented or contained in these materials. This presentation has been made available to you in electronicform. You are reminded that documents transmitted via this medium may be altered or changed during the process oftransmission. In accessing this presentation, you agree to be bound by the terms and conditions hereof, including anymodifications to them any time you receive any information from us as a result of such access

Highlights
Particulars
% of Growth Against
Corresponding quarter of P.Y.
% of Growth Against
Immediate Preceding Quarter
Quarter Ended
June 12
Quarter Ended
June 11
Quarter Ended Mar 12
Financial Year 2011 - 12
Turnover - Gross 23.44% -5.18% 45,234 36,646 47,707 164,048
Turnover - Net 22.53% -5.24% 39,370 32,131 41,546 143,461
EBIDT 9.88% -4.93% 3,822 3,478 4,020 15,122
Interest 24.68% -4.39% 1,114 894 1,165 3,968
Depreciation 22.81% 6.85% 1,139 927 1,066 4,048
PBT -5.33% -12.31% 1,569 1,657 1,789 7,105
PAT -8.22% -21.58% 1,126 1,226 1,435 5,560
(` in lacs)

Financial Results
Particulars
Quarter ending Quarter ending Quarter ending
Financial Year 2011-12
30th June, 12. 30th June, 11. 31st March, 12.
Plastic @home Total Plastic @home Total Plastic @home Total Plastic @home Total
Net Sales 35254 4116 39370 28208 3923 32131 36057 5489 41546 1E+05 19127 143461
EBIDT 4064 -242 3822 3494 -16 3478 4137 -107 4020 15188 -66 15122
% Net sales 11.53 -5.88 9.71 12.39 -0.41 10.82 11.47 -1.95 9.67 12.22 -0.35 10.54
PBT 1952 -383 1569 1781 -123 1658 2034 -245 1789 7657 -552 7105
PAT 1508 -383 1125 1350 -123 1227 1680 -245 1435 6112 -552 5560
% to Net 4.28 -9.3 2.86 4.79 -3.15 3.82 4.66 -4.46 3.45 4.92 -2.88 3.88
(` in lacs)

Performance Snapshot
YoY Growth : 23%; QoQ Growth : -5%
YoY Growth : 10%; QoQ Growth : -5%
3,822
3,478
4,020
320034003600380040004200
June-12 June-11 Mar-12
EBIDTA (` in lacs)
YoY Growth : -8%; QoQ Growth : -22%
Plastics YoY Growth : 25%; QoQ Growth : -2 %
Retail YoY Growth : 5%; QoQ Growth : -24%
39370
32131
41546
0
10000
20000
30000
40000
50000
June-12 June-11 Mar-12
Total Revenue (` in lacs) 35,254
28,208
36,058
4,116 3,923 5,489
0
10000
20000
30000
40000
June-12 June-11 Mar-12
Segment Wise Revenue
11251227
1435
0
200
400
600
800
1000
1200
1400
1600
June-12 June-11 Mar-12
PAT(` in lacs)

Quarterly Net Sales
3937041546
34562 3511432131
34230
3041031788
2848130421
24846 2457722960
24447
0
5000
10000
15000
20000
25000
30000
35000
40000
45000
Jun-12 Mar-12 Dec-11 Sep-11 Jun-11 Mar-11 Dec-10 Sep-10 Jun-10 Mar-10 Dec-09 Sep-09 Jun-09 Mar-09
(` in lacs)

Income Statement Summary (Quarterly)
Quarter Ended June 12
Quarter Ended June 11
Quarter Ended March 12
Year Ended 31st March 12 Growth Over%
Particulars Amt % Amt % Amt % Amt % June-11 Mar-12
Revenues 39402 100 32211 100 41670 100 143710 100 22.32 -5.44
Consumption of Raw Material 24818 63 19707 61 26508 64 87726 61 26% -6%
Employees Cost 2537 6 2209 7 2267 5 9002 6 15% 12%
Operating expenditure 8226 21 6817 21 8875 21 31855 22 21% -7%
EBIDTA 3822 10 3478 11 4020 10 15128 11 10% -5%
Depreciation 1139 3 927 3 1066 3 4048 3 23% 7%
Interest and Finance Charges
(net)1114 3 894 3 1165 3 3968 3 25% -4%
Profit Before Tax 1569 4 1657 5 1789 4 7111 5 -5% -12%
Tax Expense 443 1 431 1 354 1 1545 1 3% 25%
Net Profit After Tax 1126 3 1226 4 1435 3 5566 4 -8% -22%
(` in lacs)

Balance Sheet Summary
Particulars June-12 June-11 Mar-12
SHAREHOLDERS’ FUNDS:
(a) Capital 1,492 1,492 1,492
(b) Reserves and Surplus 40,078 35,312 38,952
LOAN FUNDS 35,238 24,616 36,167
DEFERRED TAX LIABILITY(Net) 1,785 1,555 1,847
TOTAL 78,594 62,975 78,459
FIXED ASSETS 34,423 31,437 34,031
INVESTMENTS 2,530 2,530 2,530
CURRENT ASSETS, LOANS AND ADVANCES
(a) Inventories 26,252 21,781 27,291
(b) Sundry Debtors 20,341 13,733 19,756
(c) Cash and Bank balances 2,193 1,973 2,121
(d) Loans and Advances 9,937 8,553 8,809
Less: CURRENT LIABILITIES AND PROVISIONS
(a) Liabilities 14,613 14,992 13,874
(b) Provisions 2,469 2,041 2,205
NET CURRENT ASSETS 41,642 29,008 41,898
TOTAL 78,594 62,975 78,459
(` in lacs)

Performance of Joint Venture & Subsidiary Companies
(` in lacs.)
Quarter Ended June 12 Quarter Ended June 11Name of the company Currency Turn Over Net Profit / (Loss) Turn over Net Profit / (Loss)
NBSSPL INR 1590 104 809 (28)
NEPPL SLR 2480 11 2360 230INR 1030 5 961 94
NCB- FZE AED 38 5 27 2INR 581 74 328 21
CNPL INR 464 56 110 19Total INR 3664 238 2210 106Based on our holding INR 157 88
NBSSPL -Nilkamal BITO Storage Systems Pvt. Ltd. (Joint Venture).NEPPL -Nilkamal Eswaran Plastic Pvt. Ltd (Sri Lankan Subsidiary).NCB - FZE - Nilkamal Crates & Bins FZE (Ajman subsidiary) CNPL- Cambro Nilkamal Pvt Ltd (Joint Venture)

Business Review

Plastics - Business Review
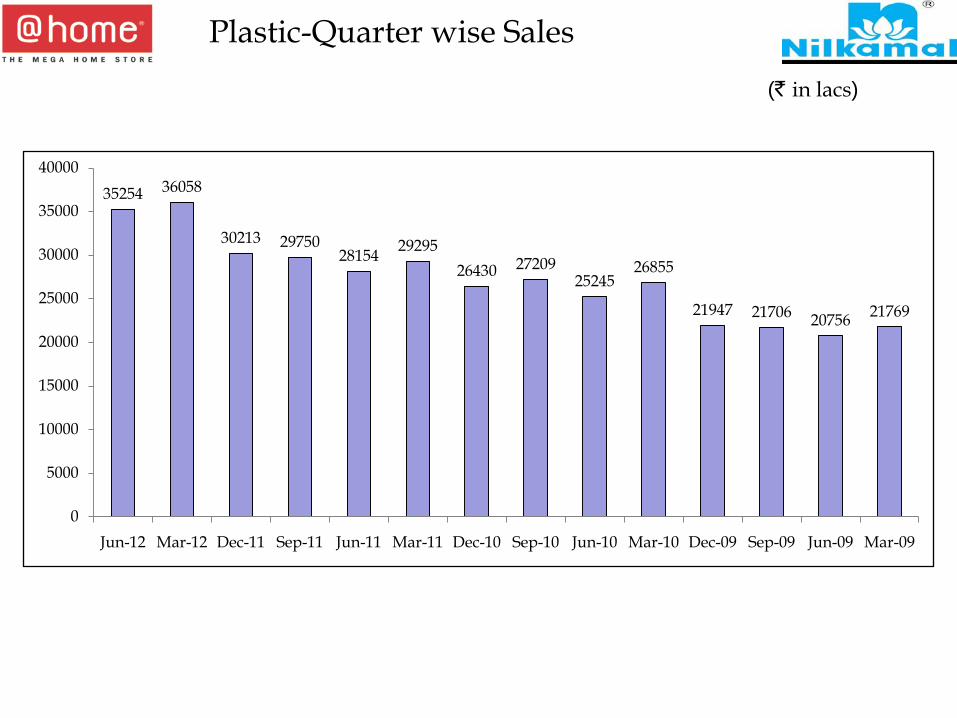
35254 36058
30213 2975028154 29295
26430 2720925245
26855
21947 21706 20756 21769
0
5000
10000
15000
20000
25000
30000
35000
40000
Jun-12 Mar-12 Dec-11 Sep-11 Jun-11 Mar-11 Dec-10 Sep-10 Jun-10 Mar-10 Dec-09 Sep-09 Jun-09 Mar-09
Plastic-Quarter wise Sales
(` in lacs)

Plastics – Income Statement Summary-Quarterly
Particulars % to Sales June - 12 % to Sales June - 11 % to Sales Mar - 12
I INCOME
Gross Sales ans Income from Sales 40,622 32,303 41,551 Less : Duties and Levies 5,368 4,095 5,494
Net Sales 100.00 35,254 100.00 28,208 100.00 36,057 Other Income 29 80 123 Total Income 35,283 28,288 36,180 II EXPENDITURE
Materials consumed / Cost of goods traded 64.23 22,645 62.61 17,662 65.11 23,475 Employees Remuneration & Benefits 5.91 2,083 6.44 1,816 5.19 1,873 Operating & other expenses
Stores, Spare Parts Consumed 1.47 520 0.93 261 1.65 593 Power & Fuel 2.98 1,052 3.23 910 2.93 1,055 Packing Material Consumed 0.72 254 0.79 223 0.77 278 Travelling Expenses 0.63 221 0.82 232 0.66 239 Carriage outward 4.30 1,516 5.76 1,625 4.33 1,561 Other Operating expenses 8.31 2,928 7.32 2,065 8.26 2,979
Financial Expenses 3.05 1,075 3.04 857 3.09 1,114 Depreciation 2.94 1,037 3.04 857 2.72 979
Total 94.55 33,331 93.97 26,508 94.70 34,146 Profit before Taxation 5.54 1,952 6.31 1,780 5.64 2,034
(` in lacs)

@home – Business Review

Retail Quarter Wise Sales
4114
5946
4345
5364
3921
5006
4158
4707
3355 36
93
3003
2995
2267
2719 2835
0
1000
2000
3000
4000
5000
6000
7000
Jun-12 Mar-12 Dec-11 Sep-11 Jun-11 Mar-11 Dec-10 Sep-10 Jun-10 Mar-10 Dec-09 Sep-09 Jun-09 Mar-09 Dec-08
Sale
s in
lacs
Quarter
(` in lacs)

Region wise quarter wise Walkin
West - YOY Growth : 29%, QoQ Growth : -9%
Gujarat - YOY Growth : -12%, QoQ Growth : -29%
South - YOY Growth : -14%, QoQ Growth : -28%
North - YOY Growth : 21%, QoQ Growth : -47%
1729
47
4578
8
1098
27
1200
4
1344
59
5232
2
1278
35
9954
1900
38
6445
2
1530
83
2259
6
0
20000
40000
60000
80000
100000
120000
140000
160000
180000
200000
West Gujarat South North
No.
of W
alki
ns
Region
Jun-12 Jun-11 Mar-12

Region wise quarter wise Conv.%
18%
26%
42%
31%
26%
26% 28
%
34%
26% 28
%
39%
26%
0%
5%
10%
15%
20%
25%
30%
35%
40%
45%
West Gujarat South North
% o
f Con
vers
ion
Region
Jun-12 Jun-11 Mar-12

Sales Per Sq. ft. per month
364
486
490
583
474
620
522
0
100
200
300
400
500
600
700
Jun-12 Mar-12 Dec-11 Sep-11 Jun-11 Mar-11 Dec-10
in R
s.
Quarter

@home – Income Statement Summary
PARTICULAR Amt % Amt % Amt % Amt %
I INCOME Gross : Sales and Income from Sales 4,610 6,163 4,341 21,293 Less : Duties and Levies 497 667 420 2,167 Net Sales 4,114 100% 5,496 100% 3,921 100% 19,126 100%Other Income 2 0% (7) 0% 1 0% 1 0%
TOTAL SALES TURNOVER 4,116 5,489 3,923 19,127
II EXPENDITUREMATERIAL CONSUMED 2,173 53% 3,033 55% 2,045 52% 10,111 53%EMPLOYEES REMUNERATION 454 11% 395 7% 393 10% 1,636 9%
OPERATING EXPRENT 641 16% 640 12% 489 12% 2,240 12%ELECTRICITY 178 4% 131 2% 116 3% 480 3%ADVERTISEMENT 194 5% 400 7% 232 6% 1,409 7%TRANSPORTATION 109 3% 194 4% 116 3% 652 3%OTHER OPERATING EXP 581 14% 775 14% 534 14% 2,581 13%
EMI SUBVANTION CHARGES ON FINANCE SCHEME 31 1% 30 1% 15 0% 88 0%CREDIT CARD EXP 27 1% 36 1% 28 1% 131 1%OTHER FINANCIAL EXP 9 0% 14 0% 9 0% 39 0%DEPRECIATION 102 2% 87 2% 70 2% 311 2%
TOTAL 4,499 109% 5,734 104% 4,046 103% 19,679 103%
PROFIT BEFORE TAXATION (383) -9% (245) -4% (123) -3% (552) -3%
Qtr Ended Mar 12 Qtr Ended Jun 11 Year Ended Mar 12Qtr Ended Jun 12
(` in lacs)

Thank you