Q1 FY19 Financial Update...• Salesforce retrospectively adopted new accounting standard Topic 606...
26
Q1 FY19 Financial Update Salesforce NYSE: CRM @Salesforce_ir 1
Transcript of Q1 FY19 Financial Update...• Salesforce retrospectively adopted new accounting standard Topic 606...

Q1 FY19Financial UpdateSalesforce
NYSE: CRM @Salesforce_ir
1
"Safe harbor" statement under the Private Securities Litigation Reform Act of 1995: This presentation contains forward-looking statements about our financial results, which may include expected GAAP and non-GAAP financial and other operating and non-operating results, including revenue, net income, diluted earnings per share, operating cash flow growth, operating margin improvement, unearned revenue (previously referred to as deferred revenue) growth, expected revenue growth, expected tax rates, stock-based compensation expenses, amortization of purchased intangibles, amortization of debt discount and shares outstanding. The achievement or success of the matters covered by such forward-looking statements involves risks, uncertainties and assumptions. If any such risks or uncertainties materialize or if any of the assumptions prove incorrect, the company’s results could differ materially from the results expressed or implied by the forward-looking statements we make.
The risks and uncertainties referred to above include -- but are not limited to -- risks associated with the effect of general economic and market conditions; the impact of foreign currency exchange rate and interest rate fluctuations on our results; our business strategy and our plan to build our business, including our strategy to be the leading provider of enterprise cloud computing applications and platforms; the pace of change and innovation in enterprise cloud computing services; the competitive nature of the market in which we participate; our international expansion strategy; our service performance and security, including the resources and costs required to prevent, detect and remediate potential security breaches; the expenses associated with new data centers and third-party infrastructure providers; additional data center capacity; real estate and office facilities space; our operating results and cash flows; new services and product features; our strategy of acquiring or making investments in complementary businesses, joint ventures, services, technologies and intellectual property rights; the performance and fair value of our investments in complementary businesses through our strategic investment portfolio; our ability to realize the benefits from strategic partnerships and investments; our ability to successfully integrate acquired businesses and technologies, including the operations of MuleSoft, Inc.; our ability to continue to grow and maintain unearned revenue and remaining transaction price (previously referred to as deferred revenue and unbilled deferred revenue); our ability to protect our intellectual property rights; our ability to develop our brands; our reliance on third-party hardware, software and platform providers; our dependency on the development and maintenance of the infrastructure of the Internet; the effect of evolving domestic and foreign government regulations, including those related to the provision of services on the Internet, those related to accessing the Internet, and those addressing data privacy and import and export controls; the valuation of our deferred tax assets; the potential availability of additional tax assets in the future; the impact of new accounting pronouncements and tax laws, including the U.S. Tax Cuts and Jobs Act, and interpretations thereof; uncertainties affecting our ability to estimate our non-GAAP tax rate; the impact of expensing stock options and other equity awards; the sufficiency of our capital resources; factors related to our outstanding debt, revolving credit facility, term loan and loan associated with 50 Fremont; compliance with our debt covenants and capital lease obligations; current and potential litigation involving us; and the impact of climate change.
Further information on these and other factors that could affect the company’s financial results is included in the reports on Forms 10-K, 10-Q and 8-K and in other filings we make with the Securities and Exchange Commission from time to time. These documents are available on the SEC Filings section of the Investor Information section of the company’s website at www.salesforce.com/investor.
Salesforce.com, inc. assumes no obligation and does not intend to update these forward-looking statements, except as required by law.
Safe Harbor
2
Company OverviewThe global leader in CRM
Founded in 1999, public listing (NYSE: CRM) 2004
#1 CRM provider for the fifth year in a row1
Fastest growing top five enterprise software company with $10.54B in revenue FY18 (25% Y/Y)2
Doubled operating cash flow ($1.2B-$2.7B) over the past three years (FY15-FY18)
Headquartered in San Francisco, with >30,000 Employees focused on CRM and customer success
3
1Source: IDC Worldwide Semiannual Software Tracker, April 2018. CRM Applications market includes the following IDC-defined functional markets: Sales, Customer Service, Contact Center, and Marketing Applications.2Prior period information has been adjusted for the adoption of Accounting Standards Update No. 2014-09, “Revenue from Contracts with Customers (Topic 606)”, which the Company adopted on February 1, 2018. Refer to slide 5 for additional discussion.
#1 World’s MostInnovative Companies
Best Places to Workfor LGBTQ Equality
#1 Top 50 Companies that Care
The World’s Most Innovative Companies
#1 The Future 50

Financial OverviewQuarterly Results
4
Notes on Q1 Results
5
Adoption of New Accounting Standards• Salesforce retrospectively adopted new accounting standard Topic 606 on February 1, 2018• Topic 606 includes changes to accounting policies for revenue recognition and costs capitalized to acquire
revenue contracts (primarily commissions)• All financial results and guidance in this presentation reflect Topic 606. Historical results for FY17, FY18 and
Q1-Q4 of FY18 are adjusted to reflect the new standard• Refer to the Q1 FY19 press release for additional information, including adjusted historical Statements of
Operations and Balance Sheets• Adjusted information is based on best available information and reflects management's best estimate of the
potential impact as a result of the adoption of the new standard• Reconciliations to prior standards will not be provided
MuleSoft Acquisition• The MuleSoft acquisition closed on May 2, 2018 subsequent to Q1 FY19• Q2 FY19 and FY19 guidance reflect the anticipated financial impact of the MuleSoft acquisition
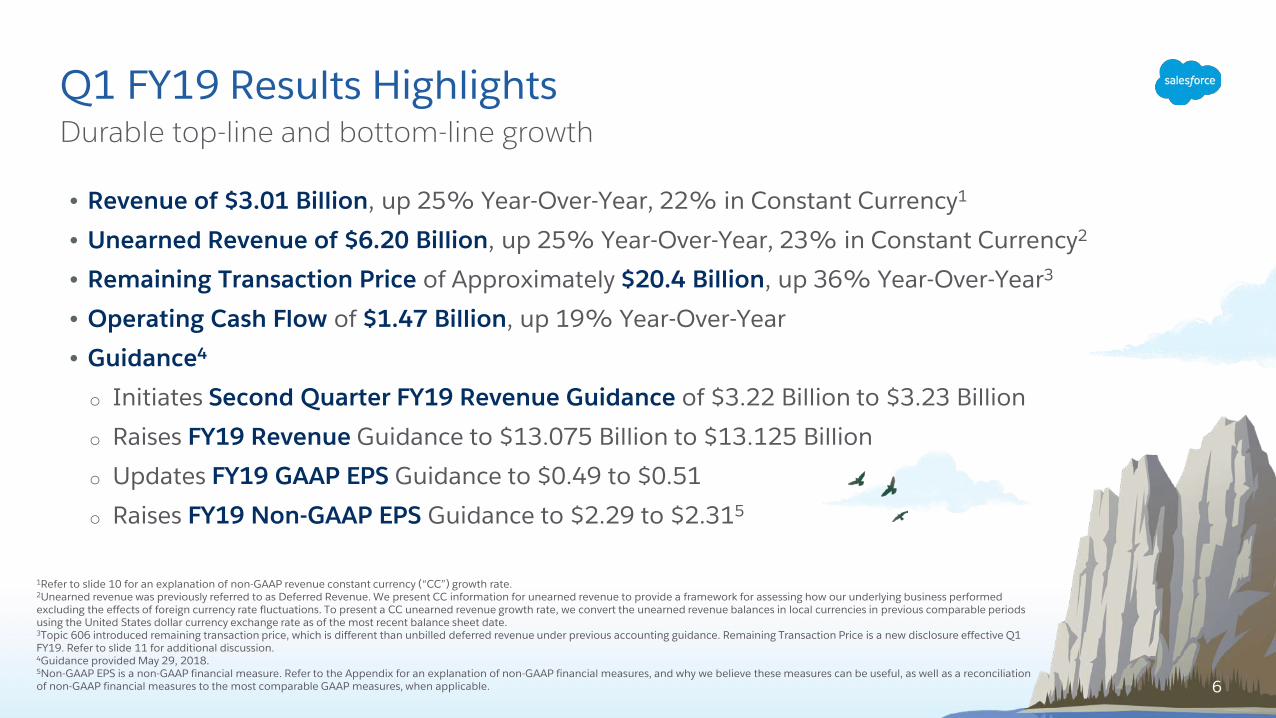
Q1 FY19 Results HighlightsDurable top-line and bottom-line growth
1Refer to slide 10 for an explanation of non-GAAP revenue constant currency (“CC”) growth rate.2Unearned revenue was previously referred to as Deferred Revenue. We present CC information for unearned revenue to provide a framework for assessing how our underlying business performed excluding the effects of foreign currency rate fluctuations. To present a CC unearned revenue growth rate, we convert the unearned revenue balances in local currencies in previous comparable periods using the United States dollar currency exchange rate as of the most recent balance sheet date.3Topic 606 introduced remaining transaction price, which is different than unbilled deferred revenue under previous accounting guidance. Remaining Transaction Price is a new disclosure effective Q1 FY19. Refer to slide 11 for additional discussion.4Guidance provided May 29, 2018. 5Non-GAAP EPS is a non-GAAP financial measure. Refer to the Appendix for an explanation of non-GAAP financial measures, and why we believe these measures can be useful, as well as a reconciliation of non-GAAP financial measures to the most comparable GAAP measures, when applicable.
• Revenue of $3.01 Billion, up 25% Year-Over-Year, 22% in Constant Currency1
• Unearned Revenue of $6.20 Billion, up 25% Year-Over-Year, 23% in Constant Currency2
• Remaining Transaction Price of Approximately $20.4 Billion, up 36% Year-Over-Year3
• Operating Cash Flow of $1.47 Billion, up 19% Year-Over-Year
• Guidance4
o Initiates Second Quarter FY19 Revenue Guidance of $3.22 Billion to $3.23 Billion
o Raises FY19 Revenue Guidance to $13.075 Billion to $13.125 Billion
o Updates FY19 GAAP EPS Guidance to $0.49 to $0.51
o Raises FY19 Non-GAAP EPS Guidance to $2.29 to $2.315
6
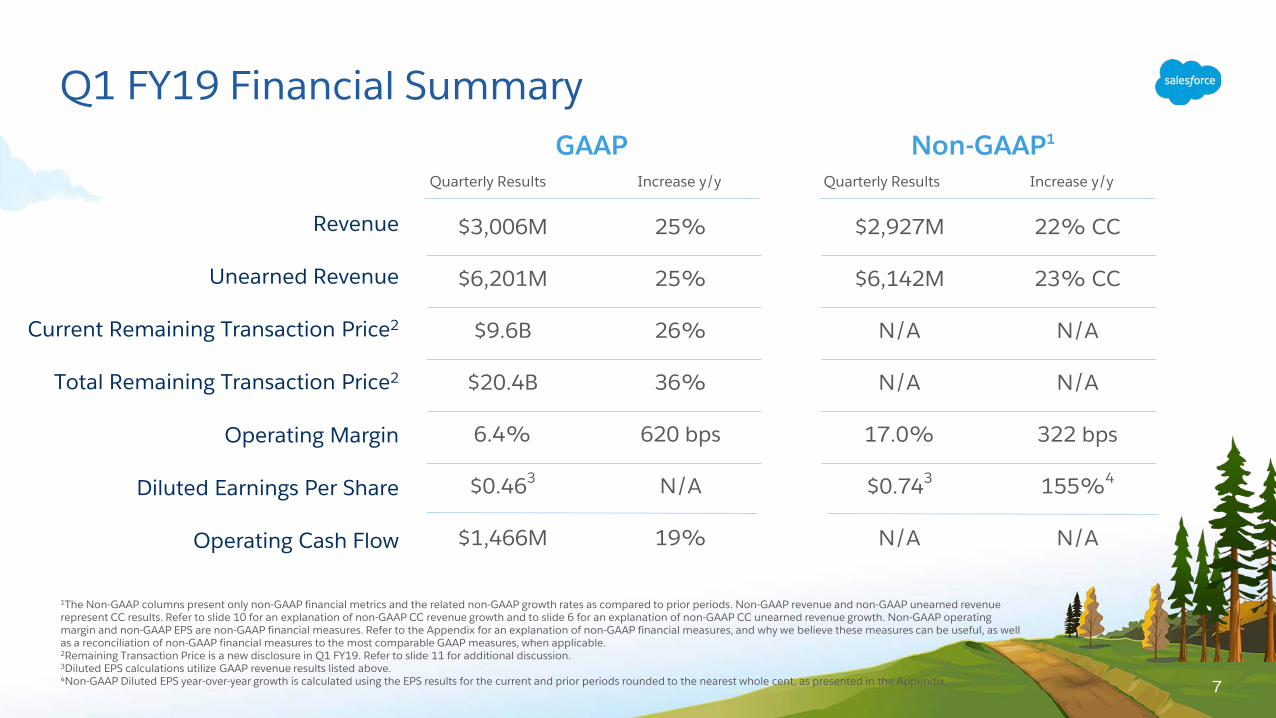
Q1 FY19 Financial Summary
Diluted Earnings Per Share
Operating Cash Flow
Total Remaining Transaction Price2
Revenue
Current Remaining Transaction Price2
Unearned Revenue
$3,006M 25%
$6,201M 25%
$9.6B 26%
$20.4B 36%
6.4% 620 bps
$0.463 N/A
$1,466M 19%
$2,927M 22% CC
$6,142M 23% CC
N/A N/A
N/A N/A
17.0% 322 bps
$0.743 155%4
N/A N/A
7
1The Non-GAAP columns present only non-GAAP financial metrics and the related non-GAAP growth rates as compared to prior periods. Non-GAAP revenue and non-GAAP unearned revenue represent CC results. Refer to slide 10 for an explanation of non-GAAP CC revenue growth and to slide 6 for an explanation of non-GAAP CC unearned revenue growth. Non-GAAP operating margin and non-GAAP EPS are non-GAAP financial measures. Refer to the Appendix for an explanation of non-GAAP financial measures, and why we believe these measures can be useful, as well as a reconciliation of non-GAAP financial measures to the most comparable GAAP measures, when applicable. 2Remaining Transaction Price is a new disclosure in Q1 FY19. Refer to slide 11 for additional discussion.3Diluted EPS calculations utilize GAAP revenue results listed above.4Non-GAAP Diluted EPS year-over-year growth is calculated using the EPS results for the current and prior periods rounded to the nearest whole cent, as presented in the Appendix.
Non-GAAP1GAAPQuarterly Results Increase y/y Quarterly Results Increase y/y
Operating Margin
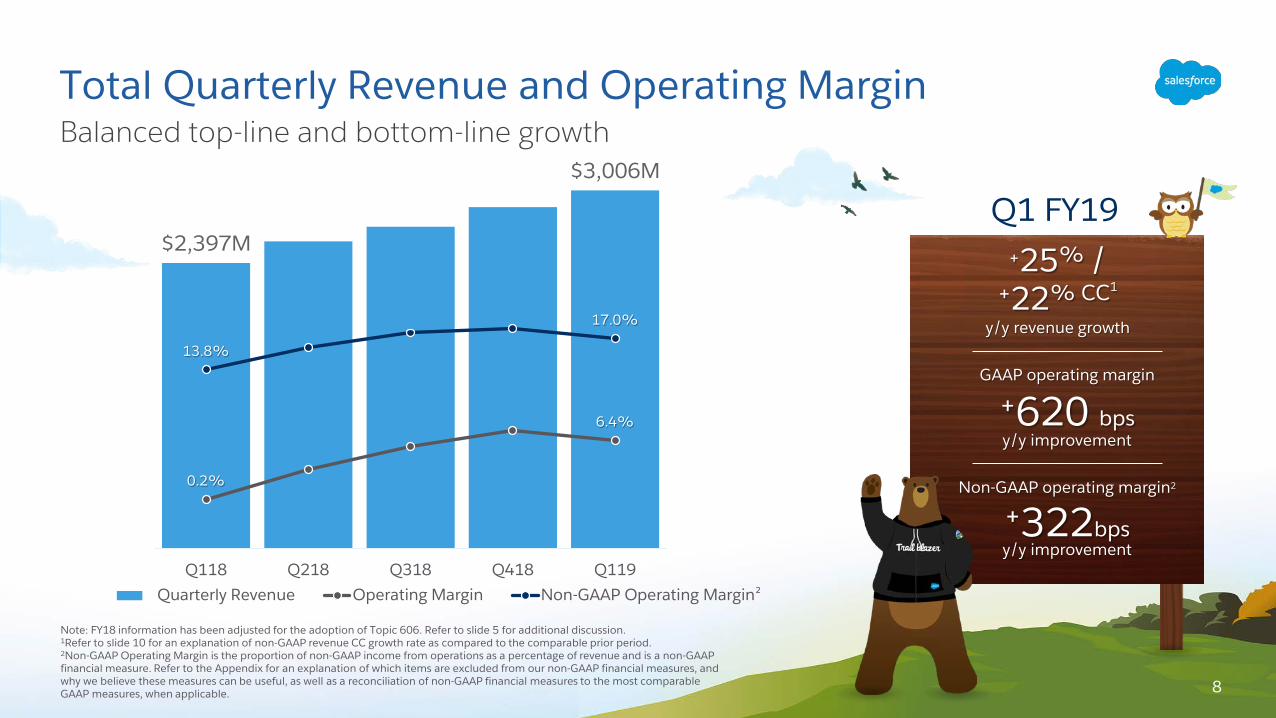
Total Quarterly Revenue and Operating MarginBalanced top-line and bottom-line growth
Q1 FY19
Non-GAAP operating margin2
y/y improvement
+322bps
GAAP operating margin
y/y improvement
+620 bps
2
$2,397M
$3,006M
0.2%
6.4%
13.8%
17.0%
Q118 Q218 Q318 Q418 Q119
Quarterly Revenue Operating Margin Non-GAAP Operating Margin
8
Note: FY18 information has been adjusted for the adoption of Topic 606. Refer to slide 5 for additional discussion.1Refer to slide 10 for an explanation of non-GAAP revenue CC growth rate as compared to the comparable prior period.2Non-GAAP Operating Margin is the proportion of non-GAAP income from operations as a percentage of revenue and is a non-GAAP financial measure. Refer to the Appendix for an explanation of which items are excluded from our non-GAAP financial measures, and why we believe these measures can be useful, as well as a reconciliation of non-GAAP financial measures to the most comparable GAAP measures, when applicable.
+25% /+22% CC1
y/y revenue growth
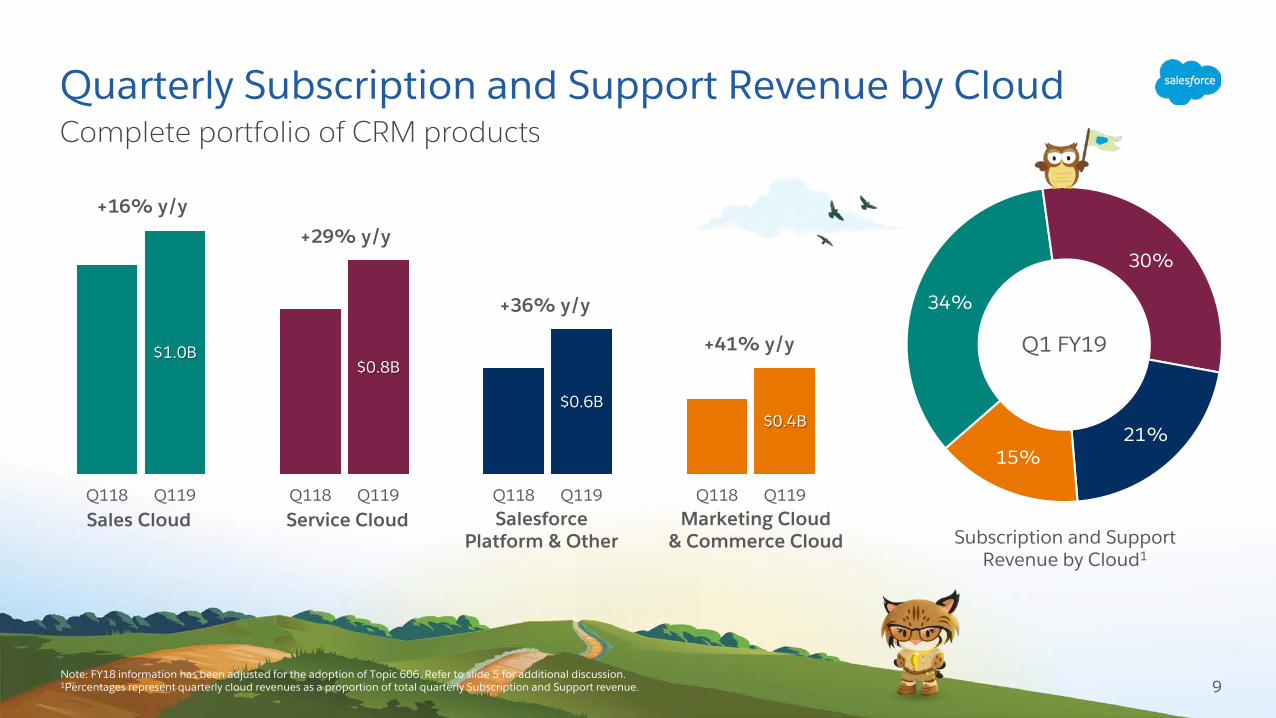
Quarterly Subscription and Support Revenue by CloudComplete portfolio of CRM products
Note: FY18 information has been adjusted for the adoption of Topic 606. Refer to slide 5 for additional discussion.1Percentages represent quarterly cloud revenues as a proportion of total quarterly Subscription and Support revenue. 9
$1.0B$0.8B
$0.6B$0.4B
Q118 Q119 Q118 Q119 Q118 Q119 Q118 Q119Salesforce
Platform & OtherMarketing Cloud
& Commerce CloudService CloudSales Cloud
34%
30%
21%15%
Subscription and Support Revenue by Cloud1
Q1 FY19
+16% y/y
+36% y/y
+41% y/y
+29% y/y
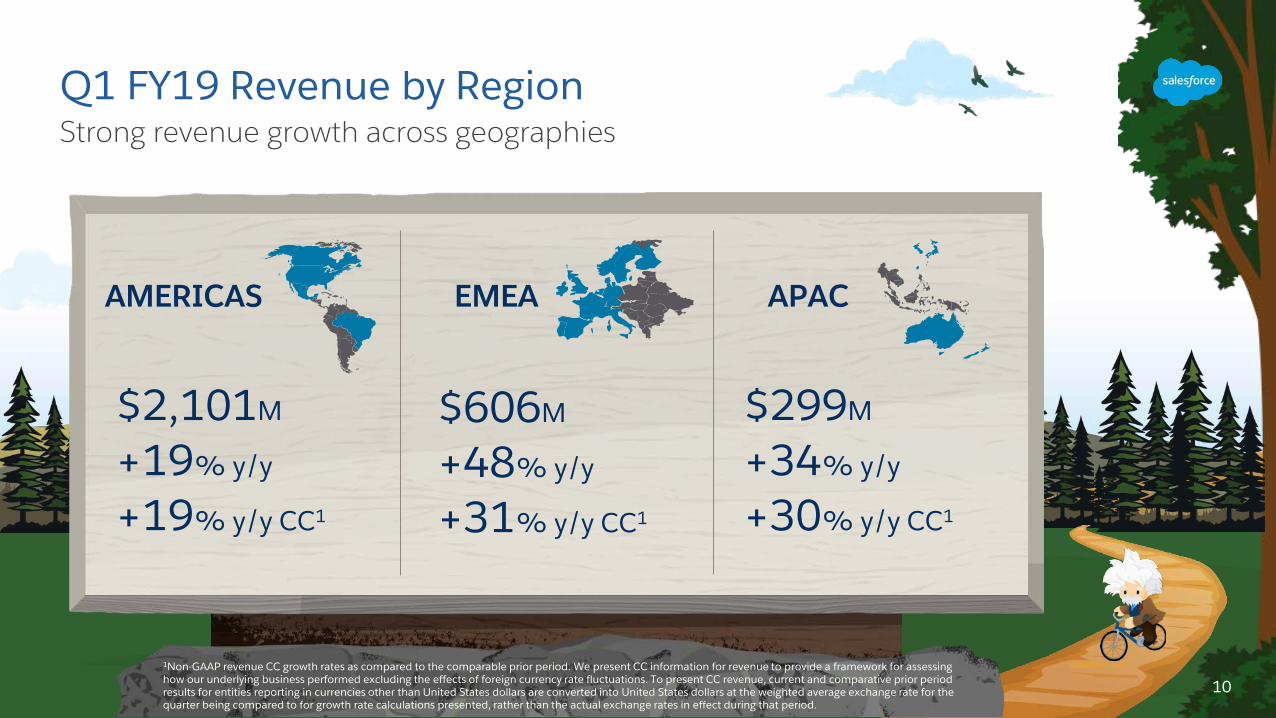
Strong revenue growth across geographiesQ1 FY19 Revenue by Region
$2,101M
+19% y/y
+19% y/y CC1
$606M
+48% y/y
+31% y/y CC1
$299M
+34% y/y
+30% y/y CC1
APACEMEAAMERICAS
10
1Non-GAAP revenue CC growth rates as compared to the comparable prior period. We present CC information for revenue to provide a framework for assessing how our underlying business performed excluding the effects of foreign currency rate fluctuations. To present CC revenue, current and comparative prior period results for entities reporting in currencies other than United States dollars are converted into United States dollars at the weighted average exchange rate for the quarter being compared to for growth rate calculations presented, rather than the actual exchange rates in effect during that period.
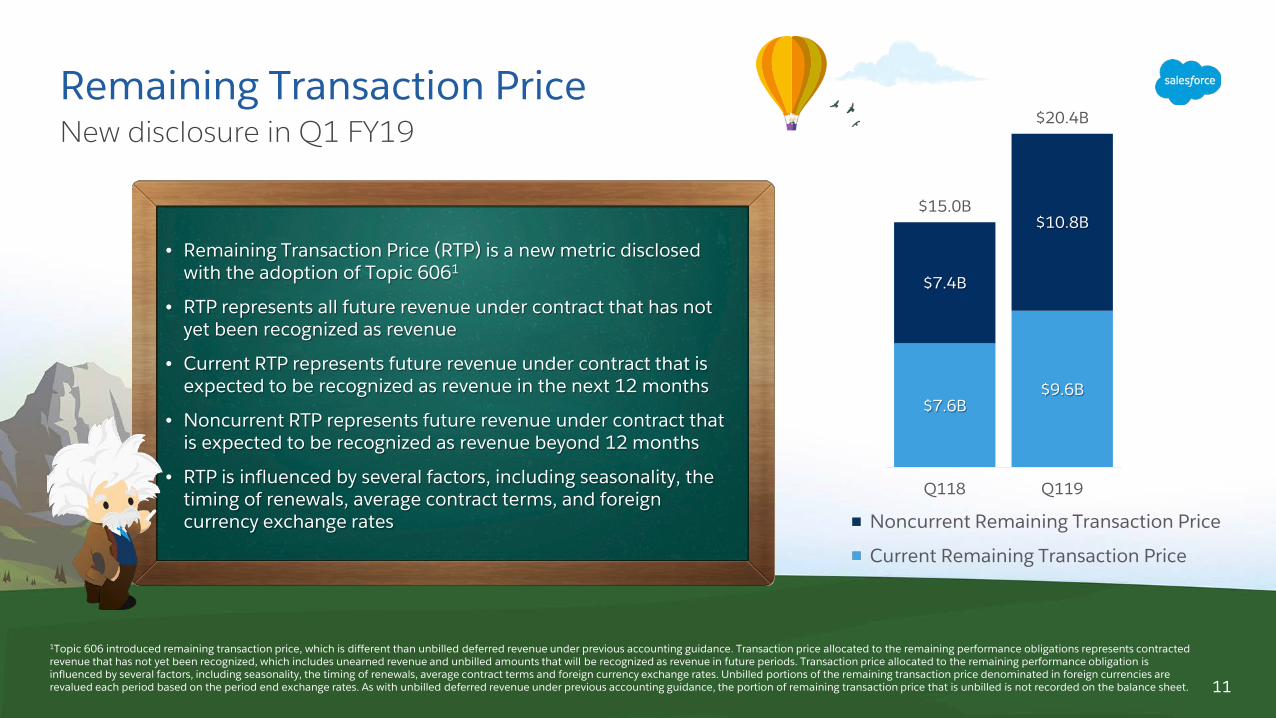
Remaining Transaction PriceNew disclosure in Q1 FY19
1Topic 606 introduced remaining transaction price, which is different than unbilled deferred revenue under previous accounting guidance. Transaction price allocated to the remaining performance obligations represents contracted revenue that has not yet been recognized, which includes unearned revenue and unbilled amounts that will be recognized as revenue in future periods. Transaction price allocated to the remaining performance obligation is influenced by several factors, including seasonality, the timing of renewals, average contract terms and foreign currency exchange rates. Unbilled portions of the remaining transaction price denominated in foreign currencies are revalued each period based on the period end exchange rates. As with unbilled deferred revenue under previous accounting guidance, the portion of remaining transaction price that is unbilled is not recorded on the balance sheet. 11
$7.6B$9.6B
$7.4B
$10.8B$15.0B
$20.4B
Q118 Q119
• Remaining Transaction Price (RTP) is a new metric disclosed with the adoption of Topic 6061
• RTP represents all future revenue under contract that has not yet been recognized as revenue
• Current RTP represents future revenue under contract that is expected to be recognized as revenue in the next 12 months
• Noncurrent RTP represents future revenue under contract that is expected to be recognized as revenue beyond 12 months
• RTP is influenced by several factors, including seasonality, the timing of renewals, average contract terms, and foreign currency exchange rates Noncurrent Remaining Transaction Price
Current Remaining Transaction Price
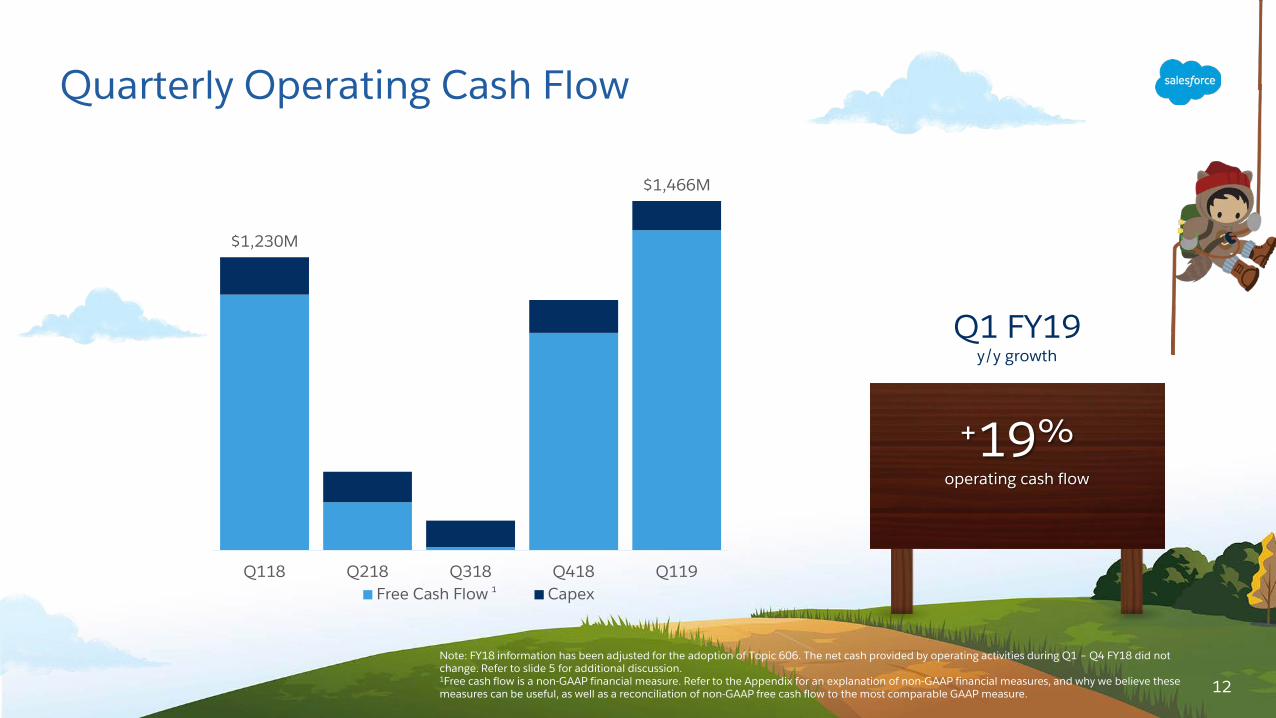
$1,230M
$1,466M
Q118 Q218 Q318 Q418 Q119Free Cash Flow Capex
Quarterly Operating Cash Flow
1
+19%operating cash flow
Q1 FY19y/y growth
12
Note: FY18 information has been adjusted for the adoption of Topic 606. The net cash provided by operating activities during Q1 – Q4 FY18 did not change. Refer to slide 5 for additional discussion.1Free cash flow is a non-GAAP financial measure. Refer to the Appendix for an explanation of non-GAAP financial measures, and why we believe these measures can be useful, as well as a reconciliation of non-GAAP free cash flow to the most comparable GAAP measure.
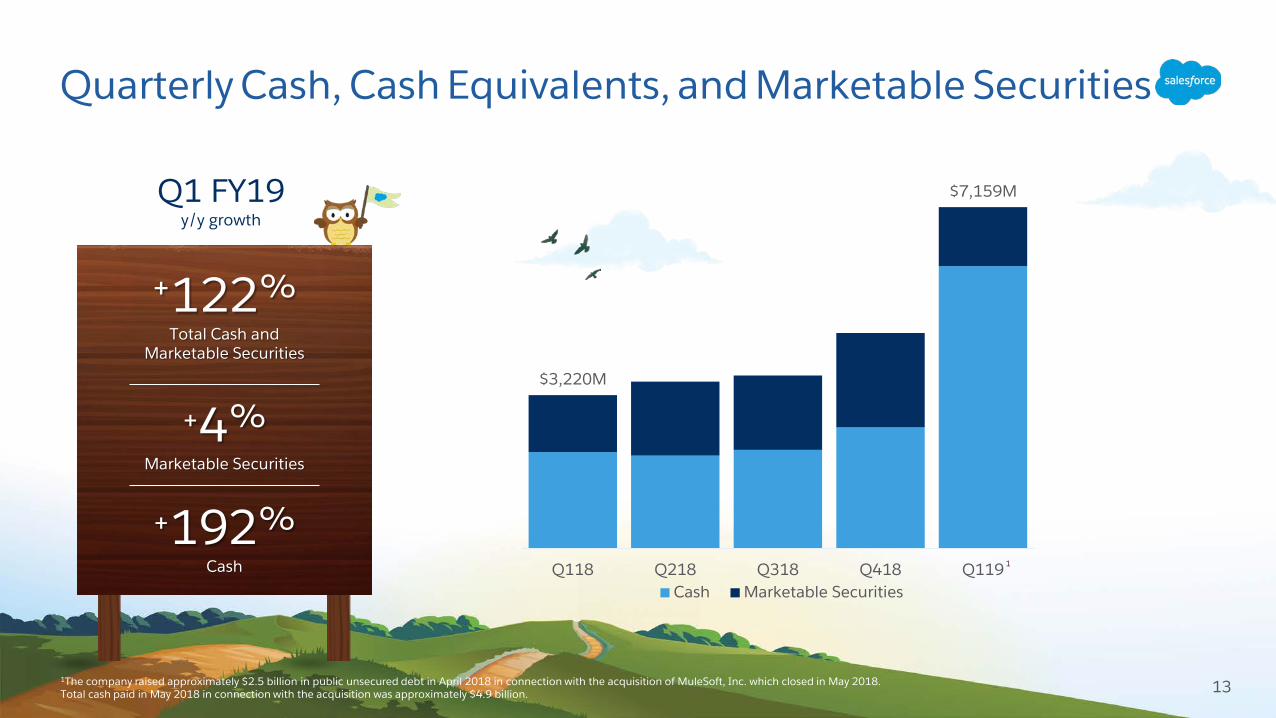
Quarterly Cash, Cash Equivalents, and Marketable Securities
Q1 FY19y/y growth
+4%Marketable Securities
+122%Total Cash and
Marketable Securities
+192%Cash
131The company raised approximately $2.5 billion in public unsecured debt in April 2018 in connection with the acquisition of MuleSoft, Inc. which closed in May 2018. Total cash paid in May 2018 in connection with the acquisition was approximately $4.9 billion.
$3,220M
$7,159M
Q118 Q218 Q318 Q418 Q119Cash Marketable Securities
1

Business Overview
14
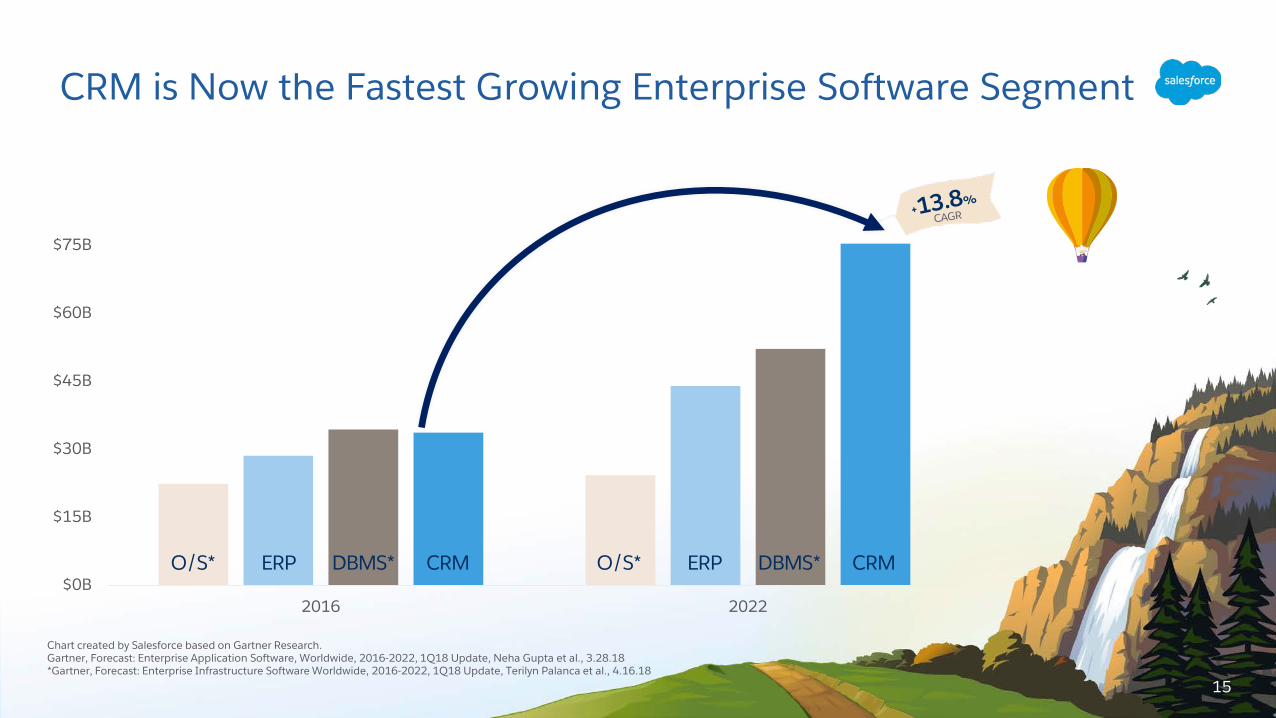
$0B
$15B
$30B
$45B
$60B
$75B
2016 2022
O/S* ERP DBMS* CRM
O/S* ERP DBMS* CRM
CRM is Now the Fastest Growing Enterprise Software Segment
O/S* ERP DBMS* CRM
15
Chart created by Salesforce based on Gartner Research. Gartner, Forecast: Enterprise Application Software, Worldwide, 2016-2022, 1Q18 Update, Neha Gupta et al., 3.28.18*Gartner, Forecast: Enterprise Infrastructure Software Worldwide, 2016-2022, 1Q18 Update, Terilyn Palanca et al., 4.16.18
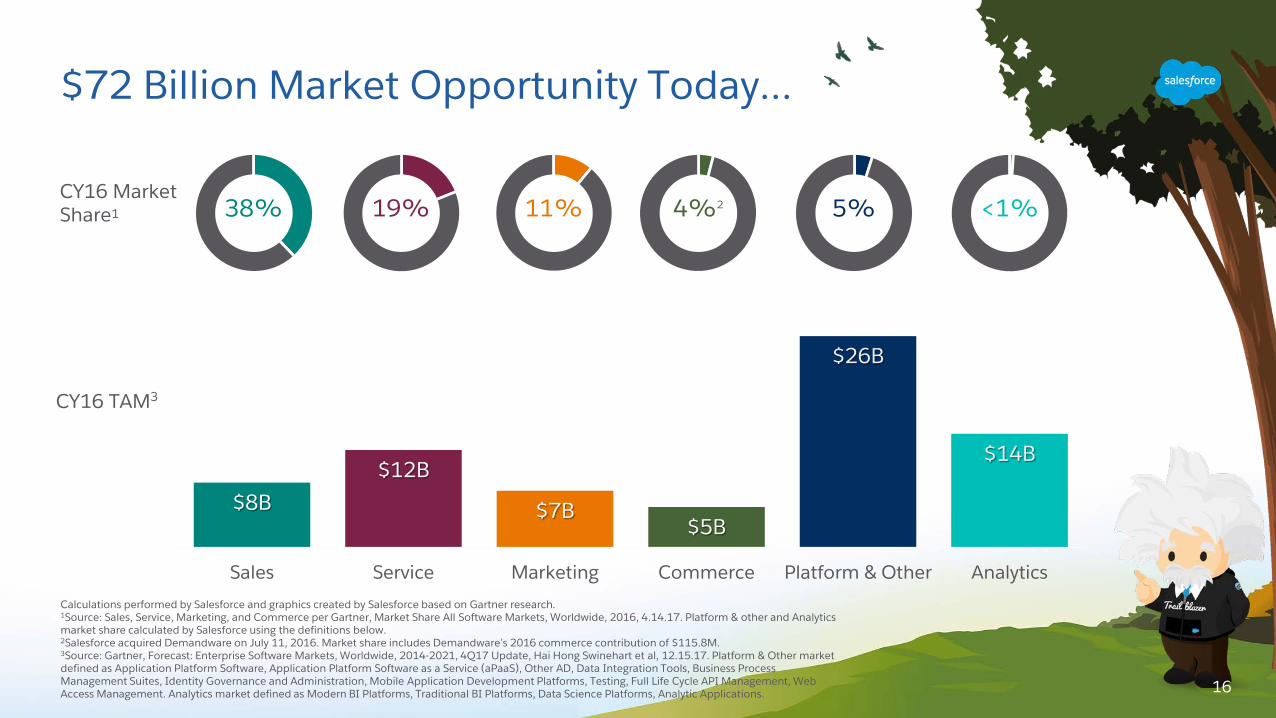
$72 Billion Market Opportunity Today…
38% 19% 11% 4%2 5%CY16 Market Share1 <1%
CY16 TAM3
$8B$12B
$7B$5B
$26B
$14B
Sales Service Marketing Commerce Platform & Other Analytics
16
Calculations performed by Salesforce and graphics created by Salesforce based on Gartner research.1Source: Sales, Service, Marketing, and Commerce per Gartner, Market Share All Software Markets, Worldwide, 2016, 4.14.17. Platform & other and Analytics market share calculated by Salesforce using the definitions below. 2Salesforce acquired Demandware on July 11, 2016. Market share includes Demandware’s 2016 commerce contribution of $115.8M.3Source: Gartner, Forecast: Enterprise Software Markets, Worldwide, 2014-2021, 4Q17 Update, Hai Hong Swinehart et al, 12.15.17. Platform & Other market defined as Application Platform Software, Application Platform Software as a Service (aPaaS), Other AD, Data Integration Tools, Business Process Management Suites, Identity Governance and Administration, Mobile Application Development Platforms, Testing, Full Life Cycle API Management, Web Access Management. Analytics market defined as Modern BI Platforms, Traditional BI Platforms, Data Science Platforms, Analytic Applications.
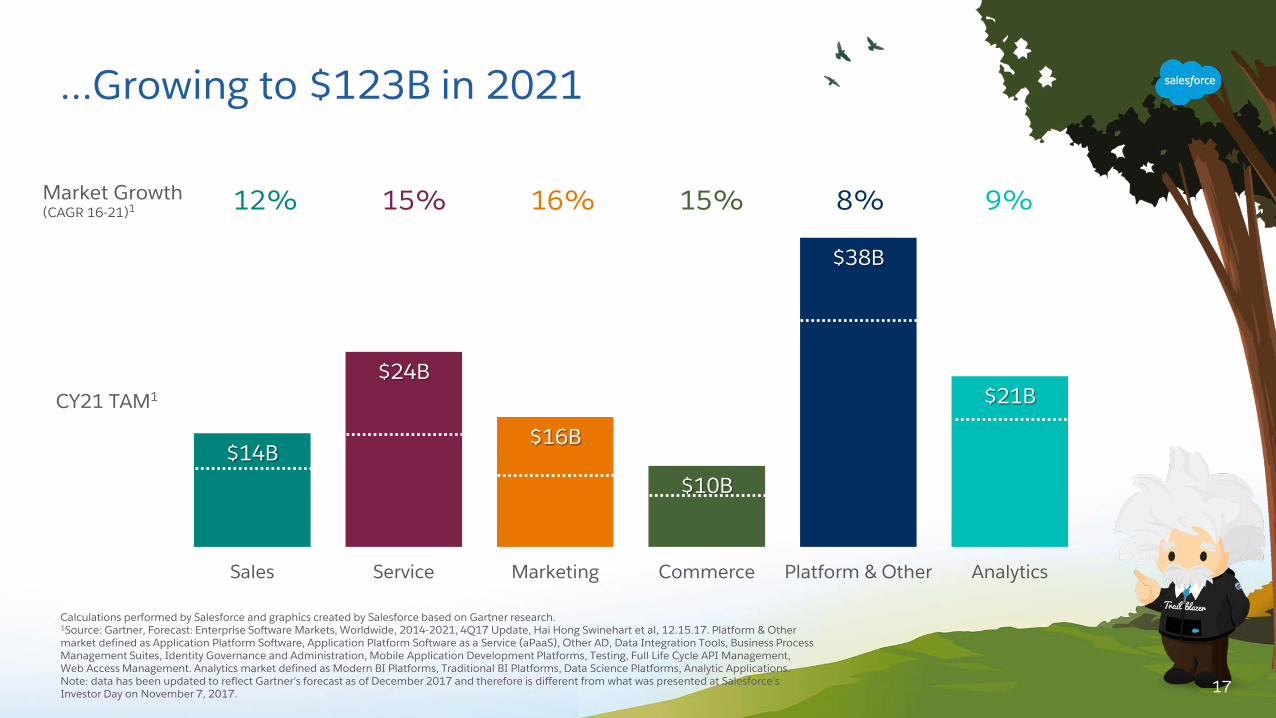
$14B
$24B
$16B
$10B
$38B
$21B
Sales Service Marketing Commerce Platform & Other Analytics
…Growing to $123B in 2021
Market Growth(CAGR 16-21)1 12% 15% 16% 15% 8% 9%
CY21 TAM1
17
Calculations performed by Salesforce and graphics created by Salesforce based on Gartner research.1Source: Gartner, Forecast: Enterprise Software Markets, Worldwide, 2014-2021, 4Q17 Update, Hai Hong Swinehart et al, 12.15.17. Platform & Other market defined as Application Platform Software, Application Platform Software as a Service (aPaaS), Other AD, Data Integration Tools, Business Process Management Suites, Identity Governance and Administration, Mobile Application Development Platforms, Testing, Full Life Cycle API Management, Web Access Management. Analytics market defined as Modern BI Platforms, Traditional BI Platforms, Data Science Platforms, Analytic Applications. Note: data has been updated to reflect Gartner’s forecast as of December 2017 and therefore is different from what was presented at Salesforce’s Investor Day on November 7, 2017.
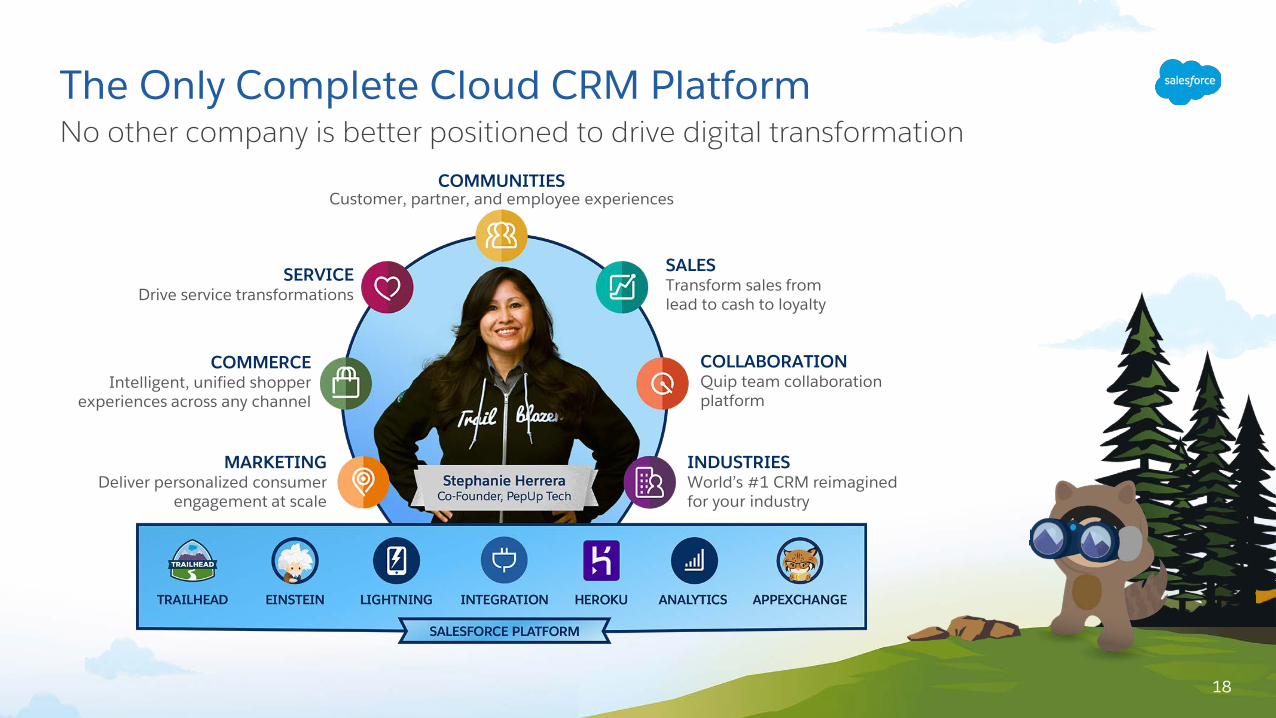
The Only Complete Cloud CRM PlatformNo other company is better positioned to drive digital transformation
18
MARKETINGDeliver personalized consumer
engagement at scale
SERVICEDrive service transformations
SALESTransform sales from lead to cash to loyalty
COMMERCEIntelligent, unified shopper
experiences across any channel
COMMUNITIESCustomer, partner, and employee experiences
INDUSTRIESWorld’s #1 CRM reimagined for your industry
COLLABORATIONQuip team collaboration platform
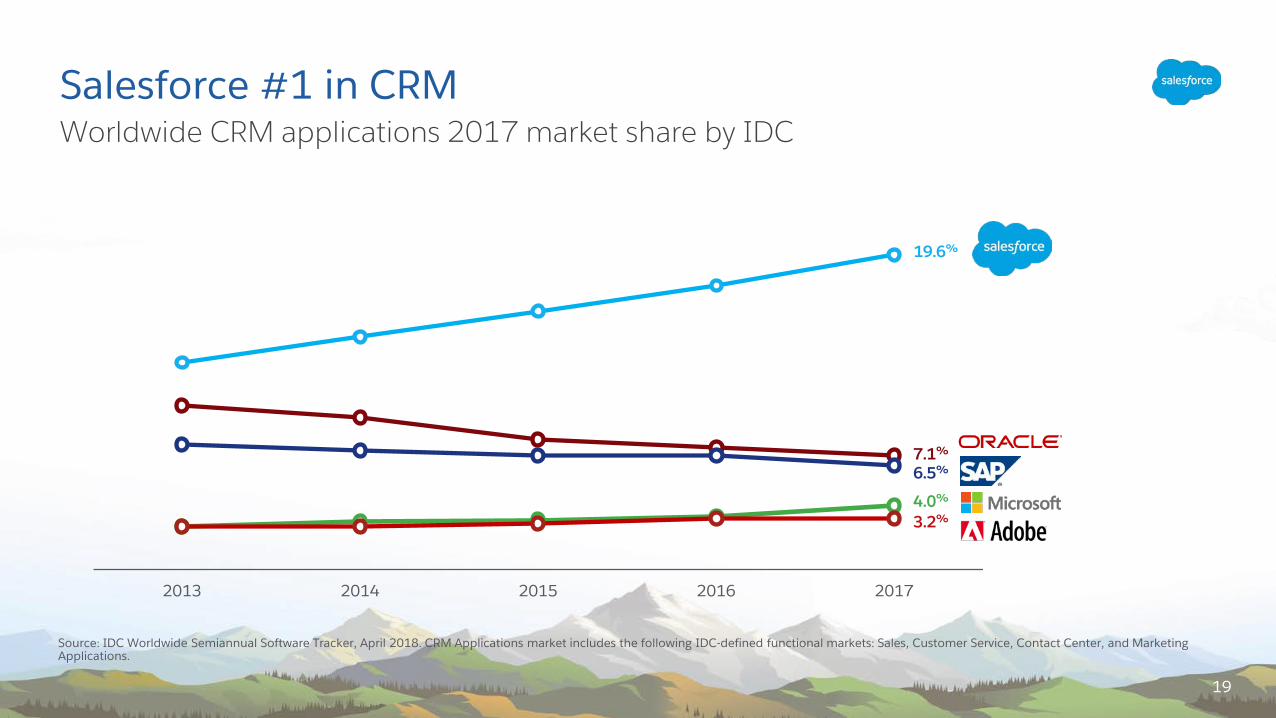
Salesforce #1 in CRMWorldwide CRM applications 2017 market share by IDC
Source: IDC Worldwide Semiannual Software Tracker, April 2018. CRM Applications market includes the following IDC-defined functional markets: Sales, Customer Service, Contact Center, and Marketing Applications.
2013 2014 2015 2016 2017
19.6%
7.1%
6.5%
4.0%
3.2%
19
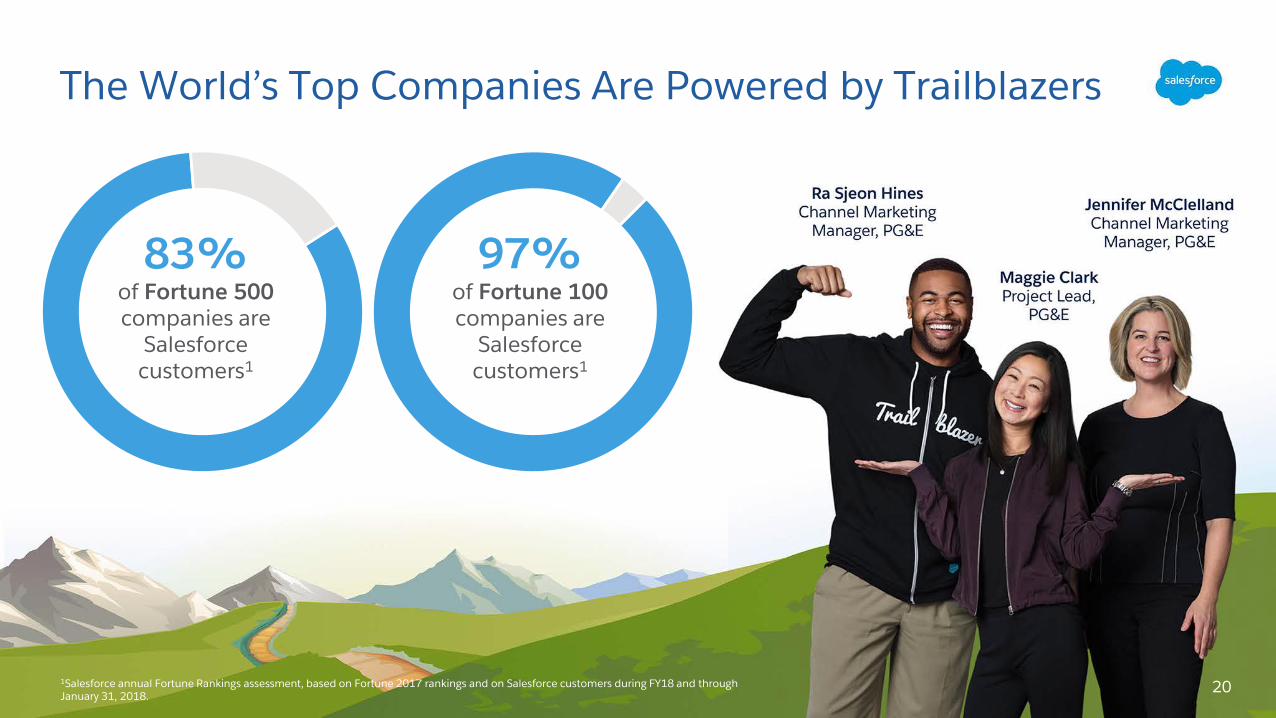
The World’s Top Companies Are Powered by Trailblazers
1Salesforce annual Fortune Rankings assessment, based on Fortune 2017 rankings and on Salesforce customers during FY18 and through January 31, 2018.
20
83% of Fortune 500 companies are
Salesforce customers1
97%of Fortune 100 companies are
Salesforce customers1
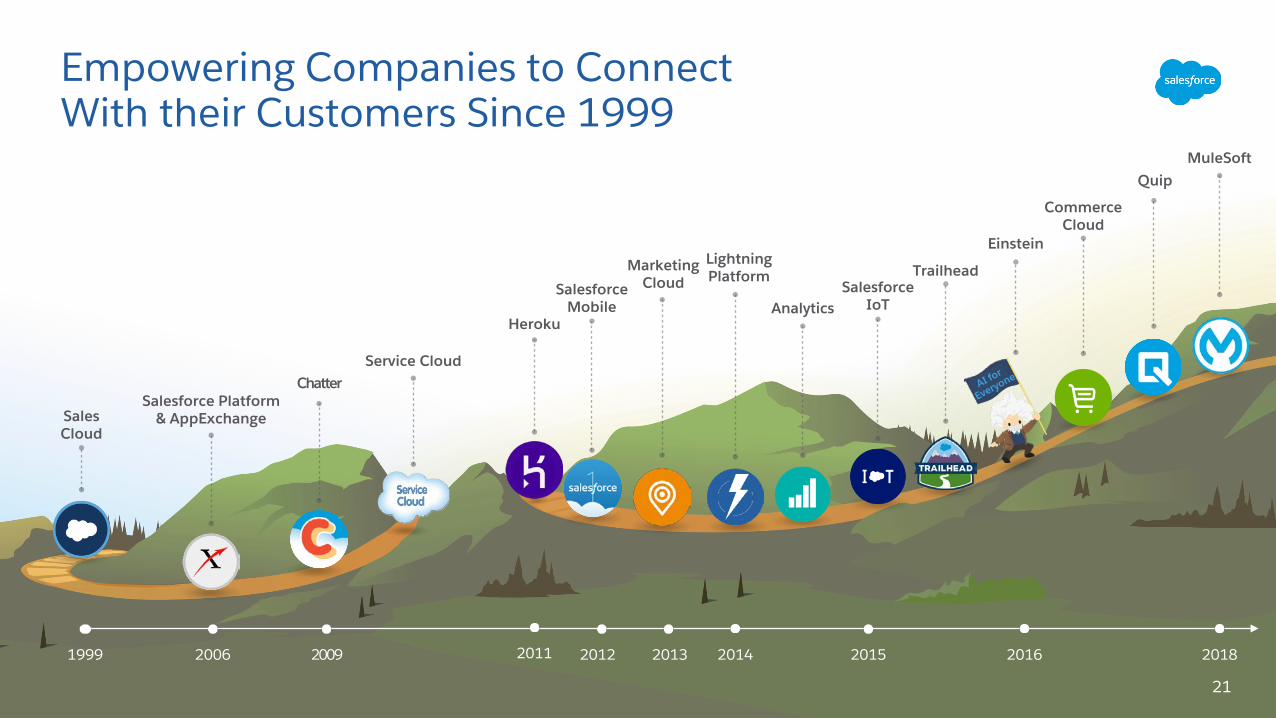
Empowering Companies to Connect With their Customers Since 1999
1999 2006 2011 2012 2014 20162009 2013 2015
Salesforce Platform& AppExchange
Chatter
Salesforce Mobile
Heroku
Marketing Cloud
Lightning Platform
AnalyticsSalesforce
IoT
Trailhead
Quip
Sales Cloud
Service Cloud
2018
Commerce Cloud
MuleSoft
Einstein
21
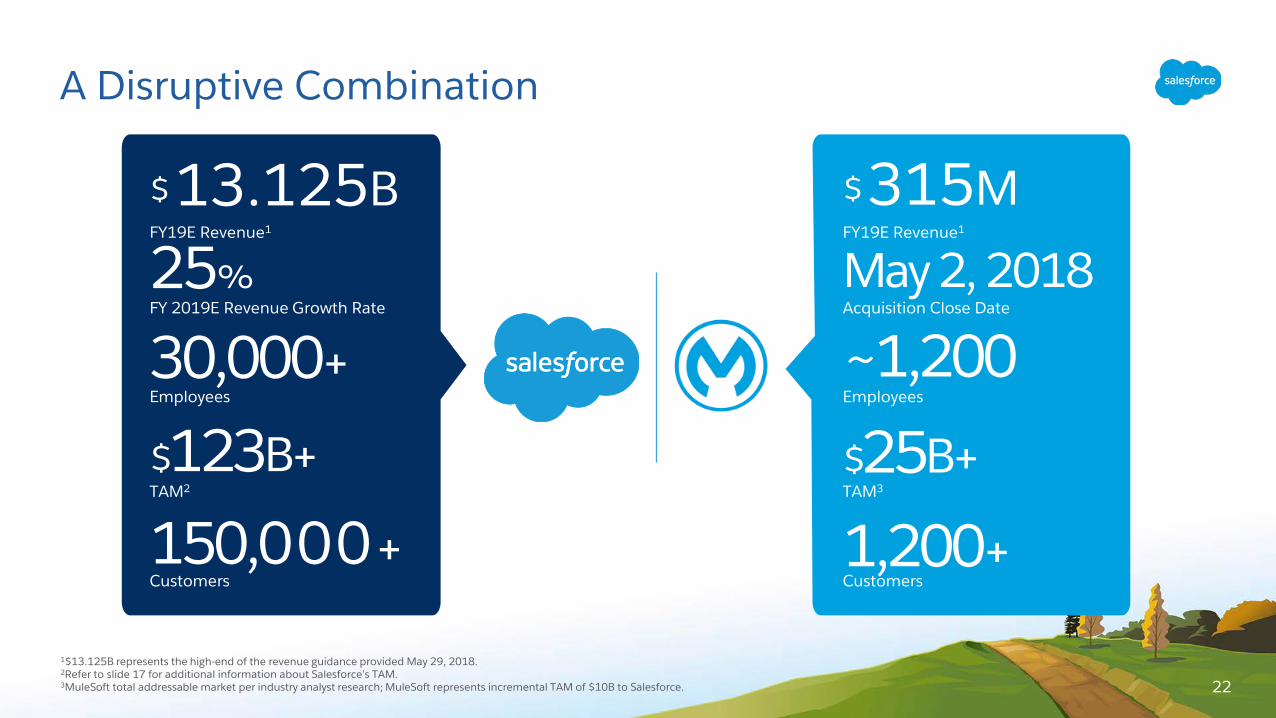
A Disruptive Combination
1$13.125B represents the high-end of the revenue guidance provided May 29, 2018. 2Refer to slide 17 for additional information about Salesforce’s TAM.3MuleSoft total addressable market per industry analyst research; MuleSoft represents incremental TAM of $10B to Salesforce. 22
30,000+Employees
$13.125BFY19E Revenue1
150,000+
25%FY 2019E Revenue Growth Rate
Customers
Employees
$315MFY19E Revenue1
May 2, 2018Acquisition Close Date
1,200+
~1,200
TAM2
$123B+ $25B+
Customers
TAM3

23

Appendix
24
Non-GAAP Financial MeasuresThis presentation includes information about non-GAAP diluted earnings per share, non-GAAP income from operations, non-GAAP free cash flow, and constant currency revenue and constant currency unearned revenue growth rates (collectively the “non-GAAP financial measures”). These non-GAAP financial measures are measurements of financial performance that are not prepared in accordance with U.S. generally accepted accounting principles and computational methods may differ from those used by other companies. Non-GAAP financial measures are not meant to be considered in isolation or as a substitute for comparable GAAP measures and should be read only in conjunction with the company’s consolidated financial statements prepared in accordance with GAAP. Management uses both GAAP and non-GAAP measures when planning, monitoring, and evaluating the company’s performance.
The primary purpose of using non-GAAP measures is to provide supplemental information that may prove useful to investors and to enable investors to evaluate the company’s results in the same way management does. Management believes that supplementing GAAP disclosure with non-GAAP disclosure provides investors with a more complete view of the company’s operational performance and allows for meaningful period-to-period comparisons and analysis of trends in the company’s business. Further, to the extent that other companies use similar methods in calculating non-GAAP measures, the provision of supplemental non-GAAP information can allow for a comparison of the company’s relative performance against other companies that also report non-GAAP operating results.
Non-GAAP diluted earnings per share excludes, to the extent applicable, the impact of the following items: stock-based compensation, amortization of acquisition-related intangibles, the net amortization of debt discount, as well as income tax adjustments. These items are excluded because the decisions that give rise to them are not made to increase revenue in a particular period, but instead for the company’s long-term benefit over multiple periods.
Non-GAAP income from operations excludes the impact of the following items: stock-based compensation, and amortization of acquisition-related intangibles.
The company defines the non-GAAP measure free cash flow as GAAP net cash provided by operating activities, less capital expenditures. For this purpose, capital expenditures does not include our strategic investments, nor does it include any costs or activities related to our purchase of 50 Fremont land and building, and building - leased facilities.
Constant currency information is provided as a framework for assessing how our underlying business performed excluding the effect of foreign currency rate fluctuations. To present constant currency revenue, current and comparative prior period results for entities reporting in currencies other than United States dollars are converted into United States dollars at the weighted average exchange rate for the quarter being compared to for growth rate calculations presented, rather than the actual exchange rates in effect during that period. To present unearned revenue on a constant currency basis, we convert the unearned revenue balances in local currencies in previous comparable periods using the United States dollar currency exchange rate as of the most recent balance sheet date.
25
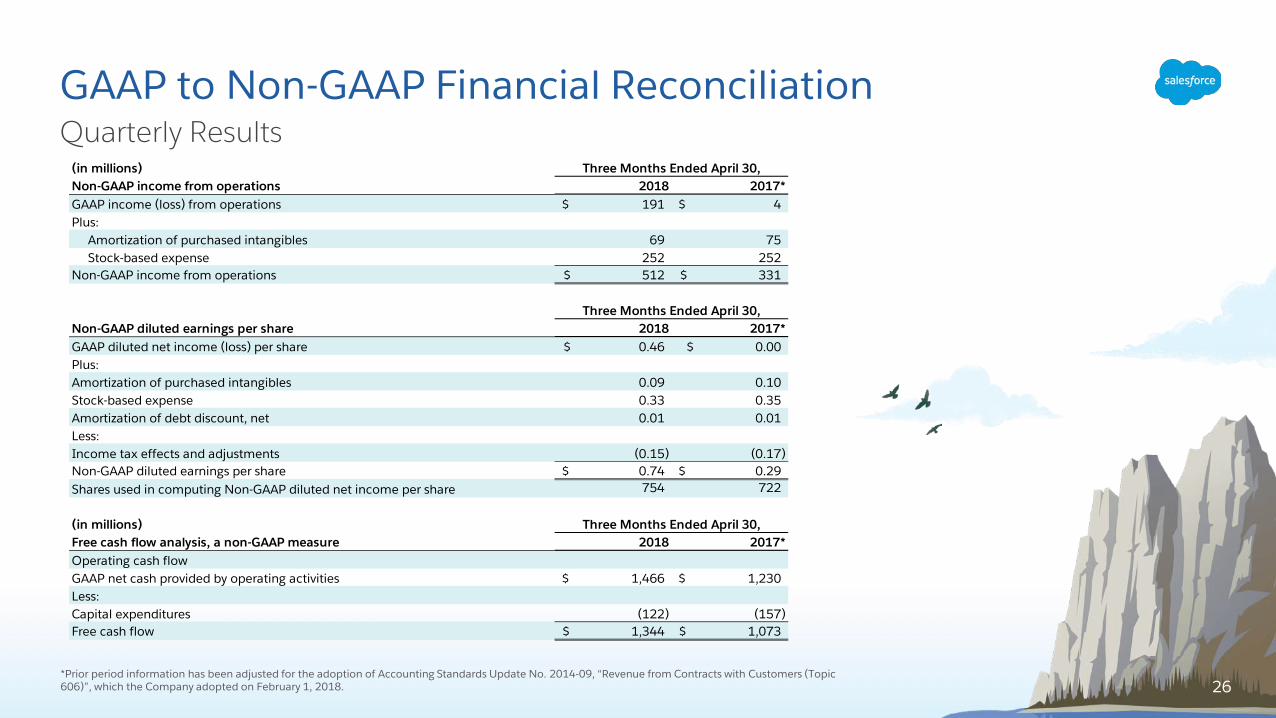
GAAP to Non-GAAP Financial ReconciliationQuarterly Results
26*Prior period information has been adjusted for the adoption of Accounting Standards Update No. 2014-09, “Revenue from Contracts with Customers (Topic 606)”, which the Company adopted on February 1, 2018.
(in millions)Non-GAAP income from operations 2018 2017*GAAP income (loss) from operations 191$ 4$ Plus: Amortization of purchased intangibles 69 75 Stock-based expense 252 252 Non-GAAP income from operations 512$ 331$
Non-GAAP diluted earnings per share 2018 2017*GAAP diluted net income (loss) per share 0.46$ $ 0.00Plus:Amortization of purchased intangibles 0.09 0.10 Stock-based expense 0.33 0.35 Amortization of debt discount, net 0.01 0.01 Less:Income tax effects and adjustments (0.15) (0.17) Non-GAAP diluted earnings per share 0.74$ 0.29$ Shares used in computing Non-GAAP diluted net income per share 754 722
(in millions)Free cash flow analysis, a non-GAAP measure 2018 2017*Operating cash flowGAAP net cash provided by operating activities 1,466$ 1,230$ Less:Capital expenditures (122) (157) Free cash flow 1,344$ 1,073$
Three Months Ended April 30,
Three Months Ended April 30,
Three Months Ended April 30,