Q1 Fy’17 RESULTS - HCL Technologies · working capital management together with efficient capital...
21
investor release rd Noida, India, August 3 , 2016 first QUARTER - FY 2017 RESULTS Table of contents Financial Highlights 2 Corporate Overview 3 Performance Highlights 4 Financials in US$ 11 Revenue Analysis at Company Level 14 Constant Currency Reporting 15 Client Metrics 16 Headcount & Utilization 17 Facilities 17 Cash and Cash Equivalents, Investments & Borrowings 17 Financials in ` 18 Revenue at 11,336 crores; up 6.0% QoQ & 15.9% YoY ` Net Income at 2,047 crores; up 6.3% QoQ & 14.8% YoY ` Revenue in constant currency up 6.0% QoQ & 11.2% YoY Revenue at US$ 1,691 mn; up 6.5% QoQ & 10.0% YoY Net Income at US$ 305 mn; up 7.1% QoQ & 9.5% YoY Q1 Fy’17 RESULTS “Despite any ups and downs that we may've had, the key thing is that HCL is always trying to do the best for us and they're completely flexible and open in the approach they work. And on top of that, they've got the dedication to do the job well”- Craig Partington, Business Enablement Director, Tech Data
-
Upload
vuongkhanh -
Category
Documents
-
view
216 -
download
0
Transcript of Q1 Fy’17 RESULTS - HCL Technologies · working capital management together with efficient capital...

investor releaserdNoida, India, August 3 , 2016
f i r s t Q U A R T E R - F Y 2 0 1 7 R E S U LT S
Table of contents
Financial Highlights 2
Corporate Overview 3
Performance Highlights 4
Financials in US$ 11
Revenue Analysis at Company Level 14
Constant Currency Reporting 15
Client Metrics 16
Headcount & Utilization 17
Facilities 17
Cash and Cash Equivalents, Investments & Borrowings 17
Financials in ` 18
Revenue at 11,336 crores; up 6.0% QoQ & 15.9% YoY `
Net Income at 2,047 crores; up 6.3% QoQ & 14.8% YoY`
Revenue in constant currency up 6.0% QoQ & 11.2% YoY
Revenue at US$ 1,691 mn; up 6.5% QoQ & 10.0% YoY
Net Income at US$ 305 mn; up 7.1% QoQ & 9.5% YoY
Q1 Fy’17 RESULTS
“Despite any ups and downs that we may've had, the key thing is that HCL is always trying to do the best for us and they're
completely flexible and open in the approach they work. And on top of that, they've got the dedication to do the job well”- Craig
Partington, Business Enablement Director, Tech Data
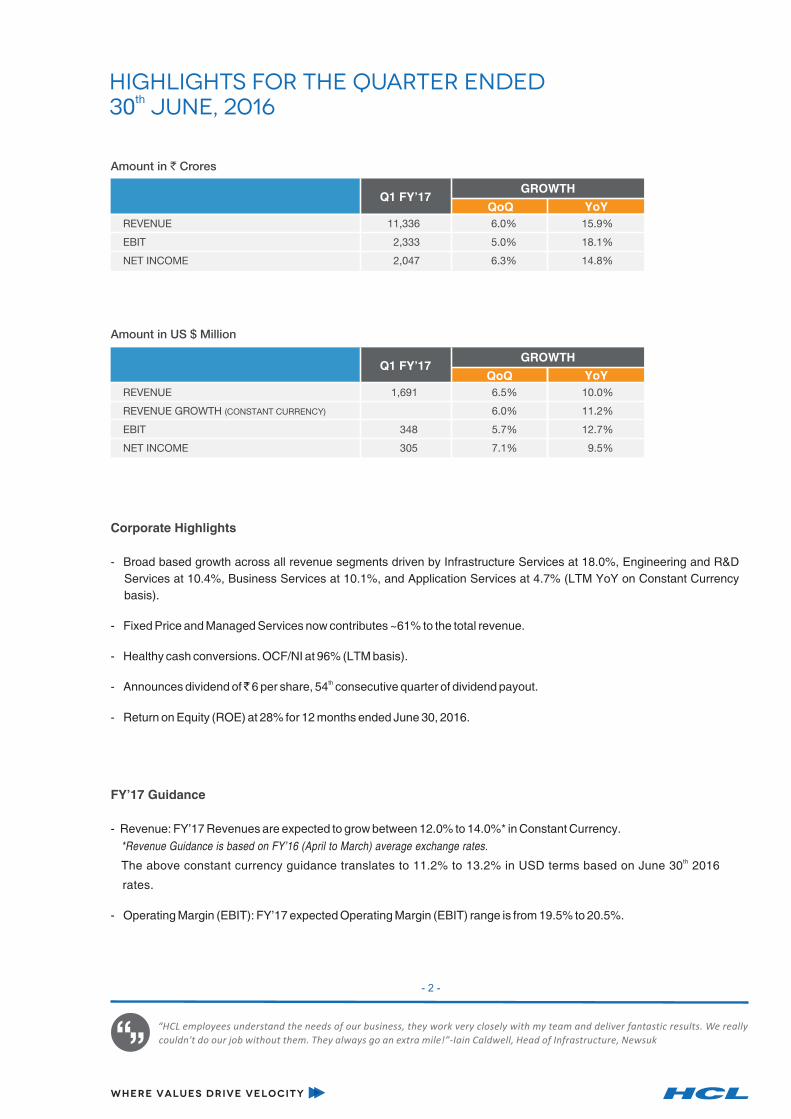
Highlights for the Quarter ended th30 june, 2016
Amount in ` Crores
Amount in US $ Million
Q1 FY’17QoQ YoY
GROWTH
REVENUE 11,336 6.0% 15.9%
EBIT 2,333 5.0% 18.1%
NET INCOME 2,047 6.3% 14.8%
Q1 FY’17QoQ YoY
GROWTH
REVENUE 1,691 6.5% 10.0%
REVENUE GROWTH (CONSTANT CURRENCY) 6.0% 11.2%
EBIT 348 5.7% 12.7%
NET INCOME 305 7.1% 9.5%
FY’17 Guidance
- Revenue: FY’17 Revenues are expected to grow between 12.0% to 14.0%* in Constant Currency.
*Revenue Guidance is based on FY’16 (April to March) average exchange rates.th The above constant currency guidance translates to 11.2% to 13.2% in USD terms based on June 30 2016
rates.
- Operating Margin (EBIT): FY’17 expected Operating Margin (EBIT) range is from 19.5% to 20.5%.
Corporate Highlights
- Broad based growth across all revenue segments driven by Infrastructure Services at 18.0%, Engineering and R&D
Services at 10.4%, Business Services at 10.1%, and Application Services at 4.7% (LTM YoY on Constant Currency
basis).
- Fixed Price and Managed Services now contributes ~61% to the total revenue.
- Healthy cash conversions. OCF/NI at 96% (LTM basis).
th- Announces dividend of ̀ 6 per share, 54 consecutive quarter of dividend payout.
- Return on Equity (ROE) at 28% for 12 months ended June 30, 2016.
- 2 -
“HCL employees understand the needs of our business, they work very closely with my team and deliver fantastic results. We really
couldn't do our job without them. They always go an extra mile!”-Iain Caldwell, Head of Infrastructure, Newsuk

“As changing global socio–economic landscape transforms the dynamics of the industry, enterprises
are redesigning their strategies and business models. I am glad that HCL Technologies is amongst the
very few pure–play service providers to have built a robust long–term sustainable business model,
strongly positioned for future growth. Further, HCL continues to create sustained positive impact on the
ecosystem in which it operates. HCL Grant, the first of its kind initiative launched last year to recognize
the rise of the Fifth estate – the NGOs – is playing a larger role in transforming the healthcare,
environment and education sectors of the Country”, said Shiv Nadar, Chairman & Chief Strategy
Officer, HCL Technologies Ltd.
“We commence FY'17 on a positive note, continuing our robust financial performance, with a strong 6%
growth QoQ and 10.7% LTM YoY in constant currency terms. Our growth momentum is broad–based, stencompassing all sectors and service lines, propelled by our robust 21 Century Enterprise strategy and
robust business model”, said Anant Gupta, President & CEO, HCL Technologies Ltd.
“We are encouraged with the overall Q1 FY’17 performance. We have been able to maintain our margins
led by increased adoption of automation and higher offshoring. Our layered hedging policy allowed us to
manage significant currency volatility this quarter and post exchange gains. A consistent performance of
working capital management together with efficient capital allocation has resulted in return on Equity at
28%”, said Anil Chanana, CFO, HCL Technologies Ltd.
- 3 -
TM“Our differentiated offerings in the core services, strong execution and the effectiveness of DryICE
Autonomics platform has helped us deliver an EBIT growth of 12.7% quarterly YoY in USD terms. Our TMNext-Gen offerings of BEYONDigital, IoTWoRKS, Cloud and Security Services powered by DryICE
Orchestration and Design Thinking is helping our growth in existing client base and acquire new logos as
well”, said C Vijay Kumar, COO, HCL Technologies Ltd.

Cash Conversion
in U
SD
Mn
1,037
1,087
1,164
974
1,144
1,095
Avg. OCF/NI at ~94%
Net Income Operating Cash Flow
Net Income
1,037
1,164
1,145
in
Mn
US
D
1,292
1,324
1,290
in
Mn
US
D
3 Year CAGR: 12%
EBIT
performance highlights
Overall Company : Performance Trends (LTM basis)
5,360
5,952
6,389
in
Mn
US
D
Num
ber
Of C
lients
7
Revenues
Managed Services & Fixed Price Projects Client Category
100 Million Dollar + 50 Million Dollar + 40 Million Dollar + 10 Million Dollar + 5 Million Dollar +
55.6
56.1
57.8
in %
187211
237
114124
146
322318
15 17 20
76
3 Year CAGR: 11%
3 Year CAGR: 16%
JUN’14 JUN’15 JUN’16 JUN’14 JUN’15 JUN’16
JUN’14 JUN’15 JUN’16 JUN’14 JUN’15 JUN’16
JUN’14 JUN’15 JUN’16 JUN’14 JUN’15 JUN’16
- 4 -

• Revenue grew by 10.7%.
• Broad based growth across all revenue segments:
• Americas and Europe grew by 13.7% and 10.6% respectively.
• Driven by Infrastructure Services at 18.0%, Engineering and R&D Services at 10.4%, Business Services at 10.1%, and Application Services at 4.7%.
• Vertical growth led by Public Services at 24.7%, Lifesciences & Healthcare at 21.5%, Telecommunications, Media, Publishing & Entertainment at 17.8%, Retail & CPG at 14.9%, Manufacturing at 7.7%, and Financial Services at 5.7%.
LTM YEAR ON YEAR REVENUE GROWTH IN CONSTANT CURRENCY
REVENUE GROWTH (IN CONSTANT CURRENCY)
PARTICULARS SEGMENTS
QoQ
30-Jun-16
key catalysts for growth
- 5 -
LTM YoY
Consolidated For the Company 6.0% 11.2% 10.7%
Geography Americas 2.0% 12.7% 13.7%
Europe 16.9% 15.9% 10.6%
ROW 0.0% -10.2% -5.0%
Services Application Services 1.9% 4.3% 4.7%
Infrastructure Services 16.5% 25.8% 18.0%
Business Services -15.9% -11.5% 10.1%
Engineering and R&D Services 0.7% 4.8% 10.4%
Verticals Financial Services -0.1% 2.0% 5.7%
Manufacturing 12.0% 12.2% 7.7%
Lifesciences & Healthcare -1.0% 9.9% 21.5%
Public Services 11.8% 35.2% 24.7%
Retail & CPG 14.5% 26.0% 14.9%
Telecommunications, Media, Publishing & Entertainment -2.8% 5.8% 17.8%
YoY
Note: Public Services include Oil & Gas, Energy & Utilities, Travel - Transport - Logistics and Government.
- 6 -
HCL signed 13 transformational deals this quarter, across service lines and industry verticals. The broad–based business wins were driven by next–generation integrated offerings – Next–Gen ITO, BEYONDigital and IoT WoRKS, reflecting investments in Internet of Things, digital technologies, cloud, automation and artificial intelligence.
transformational and blue chip customer acquisition
HCL continues to be recognized for creating sustained positive impact on the ecosystem, for its work culture that empowers and enables employees to deliver unmatched business value to its stakeholders, taking relationships beyond the contract.
• HCL Grant, launched last year, has added two more categories of health and environment besides education this year. It is the first of its kind initiative to recognize the rise of Fifth estate – the NGOs. More than 400 NGOs participated in the HCL Grant last year. A sum of INR 100 crores has been committed over next 5 years through this initiative.
• HCL Foundation continued to enhance its focus on digital literacy and women empowerment programs with focus on self help groups and teachers. It inaugurated 10 digital literacy centers in NCR and Lucknow, Uttar Pradesh and launched digital literacy program centers in 10 government schools in Tumkur, Karnataka.
• HCL’s brand value continues to gain strength. The Economic Times recognized HCL among top 10 brands, in its latest edition of Brand Finance 'India's Top 100 Brands', 2016.
th• HCL ranked at 8 position in LinkedIn's 'Top Attractors List' for India. The list is a ranking done by analyzing preferences of over 400 million user–base of LinkedIn, showing where employees want to work. HCL has been recognized for its work culture and employee–led initiatives such as “Inspire” and “Ideapreneurship”.
• In continued recognition of its marketing and communications excellence, HCL won the 2016 APEX Awards for Electronic Media (Recruiter's Handbook), Social Media – Special Purpose & Website Content.
• HCL won the ‘2016 BMA B2 Awards’ under various categories for its integrated campaign “UnitedByHCL”. The B2 Awards recognize the work that business marketers and agencies do "2" engage with customers, employees, channel partners and government. CTO Straight Talk, HCL's thought leadership community platform, won the 2016 BMA B2 Awards under the category of ‘Custom Publishing – Magazine, Print or Electronic’.
corporate excellence
market leadershipBEYONDigital
HCL's BEYONDigital business unit continues to gain momentum winning new engagements as well as enhancing business with existing clients. The business leverages best-in-class IPs across design, technology and operations, such as Xperience Labs, 123 Design, User Value Chain, Transaction Transformation Methodology, and User Persona Libraries.
st• ISG, in a report recognizing HCL's progress in BEYONDigital, said “By conceptualizing the 21 Century Enterprise, HCL has created a generalized persona of the digital enterprise client and developed capabilities to address the pain points of the digital enterprise”. The report is titled “HCL BEYONDigital Emphasizes End-to-End Skills and Services” June 2016.
• IDC MarketScape has recognized HCL as a Leader for Worldwide Big Data Consulting and Systems Integration Services. According to the report, buyers rate HCL highly for helping achieve desired business outcomes, handling changes in project scope, and offering flexible pricing models to meet their needs for Big Data C&SI services.

• HCL has been felicitated with 2016 Partner Excellence Awards by TIBCO Software for Digital Transformation Solutions and Services Excellence. Through a combination of Systems Integration and Digital Transformation Services, HCL enables customers to design and execute digital strategies, and
sthelps transform their IT landscape to become 21 Century Enterprises.
This quarter HCL inked several significant engagements in Digitalization:
• HCL won an engagement with a Fortune 100 media and entertainment corporation for transforming its program scheduling platform for superior customer experience. The project will take the applications to the next level through a human–centric product development approach, resulting in enhanced experience while increasing efficiency, productivity and financial performance.
• A Fortune 50 healthcare & life-science services provider selected HCL as the 'Partner of Choice' for end–to–end digital transformation. With customer experience at the core of the solution, the engagement proposes digital transformation around content management and platform integration for driving business growth.
• HCL has been named as a strategic partner to a Fortune 100 global technology corporation for modern application development, extending the digital application foot print and support across data integration, big data analytics, and financial performance management applications.
• HCL partnered with a Fortune 100 leader in software, services and solutions, to provide technical program management, BI and platform engineering services in an agile model for critical business success. The solution employs a data lake platform with SQL and Big Data stores for predictive analytics.
• HCL has won a deal with a leading US based telecommunication company to build supply chain control tower for enhanced supply chain visibility, through modernization and migration of data from the transactional database into AWS cloud. Leveraging its IDEA framework, HCL will also provide business intelligence and analytics consulting services around applications consolidation, migration and target architecture to develop a strategic roadmap for delivering business outcomes
• HCL has renewed a three year multi-million dollar engagement with a Nordics based Global 2000 retailer for modernized application development, providing engineering services along with application support & testing services for in-house applications.
TM• Ovum wrote an exclusive case study report on HCL's engagement with AEGON for cXstudio titled “Delivering a Market-Leading Customer Experience for the Insurance Sector: How Aegon and HCL are developing an agile and customer-focused organization”. According to the report, “As a result of the
TMcXstudio , Aegon continues to grow a core set of skills and experience around the design and delivery of a high-quality and responsive digital customer experience – a set of capabilities that is increasingly critical to compete in today's insurance market.”
IoT WoRKS
HCL solidifies its leadership in Internet of Things with best–in–class IoT frameworks, solutions and offerings as well as strengthening its IoT ecosystem play with the right partnerships.
• One of the largest medical devices companies with global reach to more than 160 countries has selected HCL for end–to–end IoT program to build a secure, scalable, distributed, multi–cloud, micro services based platform to connect to their implantable devices and offer monitoring, diagnostic and predictive maintenance services. These services in the future would extend to offer a complete patient care platform for its users.
• HCL has developed an end–to–end data platform for a Swedish multinational manufacturing company to provide connectivity to all their devices in the field. The platform is expected to scale to over a million simultaneously connected devices.
• HCL has developed a complete connected care platform for revenue impact for a Fortune 200 technology major's office automation and equipment products. The platform, along with providing support for field operations, provides a revenue stream by selling consumables directly to end customers.
market leadership
- 7 -
Engineering and R&D Services (ERS)
HCL continues to be recognized for its global leadership in Engineering and R&D services and signed several end–to–end engagements this quarter, aimed at transforming the products and business landscape of global enterprises.
TM• Forrester named HCL amongst Strong Performers in its report titled “The Forrester Wave : Digital Platform Engineering Services, Q2 2016”, authored by Nate Fleming and John C. McCarthy.
• A Global 2000 Europe based home appliance manufacturer, chose HCL for managing its end–to–end engineering and product design activities across US, EU & Indian markets for driving business growth.
• A Fortune Global 200 consumer electronics major, headquartered in Japan, selected HCL for software field testing of its consumer electronics products for the European market.
• HCL has won an engagement with a leading Japanese manufacturer of industrial products for developing in–flight interiors for Airbus Aircrafts, creating a new design and enabling them to engineer products in a short time.
• HCL has been engaged by a Fortune Global 500 Europe based telecom equipment major to implement product customizations and customer scenario testing for their 4G/LTE Products targeted at the Asian telecom services market.
Next–Gen IT Outsourcing
HCL continues to gain momentum through best–in–class integrated Next–Gen ITO proposition, powered TMby DryICE , its third generation autonomics and orchestration platform. DryICE™ automation platform
stenables the 21 Century Enterprise to be “agile as a startup” while delivering like a “lean enterprise”. It forms an integral component of HCL's transformational engagements, and has been implemented across all of HCL's top customers. Currently, over 200 clients leverage the benefits of one or more
TMmodules of DryICE and many more are adopting some form of artificial intelligence such as natural TMlanguage processing (NLP), machine learning or robotics. HCL further launched DryICE LUCY this
quarter, the cognitive service desk agent that features NLP, content based reasoning, machine learning and issue resolution.
• HCL has been felicitated with the “Best Innovation in Natural Language Processing (NLP)” award by AIconics at the AI Summit, London. The AIconics are the world's only independently judged awards celebrating the drive, innovation and hard work in the international Artificial Intelligence Community, organized by AI Business.
• HCL has been honored with MetricStream 'GRC Innovation Partner of the Year 2016' award. The award recognizes partners who have provided exceptional GRC consulting, services and guidance to customers.
• HCL has been positioned as a Leader in IDC MarketScape for Worldwide Cloud Professional Services 2016 Vendor Assessment (April 2016).
• HCL has been positioned as a Leader in Gartner Magic Quadrant for Data Center Outsourcing and Infrastructure Utility Services, Europe, 27 June 2016 by DD Mishra, Claudio Da Rold, Gianluca Tramacere, Philip Dawson, Gregor Petri, David Groombridge. Further, HCL has been positioned as a leader in 2016 Gartner Magic Quadrant for Data Center Outsourcing and infrastructure Utility services, North America, 7 July 2016, David Edward Ackerman et al*.
market leadership
- 8 -
*Gartner does not endorse any vendor, product or service depicted in its research publications, and does not advise technology users to select only those vendors
with the highest ratings or other designation. Gartner research publications consist of the opinions of Gartner's research organization and should not be construed
as statements of fact. Gartner disclaims all warranties, expressed or implied, with respect to this research, including any warranties of merchantability or fitness for
a particular purpose.

st• 451 Research, in a report titled 'HCL Technologies presents '21 Century Datacenter Blueprint' for cloud transformation', recognizes HCL's unique positioning and says “HCL has a wealth of experience in infrastructure management for large enterprises and global MNCs and is building new capabilities,
TMwhile engaging a growing cloud partner ecosystem. HCL's DryICE automation and orchestration platform has laid the foundation of its hybrid cloud strategy”.
HCL continues its dominant leadership in Next–Gen ITO this quarter, with several marquee engagements:
• HCL has been selected by a leading US–based healthcare solutions provider to deliver business outcomes, drive efficiencies and create value for customers. HCL will be the sole outsourcing partner to serve as an end–to–end provider in managing and further enhancing their healthcare product platform and also providing applications services and business process services.
• HCL has been selected by a leading Fortune 200 airline carrier for a multi-million-dollar transformation deal to restructure and reinvent its core 'quality management' operations, with the goal of driving customer satisfaction and business growth. HCL will provide these services in an agile, continuous delivery, and managed services construct.
• HCL has won a large SAP implementation project, enabled by iMRO, with a leading Global 2000 oilfield services and technology provider. HCL was selected basis its SAP certified iMRO solution, oil & gas experience and SAP transformation leadership.
• Trusted Media Brands, formerly Reader's Digest Association, has recently renewed its multi–year partnership with HCL for integrated services to enhance customer experience and business outcomes. Since 2009, HCL has been providing infrastructure and applications services, development and maintenance support worldwide. The engagement has been renewed for another five years, recognizing HCL as a trusted partner, providing cost effectiveness, delivery quality and flexibility.
• A leading US based Energy and Utilities corporation renewed its engagement with HCL, covering all TMservice lines of HCL's end–to–end infrastructure portfolio. HCL was chosen basis its unique DryICE
platform operational excellence, outcomes delivered and the trust & transparency demonstrated in delivery.
• A Fortune 500 specialty retailer chose HCL for an integrated multi-year Next–Gen ITO deal involving service desk, retail infrastructure and retail & merchandising development & support for 1500 stores across North America.
• HCL has won a multi–year managed services deal with a Fortune 200 pharmaceutical company, including Documentum Solutions Services Tower for ECM. HCL will manage the entire suite of applications development and support for the global and R&D applications, including enhancements, product upgrades, integration and overall implementation services for newer modules and versions.
• A Fortune 50 investment banking and financial services corporation chose HCL across its ITO platform, in a vendor consolidation exercise. HCL has been engaged to deliver increased efficiency and improved quality of ITO services.
• HCL has won a five year integrated Next–Gen ITO deal with the North American operations of a Global TM2000 Japanese pharmaceutical company. Utilizing its DryICE platform, HCL will provide integrated
services, including applications services, development for R&D applications, testing, service desk and infrastructure support, including datacenter, network & security services.
• HCL has signed a multi-year contract with a leading Canada based financial technologies corporation providing solutions for core banking, lending and payments, for end–to–end applications management spanning across application development, support, testing & implementation services.
• HCL has successfully renewed an end–to–end infrastructure services engagement in the areas of data centre, network and security, managed applications and end–user services for a leading Global 2000 paper and pulp organization based out of Nordics region.
market leadership
- 9 -

• A leading US utility firm based out of the Mid–Atlantic area has selected HCL for a multi–year end–to–end applications transformation engagement for SAP–based customer relationship & billing systems and GIS.
• HCL has expanded a strategic engagement with a Fortune 100 US based diversified financial services organization for its Finance & Accounting transformation with data integration, data quality, business intelligence, analytics and reporting services.
• HCL has been chosen by one of the largest operator of country clubs in the USA for a multi-year, multi-million dollar deal to transform and manage its IT operations, utilizing both onsite as well as offshore delivery.
• HCL entered into an engagement with a Fortune 500 US based financial services holding company for regulatory compliance implementation and migrating all contractual documents to the Documentum platform for audit and compliance.
• HCL has signed a multi–million infrastructure services contract with a leading Global 2000 consumer TMproducts manufacturer based out of Switzerland. Leveraging its DryICE platform, HCL will become
the sole vendor providing end–to–end datacenter services, transforming automation landscape and enabling next generation cloud roadmap.
• A Global 2000 FMCG organization in India chose HCL to transform and manage its IT operations, enabling it to achieve higher business competitiveness and optimized costs.
• A leading Ireland headquartered bank reinforced its confidence in HCL as its strategic and trusted partner, by renewing its application services and maintenance contract for its treasury and global markets business.
• HCL has been selected by a leading private sector bank of India to provide network transformation services, managed security services and network equipment maintenance services, enabling the bank achieve a higher uptime and increased productivity across branches and ATM networks.
Partnerships
• HCL Technologies and a global technology major have entered into a long term strategic IP partnership to invest in and grow key workload Automation and DevOps software to accelerate product roadmap innovation and extend it to hybrid cloud.
• HCL partnered with global automotive solutions providers – Finland based Rightware and US based Movimento, to expand its smart vehicle solutions ecosystem. The alliances are the latest additions to HCL's IoT WoRKS partner system, enhancing the company's existing smart mobility and vehicle engineering services.
• HCL's IoT partnership with Microsoft continues to create value for customers. HCL has completed the development of Remote Patient Monitoring solution, leveraging Microsoft Azure platform and is further working on industrial automation solutions, leveraging advanced analytics and machine learning capabilities of the Azure platform.
market leadership
- 10 -
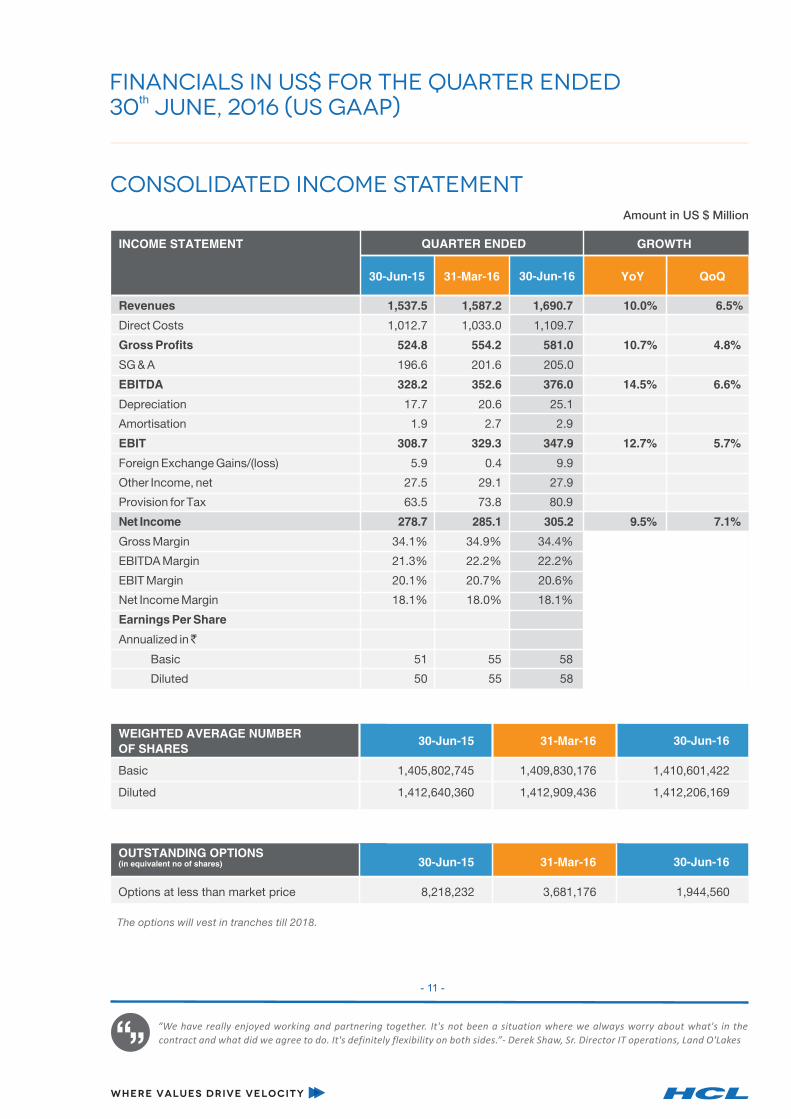
Financials in US$ for the Quarter ended th30 june, 2016 (US GAAP)
consolidated income statementQUARTER ENDED
Amount in US $ Million
The options will vest in tranches till 2018.
WEIGHTED AVERAGE NUMBEROF SHARES
30-Jun-15 31-Mar-16 30-Jun-16
OUTSTANDING OPTIONS(in equivalent no of shares)
Basic 1,405,802,745 1,409,830,176 1,410,601,422
Diluted 1,412,640,360 1,412,909,436 1,412,206,169
30-Jun-15 31-Mar-16 30-Jun-16
Options at less than market price 8,218,232 3,681,176 1,944,560
GROWTH
30-Jun-15 31-Mar-16 YoY QoQ
QUARTER ENDED INCOME STATEMENT
30-Jun-16
Revenues 1,537.5 1,587.2 1,690.7 10.0% 6.5%
Direct Costs 1,012.7 1,033.0 1,109.7
Gross Profits 524.8 554.2 581.0 10.7% 4.8%
SG & A 196.6 201.6 205.0
EBITDA 328.2 352.6 376.0 14.5% 6.6%
Depreciation 17.7 20.6 25.1
Amortisation 1.9 2.7 2.9
EBIT 308.7 329.3 347.9 12.7% 5.7%
Foreign Exchange Gains/(loss) 5.9 0.4 9.9
Other Income, net 27.5 29.1 27.9
Provision for Tax 63.5 73.8 80.9
Net Income 278.7 285.1 305.2 9.5% 7.1%
Gross Margin 34.1% 34.9% 34.4%
EBITDA Margin 21.3% 22.2% 22.2%
EBIT Margin 20.1% 20.7% 20.6%
Net Income Margin 18.1% 18.0% 18.1%
Earnings Per Share
Annualized in ̀
Basic 51 55 58
Diluted 50 55 58
- 11 -
“We have really enjoyed working and partnering together. It's not been a situation where we always worry about what's in the
contract and what did we agree to do. It's definitely flexibility on both sides.”- Derek Shaw, Sr. Director IT operations, Land O'Lakes
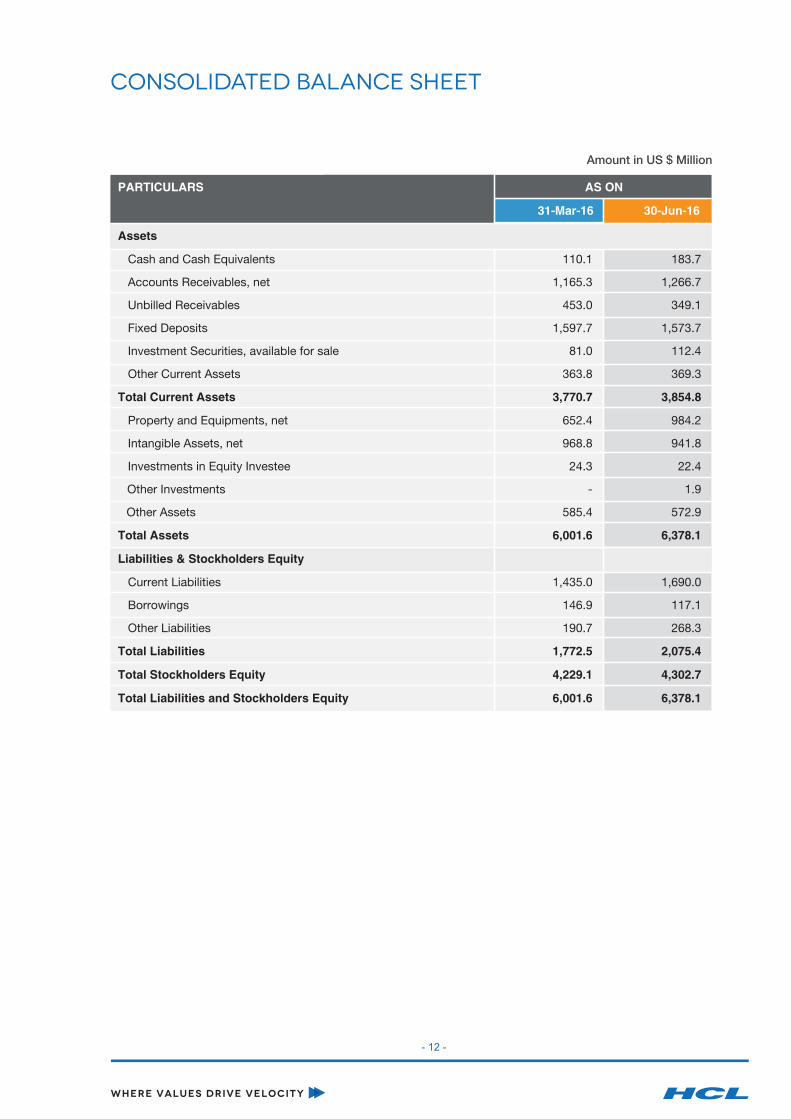
PARTICULARS AS ON
31-Mar-16 30-Jun-16
consolidated balance sheet
Amount in US $ Million
- 12 -
Assets
Cash and Cash Equivalents 110.1 183.7
Accounts Receivables, net 1,165.3 1,266.7
Unbilled Receivables 453.0 349.1
Fixed Deposits 1,597.7 1,573.7
Investment Securities, available for sale 81.0 112.4
Other Current Assets 363.8 369.3
Total Current Assets 3,770.7 3,854.8
Property and Equipments, net 652.4 984.2
Intangible Assets, net 968.8 941.8
Investments in Equity Investee 24.3 22.4
Other Investments - 1.9
Other Assets 585.4 572.9
Total Assets 6,001.6 6,378.1
Liabilities & Stockholders Equity
Current Liabilities 1,435.0 1,690.0
Borrowings 146.9 117.1
Other Liabilities 190.7 268.3
Total Liabilities 1,772.5 2,075.4
Total Stockholders Equity 4,229.1 4,302.7
Total Liabilities and Stockholders Equity 6,001.6 6,378.1

Amount in US $ Million
PARTICULARS FOR LTM FOR QUARTER ENDED Mar'16 ENDED Jun'16
consolidated cash flow statement
CASH FLOWS FROM OPERATING ACTIVITIES
Net Income 1,118.2 304.8
Adjustments to Reconcile Net Income to Net Cash provided by Operating Activities
Depreciation and Amortization 86.7 28.0
Others (84.7) (6.8)
Changes in Assets and Liabilities, net
Accounts Receivable (121.3) (22.1)
Other Assets (24.2) 2.3
Current Liabilities 108.4 156.5
Net Cash provided by Operating Activities 1,083.0 462.7
CASH FLOWS FROM INVESTING ACTIVITIES
Purchase of Property and Equipment (178.1) (181.8)
Proceeds from sale of property and equipment (including advance) 29.4 14.8
(Purchase) / Sale of Investments (48.6) (31.2)
Purchase of other Investments - (2.0)
Fixed Deposits (increase) / decrease (276.1) (1.5)
Proceeds from sale of equity investments 1.6 -
Investment in equity afiliates (3.0) -
Payments for business acquisitions, net of cash acquired (177.8) (0.4)
Net Cash used in Investing Activities (652.6) (202.0)
CASH FLOWS FROM FINANCING ACTIVITIES
Proceeds from Issuance of Employees Stock Options 0.1 0.0
Repayment of Debentures 0.5 -
Dividend (513.8) (151.8)
Loans 75.5 (25.4)
Others 5.8 (0.6)
Net Cash used in Financing Activities (431.8) (177.8)
Effect of Exchange Rate on Cash and Cash Equivalents (22.6) (9.3)
Net increase/(decrease) in Cash and Cash Equivalents (24.0) 73.6
CASH AND CASH EQUIVALENTS
Beginning of the Period 134.1 110.1
End of the Period 110.1 183.7
- 13 -

GEO GRAPHIC MIX 30-Jun-15 31-Mar-16 30-Jun-16 LTM Mix
Americas 58.6% 62.5% 59.9% 60.5%
Europe 30.4% 28.4% 31.4% 30.4%
ROW 11.0% 9.1% 8.7% 9.1%
SERVICE MIX 30-Jun-15 31-Mar-16 30-Jun-16 LTM Mix
Application Services 40.9% 39.9% 38.3% 39.7%
Infrastructure Services 35.3% 36.2% 39.8% 36.7%
Business Services 5.2% 5.2% 4.1% 5.0%
Engineering and R&D Services 18.7% 18.7% 17.7% 18.5%
REVENUE BY VERTICAL 30-Jun-15 31-Mar-16 30-Jun-16 LTM Mix
Financial Services 26.0% 25.0% 23.6% 25.1%
Manufacturing 32.7% 31.4% 33.2% 32.2%
Lifesciences & Healthcare 12.0% 12.8% 11.9% 12.3%
Public Services 9.7% 11.1% 11.7% 10.9%
Retail & CPG 8.8% 9.2% 10.0% 9.4%
Telecommunications, Media, Publishing & Entertainment 9.5% 9.9% 9.1% 9.6%
Others 1.3% 0.5% 0.5% 0.5%
revenue analysis at company level (quarter ended)
REVENUE BY CONTRACT TYPE 30-Jun-15 31-Mar-16 30-Jun-16
Managed Services & Fixed Price Projects 56.1% 56.8% 60.9%
Time & Material 43.9% 43.2% 39.1%
Note: Public Services include Oil & Gas, Energy & Utilities, Travel - Transport - Logistics and Government.
- 14 -
“Why has our relationship with HCL been successful? For one, I fundamentally believe that HCL would move Heaven and Earth just
to please CEVA. Their 'Employees First' philosophy shows in their drive and motivation to get things done.”- Peter Dew, President,
APAC and Former CIO, Ceva Logistics
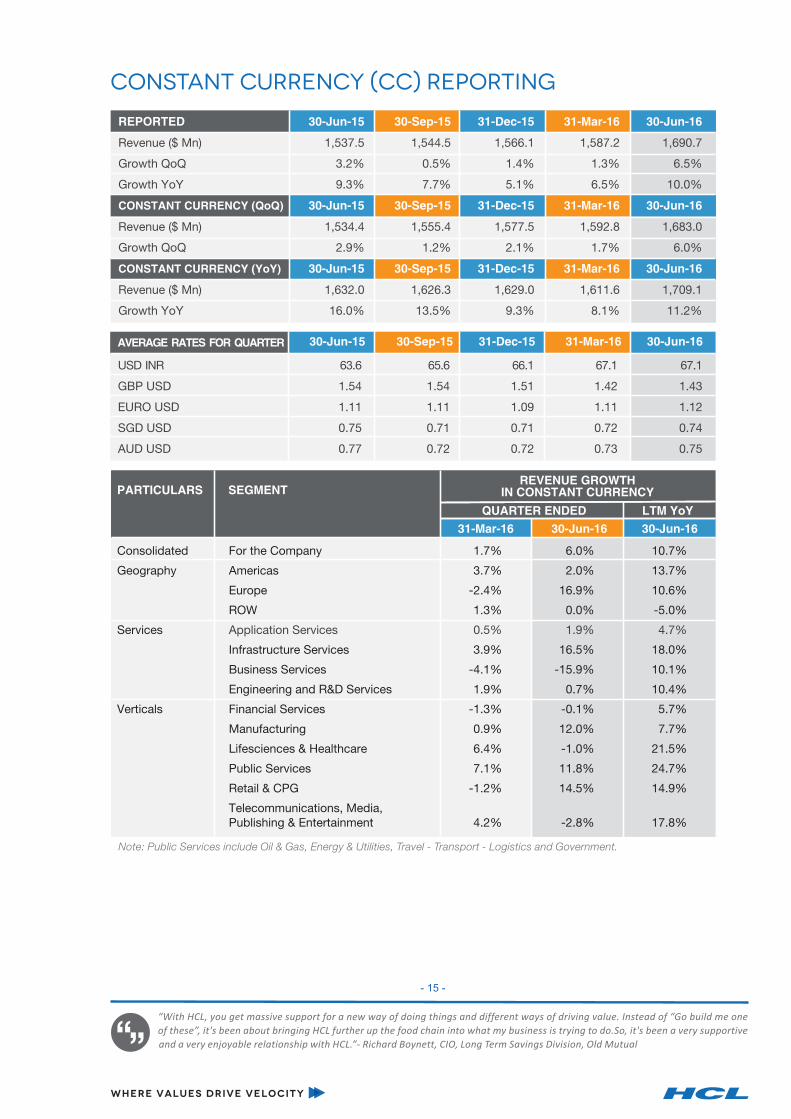
REPORTED 30-Jun-15 30-Sep-15 31-Dec-15 31-Mar-16 30-Jun-16
Revenue ($ Mn) 1,537.5 1,544.5 1,566.1 1,587.2 1,690.7
Growth QoQ 3.2% 0.5% 1.4% 1.3% 6.5%
Growth YoY 9.3% 7.7% 5.1% 6.5% 10.0%
CONSTANT CURRENCY (QoQ) 30-Jun-15 30-Sep-15 31-Dec-15 31-Mar-16 30-Jun-16
Revenue ($ Mn) 1,534.4 1,555.4 1,577.5 1,592.8 1,683.0
Growth QoQ 2.9% 1.2% 2.1% 1.7% 6.0%
CONSTANT CURRENCY (YoY) 30-Jun-15 30-Sep-15 31-Dec-15 31-Mar-16 30-Jun-16
Revenue ($ Mn) 1,632.0 1,626.3 1,629.0 1,611.6 1,709.1
Growth YoY 16.0% 13.5% 9.3% 8.1% 11.2%
constant currency (CC) reporting
USD INR 63.6 65.6 66.1 67.1 67.1
GBP USD 1.54 1.54 1.51 1.42 1.43
EURO USD 1.11 1.11 1.09 1.11 1.12
SGD USD 0.75 0.71 0.71 0.72 0.74
AUD USD 0.77 0.72 0.72 0.73 0.75
PARTICULARS SEGMENT
QUARTER ENDED
REVENUE GROWTH IN CONSTANT CURRENCY
LTM YoY
31-Mar-16 30-Jun-16 30-Jun-16
Consolidated For the Company 1.7% 6.0% 10.7%
Geography Americas 3.7% 2.0% 13.7%
Europe -2.4% 16.9% 10.6%
ROW 1.3% 0.0% -5.0%
Services Application Services 0.5% 1.9% 4.7%
Infrastructure Services 3.9% 16.5% 18.0%
Business Services -4.1% -15.9% 10.1%
Engineering and R&D Services 1.9% 0.7% 10.4%
Verticals Financial Services -1.3% -0.1% 5.7%
Manufacturing 0.9% 12.0% 7.7%
Lifesciences & Healthcare 6.4% -1.0% 21.5%
Public Services 7.1% 11.8% 24.7%
Retail & CPG -1.2% 14.5% 14.9%
Telecommunications, Media, Publishing & Entertainment 4.2% -2.8% 17.8%
Note: Public Services include Oil & Gas, Energy & Utilities, Travel - Transport - Logistics and Government.
AVERAGE RATES FOR QUARTER 30-Jun-15 30-Sep-15 31-Dec-15 31-Mar-16 30-Jun-16
- 15 -
“With HCL, you get massive support for a new way of doing things and different ways of driving value. Instead of “Go build me one
of these”, it's been about bringing HCL further up the food chain into what my business is trying to do.So, it's been a very supportive
and a very enjoyable relationship with HCL.”- Richard Boynett, CIO, Long Term Savings Division, Old Mutual

NUMBER OF MILLION DOLLAR 30-Jun-15 31-Mar-16 30-Jun-16 QoQ YoYCLIENTS (LTM) CHANGE CHANGE
100 Million dollar + 7 8 7 (1) -
50 Million dollar + 17 19 20 1 3
40 Million dollar + 23 29 32 3 9
30 Million dollar + 40 43 48 5 8
20 Million dollar + 73 75 80 5 7
10 Million dollar + 124 144 146 2 22
5 Million dollar + 211 233 237 4 26
1 Million dollar + 476 482 482 - 6
CLIENT BUSINESS 30-Jun-15 31-Mar-16 30-Jun-16
New Clients 7.1% 3.5% 4.0%
Existing Clients 92.9% 96.5% 96.0%
Days Sales Outstanding - excluding unbilled receivables 60 66 67
client metrics
CLIENT CONTRIBUTION TO REVENUE (LTM) 30-Jun-15 31-Mar-16 30-Jun-16
Top 5 Clients 13.2% 13.6% 13.9%
Top 10 Clients 21.7% 21.8% 21.8%
Top 20 Clients 32.4% 32.2% 31.7%
- 16 -
“Getting a new partner on board is like getting a business-spouse.Of Course there'll be challenges, but right from the transition
period, the Team at HCL worked with us efficiently, with great collaboration. We knew that we'd made the right decision. We work
like one team.”- Kristy Folkwein, VP & CIO, Dow Corning

Note: Attrition excludes involuntary attrition
*Note: For details please refer: http://www.hcltech.com/Q1FY17DetailsCashBorrowings
Amount in US $ Million
Jun-16
Cash & Cash Equivalents 184
Fixed Deposits 1,574
Investment Securities, Available for Sale 112
Total Funds 1,870
Jun-16
Short term borrowing 117
THAS ON 30 JUN 2016 COMPLETED WORK IN PROGRESS
BUILT UP AREA(SQ. FT.) NO. OF SEATS NO. OF SEATSDELIVERY LOCATIONS
BUILT UP AREA(SQ. FT.)
headcount & utilization
facilities
cash & cash equivalents, investments and borrowings
India 9,521,508 88,310 2,618,972 11,636
Global 1,084,804 14,018 6,368 255
Total 10,606,311 102,328 2,625,340 11,891
MANPOWER DETAILS 30-Jun-15 31-Mar-16 30-Jun-16
Total Employee Count 106,107 104,896 107,968
Technical 97,135 95,649 98,225
Support 8,972 9,247 9,743
Gross Addition 9,448 9,280 10,515
Attrition - IT Services (LTM) 16.5% 17.3% 17.8%
Attrition - Business Services (Quarterly) 7.7% 6.9% 6.1%
Blended Utilization (Including Trainees) 83.5% 85.6% 85.8%
- 17 -

Financials in for the Quarter ended `̀Financials in for the Quarter ended `th30 june, 2016 (US GAAP)
consolidated income statementAmount in Crores
- 18 -
GROWTH
30-Jun-15 31-Mar-16 YoY QoQ
QUARTER ENDED INCOME STATEMENT
30-Jun-16
Revenues 9,777 10,698 11,336 15.9% 6.0%
Direct Costs 6,429 6,961 7,440
Gross Profits 3,348 3,737 3,896 16.4% 4.3%
SG & A 1,248 1,358 1,375
EBITDA 2,100 2,378 2,521 20.1% 6.0%
Depreciation 112 139 169
Amortisation 12 18 19
EBIT 1,976 2,222 2,333 18.1% 5.0%
Foreign Exchange Gains/(loss) 36 3 66
Other Income, net 176 197 187
Provision for Tax 406 497 543
Net Income 1,783 1,926 2,047 14.8% 6.3%
Gross Margin 34.2% 34.9% 34.4%
EBITDA Margin 21.5% 22.2% 22.2%
EBIT Margin 20.2% 20.8% 20.6%
Net Income Margin 18.2% 18.0% 18.1%
Earnings Per Share
Annualized in ̀
Basic 51 55 58
Diluted 50 55 58
The options will vest in tranches till 2018.
WEIGHTED AVERAGE NUMBEROF SHARES
30-Jun-15 31-Mar-16 30-Jun-16
OUTSTANDING OPTIONS(in equivalent no of shares)
Basic 1,405,802,745 1,409,830,176 1,410,601,422
Diluted 1,412,640,360 1,412,909,436 1,412,206,169
30-Jun-15 31-Mar-16 30-Jun-16
Options at less than market price 8,218,232 3,681,176 1,944,560

consolidated balance sheet
Amount in Crores
PARTICULARS AS ON
31-Mar-16 30-Jun-16
Assets
Cash and Cash Equivalents 729.3 1,240.0
Accounts Receivables, net 7,721.3 8,550.4
Unbilled Receivables 3,001.5 2,356.6
Fixed Deposits 10,587.1 10,622.4
Investment Securities, available for sale 536.5 758.4
Other Current Assets 2,410.3 2,492.9
Total Current Assets 24,985.9 26,020.6
Property and Equipments, net 4,323.1 6,643.2
Intangible Assets, net 6,419.4 6,357.6
Investments in Equity Investee 160.1 150.3
Other Investments - 12.6
Other Assets 3,878.9 3,867.2
Total Assets 39,767.3 43,051.4
Liabilities & Stockholders Equity
Current Liabilities 9,508.5 11,408.0
Borrowings 973.2 791.8
Other Liabilities 1,263.5 1,810.7
Total Liabilities 11,745.2 14,010.5
Total Stockholders Equity 28,022.1 29,040.8
Total Liabilities and Stockholders Equity 39,767.3 43,051.4
- 19 -

Certain statements in this release are forward-looking statements, which involve a number of risks, uncertainties, assumptions and other factors that could cause actual results to differ materially from those in such forward-looking statements. All statements, other than statements of historical fact are statements that could be deemed forward looking statements, including but not limited to the statements containing the words 'planned', 'expects', 'believes', 'strategy', 'opportunity', 'anticipates', 'hopes' or other similar words. The risks and uncertainties relating to these statements include, but are not limited to, risks and uncertainties regarding impact of pending regulatory proceedings, fluctuations in earnings, our ability to manage growth, intense competition in IT services, Business Process Outsourcing and consulting services including those factors which may affect our cost advantage, wage increases in India, customer acceptances of our services, products and fee structures, our ability to attract and retain highly skilled professionals, our ability to integrate acquired assets in a cost effective and timely manner, time and cost overruns on fixed-price, fixed-time frame contracts, client concentration, restrictions on immigration, our ability to manage our international operations, reduced demand for technology in our key focus areas, disruptions in telecommunication networks, our ability to successfully complete and integrate potential acquisitions, the success of our brand development efforts, liability for damages on our service contracts, the success of the companies / entities in which we have made strategic investments, withdrawal of governmental fiscal incentives, political instability, legal restrictions on raising capital or acquiring companies outside India, and unauthorized use of our intellectual property, other risks, uncertainties and general economic conditions affecting our industry. There can be no assurance that the forward looking statements made herein will prove to be accurate, and issuance of such forward looking statements should not be regarded as a representation by the Company, or any other person, that the objective and plans of the Company will be achieved. All forward looking statements made herein are based on information presently available to the management of the Company and the Company does not undertake to update any forward-looking statement that may be made from time to time by or on behalf of the Company.
HCL Technologies is a leading global IT services company working with clients in areas that impact and redefine the core of their businesses. Since its emergence on global landscape after its IPO in 1999 and listing in 2000, HCL Technologies, along with its subsidiaries, today operates out of 32 countries and has consolidated revenues of US$ 6.4 billion, for 12
th stMonths ended 30 June, 2016. For the 21 Century Enterprise, HCL focuses on business model transformation, underlined by innovation and value creation, offering an integrated portfolio of services including BEYONDigital, IoT WoRKS, Engineering Services Outsourcing and Next–Generation ITO that focuses on integrated infrastructure services,
TM rdapplications services and business services. HCL leverages DryICE , its 3 generation automation platform, global network of integrated innovation labs, and global delivery capabilities to provide holistic, multi–service delivery in key industry verticals including Financial Services, Manufacturing, Telecommunications, Media, Publishing & Entertainment, Retail & CPG, Life sciences & Healthcare, Oil & Gas, Energy & Utilities, Travel, Transportation & Logistics and Government. With 107,968 professionals from diverse nationalities, HCL Technologies focuses on creating real value for customers by taking 'Relationships Beyond the Contract'. For more information, please visit www.hcltech.com
about hcl technologies
safe harbor statement
- 20 -

INVESTOR RELATIONS
For details, contact:
Sanjay Mendiratta
+91-120-6126335
Pulkit Mittal
+91-85 8881 6390
HCL Technologies Ltd., Technology Hub, SEZ, Plot No. 3A, Sec-126, Noida - 201304, India. www.hcltech.com
www.hcltech.com/investors
CORPORATE COMMUNICATIONS
Ajay Davessar
+91-120-6126000
Kunal Takalkar
+91-120-6126000
Hi, I am an ideapreneur. I believe that sustainable business outcomes are driven by relationships
nurtured through values like trust, transparency and flexibility. I respect the contract, but will do
whatever it takes, over and above it, to ensure your success. Right now 100,000+ ideapreneurs are in
a Relationship Beyond the Contract™ with 500+ customers in 32 countries. How can I help you?
talk to me