Q1 Fiscal 2009 Statistics - fedex.com · Q1 Fiscal 2009 Statistics FedEx Corporation Financial and...
27
Q1 Fiscal 2009 Statistics FedEx Corporation Financial and Operating Statistics First Quarter Fiscal 2009 September 18, 2008 This report is a statistical supplement to FedEx’s interim financial reports and is prepared quarterly. Additional copies are available for downloading and printing at www.fedex.com/us/investorrelations. For more information, write or call: Mickey Foster, Vice President Elizabeth Allen, Manager Stephen Hughes, Manager Jeff Smith, Manager FedEx Corp. Investor Relations 942 S. Shady Grove Road Memphis, TN 38120 Telephone: (901) 818-7200
Transcript of Q1 Fiscal 2009 Statistics - fedex.com · Q1 Fiscal 2009 Statistics FedEx Corporation Financial and...
Q1 Fiscal 2009 Statistics
FedEx Corporation
Financial and Operating Statistics
First Quarter Fiscal 2009
September 18, 2008
This report is a statistical supplement to FedEx’s interim financial reports and is prepared quarterly. Additional copies are available for downloading and printing at
www.fedex.com/us/investorrelations. For more information, write or call:
Mickey Foster, Vice President Elizabeth Allen, Manager
Stephen Hughes, Manager Jeff Smith, Manager
FedEx Corp. Investor Relations 942 S. Shady Grove Road
Memphis, TN 38120 Telephone: (901) 818-7200
TABLE OF CONTENTS
• FEDEX CORPORATION OVERVIEW 1 CONDENSED CONSOLIDATED BALANCE SHEETS 2 CONDENSED CONSOLIDATED STATEMENTS OF CASH FLOWS 3 ANNUAL CONSOLIDATED STATEMENTS OF INCOME 4 QUARTERLY CONSOLIDATED STATEMENTS OF INCOME FY2007 – FY2008 5 FY2009 – FY2010 6 CAPITAL EXPENDITURES 7
• FEDEX EXPRESS SEGMENT ANNUAL CONSOLIDATED STATEMENTS OF INCOME 8 QUARTERLY CONSOLIDATED STATEMENTS OF INCOME FY2007 – FY2008 9 FY2009 – FY2010 10 ANNUAL SHIPMENT STATISTICS 11 QUARTERLY SHIPMENT STATISTICS FY2007 – FY2008 12 FY2009 – FY2010 13 AIRCRAFT AND VEHICLE FLEET STATISTICS 14 JET FUEL STATISTICS 15
• FEDEX GROUND SEGMENT ANNUAL CONSOLIDATED STATEMENTS OF INCOME 16 QUARTERLY CONSOLIDATED STATEMENTS OF INCOME FY2007 – FY2008 17 FY2009 – FY2010 18 ANNUAL SHIPMENT STATISTICS 19 QUARTERLY SHIPMENT STATISTICS 20
• FEDEX FREIGHT SEGMENT ANNUAL CONSOLIDATED STATEMENTS OF INCOME 21 QUARTERLY CONSOLIDATED STATEMENTS OF INCOME FY2007 – FY2008 22 FY2009 – FY2010 23 ANNUAL SHIPMENT STATISTICS 24 QUARTERLY SHIPMENT STATISTICS 25
Q1 FY09 Stat Book / 1
FEDEX CORPORATION OVERVIEW
FedEx Corporation provides customers and businesses worldwide with a broad portfolio of transportation, e-commerce and business services. With annual revenues of $39 billion, the company offers integrated business applications through operating companies competing collectively and managed collaboratively, under the respected FedEx brand. Consistently ranked among the world's most admired and trusted employers, FedEx inspires its more than 290,000 employees and contractors to remain "absolutely, positively" focused on safety, the highest ethical and professional standards and the needs of their customers and communities. FedEx Express invented express distribution and remains the industry’s global leader, providing rapid, reliable, time-definite delivery to more than 220 countries and territories, connecting markets that comprise more than 90 percent of the world’s gross domestic product within one to three business days. Unmatched air route authorities and transportation infrastructure make FedEx Express the world’s largest express transportation company, providing fast and reliable services for 3.4 million shipments each business day. The FedEx Express segment also includes FedEx Trade Networks, which provides international trade services, specializing in customs brokerage and global cargo distribution. FedEx Ground is a leading provider of ground small-package delivery services, providing service to the U.S., Canada and Puerto Rico. FedEx Home Delivery, the industry’s first ground service dedicated to residential delivery, is available from FedEx Ground and is backed by a money-back guarantee. FedEx Ground segment financial results include FedEx SmartPost, which specializes in the consolidation and delivery of high volumes of low-weight, less time-sensitive business-to-consumer packages using the U.S. Postal Service for final delivery to residences. FedEx Freight, together with FedEx National LTL, is a leading regional and long-haul less-than-truckload (LTL) carrier and the market leader in providing next-day and second-day regional LTL freight services. FedEx Freight segment financial results also include Caribbean Transportation Services and FedEx Custom Critical, North America’s largest time-specific, critical shipment carrier. FedEx Services has overall responsibility for FedEx sales, marketing and customer-facing information technology. FedEx Services segment financial results include FedEx Office, a leading provider of document solutions and business services, FedEx Customer Information Services, which is responsible for customer service, billings and collections for FedEx Express and FedEx Ground, and FedEx Global Supply Chain Services, which provides a range of logistics services. CORPORATE HEADQUARTERS: 942 S. Shady Grove Road Memphis, TN 38120 COMMON STOCK LISTING: The New York Stock Exchange STOCK SYMBOL: FDX COMMON SHARES AUTHORIZED: 800,000,000 COMMON SHARES OUTSTANDING: 311,233,121 (as of August 31, 2008) STOCKHOLDERS OF RECORD: 18,961 (as of August 31, 2008) TRANSFER AGENT & REGISTRAR: Computershare Investor Services P.O. Box 43069 Providence, RI 02940-3069 (800) 446-2617 or John Ruocco (312) 499-7033 FISCAL YEAR END: May 31 ANNUAL MEETING: September 29, 2008
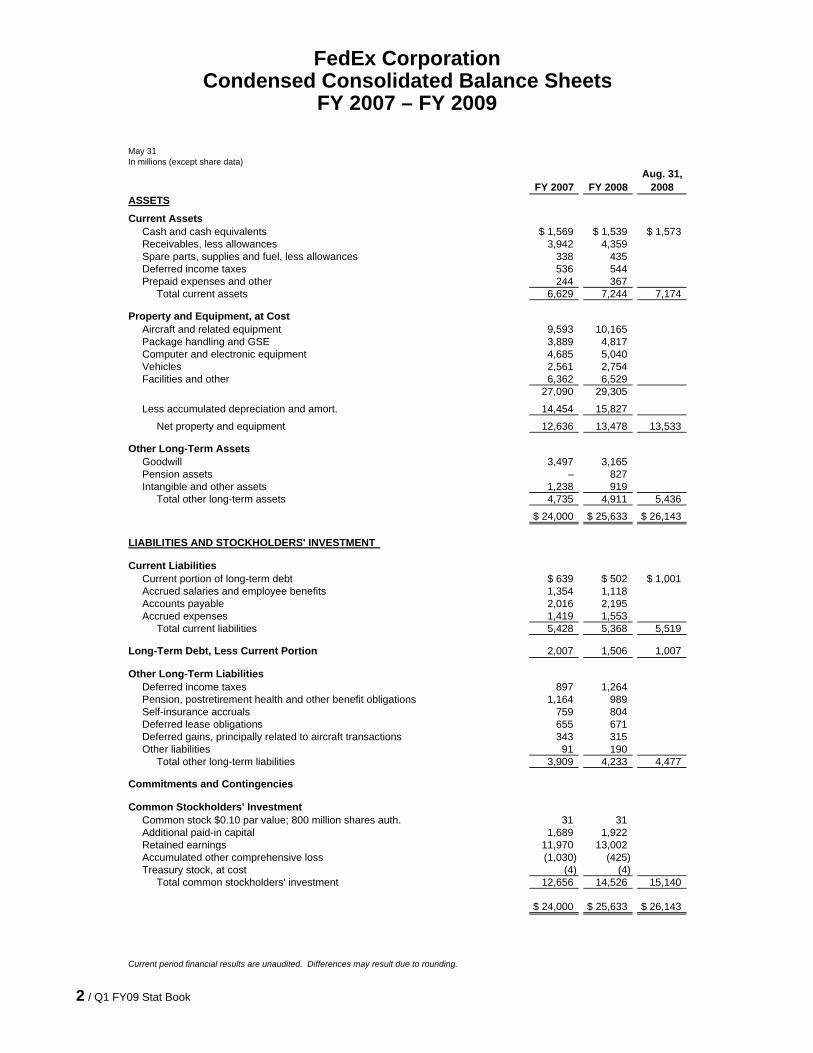
FedEx CorporationCondensed Consolidated Balance Sheets
FY 2007 – FY 2009
May 31 .
In millions (except share data)
FY 2007 FY 2008Aug. 31,
2008ASSETS
Current AssetsCash and cash equivalents $ 1,569 $ 1,539 $ 1,573Receivables, less allowances 3,942 4,359Spare parts, supplies and fuel, less allowances 338 435Deferred income taxes 536 544Prepaid expenses and other 244 367 Total current assets 6,629 7,244 7,174
Property and Equipment, at CostAircraft and related equipment 9,593 10,165Package handling and GSE 3,889 4,817Computer and electronic equipment 4,685 5,040Vehicles 2,561 2,754Facilities and other 6,362 6,529
27,090 29,305
Less accumulated depreciation and amort. 14,454 15,827
Net property and equipment 12,636 13,478 13,533
Other Long-Term AssetsGoodwill 3,497 3,165Pension assets – 827Intangible and other assets 1,238 919 Total other long-term assets 4,735 4,911 5,436
$ 24,000 $ 25,633 $ 26,143
LIABILITIES AND STOCKHOLDERS' INVESTMENT
Current LiabilitiesCurrent portion of long-term debt $ 639 $ 502 $ 1,001Accrued salaries and employee benefits 1,354 1,118Accounts payable 2,016 2,195Accrued expenses 1,419 1,553 Total current liabilities 5,428 5,368 5,519
Long-Term Debt, Less Current Portion 2,007 1,506 1,007
Other Long-Term LiabilitiesDeferred income taxes 897 1,264Pension, postretirement health and other benefit obligations 1,164 989Self-insurance accruals 759 804Deferred lease obligations 655 671Deferred gains, principally related to aircraft transactions 343 315Other liabilities 91 190 Total other long-term liabilities 3,909 4,233 4,477
Commitments and Contingencies
Common Stockholders' InvestmentCommon stock $0.10 par value; 800 million shares auth. 31 31Additional paid-in capital 1,689 1,922Retained earnings 11,970 13,002Accumulated other comprehensive loss (1,030) (425)Treasury stock, at cost (4) (4) Total common stockholders' investment 12,656 14,526 15,140
$ 24,000 $ 25,633 $ 26,143
Current period financial results are unaudited. Differences may result due to rounding.
2 / Q1 FY09 Stat Book
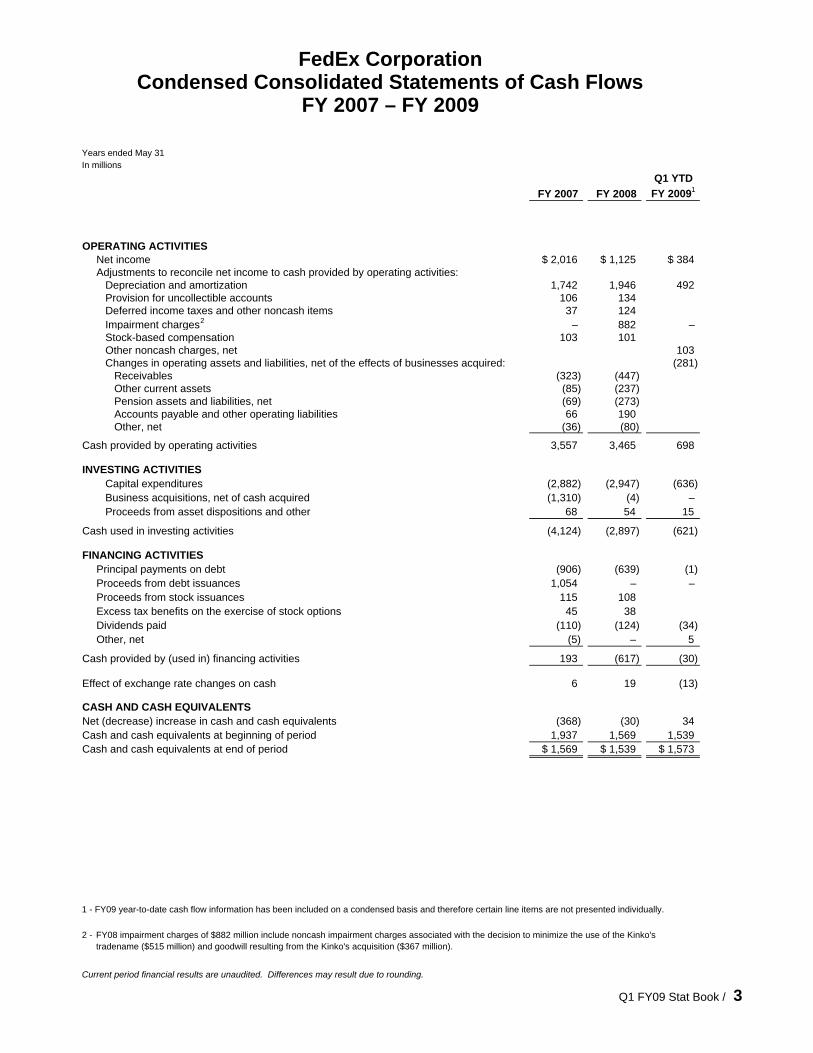
Years ended May 31 .
In millions
FY 2007 FY 2008Q1 YTD
FY 20091
OPERATING ACTIVITIESNet income $ 2,016 $ 1,125 $ 384Adjustments to reconcile net income to cash provided by operating activities: Depreciation and amortization 1,742 1,946 492 Provision for uncollectible accounts 106 134 Deferred income taxes and other noncash items 37 124 Impairment charges2 – 882 – Stock-based compensation 103 101 Other noncash charges, net 103 Changes in operating assets and liabilities, net of the effects of businesses acquired: (281) Receivables (323) (447) Other current assets (85) (237) Pension assets and liabilities, net (69) (273) Accounts payable and other operating liabilities 66 190 Other, net (36) (80)
Cash provided by operating activities 3,557 3,465 698
INVESTING ACTIVITIES Capital expenditures (2,882) (2,947) (636) Business acquisitions, net of cash acquired (1,310) (4) – Proceeds from asset dispositions and other 68 54 15
Cash used in investing activities (4,124) (2,897) (621)
FINANCING ACTIVITIESPrincipal payments on debt (906) (639) (1)Proceeds from debt issuances 1,054 – –Proceeds from stock issuances 115 108Excess tax benefits on the exercise of stock options 45 38Dividends paid (110) (124) (34)Other, net (5) – 5
Cash provided by (used in) financing activities 193 (617) (30)
Effect of exchange rate changes on cash 6 19 (13)
CASH AND CASH EQUIVALENTSNet (decrease) increase in cash and cash equivalents (368) (30) 34Cash and cash equivalents at beginning of period 1,937 1,569 1,539Cash and cash equivalents at end of period $ 1,569 $ 1,539 $ 1,573
2 -
Current period financial results are unaudited. Differences may result due to rounding.
FY08 impairment charges of $882 million include noncash impairment charges associated with the decision to minimize the use of the Kinko's tradename ($515 million) and goodwill resulting from the Kinko's acquisition ($367 million).
1 - FY09 year-to-date cash flow information has been included on a condensed basis and therefore certain line items are not presented individually.
Condensed Consolidated Statements of Cash FlowsFedEx Corporation
FY 2007 – FY 2009
Q1 FY09 Stat Book / 3
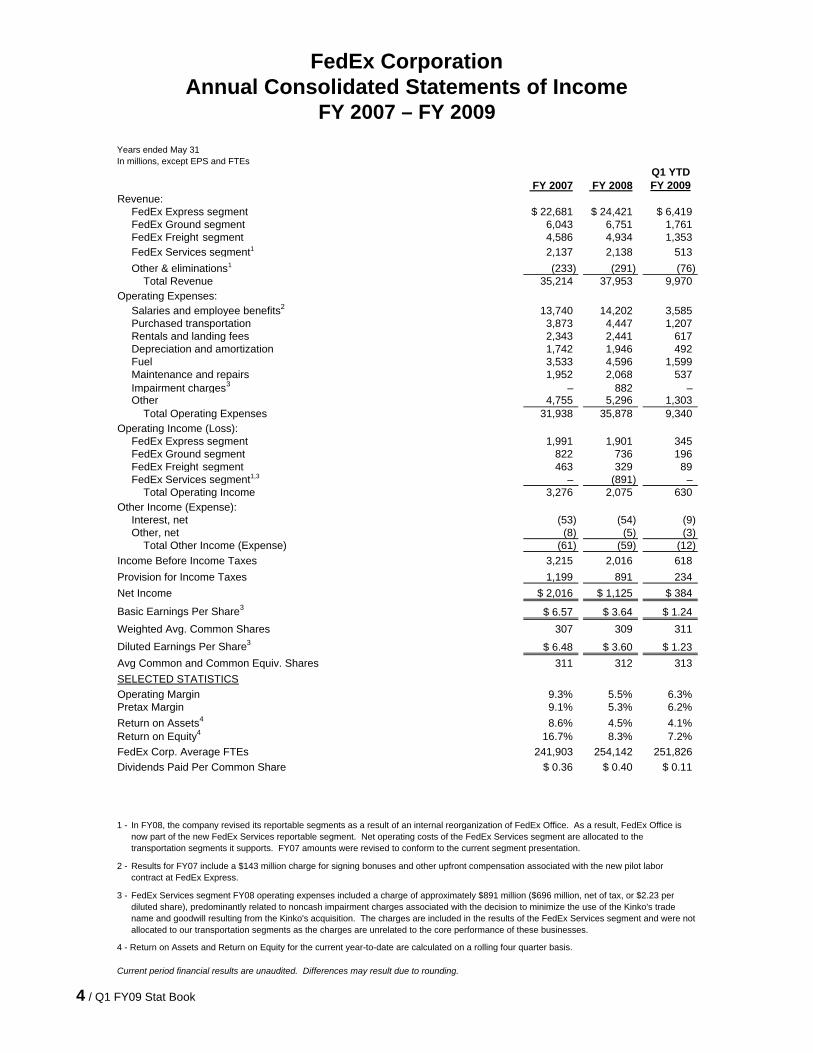
FedEx CorporationAnnual Consolidated Statements of Income
FY 2007 – FY 2009Years ended May 31In millions, except EPS and FTEs
Q1 YTD FY 2007 FY 2008 FY 2009
Revenue:FedEx Express segment $ 22,681 $ 24,421 $ 6,419FedEx Ground segment 6,043 6,751 1,761FedEx Freight segment 4,586 4,934 1,353FedEx Services segment1 2,137 2,138 513Other & eliminations1 (233) (291) (76) Total Revenue 35,214 37,953 9,970
Operating Expenses:Salaries and employee benefits2 13,740 14,202 3,585Purchased transportation 3,873 4,447 1,207Rentals and landing fees 2,343 2,441 617Depreciation and amortization 1,742 1,946 492Fuel 3,533 4,596 1,599Maintenance and repairs 1,952 2,068 537Impairment charges3 – 882 –Other 4,755 5,296 1,303 Total Operating Expenses 31,938 35,878 9,340
Operating Income (Loss):FedEx Express segment 1,991 1,901 345FedEx Ground segment 822 736 196FedEx Freight segment 463 329 89FedEx Services segment1,3 – (891) – Total Operating Income 3,276 2,075 630
Other Income (Expense):Interest, net (53) (54) (9)Other, net (8) (5) (3) Total Other Income (Expense) (61) (59) (12)
Income Before Income Taxes 3,215 2,016 618Provision for Income Taxes 1,199 891 234Net Income $ 2,016 $ 1,125 $ 384
Basic Earnings Per Share3 $ 6.57 $ 3.64 $ 1.24Weighted Avg. Common Shares 307 309 311Diluted Earnings Per Share3 $ 6.48 $ 3.60 $ 1.23Avg Common and Common Equiv. Shares 311 312 313SELECTED STATISTICSOperating Margin 9.3% 5.5% 6.3%Pretax Margin 9.1% 5.3% 6.2%Return on Assets4 8.6% 4.5% 4.1%Return on Equity4 16.7% 8.3% 7.2%FedEx Corp. Average FTEs 241,903 254,142 251,826Dividends Paid Per Common Share $ 0.36 $ 0.40 $ 0.11
1 -
2 -
3 -
4 - Return on Assets and Return on Equity for the current year-to-date are calculated on a rolling four quarter basis.
Current period financial results are unaudited. Differences may result due to rounding.
In FY08, the company revised its reportable segments as a result of an internal reorganization of FedEx Office. As a result, FedEx Office is now part of the new FedEx Services reportable segment. Net operating costs of the FedEx Services segment are allocated to the transportation segments it supports. FY07 amounts were revised to conform to the current segment presentation.
Results for FY07 include a $143 million charge for signing bonuses and other upfront compensation associated with the new pilot labor contract at FedEx Express.
FedEx Services segment FY08 operating expenses included a charge of approximately $891 million ($696 million, net of tax, or $2.23 per diluted share), predominantly related to noncash impairment charges associated with the decision to minimize the use of the Kinko's trade name and goodwill resulting from the Kinko's acquisition. The charges are included in the results of the FedEx Services segment and were not allocated to our transportation segments as the charges are unrelated to the core performance of these businesses.
4 / Q1 FY09 Stat Book
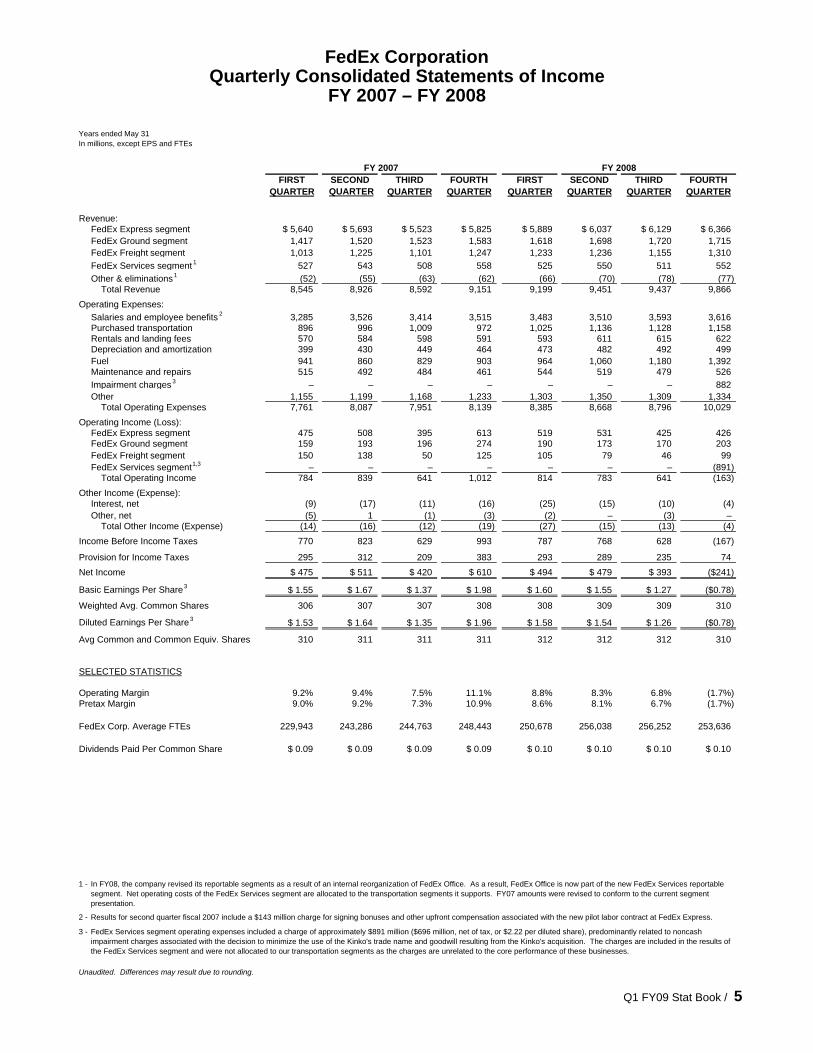
FedEx CorporationQuarterly Consolidated Statements of Income
FY 2007 – FY 2008
Years ended May 31In millions, except EPS and FTEs
FY 2007 FY 2008FIRST SECOND THIRD FOURTH FIRST SECOND THIRD FOURTH
QUARTER QUARTER QUARTER QUARTER QUARTER QUARTER QUARTER QUARTER
Revenue:FedEx Express segment $ 5,640 $ 5,693 $ 5,523 $ 5,825 $ 5,889 $ 6,037 $ 6,129 $ 6,366FedEx Ground segment 1,417 1,520 1,523 1,583 1,618 1,698 1,720 1,715FedEx Freight segment 1,013 1,225 1,101 1,247 1,233 1,236 1,155 1,310FedEx Services segment1 527 543 508 558 525 550 511 552Other & eliminations1 (52) (55) (63) (62) (66) (70) (78) (77) Total Revenue 8,545 8,926 8,592 9,151 9,199 9,451 9,437 9,866
Operating Expenses:Salaries and employee benefits 2 3,285 3,526 3,414 3,515 3,483 3,510 3,593 3,616Purchased transportation 896 996 1,009 972 1,025 1,136 1,128 1,158Rentals and landing fees 570 584 598 591 593 611 615 622Depreciation and amortization 399 430 449 464 473 482 492 499Fuel 941 860 829 903 964 1,060 1,180 1,392Maintenance and repairs 515 492 484 461 544 519 479 526Impairment charges3 – – – – – – – 882Other 1,155 1,199 1,168 1,233 1,303 1,350 1,309 1,334 Total Operating Expenses 7,761 8,087 7,951 8,139 8,385 8,668 8,796 10,029
Operating Income (Loss):FedEx Express segment 475 508 395 613 519 531 425 426FedEx Ground segment 159 193 196 274 190 173 170 203FedEx Freight segment 150 138 50 125 105 79 46 99FedEx Services segment1,3 – – – – – – – (891) Total Operating Income 784 839 641 1,012 814 783 641 (163)
Other Income (Expense):Interest, net (9) (17) (11) (16) (25) (15) (10) (4)Other, net (5) 1 (1) (3) (2) – (3) – Total Other Income (Expense) (14) (16) (12) (19) (27) (15) (13) (4)
Income Before Income Taxes 770 823 629 993 787 768 628 (167)
Provision for Income Taxes 295 312 209 383 293 289 235 74Net Income $ 475 $ 511 $ 420 $ 610 $ 494 $ 479 $ 393 ($241)
Basic Earnings Per Share3 $ 1.55 $ 1.67 $ 1.37 $ 1.98 $ 1.60 $ 1.55 $ 1.27 ($0.78)
Weighted Avg. Common Shares 306 307 307 308 308 309 309 310
Diluted Earnings Per Share3 $ 1.53 $ 1.64 $ 1.35 $ 1.96 $ 1.58 $ 1.54 $ 1.26 ($0.78)
Avg Common and Common Equiv. Shares 310 311 311 311 312 312 312 310
SELECTED STATISTICS
Operating Margin 9.2% 9.4% 7.5% 11.1% 8.8% 8.3% 6.8% (1.7%)Pretax Margin 9.0% 9.2% 7.3% 10.9% 8.6% 8.1% 6.7% (1.7%)
FedEx Corp. Average FTEs 229,943 243,286 244,763 248,443 250,678 256,038 256,252 253,636
Dividends Paid Per Common Share $ 0.09 $ 0.09 $ 0.09 $ 0.09 $ 0.10 $ 0.10 $ 0.10 $ 0.10
1 -
2 -
3 -
Unaudited. Differences may result due to rounding.
In FY08, the company revised its reportable segments as a result of an internal reorganization of FedEx Office. As a result, FedEx Office is now part of the new FedEx Services reportable segment. Net operating costs of the FedEx Services segment are allocated to the transportation segments it supports. FY07 amounts were revised to conform to the current segment presentation.
Results for second quarter fiscal 2007 include a $143 million charge for signing bonuses and other upfront compensation associated with the new pilot labor contract at FedEx Express.
FedEx Services segment operating expenses included a charge of approximately $891 million ($696 million, net of tax, or $2.22 per diluted share), predominantly related to noncash impairment charges associated with the decision to minimize the use of the Kinko's trade name and goodwill resulting from the Kinko's acquisition. The charges are included in the results of the FedEx Services segment and were not allocated to our transportation segments as the charges are unrelated to the core performance of these businesses.
Q1 FY09 Stat Book / 5
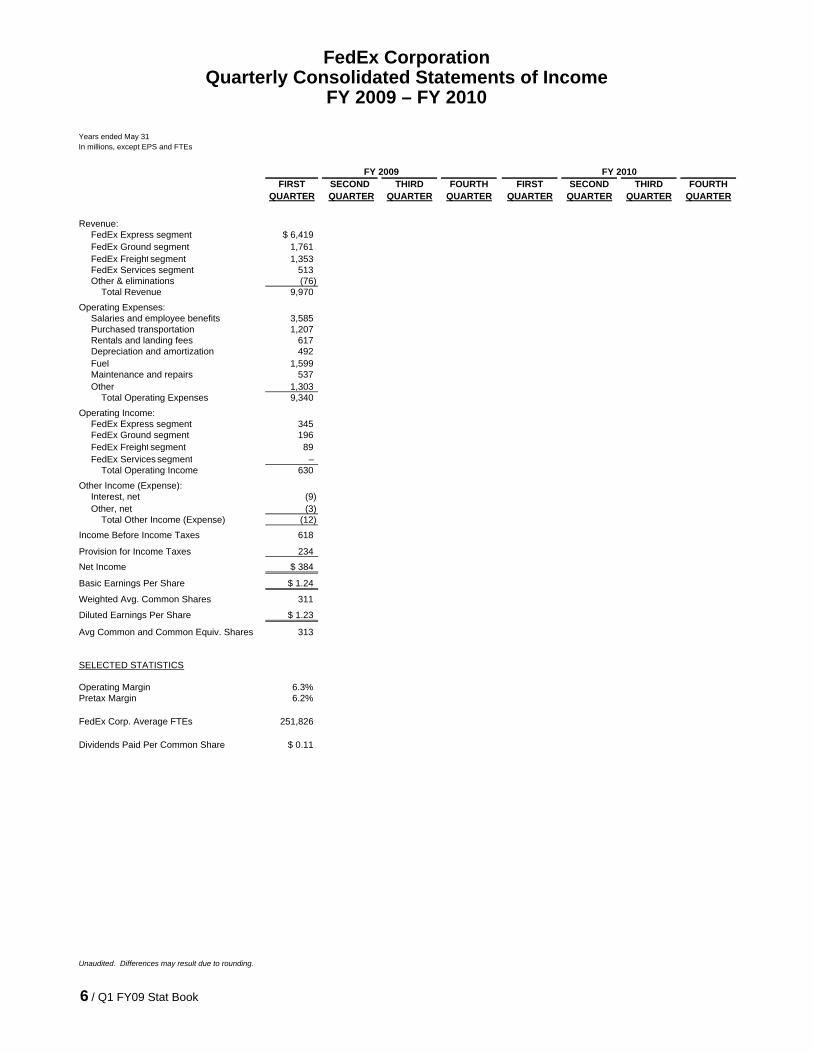
FedEx CorporationQuarterly Consolidated Statements of Income
FY 2009 – FY 2010
Years ended May 31In millions, except EPS and FTEs
FY 2009 FY 2010FIRST SECOND THIRD FOURTH FIRST SECOND THIRD FOURTH
QUARTER QUARTER QUARTER QUARTER QUARTER QUARTER QUARTER QUARTER
Revenue:FedEx Express segment $ 6,419FedEx Ground segment 1,761FedEx Freight segment 1,353FedEx Services segment 513Other & eliminations (76) Total Revenue 9,970
Operating Expenses:Salaries and employee benefits 3,585Purchased transportation 1,207Rentals and landing fees 617Depreciation and amortization 492Fuel 1,599Maintenance and repairs 537Other 1,303 Total Operating Expenses 9,340
Operating Income:FedEx Express segment 345FedEx Ground segment 196FedEx Freight segment 89FedEx Services segment – Total Operating Income 630
Other Income (Expense):Interest, net (9)Other, net (3) Total Other Income (Expense) (12)
Income Before Income Taxes 618
Provision for Income Taxes 234Net Income $ 384
Basic Earnings Per Share $ 1.24
Weighted Avg. Common Shares 311
Diluted Earnings Per Share $ 1.23
Avg Common and Common Equiv. Shares 313
SELECTED STATISTICS
Operating Margin 6.3%Pretax Margin 6.2%
FedEx Corp. Average FTEs 251,826
Dividends Paid Per Common Share $ 0.11
Unaudited. Differences may result due to rounding.
6 / Q1 FY09 Stat Book
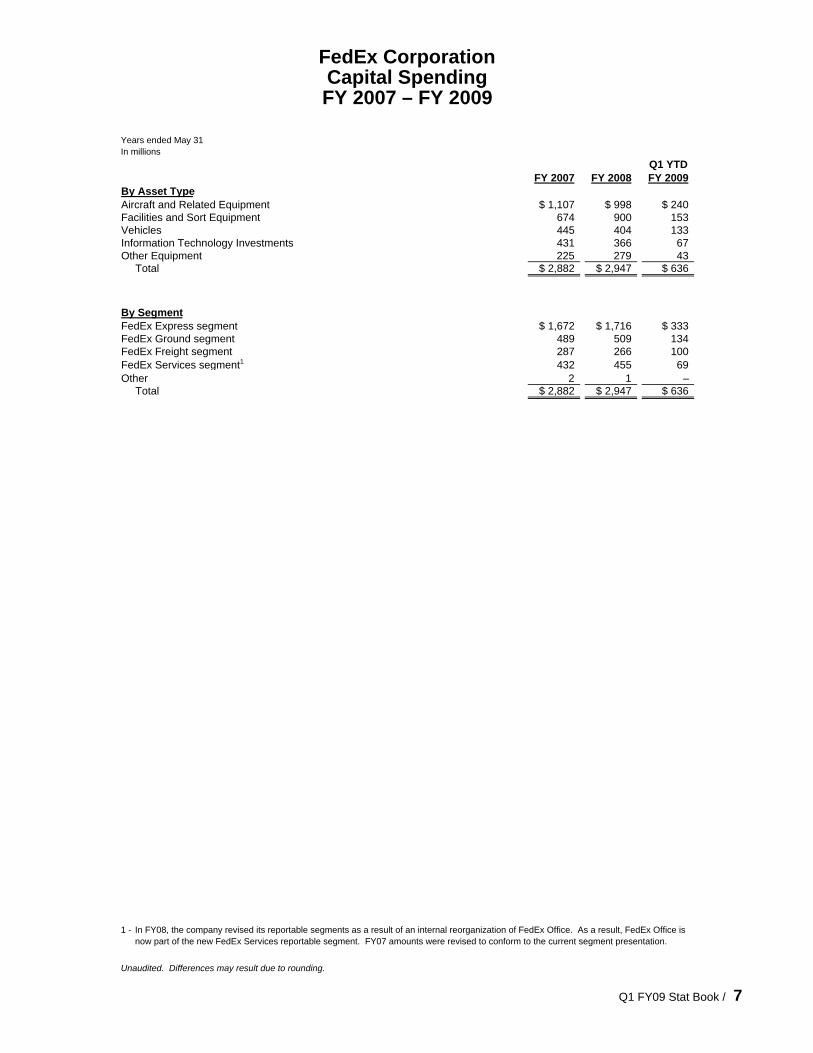
FedEx CorporationCapital SpendingFY 2007 – FY 2009
Years ended May 31In millions
Q1 YTDFY 2007 FY 2008 FY 2009
By Asset TypeAircraft and Related Equipment $ 1,107 $ 998 $ 240Facilities and Sort Equipment 674 900 153Vehicles 445 404 133Information Technology Investments 431 366 67Other Equipment 225 279 43
Total $ 2,882 $ 2,947 $ 636
By SegmentFedEx Express segment $ 1,672 $ 1,716 $ 333FedEx Ground segment 489 509 134FedEx Freight segment 287 266 100FedEx Services segment1 432 455 69Other 2 1 –
Total $ 2,882 $ 2,947 $ 636
1 -
Unaudited. Differences may result due to rounding.
In FY08, the company revised its reportable segments as a result of an internal reorganization of FedEx Office. As a result, FedEx Office is now part of the new FedEx Services reportable segment. FY07 amounts were revised to conform to the current segment presentation.
Q1 FY09 Stat Book / 7
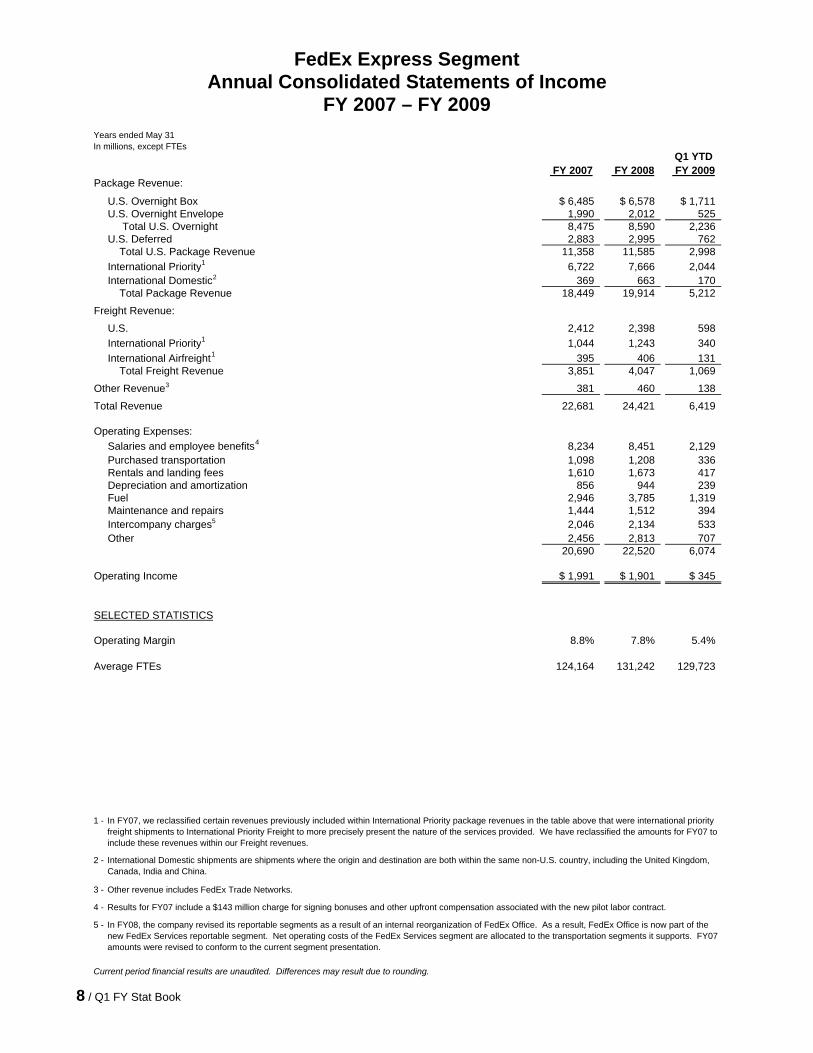
Years ended May 31In millions, except FTEs
Q1 YTD FY 2007 FY 2008 FY 2009
Package Revenue:
U.S. Overnight Box $ 6,485 $ 6,578 $ 1,711U.S. Overnight Envelope 1,990 2,012 525 Total U.S. Overnight 8,475 8,590 2,236U.S. Deferred 2,883 2,995 762 Total U.S. Package Revenue 11,358 11,585 2,998International Priority1 6,722 7,666 2,044International Domestic2 369 663 170 Total Package Revenue 18,449 19,914 5,212
Freight Revenue:
U.S. 2,412 2,398 598International Priority1 1,044 1,243 340International Airfreight1 395 406 131 Total Freight Revenue 3,851 4,047 1,069
Other Revenue3 381 460 138
Total Revenue 22,681 24,421 6,419
Operating Expenses:Salaries and employee benefits4 8,234 8,451 2,129Purchased transportation 1,098 1,208 336Rentals and landing fees 1,610 1,673 417Depreciation and amortization 856 944 239Fuel 2,946 3,785 1,319Maintenance and repairs 1,444 1,512 394Intercompany charges5 2,046 2,134 533Other 2,456 2,813 707
20,690 22,520 6,074
Operating Income $ 1,991 $ 1,901 $ 345
SELECTED STATISTICS
Operating Margin 8.8% 7.8% 5.4%
Average FTEs 124,164 131,242 129,723
1 -
2 -
3 -
4 -
5 -
Current period financial results are unaudited. Differences may result due to rounding.
International Domestic shipments are shipments where the origin and destination are both within the same non-U.S. country, including the United Kingdom, Canada, India and China.
In FY08, the company revised its reportable segments as a result of an internal reorganization of FedEx Office. As a result, FedEx Office is now part of the new FedEx Services reportable segment. Net operating costs of the FedEx Services segment are allocated to the transportation segments it supports. FY07 amounts were revised to conform to the current segment presentation.
FedEx Express Segment
FY 2007 – FY 2009
Other revenue includes FedEx Trade Networks.
In FY07, we reclassified certain revenues previously included within International Priority package revenues in the table above that were international priority freight shipments to International Priority Freight to more precisely present the nature of the services provided. We have reclassified the amounts for FY07 to include these revenues within our Freight revenues.
Results for FY07 include a $143 million charge for signing bonuses and other upfront compensation associated with the new pilot labor contract.
Annual Consolidated Statements of Income
8 / Q1 FY Stat Book
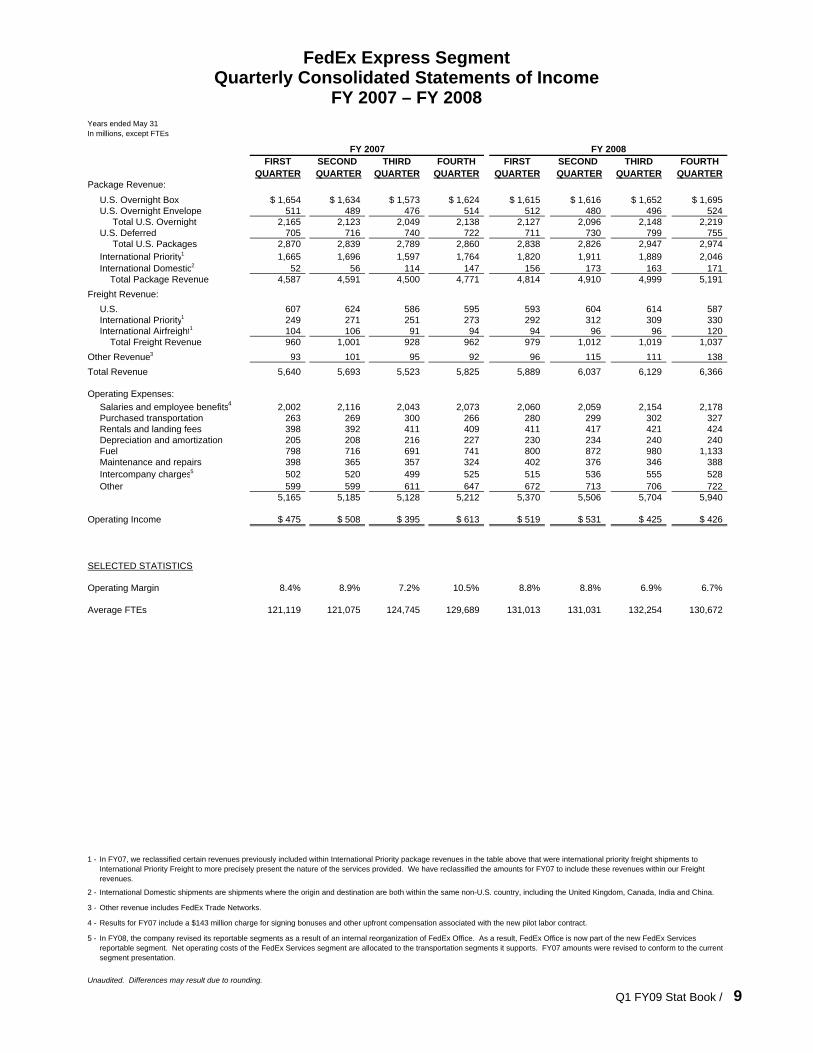
FedEx Express SegmentQuarterly Consolidated Statements of Income
FY 2007 – FY 2008Years ended May 31In millions, except FTEs
FY 2007 FY 2008FIRST SECOND THIRD FOURTH FIRST SECOND THIRD FOURTH
QUARTER QUARTER QUARTER QUARTER QUARTER QUARTER QUARTER QUARTERPackage Revenue:
U.S. Overnight Box $ 1,654 $ 1,634 $ 1,573 $ 1,624 $ 1,615 $ 1,616 $ 1,652 $ 1,695U.S. Overnight Envelope 511 489 476 514 512 480 496 524 Total U.S. Overnight 2,165 2,123 2,049 2,138 2,127 2,096 2,148 2,219U.S. Deferred 705 716 740 722 711 730 799 755 Total U.S. Packages 2,870 2,839 2,789 2,860 2,838 2,826 2,947 2,974International Priority1 1,665 1,696 1,597 1,764 1,820 1,911 1,889 2,046International Domestic2 52 56 114 147 156 173 163 171 Total Package Revenue 4,587 4,591 4,500 4,771 4,814 4,910 4,999 5,191
Freight Revenue:U.S. 607 624 586 595 593 604 614 587International Priority1 249 271 251 273 292 312 309 330International Airfreight1 104 106 91 94 94 96 96 120 Total Freight Revenue 960 1,001 928 962 979 1,012 1,019 1,037
Other Revenue3 93 101 95 92 96 115 111 138Total Revenue 5,640 5,693 5,523 5,825 5,889 6,037 6,129 6,366
Operating Expenses:Salaries and employee benefits4 2,002 2,116 2,043 2,073 2,060 2,059 2,154 2,178Purchased transportation 263 269 300 266 280 299 302 327Rentals and landing fees 398 392 411 409 411 417 421 424Depreciation and amortization 205 208 216 227 230 234 240 240Fuel 798 716 691 741 800 872 980 1,133Maintenance and repairs 398 365 357 324 402 376 346 388Intercompany charges5 502 520 499 525 515 536 555 528Other 599 599 611 647 672 713 706 722
5,165 5,185 5,128 5,212 5,370 5,506 5,704 5,940
Operating Income $ 475 $ 508 $ 395 $ 613 $ 519 $ 531 $ 425 $ 426
SELECTED STATISTICS
Operating Margin 8.4% 8.9% 7.2% 10.5% 8.8% 8.8% 6.9% 6.7%
Average FTEs 121,119 121,075 124,745 129,689 131,013 131,031 132,254 130,672
1 -
2 -
3 -
4 -
5 -
Unaudited. Differences may result due to rounding.
In FY08, the company revised its reportable segments as a result of an internal reorganization of FedEx Office. As a result, FedEx Office is now part of the new FedEx Services reportable segment. Net operating costs of the FedEx Services segment are allocated to the transportation segments it supports. FY07 amounts were revised to conform to the current segment presentation.
Other revenue includes FedEx Trade Networks.
Results for FY07 include a $143 million charge for signing bonuses and other upfront compensation associated with the new pilot labor contract.
In FY07, we reclassified certain revenues previously included within International Priority package revenues in the table above that were international priority freight shipments to International Priority Freight to more precisely present the nature of the services provided. We have reclassified the amounts for FY07 to include these revenues within our Freight revenues.
International Domestic shipments are shipments where the origin and destination are both within the same non-U.S. country, including the United Kingdom, Canada, India and China.
Q1 FY09 Stat Book / 9
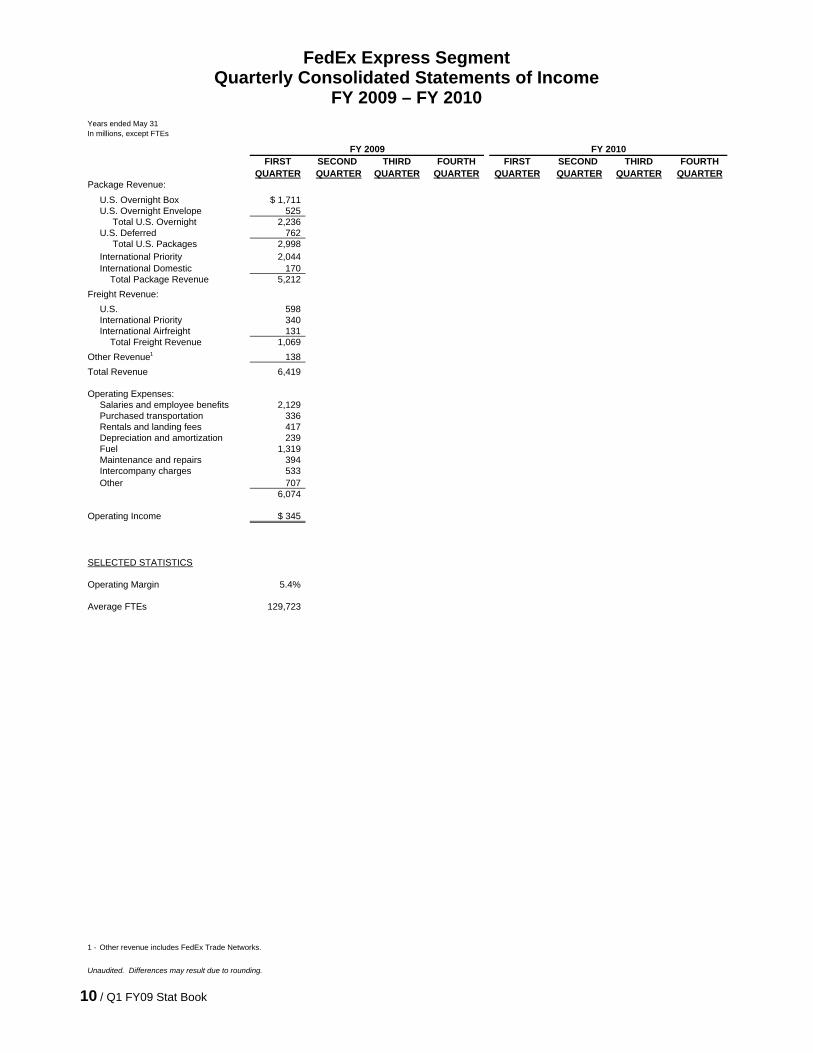
FedEx Express SegmentQuarterly Consolidated Statements of Income
FY 2009 – FY 2010Years ended May 31In millions, except FTEs
FY 2009 FY 2010FIRST SECOND THIRD FOURTH FIRST SECOND THIRD FOURTH
QUARTER QUARTER QUARTER QUARTER QUARTER QUARTER QUARTER QUARTERPackage Revenue:
U.S. Overnight Box $ 1,711U.S. Overnight Envelope 525 Total U.S. Overnight 2,236U.S. Deferred 762 Total U.S. Packages 2,998International Priority 2,044International Domestic 170 Total Package Revenue 5,212
Freight Revenue:U.S. 598International Priority 340International Airfreight 131 Total Freight Revenue 1,069
Other Revenue1 138Total Revenue 6,419
Operating Expenses:Salaries and employee benefits 2,129Purchased transportation 336Rentals and landing fees 417Depreciation and amortization 239Fuel 1,319Maintenance and repairs 394Intercompany charges 533Other 707
6,074
Operating Income $ 345
SELECTED STATISTICS
Operating Margin 5.4%
Average FTEs 129,723
1 -
Unaudited. Differences may result due to rounding.
Other revenue includes FedEx Trade Networks.
10 / Q1 FY09 Stat Book
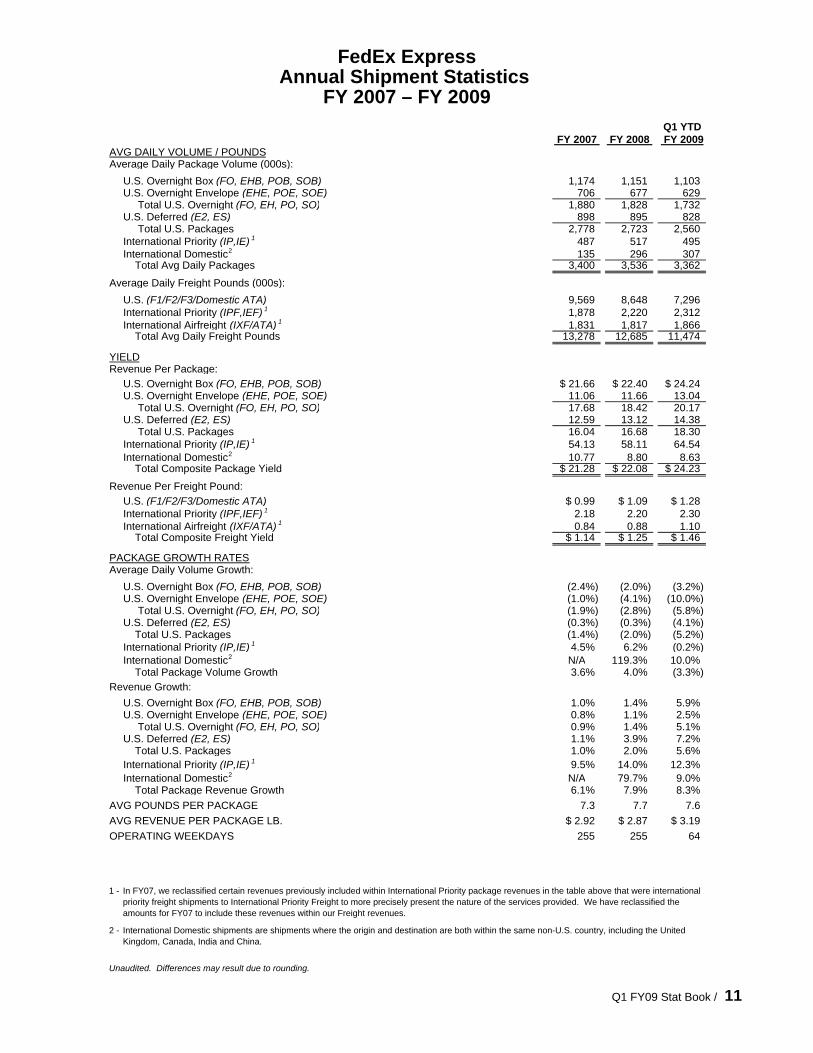
FedEx ExpressAnnual Shipment Statistics
FY 2007 – FY 2009Q1 YTD
FY 2007 FY 2008 FY 2009AVG DAILY VOLUME / POUNDSAverage Daily Package Volume (000s):
U.S. Overnight Box (FO, EHB, POB, SOB) 1,174 1,151 1,103U.S. Overnight Envelope (EHE, POE, SOE) 706 677 629 Total U.S. Overnight (FO, EH, PO, SO) 1,880 1,828 1,732U.S. Deferred (E2, ES) 898 895 828 Total U.S. Packages 2,778 2,723 2,560International Priority (IP,IE) 1 487 517 495International Domestic2 135 296 307 Total Avg Daily Packages 3,400 3,536 3,362
Average Daily Freight Pounds (000s):U.S. (F1/F2/F3/Domestic ATA) 9,569 8,648 7,296International Priority (IPF,IEF) 1 1,878 2,220 2,312International Airfreight (IXF/ATA) 1 1,831 1,817 1,866 Total Avg Daily Freight Pounds 13,278 12,685 11,474
YIELDRevenue Per Package:
U.S. Overnight Box (FO, EHB, POB, SOB) $ 21.66 $ 22.40 $ 24.24U.S. Overnight Envelope (EHE, POE, SOE) 11.06 11.66 13.04 Total U.S. Overnight (FO, EH, PO, SO) 17.68 18.42 20.17U.S. Deferred (E2, ES) 12.59 13.12 14.38 Total U.S. Packages 16.04 16.68 18.30International Priority (IP,IE) 1 54.13 58.11 64.54International Domestic2 10.77 8.80 8.63 Total Composite Package Yield $ 21.28 $ 22.08 $ 24.23
Revenue Per Freight Pound:U.S. (F1/F2/F3/Domestic ATA) $ 0.99 $ 1.09 $ 1.28International Priority (IPF,IEF) 1 2.18 2.20 2.30International Airfreight (IXF/ATA) 1 0.84 0.88 1.10 Total Composite Freight Yield $ 1.14 $ 1.25 $ 1.46
PACKAGE GROWTH RATESAverage Daily Volume Growth:
U.S. Overnight Box (FO, EHB, POB, SOB) (2.4%) (2.0%) (3.2%)U.S. Overnight Envelope (EHE, POE, SOE) (1.0%) (4.1%) (10.0%) Total U.S. Overnight (FO, EH, PO, SO) (1.9%) (2.8%) (5.8%)U.S. Deferred (E2, ES) (0.3%) (0.3%) (4.1%) Total U.S. Packages (1.4%) (2.0%) (5.2%)International Priority (IP,IE) 1 4.5% 6.2% (0.2%)International Domestic2 N/A 119.3% 10.0% Total Package Volume Growth 3.6% 4.0% (3.3%)
Revenue Growth:U.S. Overnight Box (FO, EHB, POB, SOB) 1.0% 1.4% 5.9%U.S. Overnight Envelope (EHE, POE, SOE) 0.8% 1.1% 2.5% Total U.S. Overnight (FO, EH, PO, SO) 0.9% 1.4% 5.1%U.S. Deferred (E2, ES) 1.1% 3.9% 7.2% Total U.S. Packages 1.0% 2.0% 5.6%International Priority (IP,IE) 1 9.5% 14.0% 12.3%International Domestic2 N/A 79.7% 9.0% Total Package Revenue Growth 6.1% 7.9% 8.3%
AVG POUNDS PER PACKAGE 7.3 7.7 7.6AVG REVENUE PER PACKAGE LB. $ 2.92 $ 2.87 $ 3.19OPERATING WEEKDAYS 255 255 64
1 -
2 -
Unaudited. Differences may result due to rounding.
In FY07, we reclassified certain revenues previously included within International Priority package revenues in the table above that were international priority freight shipments to International Priority Freight to more precisely present the nature of the services provided. We have reclassified the amounts for FY07 to include these revenues within our Freight revenues.
International Domestic shipments are shipments where the origin and destination are both within the same non-U.S. country, including the United Kingdom, Canada, India and China.
Q1 FY09 Stat Book / 11
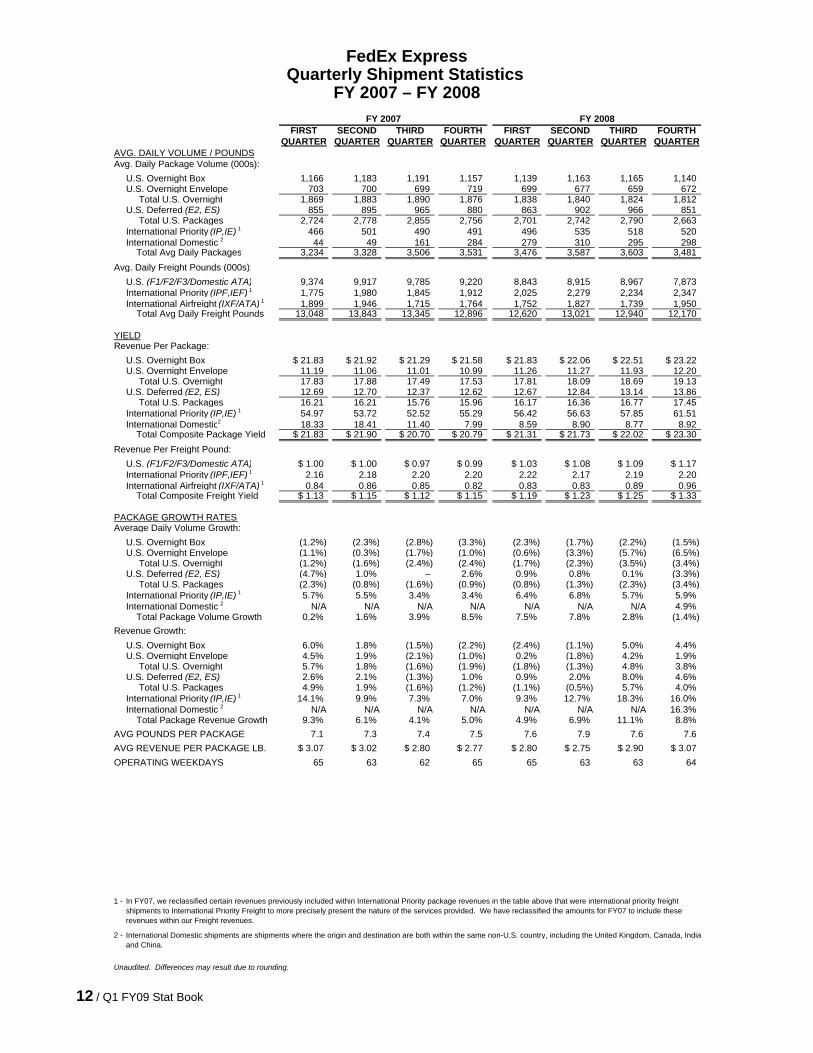
FedEx ExpressQuarterly Shipment Statistics
FY 2007 – FY 2008FY 2007 FY 2008
FIRST SECOND THIRD FOURTH FIRST SECOND THIRD FOURTHQUARTER QUARTER QUARTER QUARTER QUARTER QUARTER QUARTER QUARTER
AVG. DAILY VOLUME / POUNDSAvg. Daily Package Volume (000s):
U.S. Overnight Box 1,166 1,183 1,191 1,157 1,139 1,163 1,165 1,140U.S. Overnight Envelope 703 700 699 719 699 677 659 672 Total U.S. Overnight 1,869 1,883 1,890 1,876 1,838 1,840 1,824 1,812U.S. Deferred (E2, ES) 855 895 965 880 863 902 966 851 Total U.S. Packages 2,724 2,778 2,855 2,756 2,701 2,742 2,790 2,663International Priority (IP,IE) 1 466 501 490 491 496 535 518 520International Domestic 2 44 49 161 284 279 310 295 298 Total Avg Daily Packages 3,234 3,328 3,506 3,531 3,476 3,587 3,603 3,481
Avg. Daily Freight Pounds (000s):U.S. (F1/F2/F3/Domestic ATA) 9,374 9,917 9,785 9,220 8,843 8,915 8,967 7,873International Priority (IPF,IEF) 1 1,775 1,980 1,845 1,912 2,025 2,279 2,234 2,347International Airfreight (IXF/ATA) 1 1,899 1,946 1,715 1,764 1,752 1,827 1,739 1,950 Total Avg Daily Freight Pounds 13,048 13,843 13,345 12,896 12,620 13,021 12,940 12,170
YIELDRevenue Per Package:
U.S. Overnight Box $ 21.83 $ 21.92 $ 21.29 $ 21.58 $ 21.83 $ 22.06 $ 22.51 $ 23.22U.S. Overnight Envelope 11.19 11.06 11.01 10.99 11.26 11.27 11.93 12.20 Total U.S. Overnight 17.83 17.88 17.49 17.53 17.81 18.09 18.69 19.13U.S. Deferred (E2, ES) 12.69 12.70 12.37 12.62 12.67 12.84 13.14 13.86 Total U.S. Packages 16.21 16.21 15.76 15.96 16.17 16.36 16.77 17.45International Priority (IP,IE) 1 54.97 53.72 52.52 55.29 56.42 56.63 57.85 61.51International Domestic2 18.33 18.41 11.40 7.99 8.59 8.90 8.77 8.92 Total Composite Package Yield $ 21.83 $ 21.90 $ 20.70 $ 20.79 $ 21.31 $ 21.73 $ 22.02 $ 23.30
Revenue Per Freight Pound:U.S. (F1/F2/F3/Domestic ATA) $ 1.00 $ 1.00 $ 0.97 $ 0.99 $ 1.03 $ 1.08 $ 1.09 $ 1.17International Priority (IPF,IEF) 1 2.16 2.18 2.20 2.20 2.22 2.17 2.19 2.20International Airfreight (IXF/ATA) 1 0.84 0.86 0.85 0.82 0.83 0.83 0.89 0.96 Total Composite Freight Yield $ 1.13 $ 1.15 $ 1.12 $ 1.15 $ 1.19 $ 1.23 $ 1.25 $ 1.33
PACKAGE GROWTH RATESAverage Daily Volume Growth:
U.S. Overnight Box (1.2%) (2.3%) (2.8%) (3.3%) (2.3%) (1.7%) (2.2%) (1.5%)U.S. Overnight Envelope (1.1%) (0.3%) (1.7%) (1.0%) (0.6%) (3.3%) (5.7%) (6.5%) Total U.S. Overnight (1.2%) (1.6%) (2.4%) (2.4%) (1.7%) (2.3%) (3.5%) (3.4%)U.S. Deferred (E2, ES) (4.7%) 1.0% – 2.6% 0.9% 0.8% 0.1% (3.3%) Total U.S. Packages (2.3%) (0.8%) (1.6%) (0.9%) (0.8%) (1.3%) (2.3%) (3.4%)International Priority (IP,IE) 1 5.7% 5.5% 3.4% 3.4% 6.4% 6.8% 5.7% 5.9%International Domestic 2 N/A N/A N/A N/A N/A N/A N/A 4.9% Total Package Volume Growth 0.2% 1.6% 3.9% 8.5% 7.5% 7.8% 2.8% (1.4%)
Revenue Growth:U.S. Overnight Box 6.0% 1.8% (1.5%) (2.2%) (2.4%) (1.1%) 5.0% 4.4%U.S. Overnight Envelope 4.5% 1.9% (2.1%) (1.0%) 0.2% (1.8%) 4.2% 1.9% Total U.S. Overnight 5.7% 1.8% (1.6%) (1.9%) (1.8%) (1.3%) 4.8% 3.8%U.S. Deferred (E2, ES) 2.6% 2.1% (1.3%) 1.0% 0.9% 2.0% 8.0% 4.6% Total U.S. Packages 4.9% 1.9% (1.6%) (1.2%) (1.1%) (0.5%) 5.7% 4.0%International Priority (IP,IE) 1 14.1% 9.9% 7.3% 7.0% 9.3% 12.7% 18.3% 16.0%International Domestic 2 N/A N/A N/A N/A N/A N/A N/A 16.3% Total Package Revenue Growth 9.3% 6.1% 4.1% 5.0% 4.9% 6.9% 11.1% 8.8%
AVG POUNDS PER PACKAGE 7.1 7.3 7.4 7.5 7.6 7.9 7.6 7.6AVG REVENUE PER PACKAGE LB. $ 3.07 $ 3.02 $ 2.80 $ 2.77 $ 2.80 $ 2.75 $ 2.90 $ 3.07OPERATING WEEKDAYS 65 63 62 65 65 63 63 64
1 -
2 -
Unaudited. Differences may result due to rounding.
In FY07, we reclassified certain revenues previously included within International Priority package revenues in the table above that were international priority freight shipments to International Priority Freight to more precisely present the nature of the services provided. We have reclassified the amounts for FY07 to include these revenues within our Freight revenues.
International Domestic shipments are shipments where the origin and destination are both within the same non-U.S. country, including the United Kingdom, Canada, Indiaand China.
12 / Q1 FY09 Stat Book
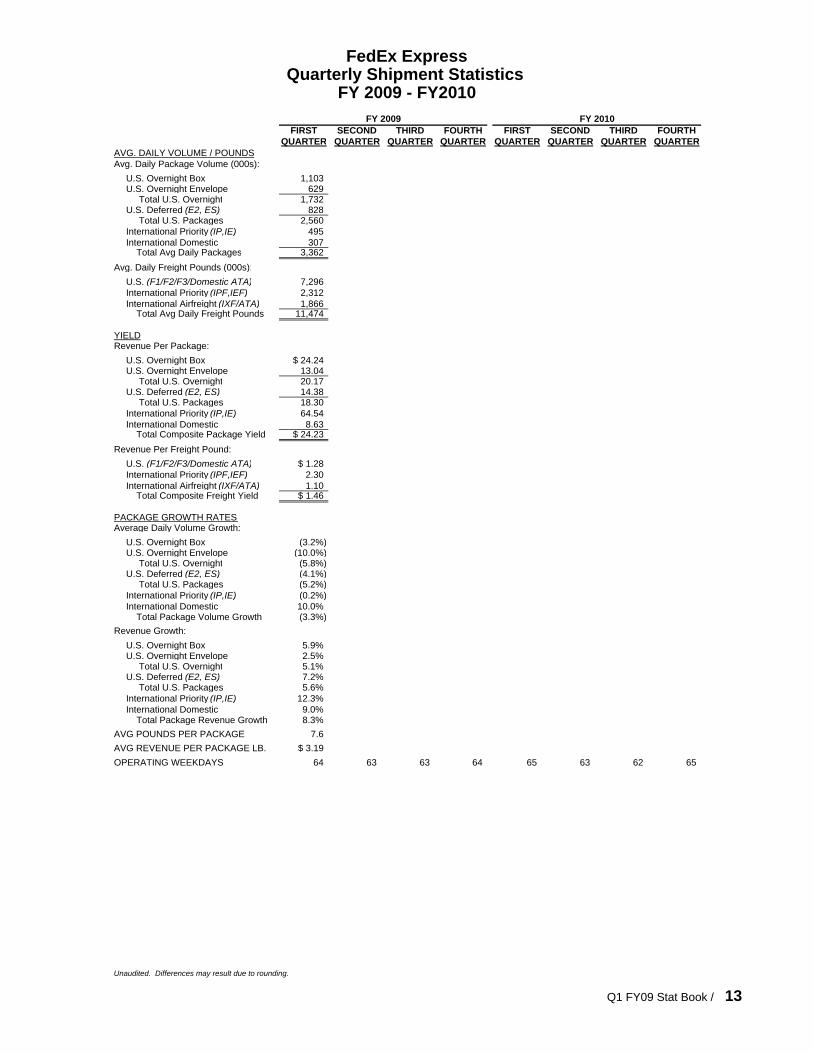
FedEx ExpressQuarterly Shipment Statistics
FY 2009 - FY2010FY 2009 FY 2010
FIRST SECOND THIRD FOURTH FIRST SECOND THIRD FOURTHQUARTER QUARTER QUARTER QUARTER QUARTER QUARTER QUARTER QUARTER
AVG. DAILY VOLUME / POUNDSAvg. Daily Package Volume (000s):
U.S. Overnight Box 1,103U.S. Overnight Envelope 629 Total U.S. Overnight 1,732U.S. Deferred (E2, ES) 828 Total U.S. Packages 2,560International Priority (IP,IE) 495International Domestic 307 Total Avg Daily Packages 3,362
Avg. Daily Freight Pounds (000s):U.S. (F1/F2/F3/Domestic ATA) 7,296International Priority (IPF,IEF) 2,312International Airfreight (IXF/ATA) 1,866 Total Avg Daily Freight Pounds 11,474
YIELDRevenue Per Package:
U.S. Overnight Box $ 24.24U.S. Overnight Envelope 13.04 Total U.S. Overnight 20.17U.S. Deferred (E2, ES) 14.38 Total U.S. Packages 18.30International Priority (IP,IE) 64.54International Domestic 8.63 Total Composite Package Yield $ 24.23
Revenue Per Freight Pound:U.S. (F1/F2/F3/Domestic ATA) $ 1.28International Priority (IPF,IEF) 2.30International Airfreight (IXF/ATA) 1.10 Total Composite Freight Yield $ 1.46
PACKAGE GROWTH RATESAverage Daily Volume Growth:
U.S. Overnight Box (3.2%)U.S. Overnight Envelope (10.0%) Total U.S. Overnight (5.8%)U.S. Deferred (E2, ES) (4.1%) Total U.S. Packages (5.2%)International Priority (IP,IE) (0.2%)International Domestic 10.0% Total Package Volume Growth (3.3%)
Revenue Growth:U.S. Overnight Box 5.9%U.S. Overnight Envelope 2.5% Total U.S. Overnight 5.1%U.S. Deferred (E2, ES) 7.2% Total U.S. Packages 5.6%International Priority (IP,IE) 12.3%International Domestic 9.0% Total Package Revenue Growth 8.3%
AVG POUNDS PER PACKAGE 7.6AVG REVENUE PER PACKAGE LB. $ 3.19OPERATING WEEKDAYS 64 63 63 64 65 63 62 65
Unaudited. Differences may result due to rounding.
Q1 FY09 Stat Book / 13
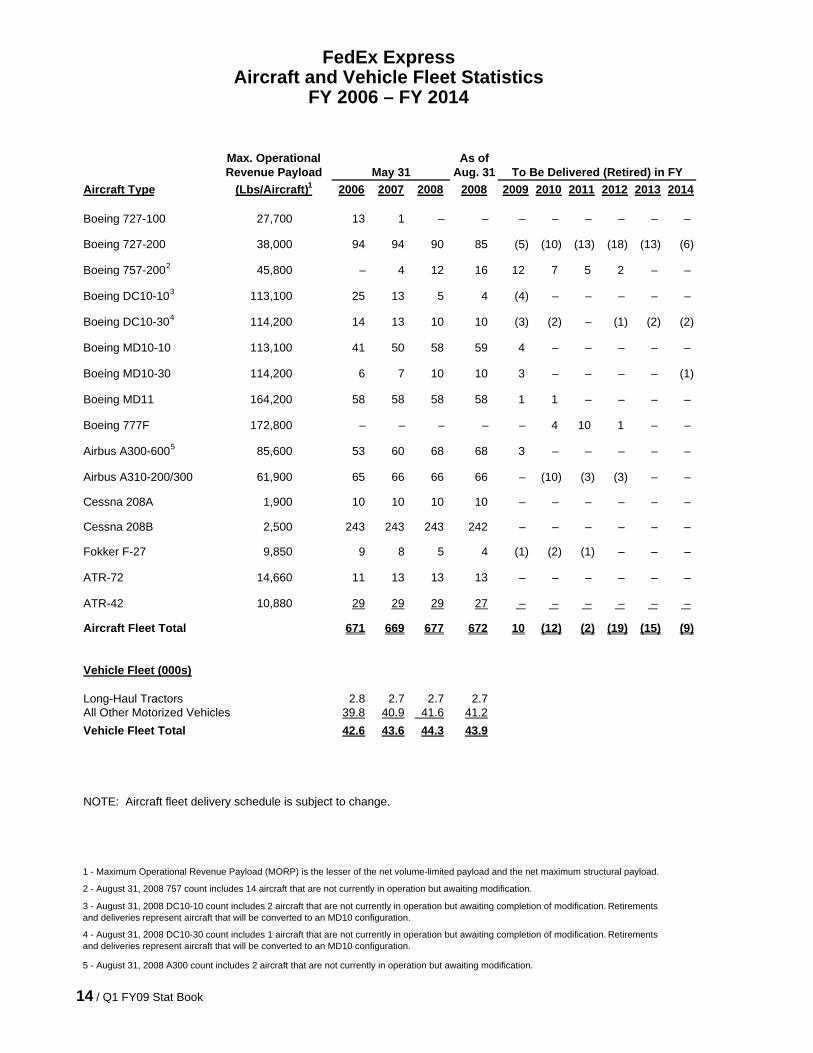
Max. Operational As ofRevenue Payload Aug. 31
Aircraft Type (Lbs/Aircraft)1 2006 2007 2008 2008 2009 2010 2011 2012 2013 2014
Boeing 727-100 27,700 13 1 – – – – – – – –
Boeing 727-200 38,000 94 94 90 85 (5) (10) (13) (18) (13) (6)
Boeing 757-2002 45,800 – 4 12 16 12 7 5 2 – –
Boeing DC10-103 113,100 25 13 5 4 (4) – – – – –
Boeing DC10-304 114,200 14 13 10 10 (3) (2) – (1) (2) (2)
Boeing MD10-10 113,100 41 50 58 59 4 – – – – –
Boeing MD10-30 114,200 6 7 10 10 3 – – – – (1)
Boeing MD11 164,200 58 58 58 58 1 1 – – – –
Boeing 777F 172,800 – – – – – 4 10 1 – –
Airbus A300-6005 85,600 53 60 68 68 3 – – – – –
Airbus A310-200/300 61,900 65 66 66 66 – (10) (3) (3) – –
Cessna 208A 1,900 10 10 10 10 – – – – – –
Cessna 208B 2,500 243 243 243 242 – – – – – –
Fokker F-27 9,850 9 8 5 4 (1) (2) (1) – – –
ATR-72 14,660 11 13 13 13 – – – – – –
ATR-42 10,880 29 29 29 27 – – – – – –
Aircraft Fleet Total 671 669 677 672 10 (12) (2) (19) (15) (9)
Vehicle Fleet (000s)
Long-Haul Tractors 2.8 2.7 2.7 2.7All Other Motorized Vehicles 39.8 40.9 41.6 41.2Vehicle Fleet Total 42.6 43.6 44.3 43.9
NOTE: Aircraft fleet delivery schedule is subject to change.
FedEx Express
FY 2006 – FY 2014
May 31 To Be Delivered (Retired) in FY
Aircraft and Vehicle Fleet Statistics
1 - Maximum Operational Revenue Payload (MORP) is the lesser of the net volume-limited payload and the net maximum structural payload.
4 - August 31, 2008 DC10-30 count includes 1 aircraft that are not currently in operation but awaiting completion of modification. Retirements and deliveries represent aircraft that will be converted to an MD10 configuration.
5 - August 31, 2008 A300 count includes 2 aircraft that are not currently in operation but awaiting modification.
2 - August 31, 2008 757 count includes 14 aircraft that are not currently in operation but awaiting modification.
3 - August 31, 2008 DC10-10 count includes 2 aircraft that are not currently in operation but awaiting completion of modification. Retirements and deliveries represent aircraft that will be converted to an MD10 configuration.
14 / Q1 FY09 Stat Book
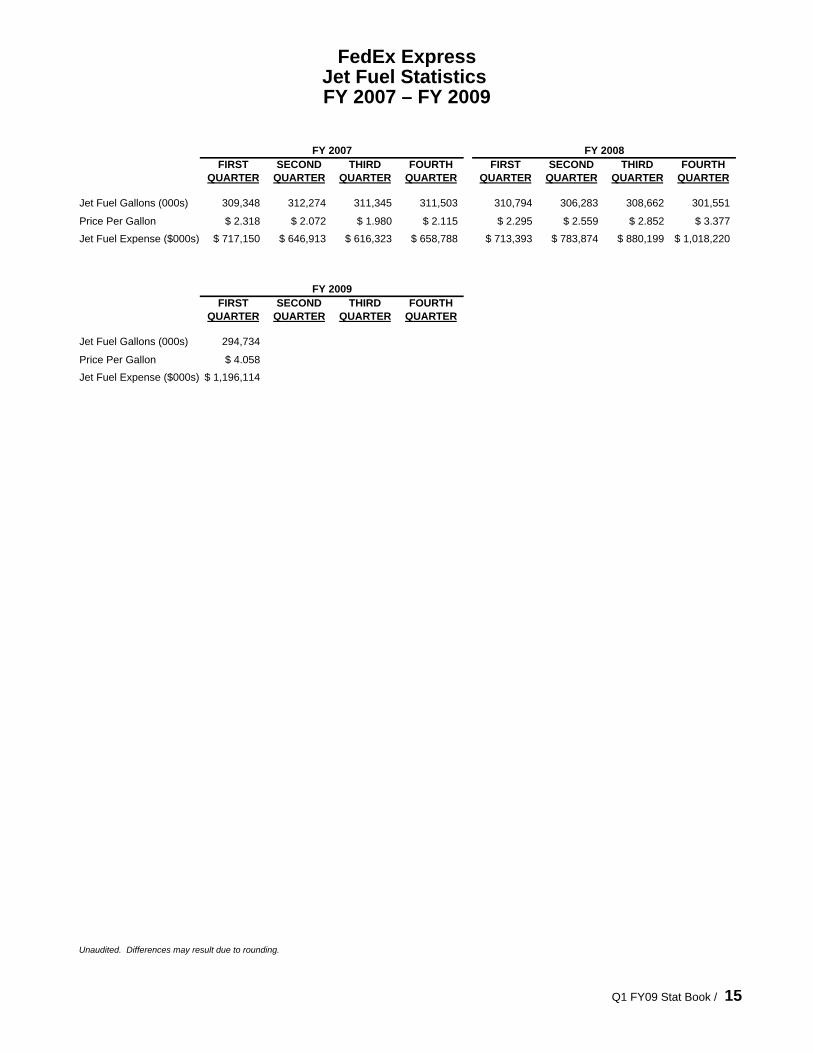
FedEx ExpressJet Fuel Statistics FY 2007 – FY 2009
FY 2007 FY 2008FIRST SECOND THIRD FOURTH FIRST SECOND THIRD FOURTH
QUARTER QUARTER QUARTER QUARTER QUARTER QUARTER QUARTER QUARTER
Jet Fuel Gallons (000s) 309,348 312,274 311,345 311,503 310,794 306,283 308,662 301,551
Price Per Gallon $ 2.318 $ 2.072 $ 1.980 $ 2.115 $ 2.295 $ 2.559 $ 2.852 $ 3.377
Jet Fuel Expense ($000s) $ 717,150 $ 646,913 $ 616,323 $ 658,788 $ 713,393 $ 783,874 $ 880,199 $ 1,018,220
FY 2009FIRST SECOND THIRD FOURTH
QUARTER QUARTER QUARTER QUARTER
Jet Fuel Gallons (000s) 294,734
Price Per Gallon $ 4.058
Jet Fuel Expense ($000s) $ 1,196,114
Unaudited. Differences may result due to rounding.
Q1 FY09 Stat Book / 15
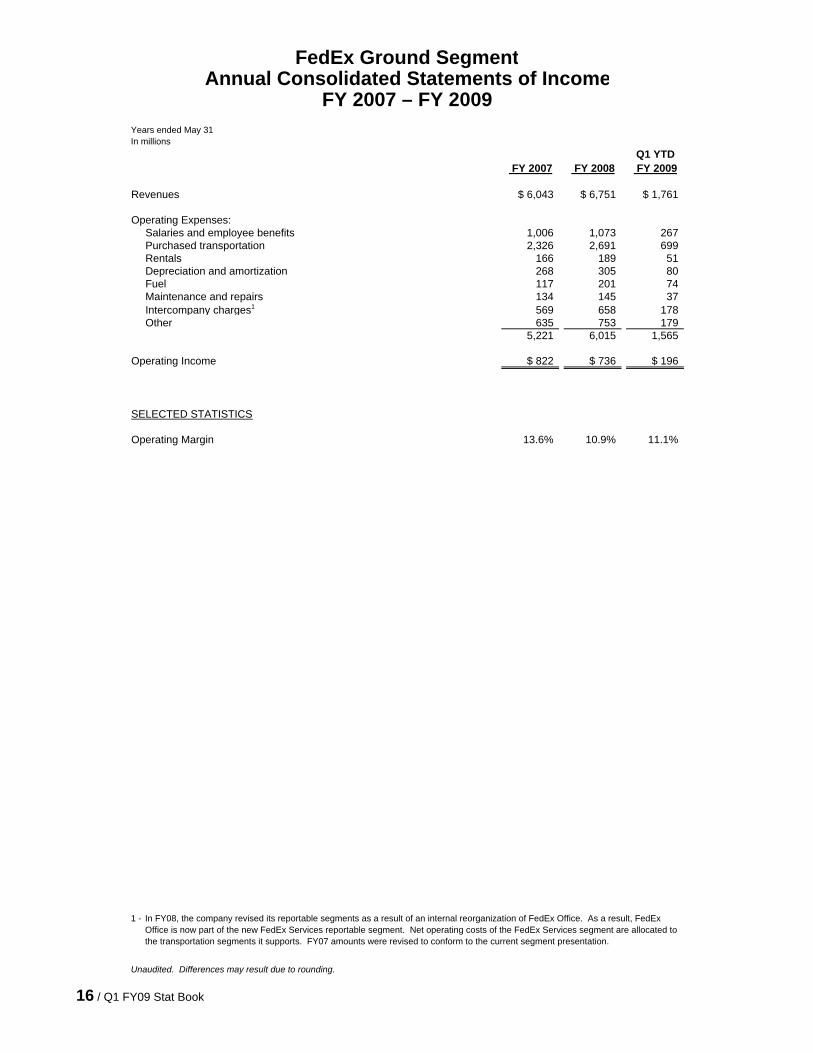
Years ended May 31In millions
Q1 YTD FY 2007 FY 2008 FY 2009
Revenues $ 6,043 $ 6,751 $ 1,761
Operating Expenses:Salaries and employee benefits 1,006 1,073 267Purchased transportation 2,326 2,691 699Rentals 166 189 51Depreciation and amortization 268 305 80Fuel 117 201 74Maintenance and repairs 134 145 37Intercompany charges1 569 658 178Other 635 753 179
5,221 6,015 1,565
Operating Income $ 822 $ 736 $ 196
SELECTED STATISTICS
Operating Margin 13.6% 10.9% 11.1%
1 -
Unaudited. Differences may result due to rounding.
In FY08, the company revised its reportable segments as a result of an internal reorganization of FedEx Office. As a result, FedEx Office is now part of the new FedEx Services reportable segment. Net operating costs of the FedEx Services segment are allocated to the transportation segments it supports. FY07 amounts were revised to conform to the current segment presentation.
FedEx Ground SegmentAnnual Consolidated Statements of Income
FY 2007 – FY 2009
16 / Q1 FY09 Stat Book
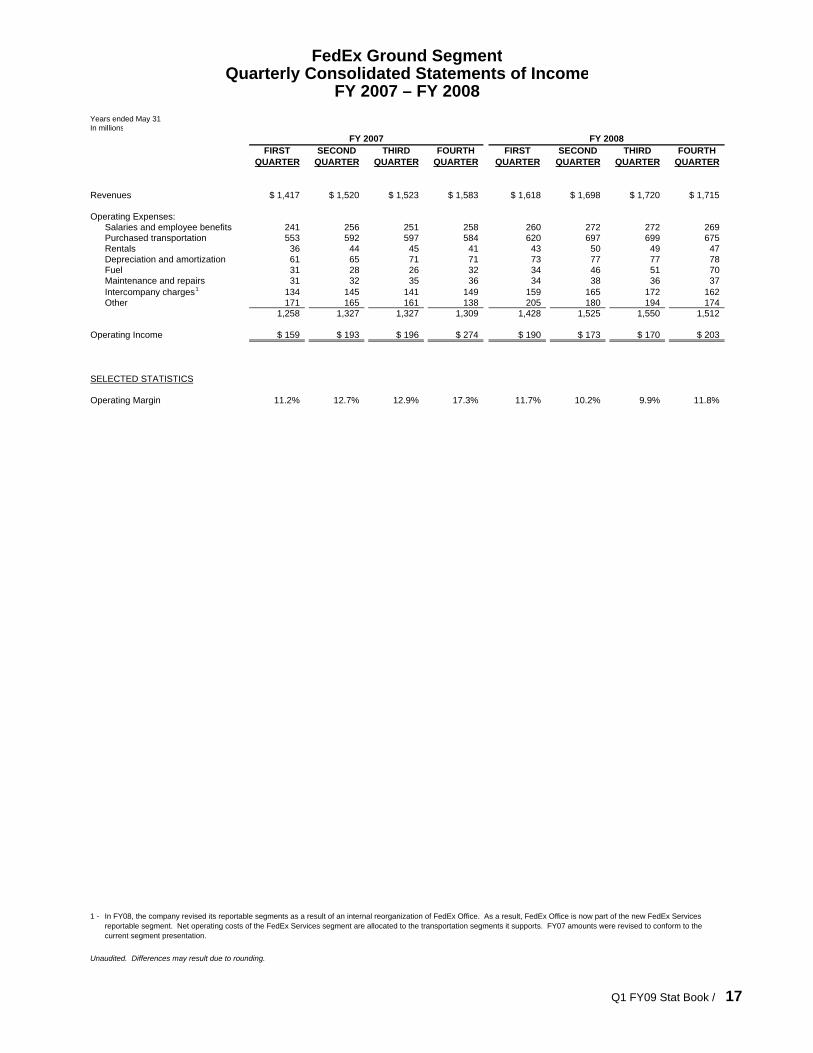
FedEx Ground SegmentQuarterly Consolidated Statements of Income
FY 2007 – FY 2008Years ended May 31In millions
FY 2007 FY 2008FIRST SECOND THIRD FOURTH FIRST SECOND THIRD FOURTH
QUARTER QUARTER QUARTER QUARTER QUARTER QUARTER QUARTER QUARTER
Revenues $ 1,417 $ 1,520 $ 1,523 $ 1,583 $ 1,618 $ 1,698 $ 1,720 $ 1,715
Operating Expenses:Salaries and employee benefits 241 256 251 258 260 272 272 269Purchased transportation 553 592 597 584 620 697 699 675Rentals 36 44 45 41 43 50 49 47Depreciation and amortization 61 65 71 71 73 77 77 78Fuel 31 28 26 32 34 46 51 70Maintenance and repairs 31 32 35 36 34 38 36 37Intercompany charges1 134 145 141 149 159 165 172 162Other 171 165 161 138 205 180 194 174
1,258 1,327 1,327 1,309 1,428 1,525 1,550 1,512
Operating Income $ 159 $ 193 $ 196 $ 274 $ 190 $ 173 $ 170 $ 203
SELECTED STATISTICS
Operating Margin 11.2% 12.7% 12.9% 17.3% 11.7% 10.2% 9.9% 11.8%
1 -
Unaudited. Differences may result due to rounding.
In FY08, the company revised its reportable segments as a result of an internal reorganization of FedEx Office. As a result, FedEx Office is now part of the new FedEx Services reportable segment. Net operating costs of the FedEx Services segment are allocated to the transportation segments it supports. FY07 amounts were revised to conform to the current segment presentation.
Q1 FY09 Stat Book / 17
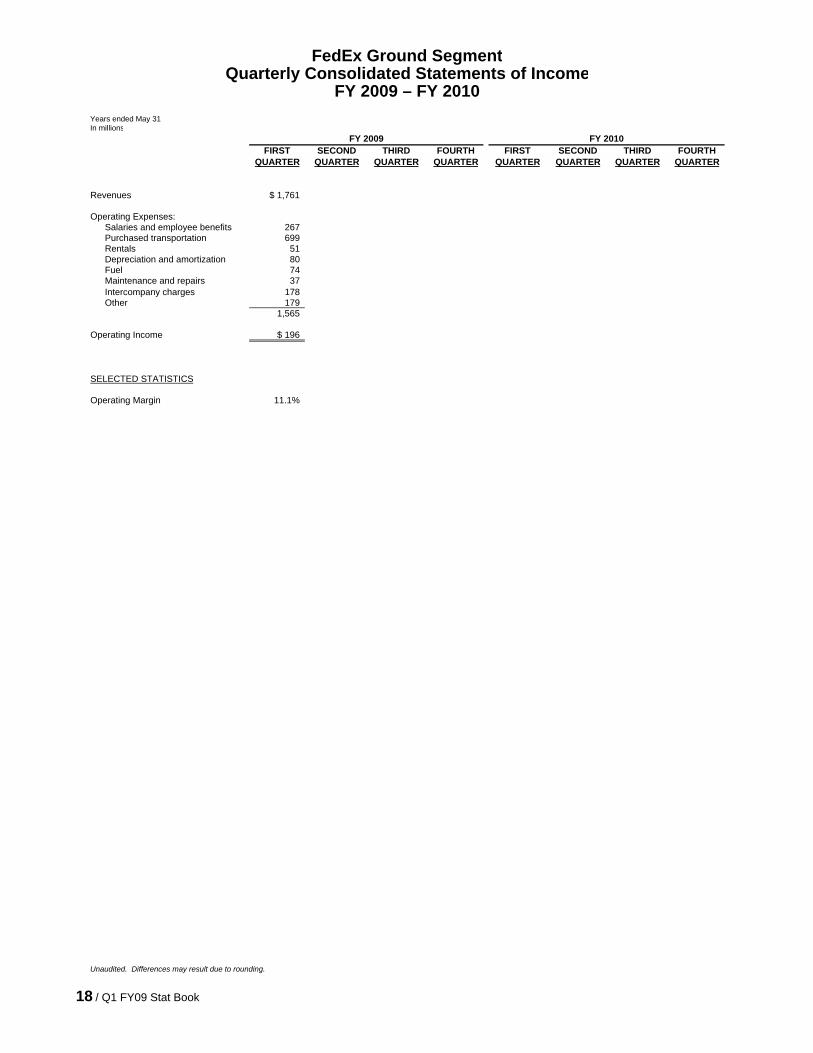
FedEx Ground SegmentQuarterly Consolidated Statements of Income
FY 2009 – FY 2010Years ended May 31In millions
FY 2009 FY 2010FIRST SECOND THIRD FOURTH FIRST SECOND THIRD FOURTH
QUARTER QUARTER QUARTER QUARTER QUARTER QUARTER QUARTER QUARTER
Revenues $ 1,761
Operating Expenses:Salaries and employee benefits 267Purchased transportation 699Rentals 51Depreciation and amortization 80Fuel 74Maintenance and repairs 37Intercompany charges 178Other 179
1,565
Operating Income $ 196
SELECTED STATISTICS
Operating Margin 11.1%
Unaudited. Differences may result due to rounding.
18 / Q1 FY09 Stat Book
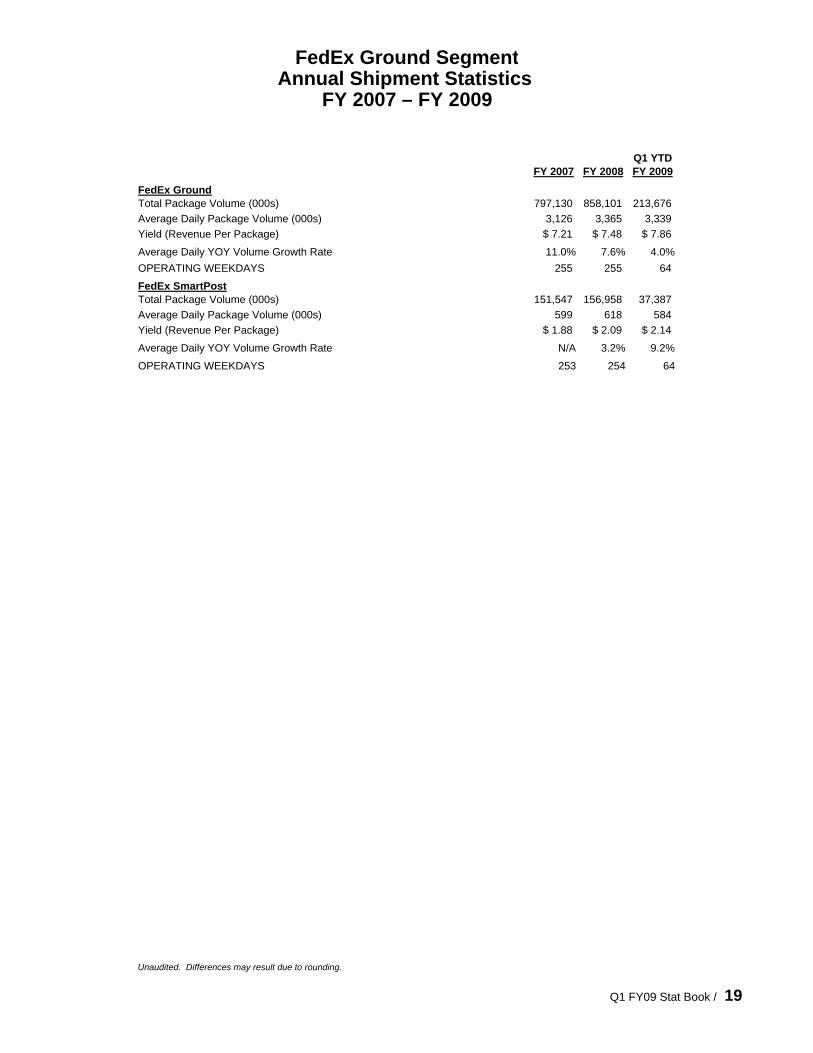
FedEx Ground SegmentAnnual Shipment Statistics
FY 2007 – FY 2009
Q1 YTDFY 2007 FY 2008 FY 2009
FedEx GroundTotal Package Volume (000s) 797,130 858,101 213,676Average Daily Package Volume (000s) 3,126 3,365 3,339Yield (Revenue Per Package) $ 7.21 $ 7.48 $ 7.86
Average Daily YOY Volume Growth Rate 11.0% 7.6% 4.0%OPERATING WEEKDAYS 255 255 64
FedEx SmartPostTotal Package Volume (000s) 151,547 156,958 37,387Average Daily Package Volume (000s) 599 618 584Yield (Revenue Per Package) $ 1.88 $ 2.09 $ 2.14
Average Daily YOY Volume Growth Rate N/A 3.2% 9.2%
OPERATING WEEKDAYS 253 254 64
Unaudited. Differences may result due to rounding.
Q1 FY09 Stat Book / 19
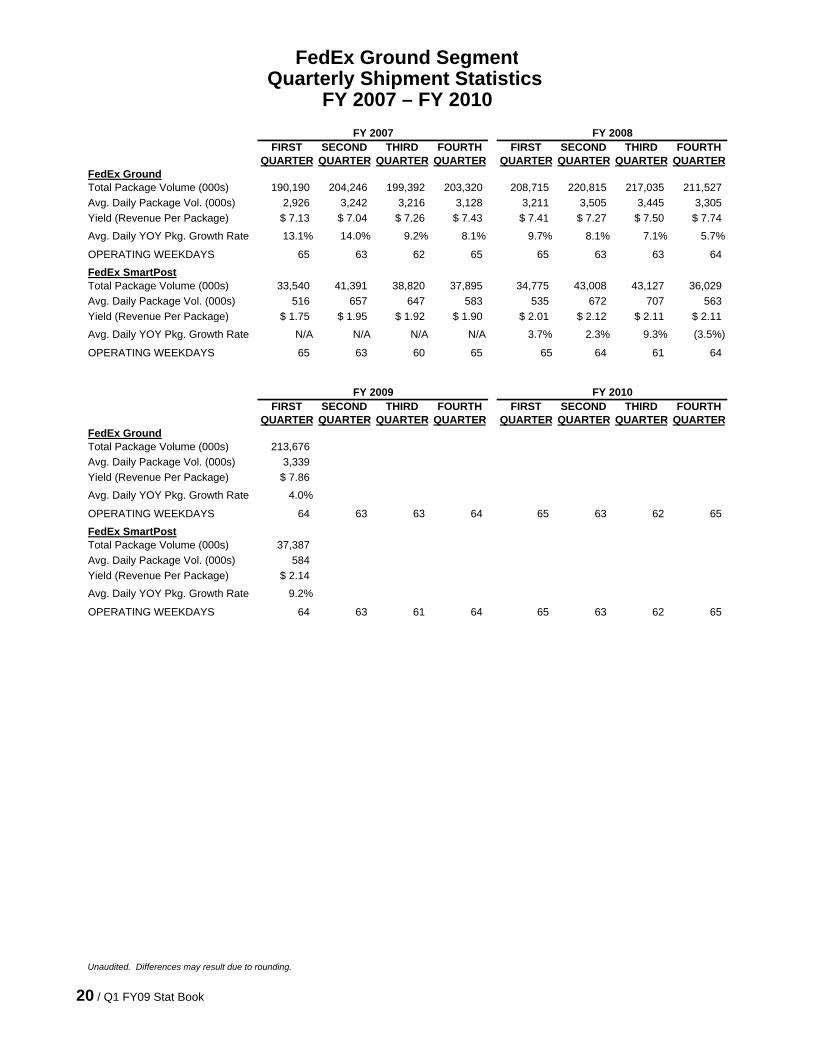
FedEx Ground SegmentQuarterly Shipment Statistics
FY 2007 – FY 2010FY 2007 FY 2008
FIRST SECOND THIRD FOURTH FIRST SECOND THIRD FOURTHQUARTER QUARTER QUARTER QUARTER QUARTER QUARTER QUARTER QUARTER
FedEx GroundTotal Package Volume (000s) 190,190 204,246 199,392 203,320 208,715 220,815 217,035 211,527Avg. Daily Package Vol. (000s) 2,926 3,242 3,216 3,128 3,211 3,505 3,445 3,305Yield (Revenue Per Package) $ 7.13 $ 7.04 $ 7.26 $ 7.43 $ 7.41 $ 7.27 $ 7.50 $ 7.74
Avg. Daily YOY Pkg. Growth Rate 13.1% 14.0% 9.2% 8.1% 9.7% 8.1% 7.1% 5.7%
OPERATING WEEKDAYS 65 63 62 65 65 63 63 64
FedEx SmartPostTotal Package Volume (000s) 33,540 41,391 38,820 37,895 34,775 43,008 43,127 36,029Avg. Daily Package Vol. (000s) 516 657 647 583 535 672 707 563Yield (Revenue Per Package) $ 1.75 $ 1.95 $ 1.92 $ 1.90 $ 2.01 $ 2.12 $ 2.11 $ 2.11
Avg. Daily YOY Pkg. Growth Rate N/A N/A N/A N/A 3.7% 2.3% 9.3% (3.5%)
OPERATING WEEKDAYS 65 63 60 65 65 64 61 64
FY 2009 FY 2010FIRST SECOND THIRD FOURTH FIRST SECOND THIRD FOURTH
QUARTER QUARTER QUARTER QUARTER QUARTER QUARTER QUARTER QUARTERFedEx GroundTotal Package Volume (000s) 213,676Avg. Daily Package Vol. (000s) 3,339Yield (Revenue Per Package) $ 7.86
Avg. Daily YOY Pkg. Growth Rate 4.0%
OPERATING WEEKDAYS 64 63 63 64 65 63 62 65
FedEx SmartPostTotal Package Volume (000s) 37,387Avg. Daily Package Vol. (000s) 584Yield (Revenue Per Package) $ 2.14
Avg. Daily YOY Pkg. Growth Rate 9.2%
OPERATING WEEKDAYS 64 63 61 64 65 63 62 65
Unaudited. Differences may result due to rounding.
20 / Q1 FY09 Stat Book
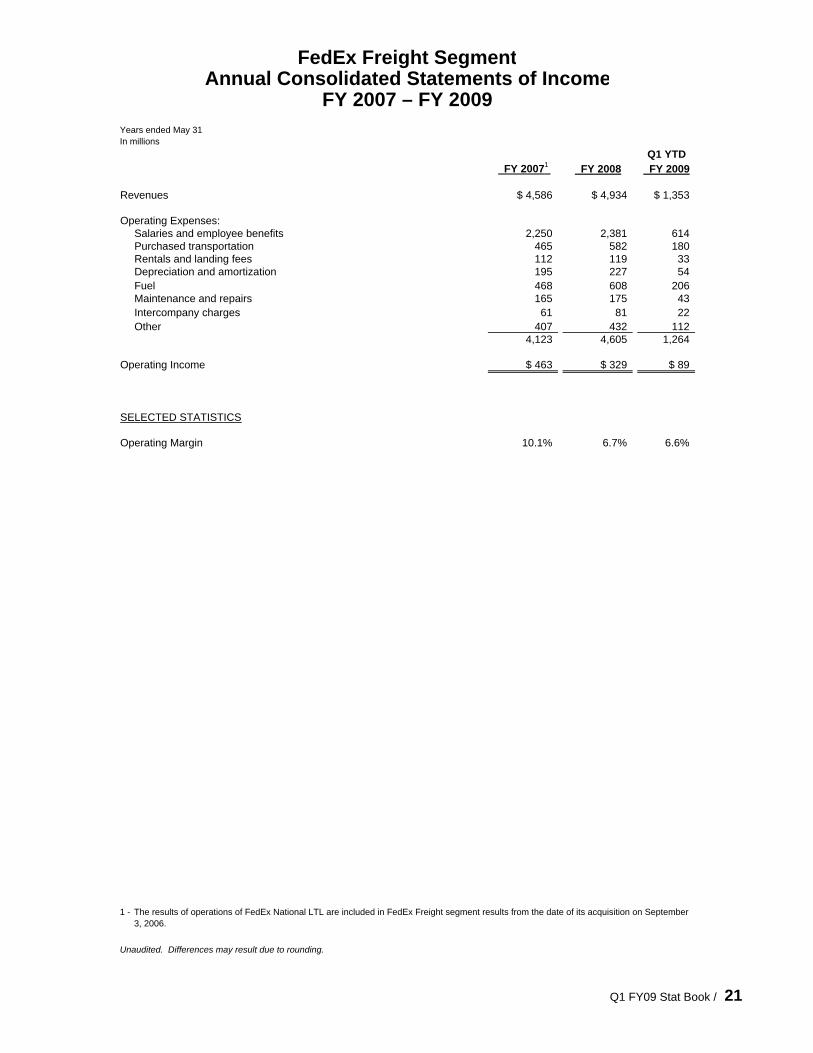
Years ended May 31In millions
Q1 YTD FY 20071 FY 2008 FY 2009
Revenues $ 4,586 $ 4,934 $ 1,353
Operating Expenses:Salaries and employee benefits 2,250 2,381 614Purchased transportation 465 582 180Rentals and landing fees 112 119 33Depreciation and amortization 195 227 54Fuel 468 608 206Maintenance and repairs 165 175 43Intercompany charges 61 81 22Other 407 432 112
4,123 4,605 1,264
Operating Income $ 463 $ 329 $ 89
SELECTED STATISTICS
Operating Margin 10.1% 6.7% 6.6%
1 -
Unaudited. Differences may result due to rounding.
The results of operations of FedEx National LTL are included in FedEx Freight segment results from the date of its acquisition on September 3, 2006.
FedEx Freight SegmentAnnual Consolidated Statements of Income
FY 2007 – FY 2009
Q1 FY09 Stat Book / 21
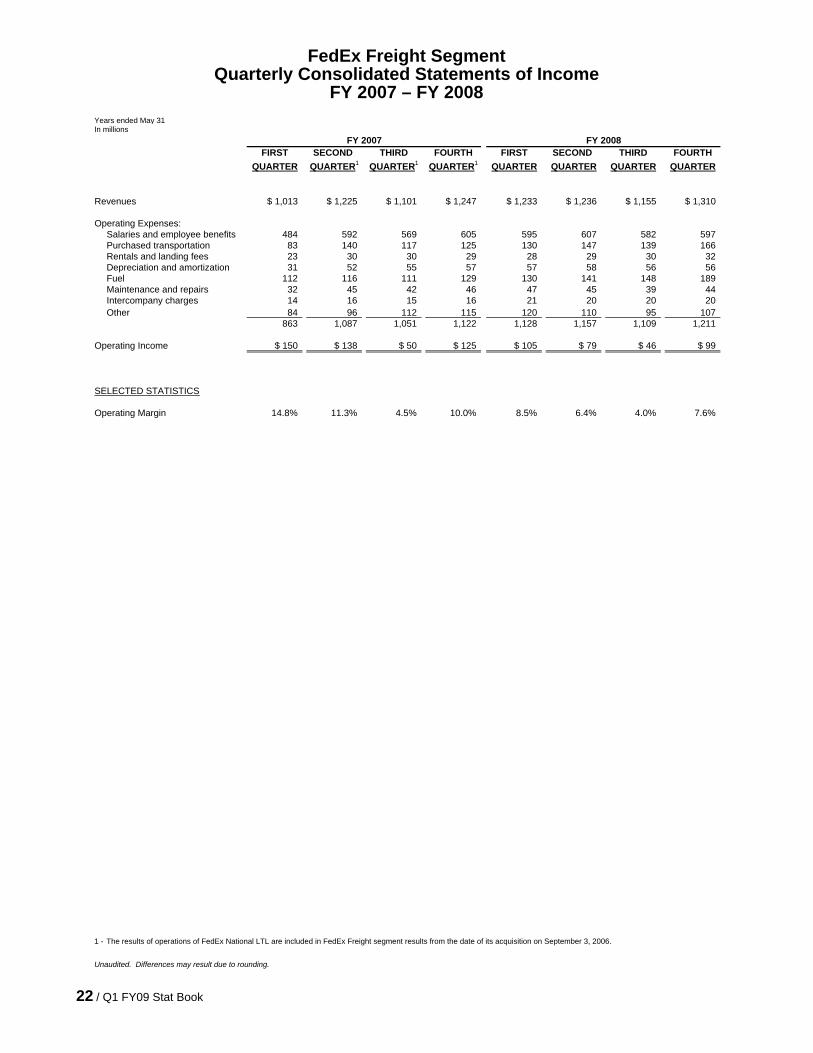
FedEx Freight SegmentQuarterly Consolidated Statements of Income
FY 2007 – FY 2008Years ended May 31In millions
FY 2007 FY 2008FIRST SECOND THIRD FOURTH FIRST SECOND THIRD FOURTH
QUARTER QUARTER1 QUARTER1 QUARTER1 QUARTER QUARTER QUARTER QUARTER
Revenues $ 1,013 $ 1,225 $ 1,101 $ 1,247 $ 1,233 $ 1,236 $ 1,155 $ 1,310
Operating Expenses:Salaries and employee benefits 484 592 569 605 595 607 582 597Purchased transportation 83 140 117 125 130 147 139 166Rentals and landing fees 23 30 30 29 28 29 30 32Depreciation and amortization 31 52 55 57 57 58 56 56Fuel 112 116 111 129 130 141 148 189Maintenance and repairs 32 45 42 46 47 45 39 44Intercompany charges 14 16 15 16 21 20 20 20Other 84 96 112 115 120 110 95 107
863 1,087 1,051 1,122 1,128 1,157 1,109 1,211
Operating Income $ 150 $ 138 $ 50 $ 125 $ 105 $ 79 $ 46 $ 99
SELECTED STATISTICS
Operating Margin 14.8% 11.3% 4.5% 10.0% 8.5% 6.4% 4.0% 7.6%
1 -
Unaudited. Differences may result due to rounding.
The results of operations of FedEx National LTL are included in FedEx Freight segment results from the date of its acquisition on September 3, 2006.
22 / Q1 FY09 Stat Book
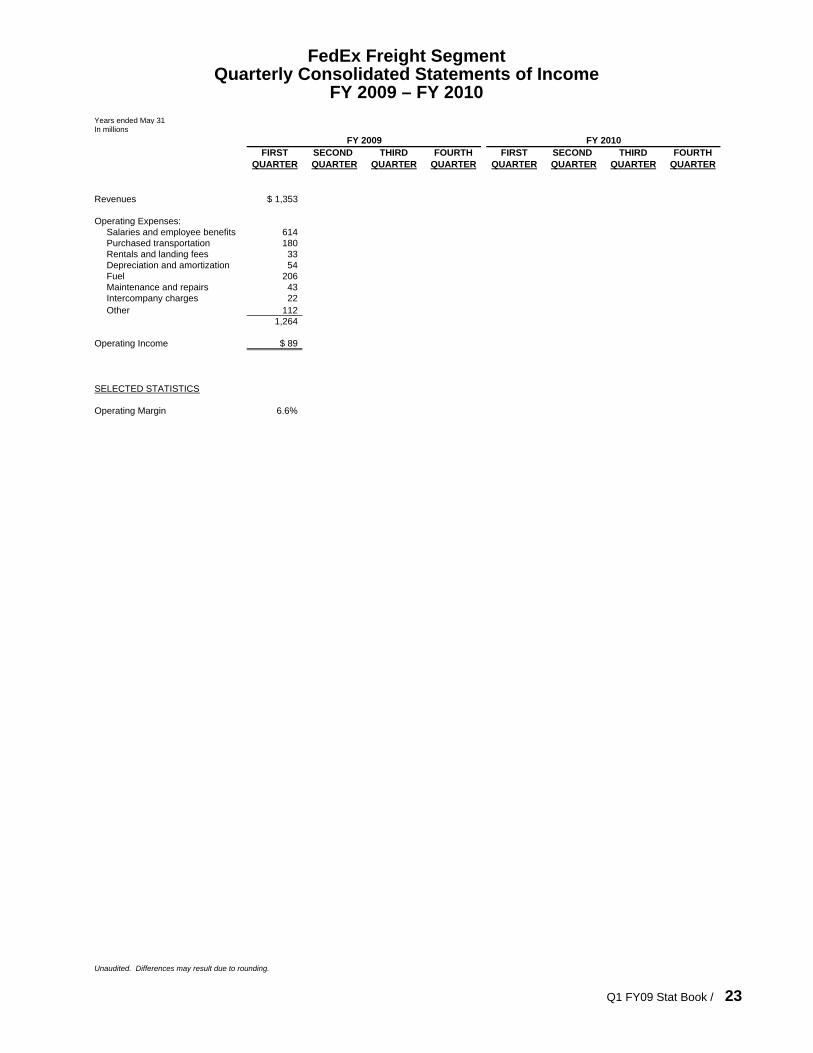
FedEx Freight SegmentQuarterly Consolidated Statements of Income
FY 2009 – FY 2010Years ended May 31In millions
FY 2009 FY 2010FIRST SECOND THIRD FOURTH FIRST SECOND THIRD FOURTH
QUARTER QUARTER QUARTER QUARTER QUARTER QUARTER QUARTER QUARTER
Revenues $ 1,353
Operating Expenses:Salaries and employee benefits 614Purchased transportation 180Rentals and landing fees 33Depreciation and amortization 54Fuel 206Maintenance and repairs 43Intercompany charges 22Other 112
1,264
Operating Income $ 89
SELECTED STATISTICS
Operating Margin 6.6%
Unaudited. Differences may result due to rounding.
Q1 FY09 Stat Book / 23
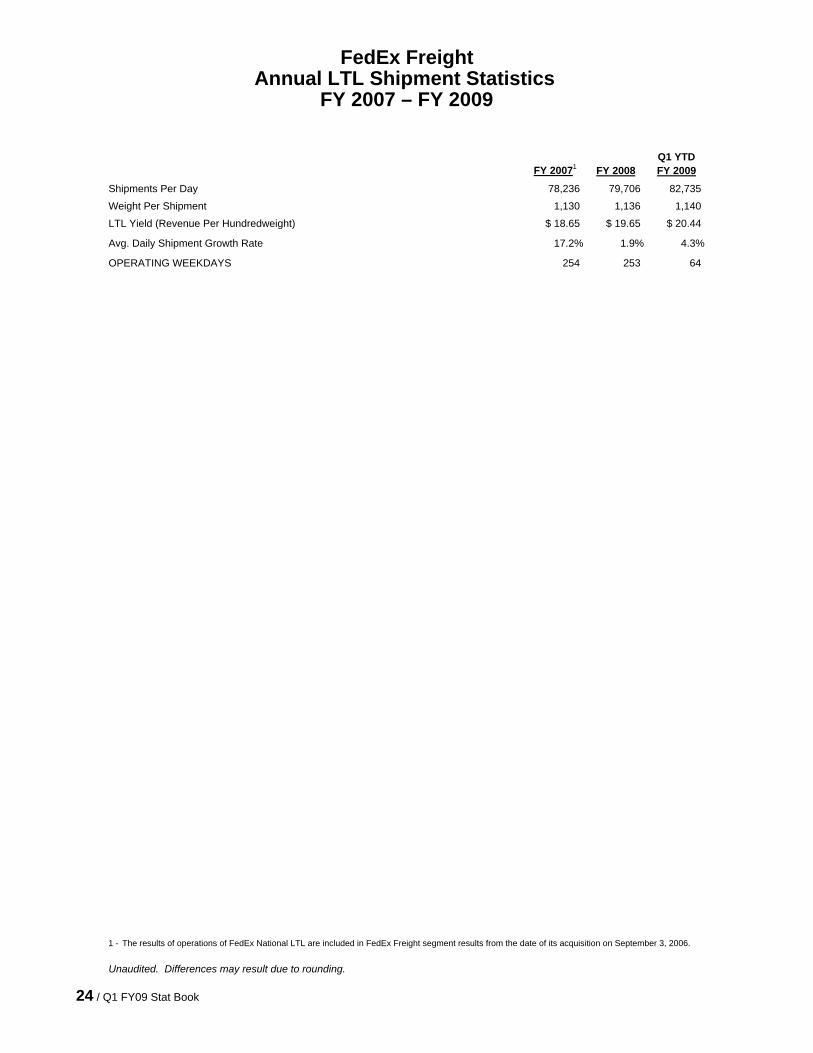
FedEx FreightAnnual LTL Shipment Statistics
FY 2007 – FY 2009
Q1 YTDFY 20071 FY 2008 FY 2009
Shipments Per Day 78,236 79,706 82,735
Weight Per Shipment 1,130 1,136 1,140
LTL Yield (Revenue Per Hundredweight) $ 18.65 $ 19.65 $ 20.44
Avg. Daily Shipment Growth Rate 17.2% 1.9% 4.3%
OPERATING WEEKDAYS 254 253 64
1 -
Unaudited. Differences may result due to rounding.
The results of operations of FedEx National LTL are included in FedEx Freight segment results from the date of its acquisition on September 3, 2006.
24 / Q1 FY09 Stat Book
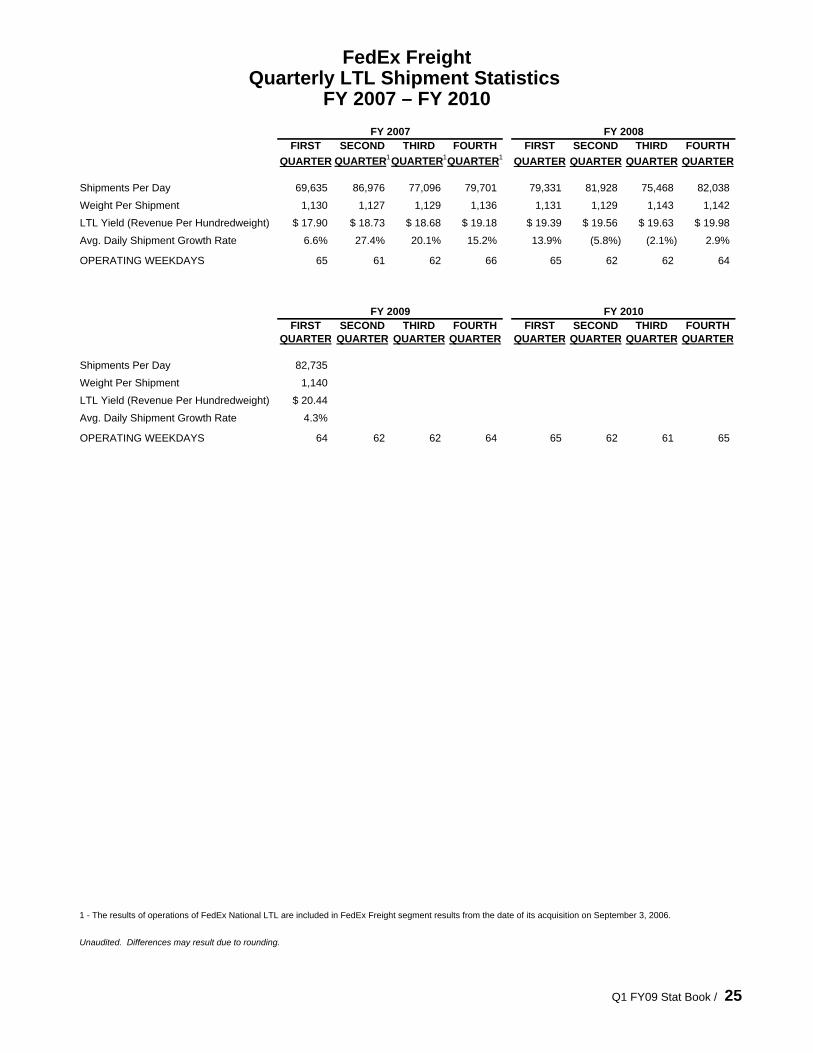
FedEx FreightQuarterly LTL Shipment Statistics
FY 2007 – FY 2010FY 2007 FY 2008
FIRST SECOND THIRD FOURTH FIRST SECOND THIRD FOURTHQUARTER QUARTER1QUARTER1QUARTER1 QUARTER QUARTER QUARTER QUARTER
Shipments Per Day 69,635 86,976 77,096 79,701 79,331 81,928 75,468 82,038
Weight Per Shipment 1,130 1,127 1,129 1,136 1,131 1,129 1,143 1,142
LTL Yield (Revenue Per Hundredweight) $ 17.90 $ 18.73 $ 18.68 $ 19.18 $ 19.39 $ 19.56 $ 19.63 $ 19.98
Avg. Daily Shipment Growth Rate 6.6% 27.4% 20.1% 15.2% 13.9% (5.8%) (2.1%) 2.9%
OPERATING WEEKDAYS 65 61 62 66 65 62 62 64
FY 2009 FY 2010FIRST SECOND THIRD FOURTH FIRST SECOND THIRD FOURTH
QUARTER QUARTER QUARTER QUARTER QUARTER QUARTER QUARTER QUARTER
Shipments Per Day 82,735
Weight Per Shipment 1,140
LTL Yield (Revenue Per Hundredweight) $ 20.44
Avg. Daily Shipment Growth Rate 4.3%
OPERATING WEEKDAYS 64 62 62 64 65 62 61 65
1 - The results of operations of FedEx National LTL are included in FedEx Freight segment results from the date of its acquisition on September 3, 2006.
Unaudited. Differences may result due to rounding.
Q1 FY09 Stat Book / 25