Q1 2021 Highlights
11
Roku Q1 2021 Shareholder Letter 1 May 6, 2021 Fellow Shareholders, Roku delivered an exceptional first quarter led by strong growth in advertising and the expansion of content distribution partnerships. We generated record revenue and gross profit growth, as well as record Adjusted EBITDA. More broadly, the overall secular shift to streaming continues, and Roku benefits as a result of our leading technology and scale. OneView®, our ad platform built for TV streaming, connects brands, performance advertisers, and our content partners with their target audience. The Roku Channel continues to perform well, as it provides easy access to content with broad appeal, which attracts viewers, which attracts advertising spend, which in turn enables reinvestment in more content. And our hardware and operating system deliver a best-in-class user experience. Q1 2021 Highlights • Total net revenue grew 79% year-over-year (YoY) to $574.2 million; • Platform revenue increased 101% YoY to $466.5 million; • Gross profit was up 132% YoY to $326.8 million; • Roku added 2.4 million incremental Active Accounts in Q1 2021 to reach 53.6 million; • Streaming Hours increased by 1.4 billion hours over last quarter to 18.3 billion; • Average Revenue Per User (ARPU) grew to $32.14 (trailing 12-month basis), up 32% YoY; • Raised approximately $1 billion through an At-The-Market (ATM) stock offering Key Operating Metrics Q1 20 Q2 20 Q3 20 Q4 20 Q1 21 YoY % Active Accounts (millions) 39.8 43.0 46.0 51.2 53.6 35 % Streaming Hours (billions)* 12.3 14.6 14.8 17.0 18.3 49 % ARPU ($) $ 24.35 $ 24.92 $ 27.00 $ 28.76 $ 32.14 32 % Summary Financials ($ in millions) Q1 20 Q2 20 Q3 20 Q4 20 Q1 21 YoY % Platform revenue $ 232.6 $ 244.8 $ 319.2 $ 471.2 $ 466.5 101 % Player revenue 88.2 111.3 132.4 178.7 107.7 22 % Total net revenue 320.8 356.1 451.7 649.9 574.2 79 % Platform gross profit 130.6 138.5 194.7 300.8 311.9 139 % Player gross profit 10.5 8.4 20.2 4.6 14.8 42 % Total gross profit 141.1 146.8 214.8 305.5 326.8 132 % Platform gross margin % 56.2 % 56.6 % 61.0 % 63.8 % 66.9 % 1070 bps Player gross margin % 11.9 % 7.5 % 15.2 % 2.6 % 13.8 % 190 bps Total gross margin % 44.0 % 41.2 % 47.6 % 47.0 % 56.9 % 1290 bps Research and development 88.3 84.4 88.4 94.7 101.6 15 % Sales and marketing 68.2 64.2 71.0 96.1 88.9 30 % General and administrative 39.7 40.5 43.5 49.5 60.5 52 % Total operating expenses 196.3 189.0 202.9 240.3 251.0 28 % Income (loss) from operations (55.2 ) (42.2 ) 12.0 65.2 75.8 nm Adjusted EBITDA 1 (16.3 ) (3.4 ) 56.2 113.5 125.9 nm Adjusted EBITDA margin % -5.1 % -1.0 % 12.4 % 17.5 % 21.9 % nm Outlook ($ in millions) Q2 2021E Total net revenue $610 - $620 Total gross profit $295 - $305 Net Income (loss) $10 - $20 Adjusted EBITDA 2 $60 - $70 1 Refer to the reconciliation of net income to adjusted EBITDA in the non-GAAP information in an appendix to this letter. 2 Q2 2021E reconciling items between net income and non-GAAP adjusted EBITDA consist of stock-based compensation of approximately $39 million, depreciation and amortization and other net adjustments of approximately $12 million. _________________________________________ * Reported streaming hours data reflects previously disclosed adjustments to our streaming hours calculations for periods prior to Q4 2020.
Transcript of Q1 2021 Highlights

Roku Q1 2021 Shareholder Letter 1
May 6, 2021 Fellow Shareholders, Roku delivered an exceptional first quarter led by strong growth in advertising and the expansion of content distribution partnerships. We generated record revenue and gross profit growth, as well as record Adjusted EBITDA. More broadly, the overall secular shift to streaming continues, and Roku benefits as a result of our leading technology and scale. OneView®, our ad platform built for TV streaming, connects brands, performance advertisers, and our content partners with their target audience. The Roku Channel continues to perform well, as it provides easy access to content with broad appeal, which attracts viewers, which attracts advertising spend, which in turn enables reinvestment in more content. And our hardware and operating system deliver a best-in-class user experience. Q1 2021 Highlights
• Total net revenue grew 79% year-over-year (YoY) to $574.2 million; • Platform revenue increased 101% YoY to $466.5 million; • Gross profit was up 132% YoY to $326.8 million; • Roku added 2.4 million incremental Active Accounts in Q1 2021 to reach 53.6 million; • Streaming Hours increased by 1.4 billion hours over last quarter to 18.3 billion; • Average Revenue Per User (ARPU) grew to $32.14 (trailing 12-month basis), up 32% YoY; • Raised approximately $1 billion through an At-The-Market (ATM) stock offering
Key Operating Metrics Q1 20 Q2 20 Q3 20 Q4 20 Q1 21 YoY % Active Accounts (millions) 39.8 43.0 46.0 51.2 53.6 35 % Streaming Hours (billions)* 12.3 14.6 14.8 17.0 18.3 49 % ARPU ($) $ 24.35 $ 24.92 $ 27.00 $ 28.76 $ 32.14 32 % Summary Financials ($ in millions) Q1 20 Q2 20 Q3 20 Q4 20 Q1 21 YoY %
Platform revenue $ 232.6 $ 244.8 $ 319.2 $ 471.2 $ 466.5 101 % Player revenue 88.2 111.3 132.4 178.7 107.7 22 %
Total net revenue 320.8 356.1 451.7 649.9 574.2 79 % Platform gross profit 130.6 138.5 194.7 300.8 311.9 139 % Player gross profit 10.5 8.4 20.2 4.6 14.8 42 %
Total gross profit 141.1 146.8 214.8 305.5 326.8 132 % Platform gross margin % 56.2 % 56.6 % 61.0 % 63.8 % 66.9 % 1070 bps Player gross margin % 11.9 % 7.5 % 15.2 % 2.6 % 13.8 % 190 bps
Total gross margin % 44.0 % 41.2 % 47.6 % 47.0 % 56.9 % 1290 bps Research and development 88.3 84.4 88.4 94.7 101.6 15 % Sales and marketing 68.2 64.2 71.0 96.1 88.9 30 % General and administrative 39.7 40.5 43.5 49.5 60.5 52 %
Total operating expenses 196.3 189.0 202.9 240.3 251.0 28 % Income (loss) from operations (55.2 ) (42.2 ) 12.0 65.2 75.8 nm Adjusted EBITDA 1 (16.3 ) (3.4 ) 56.2 113.5 125.9 nm Adjusted EBITDA margin % -5.1 % -1.0 % 12.4 % 17.5 % 21.9 % nm Outlook ($ in millions) Q2 2021E Total net revenue $610 - $620 Total gross profit $295 - $305 Net Income (loss) $10 - $20 Adjusted EBITDA 2 $60 - $70 1 Refer to the reconciliation of net income to adjusted EBITDA in the non-GAAP information in an appendix to this letter. 2 Q2 2021E reconciling items between net income and non-GAAP adjusted EBITDA consist of stock-based compensation of approximately $39 million, depreciation and amortization and other net adjustments of approximately $12 million. _________________________________________ * Reported streaming hours data reflects previously disclosed adjustments to our streaming hours calculations for periods prior to Q4 2020.
Roku Q1 2021 Shareholder Letter 2
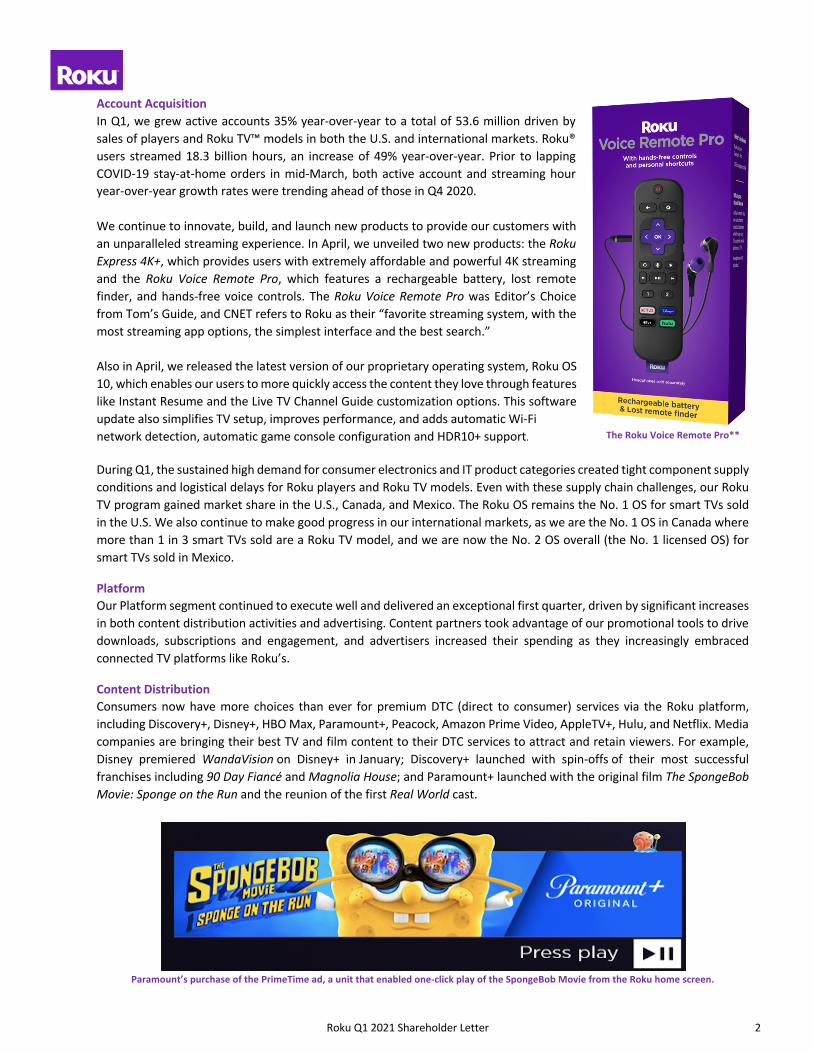
Account Acquisition In Q1, we grew active accounts 35% year-over-year to a total of 53.6 million driven by sales of players and Roku TV™ models in both the U.S. and international markets. Roku® users streamed 18.3 billion hours, an increase of 49% year-over-year. Prior to lapping COVID-19 stay-at-home orders in mid-March, both active account and streaming hour year-over-year growth rates were trending ahead of those in Q4 2020. We continue to innovate, build, and launch new products to provide our customers with an unparalleled streaming experience. In April, we unveiled two new products: the Roku Express 4K+, which provides users with extremely affordable and powerful 4K streaming and the Roku Voice Remote Pro, which features a rechargeable battery, lost remote finder, and hands-free voice controls. The Roku Voice Remote Pro was Editor’s Choice from Tom’s Guide, and CNET refers to Roku as their “favorite streaming system, with the most streaming app options, the simplest interface and the best search.” Also in April, we released the latest version of our proprietary operating system, Roku OS 10, which enables our users to more quickly access the content they love through features like Instant Resume and the Live TV Channel Guide customization options. This software update also simplifies TV setup, improves performance, and adds automatic Wi-Fi network detection, automatic game console configuration and HDR10+ support. During Q1, the sustained high demand for consumer electronics and IT product categories created tight component supply conditions and logistical delays for Roku players and Roku TV models. Even with these supply chain challenges, our Roku TV program gained market share in the U.S., Canada, and Mexico. The Roku OS remains the No. 1 OS for smart TVs sold in the U.S. We also continue to make good progress in our international markets, as we are the No. 1 OS in Canada where more than 1 in 3 smart TVs sold are a Roku TV model, and we are now the No. 2 OS overall (the No. 1 licensed OS) for smart TVs sold in Mexico.
Platform Our Platform segment continued to execute well and delivered an exceptional first quarter, driven by significant increases in both content distribution activities and advertising. Content partners took advantage of our promotional tools to drive downloads, subscriptions and engagement, and advertisers increased their spending as they increasingly embraced connected TV platforms like Roku’s.
Content Distribution Consumers now have more choices than ever for premium DTC (direct to consumer) services via the Roku platform, including Discovery+, Disney+, HBO Max, Paramount+, Peacock, Amazon Prime Video, AppleTV+, Hulu, and Netflix. Media companies are bringing their best TV and film content to their DTC services to attract and retain viewers. For example, Disney premiered WandaVision on Disney+ in January; Discovery+ launched with spin-offs of their most successful franchises including 90 Day Fiancé and Magnolia House; and Paramount+ launched with the original film The SpongeBob Movie: Sponge on the Run and the reunion of the first Real World cast.
Paramount’s purchase of the PrimeTime ad, a unit that enabled one-click play of the SpongeBob Movie from the Roku home screen.
The Roku Voice Remote Pro**

Roku Q1 2021 Shareholder Letter 3
With so much outstanding content being made available on the Roku platform, publishers are investing heavily in promotion and leveraging our industry-leading, performance-driven marketing tools to build their TV streaming audiences. As a result, media and entertainment advertising (which includes what we’ve traditionally called our “audience development” business), grew faster than the overall platform in Q1 2021. As the No. 1 TV streaming platform in the U.S. (based on hours streamed – April 2021 Hypothesis Group), Roku will continue to benefit from the ongoing secular shift of both consumers and content providers to streaming.
Media partners leveraging our industry-leading, performance-driven marketing tools

Roku Q1 2021 Shareholder Letter 4
The Roku Channel Growth On The Roku Channel, we drove another quarter of record growth, reaching U.S. households with an estimated 70 million people. Account reach and streaming hours more than doubled year-over-year — a growth rate that is over twice as fast as the overall Roku platform. This demonstrates the power of The Roku Channel flywheel: easy access to content with broad appeal attracts viewers, that viewer engagement attracts advertisers, and advertiser spend in turn allows us to invest in more content. This flywheel is enabling us to be more creative and expansive in sourcing content suited to an AVOD (advertising video on demand) business model, and we expect that our content investment will continue to be commensurate with the scale and growth trajectory of The Roku Channel. In March, we licensed CYPHER, a new but relatively-unknown scripted series, and it premiered exclusively on The Roku Channel in the U.S. and Canada, becoming the channel’s No. 1 show in its first weekend. We use our promotional capabilities to drive large-scale audiences, as we will do when we premiere Roku Originals, which will consist of content from the Quibi® acquisition announced in January. Also in March, we acquired “This Old House” business including This Old House® and Ask This Old House TV programs, which are the two top-rated home improvement programs in the U.S. Acquisitions like Quibi and This Old House complement our existing content sourcing strategy of working with over 175 licensing and distribution partners. In addition to providing a great user experience, The Roku Channel is enabling advertisers to reach audiences they can no longer access on traditional TV. In Q1, over 85% of the adult 18-49 audience reach delivered on The Roku Channel was unduplicated with traditional TV. With our market-leading scale and highly-effective monetization capabilities, The Roku Channel is also an increasingly attractive place for content owners to reach streaming audiences through both ad-supported and subscription models. For example, The Roku Channel now offers 50 premium SVOD (subscription video on demand) services. Total premium subscriptions more than doubled year-over-year, with viewership of SVOD services in The Roku Channel growing more than twice as fast as the corresponding DTC apps on the Roku platform.
The Roku Channel Flywheel

Roku Q1 2021 Shareholder Letter 5
Ad Business Strength Advertisers continued to follow audiences and move budgets into TV streaming, with Roku’s monetized video ad impressions more than doubling year-over-year. Our ad technology enables advertisers to precisely reach any subset of our large and growing audience, which in turn improves the ROI (return on investment) of every dollar a brand spends with us. For example, Home Chef’s recent campaign demonstrated that Roku drove a 2.4x return on its ad spend. As with Roku OS and our hardware products, we continue to innovate in our ad technology. In April, we completed the acquisition of Nielsen’s video automatic content recognition (ACR) and dynamic ad insertion (DAI) team and technologies, which will accelerate our launch of an end-to-end linear ad replacement solution in partnership with programmers. Additionally, we launched our advertising brand studio to help marketers tell their stories using the unique benefits of a streaming platform: marketers can go beyond the traditional 30-second TV ad spot to amplify big moments through advertiser-commissioned short-form TV programs, interactive video ads, and other branded content on The Roku Channel. OneView provides all types of advertisers – big brands, direct response advertisers, small businesses, and more – with the best way to reach Roku users, both on and off the Roku platform. In Q1, total TV streaming ad impressions delivered through OneView nearly tripled year-over-year, while total impressions on the Roku platform (sold by Roku or its publishers) more than tripled. In addition to capturing a larger share of TV ad budgets, we are also successfully competing for performance advertising and social media budgets. According to eMarketer, Americans on an average day will spend more time on TV streaming than all major social media platforms combined: 3x Facebook, 2x YouTube, and roughly 2.5x Instagram, TikTok, and Snapchat combined. And, like these major social platforms, Roku possesses deep, direct relationships with consumers that do not depend on third party identifiers and cookies.
Outlook We are pleased with our start to 2021 and believe the broad secular trends combined with the investments we are making will drive long term growth. Different rates of recovery worldwide from COVID-19, combined with persistent supply chain constraints, make it difficult to predict an economic return to normalcy. Thus, our approach to outlook will be similar to last quarter, with formal outlook for Q2 and color on the second half of the year. Our Q2 outlook is for robust growth with total net revenue of $615 million at the midpoint (up 73% year-over-year) and total gross profit of $300 million at the midpoint (up 104% year-over-year). Strong gross profit growth is expected to outpace operating expense (OPEX) growth, resulting in Q2 Adjusted EBITDA of $65 million at the midpoint. Given the breadth of Roku’s business model and the complex dynamics of the macro-environment over the last year, we will face a mix of headwinds and tailwinds for the rest of 2021 and into 2022. We have recently begun to lap the initial COVID-19-related shelter-at-home orders which began in mid-March 2020, and these are creating volatile year-over-year comparisons. We anticipate more robust revenue growth rates in the first half of 2021 because we face tougher comps in the second half. We expect the platform business to have an easy year-over-year comp in Q2 2021, and then progressively more difficult comps as the year progresses. This reflects the pullback in TV advertising spend in Q2 2020, triggered by the initial uncertainty surrounding COVID-19, and the subsequent shift of ad budgets in Q3 2020 to digital, and in particular to Roku. We also benefitted from the launch of multiple premium DTC services in the second half of 2020. The player business is expected to face year-over-year comp headwinds in Q2, and especially in Q3, before returning to a more normalized comp in Q4. In addition, we expect supply chain constraints to persist for the rest of the year, and costs in components and logistics to correspondingly increase as the year progresses. We expect this will result in slightly negative Player margins for Q2 and the likelihood of increasing negative Player margins in the second half of 2021.

Roku Q1 2021 Shareholder Letter 6
The especially strong consumer interest in streaming during widespread stay-at-home orders in the U.S. in the spring and summer of 2020 produced a spike in streaming hours per account in Q2 2020, and also resulted in elevated growth for Roku’s active account base for much of the year. For the remainder of the year, we expect the year-over-year growth rates of both metrics to be lower than those in 2020. However, we expect net adds of both active accounts and streaming hours to be above pre-COVID-19 levels. Furthermore, we anticipate continued strong engagement as we expect streaming hours per account to be higher in 2021 than in 2020. Given the significant long-term opportunity ahead of us, we are investing aggressively. This increase in OPEX will begin to lap the actions we undertook to slow OPEX spending in 2020 to manage against pandemic-related uncertainties. As a result, combined with our recent acquisitions, our year-over-year OPEX growth rate is anticipated to increase significantly as 2021 progresses. Therefore, Adjusted EBITDA is expected to be higher in the first half than in the second half.
Conclusion Our exceptional performance in Q1 2021 demonstrates how our business model serves consumers, content owners, and advertisers alike in the TV ecosystem. Though there will be difficult COVID-19-related comparisons in 2021, we believe that the shift to streaming is inevitable. It will be global and will transform the way content is distributed and monetized. As the No. 1 TV streaming platform in the U.S. (based on hours streamed), we are excited about the road ahead.
Thank you for your support and Happy Streaming™!
Anthony Wood, Founder and CEO; and Steve Louden, CFO
** Packaging and TVs depicted in this Shareholder Letter are for illustrative purposes only. Pre-set channel buttons on remotes may vary.

Roku Q1 2021 Shareholder Letter 7
The Company will host a webcast of its conference call to discuss Q1 2021 results at 2 p.m. Pacific Time / 5 p.m. Eastern Time on May 6, 2021. Participants may access the live webcast in listen-only mode on the Roku investor relations website at ir.roku.com. An archived webcast of the conference call will also be available at ir.roku.com after the call.
About Roku, Inc.
Roku pioneered streaming to the TV. We connect users to the streaming content they love, enable content publishers to build and monetize large audiences, and provide advertisers with unique capabilities to engage consumers. Roku streaming players and TV-related audio devices are available in the U.S. and in select countries through direct retail sales and licensing arrangements with service operators. Roku TV™ models are available in the U.S. and in select countries through licensing arrangements with TV brands. Roku is headquartered in San Jose, Calif. U.S.A.
Roku, the Roku logo and other trade names, trademarks or service marks of Roku appearing in this shareholder letter are the property of Roku. Trade names, trademarks and service marks of other companies appearing in this shareholder letter are the property of their respective holders.
Investor Relations Conrad Grodd [email protected]
Media Kim Sampson
Use of Non-GAAP Measures In addition to financial information prepared in accordance with generally accepted accounting principles in the United States (GAAP), this shareholder letter includes certain non-GAAP financial measures. These non-GAAP measures include Adjusted EBITDA. In order for our investors to be better able to compare our current results with those of previous periods, we have included a reconciliation of GAAP to non-GAAP financial measures in the tables at the end of this letter. The Adjusted EBITDA reconciliation adjusts the related GAAP financial measures to exclude other income (expense), net, stock-based compensation expense, depreciation and amortization, and income tax (benefit)/expense where applicable. We believe these non-GAAP financial measures are useful as a supplement in evaluating our ongoing operational performance and enhancing an overall understanding of our past financial performance. However, these non-GAAP financial measures have limitations, and should not be considered in isolation or as a substitute for our GAAP financial information.
Forward-Looking Statements This shareholder letter contains “forward-looking” statements that are based on our beliefs and assumptions and on information currently available to us. Forward-looking statements include all statements that are not historical facts and can be identified by terms such as “anticipate,” “believe,” “continue,” “could,” “design,” “estimate,” “expect,” “may,” “seek,” “should,” “will,” “would” or similar expressions and the negatives of those terms. Forward-looking statements involve known and unknown risks, uncertainties and other factors that may cause our actual results, performance or achievements to be materially different from any future results, performance or achievements expressed or implied by the forward-looking statements. Forward-looking statements represent our beliefs and assumptions only as of the date of this letter. These statements include the shift to streaming, its benefits to us, and its effects on how content is distributed and monetized; content publisher investment in streaming; advertisers committing budget to TV streaming; the benefits, impact, features and availability of our streaming players, our audio devices and our partners’ Roku TV models; our ability to innovate, build and launch new products and services; our launch of an end-to-end linear ad replacement solution; our ability to gain market share; our international expansion; the impact of the COVID-19 pandemic on the shift to TV streaming; the impact of the COVID-19 pandemic on our results of operations, including net revenues, earnings and cash flows, and on our operating expenses and capital expenditures; our prospects for financial performance and growth following the COVID-19 pandemic; our strategic plan; the strength of the Roku brand, OS and platform; the performance, growth and monetization of The Roku Channel; the benefits and features of the OneView platform; our ability to source content suited to an AVOD business model and our investment in such content; the timing and availability of Roku Originals; our users’ continued engagement with The Roku Channel; our financial outlook for the second quarter of 2021 and our color provided for the second half of 2021 and into 2022; our investments; and our overall business trajectory. Except as required by law, we assume no obligation to update these forward-looking statements publicly, or to update the reasons actual results could differ materially from those anticipated in the forward-looking statements, even if new information becomes available in the future. Further information on factors that could cause actual results to differ materially from the results anticipated by our forward-looking statements is included in the reports we have filed with the Securities and Exchange Commission, including our Annual Report on Form 10-K for the year ended December 31, 2020. Additional information also will be available in our Quarterly Report on Form 10-Q for the quarter ended March 31, 2021. All information provided in this shareholder letter and in the tables attached hereto is as of May 6, 2021, and we undertake no duty to update this information unless required by law.

Roku Q1 2021 Shareholder Letter 8
ROKU, INC. CONDENSED CONSOLIDATED STATEMENTS OF OPERATIONS (in thousands, except per share data) (unaudited)
Three Months Ended
March 31,
2021 March 31,
2020 Net Revenue:
Platform $ 466,526 $ 232,557 Player 107,657 88,209
Total net revenue 574,183 320,766 Cost of Revenue:
Platform (1) 154,590 101,936 Player (1) 92,822 77,729
Total cost of revenue 247,412 179,665 Gross Profit:
Platform 311,936 130,621 Player 14,835 10,480
Total gross profit 326,771 141,101 Operating Expenses:
Research and development (1) 101,581 88,278 Sales and marketing (1) 88,873 68,248 General and administrative (1) 60,511 39,740
Total operating expenses 250,965 196,266 Income (Loss) from Operations 75,806 (55,165 ) Other Income (Expense), Net:
Interest expense (742 ) (863 ) Other income (expense), net 441 1,261
Total other income, net (301 ) 398 Income (Loss) Before Income Taxes 75,505 (54,767 )
Income tax (benefit) expense (791 ) (155 ) Net Income (Loss) $ 76,296 $ (54,612 ) Net income (loss) per share — basic $ 0.59 $ (0.45 ) Net income (loss) per share — diluted $ 0.54 $ (0.45 ) Weighted-average common shares outstanding — basic 129,674 120,180 Weighted-average common shares outstanding — diluted 140,328 120,180 (1) Stock-based compensation was allocated as follows: Cost of platform revenue $ 198 $ 211 Cost of player revenue 415 338 Research and development 16,554 13,255 Sales and marketing 13,363 10,057 General and administrative 10,007 6,544
Total stock-based compensation $ 40,537 $ 30,405

Roku Q1 2021 Shareholder Letter 9
ROKU, INC. CONDENSED CONSOLIDATED BALANCE SHEETS (in thousands, except share data) (unaudited)
As of
March 31,
2021 December 31,
2020 Assets Current Assets:
Cash and cash equivalents $ 2,077,514 $ 1,092,815 Restricted cash 83 434 Accounts receivable, net of allowances of $28,256 and $41,236 as of 496,173 523,852 March 31, 2021 and December 31, 2020, respectively Inventories 41,246 53,895 Prepaid expenses and other current assets 134,375 26,644
Total current assets 2,749,391 1,697,640 Property and equipment, net 155,001 155,197 Operating lease right-of-use assets 265,237 266,197 Intangible assets, net 79,255 62,181 Goodwill 125,684 73,058 Other non-current assets 112,577 16,269
Total Assets $ 3,487,145 $ 2,270,542 Liabilities and Stockholders’ Equity Current Liabilities:
Accounts payable $ 96,468 $ 112,314 Accrued liabilities 477,402 347,668 Current portion of long-term debt 6,125 4,874 Deferred revenue, current portion 48,121 55,465
Total current liabilities 628,116 520,321 Long-term debt, non-current portion 87,398 89,868 Deferred revenue, non-current portion 22,618 21,283 Operating lease liability, non-current portion 303,159 307,936 Other long-term liabilities 4,542 3,119 Total Liabilities 1,045,833 942,527 Stockholders’ Equity:
Common stock, $0.0001 par value 13 13 Additional paid-in capital 2,697,380 1,660,379 Accumulated other comprehensive income 29 29 Accumulated deficit (256,110 ) (332,406 )
Total stockholders’ equity 2,441,312 1,328,015 Total Liabilities and Stockholders’ Equity $ 3,487,145 $ 2,270,542

Roku Q1 2021 Shareholder Letter 10
ROKU, INC. CONDENSED CONSOLIDATED STATEMENTS OF CASH FLOWS (in thousands) (unaudited)
Quarter Ended March 31, 2021 2020
Cash flows from operating activities: Net Income (Loss) $ 76,296 $ (54,612 ) Adjustments to reconcile net loss to net cash provided by operating activities:
Depreciation and amortization 9,605 8,448 Stock-based compensation expense 40,537 30,405 Amortization of right-of-use assets 6,458 9,213 Amortization of content assets 9,818 6,123 Provision for doubtful accounts (54 ) 3,788 Other items, net 31 (14 ) Changes in operating assets and liabilities:
Accounts receivable 32,608 32,458 Inventories 12,649 5,736 Prepaid expenses and other current assets (19,001 ) (967 ) Other non-current assets (60,484 ) 1,469 Accounts payable (18,857 ) (13,650 ) Accrued liabilities 29,052 4,797 Operating lease liabilities (12,436 ) 13,560 Other long-term liabilities 548 1,166 Deferred revenue (10,971 ) (1,979 )
Net cash provided by operating activities 95,799 45,941 Cash flows from investing activities:
Purchases of property and equipment (3,717 ) (45,317 ) Acquisitions of businesses, net of cash acquired (102,804 ) — Proceeds from escrows associated with acquisition — 1,058
Net cash used in investing activities (106,521 ) (44,259 ) Cash flows from financing activities:
Proceeds from equity issued under at-the-market offerings, net of offering costs 989,615 — Proceeds from borrowings, net of issuance costs — 69,325 Repayments of borrowings (1,250 ) (1,250 ) Proceeds from equity issued under incentive plans 6,705 2,743
Net cash provided by financing activities 995,070 70,818 Net increase in cash, cash equivalents and restricted cash 984,348 72,500 Cash, cash equivalents and restricted cash —Beginning of period 1,093,249 517,333 Cash, cash equivalents and restricted cash —End of period $ 2,077,597 $ 589,833 Cash, cash equivalents and restricted cash at end of period: Cash and cash equivalents 2,077,514 588,294 Restricted cash 83 1,539 Cash, cash equivalents and restricted cash —End of period $ 2,077,597 $ 589,833 Supplemental disclosures of cash flow information:
Cash paid for interest $ 647 $ 1,067 Cash paid for income taxes $ 277 $ 238
Supplemental disclosures of noncash investing and financing activities: Unpaid portion of property and equipment purchases $ 2,860 $ 14,148 Unpaid portion of acquisition related expenses $ 1,595 $ — Unpaid portion of purchased intangibles $ — $ 400 Unpaid portion of at-the-market offering costs $ 105 $ —

Roku Q1 2021 Shareholder Letter 11
NON-GAAP INFORMATION (in thousands, except per share data) (unaudited) Three Months Ended
March 31,
2021 March 31,
2020 Reconciliation of Net Income (Loss) to Adjusted EBITDA: Net income (loss) $ 76,296 $ (54,612 ) Other income (expense), net 301 (398 ) Stock-based compensation 40,537 30,405 Depreciation and amortization 9,605 8,448 Income tax (benefit) expense (791 ) (155 )
Adjusted EBITDA $ 125,948 $ (16,312 )