Q1 2020 Quarterly Report - ProCredit Holding...Ratio of allowances to credit-impaired loans 95.5%...
17
Q1 2020 Quarterly Report
Transcript of Q1 2020 Quarterly Report - ProCredit Holding...Ratio of allowances to credit-impaired loans 95.5%...

Q1 2020Quarterly Report

1. Business development .............................................................................................................................3
2. Financial position and financial performance ...............................................................................5
3. Segment performance .............................................................................................................................6
4. Risk reporting .............................................................................................................................................9
5. Outlook........................................................................................................................................................12
6. Selected financial information ..........................................................................................................13
7. Further information ...............................................................................................................................16
Contents

Strategic orientationThe ProCredit group focuses on banking services for Small and Medium Enterprises (SMEs) in transition economies. We operate in South Eastern Europe, Eastern Europe, South America and Germany. Through our business activities we aim to provide a sustainable return on investment for our shareholders while making a contribution to economic, social and ecological development.
We want to fulfil the “Hausbank” role for our clients. As such, we aim to always be their first point of contact for financing and deposits as well as for account and payment services, and also support them in carrying out their long-term investment projects. In addition, we offer them efficient and attractive solutions for trade finance business and international payments.
We focus on innovative companies showing dynamic growth and stable, formalised structures. We also place an emphasis on expanding our green loan portfolio and promoting local production, especially in agriculture.
Our direct banking services offer comprehensive account management and savings facilities to private clients. At the same time, we combine the intelligent application of technology with professionally competent advice.
1. BUSINESS DEVELOPMENT
in EUR m
Statement of Financial Position 31.03.2020 31.12.2019 Change
Customer loan portfolio 4,839.5 4,797.3 42.2
Customer deposits 4,259.0 4,333.4 -74.4
Statement of Profit or Loss 01.01.-31.03.2020 01.01.-31.03.2019 Change
Net interest income 50.9 45.4 5.5
Loss allowance 6.9 2.1 4.8
Net fee and commission income 12.0 12.7 -0.7
Operating expenses 41.8 41.2 0.6
Profit of the period from continuing operations 13.7 12.5 1.2
Profit of the period 13.7 10.7 3.0
Key performance indicators 31.03.2020 31.03.2019 Change
Change in customer loan portfolio 0.9% 1.7% -0.8 pp
Cost-income ratio 64.6% 69.8% -5.2 pp
Return on equity (annualised) 7.0% 5.6% 1.4 pp
Common Equity Tier 1 capital ratio 14.0% 14.3% -0.3 pp
Additional indicators 31.03.2020 31.12.2019 Change
Customer deposits to customer loan portfolio 88.0% 90.3% -2.3 pp
Net interest margin (annualised) 3.1% 3.1% 0.0 pp
Share of credit-impaired loans 2.4% 2.5% -0.1 pp
Ratio of allowances to credit-impaired loans 95.5% 89.1% 6.4 pp
Green customer loan portfolio 807.0 795.4 11.6
ProCredit Group - Key figures
3 Quarterly Financial Report of the ProCredit Group as of 31 March 2020

Loan portfolio development, by loan volume
Course of business operationsOur overall business performance was positive in the first quarter of 2020, although results were negatively impacted by the economic downturn related to the COVID-19 pandemic. The loan portfolio increased by EUR 42 million, despite significant negative currency effects. The decline in customer deposits, which is characteristic of the first quarter of the year, amounted to EUR 74 million. At EUR 13.7 million, the consolidated result was EUR 3 million higher than in the previous year and corresponds to a return on equity of 7.0%.
Loan portfolio developmentOur customer loan portfolio grew by 0.9% or EUR 42 million. This growth was reduced by currency effects of approximately EUR 50 million, particularly due to the depreciation of local currencies in the Eastern Europe segment. The targeted reduction in small loans below EUR 50,000 flattened out during the quarter. The remaining business clients in this size category largely show a high level of formality and digitisation, and thus represent a promising target group for us.
Customer deposits developmentThe volume of customer deposits developed in line with our expectations, despite the economic downturn, and amounted to EUR 4.3 billion at the end of the first quarter. The drop in deposits by EUR 74 million or 1.7% was due to the seasonal decrease in business client deposits as well as negative currency effects. The ratio of customer deposits to the customer loan portfolio decreased to 88.0%, a 2.3 pp decline compared with the year-end figure.
0
500
1,000
1,500
2,000
2,500
3,000
3,500
4,000
4,500
5,000
31.12.2016 31.12.2017 31.12.2018 31.12.2019 31.03.2020
< EUR 50,000 EUR 50,001 to 250,000 EUR 250,001 to 500,000 EUR 500,001 to 1,500,000 > EUR 1,500,000
in EUR m
4 Quarterly Financial Report of the ProCredit Group as of 31 March 2020
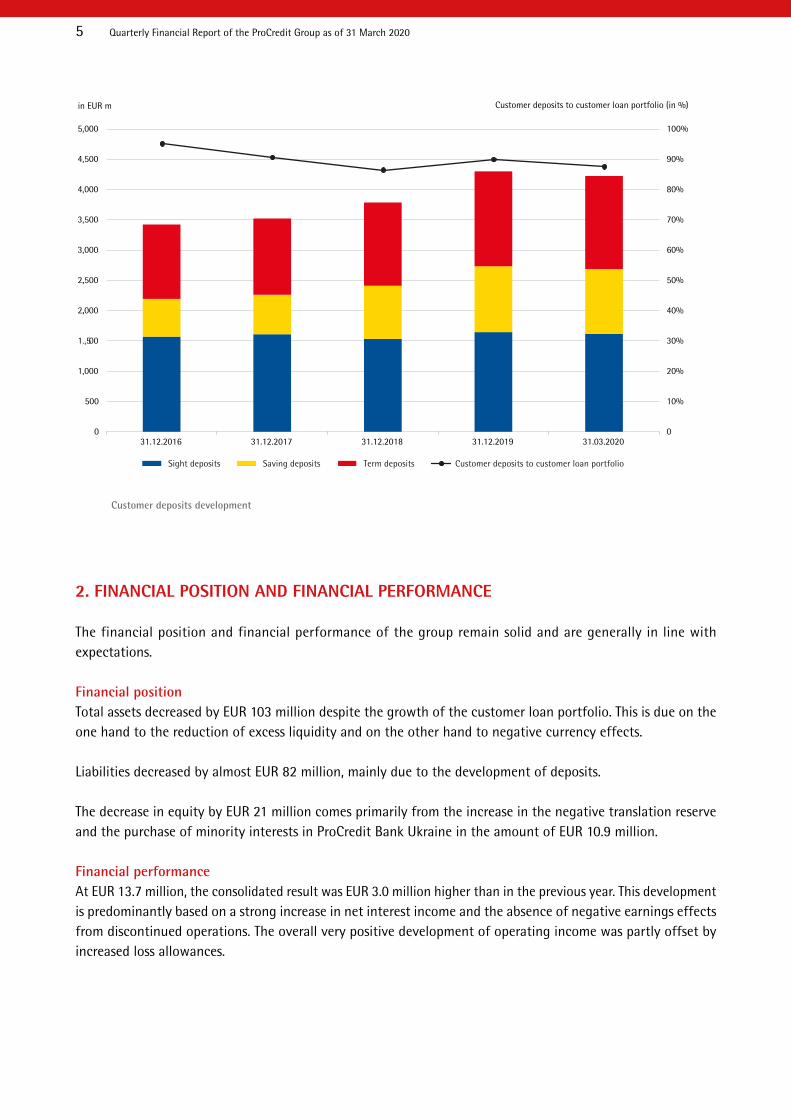
Customer deposits development
2. FINANCIAL POSITION AND FINANCIAL PERFORMANCE
The financial position and financial performance of the group remain solid and are generally in line with expectations.
Financial positionTotal assets decreased by EUR 103 million despite the growth of the customer loan portfolio. This is due on the one hand to the reduction of excess liquidity and on the other hand to negative currency effects.
Liabilities decreased by almost EUR 82 million, mainly due to the development of deposits.
The decrease in equity by EUR 21 million comes primarily from the increase in the negative translation reserve and the purchase of minority interests in ProCredit Bank Ukraine in the amount of EUR 10.9 million.
Financial performanceAt EUR 13.7 million, the consolidated result was EUR 3.0 million higher than in the previous year. This development is predominantly based on a strong increase in net interest income and the absence of negative earnings effects from discontinued operations. The overall very positive development of operating income was partly offset by increased loss allowances.
0
10%
20%
30%
40%
50%
60%
70%
80%
90%
100%
0
500
1,000
1.,500
2,.000
2,.500
3,000
3,500
4,000
4,500
5,000
31.12.2016 31.12.2017 31.12.2018 31.12.2019 31.03.2020
in EUR m Customer deposits to customer loan portfolio (in %)
Sight deposits Saving deposits Term deposits Customer deposits to customer loan portfolio
5 Quarterly Financial Report of the ProCredit Group as of 31 March 2020

Net interest income increased by more than EUR 5.5 million or 12.2%, mainly thanks to the solid growth of our customer loan portfolio over the last 12 months. The net interest margin remained stable at the previous year’s level.
Expenses for loss allowances rose by EUR 4.8 million to a total of EUR 6.9 million. This development is mainly due to the adjustment of the general macroeconomic outlook in response to the COVID-19 pandemic. Our portfolio quality continued to develop very stably. The share of the credit-impaired loan portfolio stood at 2.4%, which was slightly below the level of 2.5% reported at the previous year-end. The ratio of allowances to credit-impaired loans rose significantly by 6.4 percentage points and amounted to 95.5% at the end of the quarter.
Net fee and commission income fell slightly by EUR 0.7 million, mainly due to a decline in income from business with private clients.
Personnel and administrative expenses remained largely on a par with last year. The cost-income ratio improved by almost 5.2 pp to 64.6%. On a stable cost basis, profit before tax and expenses for loss allowances increased by EUR 5.1 million or 29% compared to the previous year, to EUR 22.9 million.
3. SEGMENT PERFORMANCE
Developments in the geographic segments South Eastern Europe, Eastern Europe and South America are presented below. The Germany segment is not shown separately. It essentially comprises the activities of ProCredit Holding, ProCredit Bank Germany and Quipu, which mainly perform supporting functions for the ProCredit banks.
in ‘000 EUR 01.01.-31.03.2020 01.01.-31.03.2019
South Eastern Europe 9,154 10,408
Eastern Europe 8,978 5,792
South America -461 -322
Germany* -3,945 -3,361
Discontinued Operations** 0 -1,842
Profit of the period 13,725 10,675
* Germany segment includes consolidation effects ** ProCredit Bank Colombia and ARDEC Mexico are shown as discontinued operations
6 Quarterly Financial Report of the ProCredit Group as of 31 March 2020

South Eastern Europe
in EUR m
Statement of Financial Position 31.03.2020 31.12.2019 Change
Customer loan portfolio 3,414.0 3,362.2 51.8
Customer deposits 3,028.3 3,066.6 -38.3
Statement of Profit or Loss 01.01.-31.03.2020 01.01.-31.03.2019 Change
Net interest income 28.0 26.8 1.2
Loss allowances 3.0 0.3 2.7
Net fee and commission income 8.3 9.0 -0.7
Operating expenses 24.6 24.0 0.6
Profit of the period 9.2 10.4 -1.2
Key performance indicators 31.03.2020 31.03.2019 Change
Change in customer loan portfolio 1.5% 1.6% -0.1 pp
Cost-income ratio 65.7% 66.4% -0.7 pp
Return on equity (annualised) 7.1% 8.5% -1.4 pp
Additional indicators 31.03.2020 31.12.2019 Change
Customer deposits to customer loan portfolio 88.7% 91.2% -2.5 pp
Net interest margin (annualised) 2.5% 2.5% 0.0 pp
Share of credit-impaired loans 2.2% 2.3% -0.1 pp
Ratio of allowances to credit-impaired loans 99.1% 93.3% 5.8 pp
Green customer loan portfolio 581.4 575.3 6.1
South Eastern Europe segment – Key figures
The customer loan portfolio for the South Eastern Europe segment increased by EUR 52 million or 1.5%. Particularly strong growth was recorded for our banks in Bulgaria and Serbia. The share of credit-impaired loans continued to decrease, while the ratio of allowances to credit-impaired loans improved significantly by 5.8 percentage points to 99.1%.
Customer deposits fell by EUR 38 million, primarily due to the seasonal decline in business client deposits.
The segment recorded an increase in net interest income and a slight 0.7pp improvement in the cost-income ratio to 65.7%. The profit of the period decreased by EUR 1.2 million on account of a EUR 2.7 million increase in expenses for loss allowances.
7 Quarterly Financial Report of the ProCredit Group as of 31 March 2020

Eastern Europe
in EUR m
Statement of Financial Position 31.03.2020 31.12.2019 Change
Customer loan portfolio 1,064.5 1,090.2 -25.7
Customer deposits 859.5 894.6 -35.1
Statement of Profit or Loss 01.01.-31.03.2020 01.01.-31.03.2019 Change
Net interest income 17.3 14.4 2.9
Loss allowances 2.6 2.3 0.3
Net fee and commission income 2.3 2.3 0.0
Operating expenses 8.5 8.2 0.3
Profit of the period 9.0 5.8 3.2
Key performance indicators 31.03.2020 31.03.2019 Change
Change in customer loan portfolio -2.4% 2.8% -5.2 pp
Cost-income ratio 39.7% 46.5% -6.8 pp
Return on equity (annualised) 15.2% 12.3% 2.9 pp
Additional indicators 31.03.2020 31.12.2019 Change
Customer deposits to customer loan portfolio 80.7% 82.1% -1.4 pp
Net interest margin (annualised) 4.5% 4.6% -0.1 pp
Share of credit-impaired loans 3.2% 3.3% -0.1 pp
Ratio of allowances to credit-impaired loans 85.4% 77.6% 7.8 pp
Green customer loan portfolio 185.8 188.9 -3.1
Eastern Europe segment – Key figures
The loan portfolio in the Eastern Europe segment shrank by EUR 25.7 million, primarily due to negative currency effects of approximately EUR 50 million. The share of credit-impaired loans reduced slightly. The ratio of allowances to credit-impaired loans improved significantly by 7.8 percentage points to 85.4%.
Customer deposits fell by EUR 35 million, primarily due to the seasonal decline in business client deposits and negative currency effects.
The cost-income ratio improved by 6.8 percentage points to under 40%. The profit of the period increased significantly by EUR 3.2 million, mainly due to higher net interest income combined with largely stable operating expenses, and corresponds to a return on equity of 15.2%.
8 Quarterly Financial Report of the ProCredit Group as of 31 March 2020

in EUR m
Statement of Financial Position 31.03.2020 31.12.2019 Change
Customer loan portfolio 306.7 288.9 17.8
Customer deposits 139.0 138.9 0.1
Statement of Profit or Loss 01.01.-31.03.2020 01.01.-31.03.2019 Change
Net interest income 4.7 3.8 0.9
Loss allowances 1.0 -0.5 1.5
Net fee and commission income -0.1 -0.1 0.0
Operating expenses 4.2 3.9 0.3
Profit of the period -0.5 -0.3 -0.2
Key performance indicators 31.03.2020 31.03.2019 Change
Change in customer loan portfolio 6.2% 5.7% 0.5 pp
Cost-income ratio 90.8% 111.1% -20.3 pp
Return on equity (annualised) -3.6% -2.5% -1.1 pp
Additional indicators 31.03.2020 31.12.2019 Change
Customer deposits to customer loan portfolio 45.3% 48.1% -2.8 pp
Net interest margin (annualised) 5.2% 5.3% -0.1 pp
Share of credit-impaired loans 2.6% 2.3% 0.3 pp
Ratio of allowances to credit-impaired loans 97% 100% -3.0 pp
Green customer loan portfolio 36.7 28.0 8.7
The customer loan portfolio of ProCredit Bank Ecuador increased by EUR 17.8 million or 6.2%. Customer deposits developed steadily. The underlying financial performance of the bank is positive, as reflected in the increase in net interest income of EUR 0.9 million or 23%. The profit of the period is essentially at the same level as the previous year, although it was negatively affected by a significant increase in loss allowances of EUR 1.5 million. The increase in loss allowances is attributable to the deterioration of the macroeconomic outlook due to the COVID-19 pandemic.
4. RISK REPORTING
In accordance with our simple, transparent and sustainable business strategy, we follow a conservative risk strategy. The aim is to ensure the internal capital adequacy of the group and each individual bank at all times and to achieve stable results, despite volatile external conditions, by following a consistent group-wide approach to managing risks. The overall risk profile of the group is adequate and stable.
In general, the details given in the 2019 management report are still valid. If any fundamental changes in the methodology and processes involved in risk management have occurred during the current financial year, these are highlighted in this section.
South America
South America segment – Key figures
9 Quarterly Financial Report of the ProCredit Group as of 31 March 2020

Capital management The adequacy of our own funds in accordance with CRR/CRD is determined on the basis of the IFRS consolidated financial statements. For this purpose we take into account counterparty risk, market risk, operational risk and credit valuation adjustment (CVA) risk. During the reporting period, all regulatory capital requirements were met at all times.
in EUR m 31.03.2020 31.12.2019
Common equity (net of deductions) 715 742
Additional Tier 1 (net of deductions) 0 0
Tier 2 capital 83 84
Total capital 799 826
RWA total 5,119 5,252
o/w Credit risk 4,116 4,240
o/w Market risk 565 574
o/w Operational risk 436 436
o/w CVA risk 2 1
Common Equity Tier 1 capital ratio 14.0% 14.1%
Total capital ratio 15.6% 15.7%
Leverage ratio (CRR) 10.5% 10.8%
Own Funds, risk-weighted assets and capital ratios
Our capitalisation is thus comfortably above the regulatory requirements of 8.2% for the CET1 capital ratio, 10.1% for the Tier 1 capital ratio and 12.6% for the total capital ratio.
During the first quarter of the year, the internal capital adequacy and stress resistance of the ProCredit group were ensured at all times. This is also reflected in the development of the group’s individual risks, as briefly described below.
Credit riskCredit risk is the most significant risk our group faces. Within overall credit risk we distinguish between customer credit risk, counterparty risk (including issuer risk) and country risk. Customer credit exposures account for the largest share. At group and bank level, the customer loan portfolio is monitored continuously for possible risk-relevant developments. The riskiness of a client is determined using a range of indicators, including the risk classification, restructuring status and client compliance with contractual payment requirements. Loss allowances are established in line with the defined group standards, which are based on IFRS 9. The forward-looking expected credit loss (ECL) model is the central element of the approach to quantifying loss allowances. Accordingly, all credit exposures to customers are allocated among three stages, with a distinct provisioning methodology applied to each group. Loss allowances in stage 1 and stage 2 increased by EUR 3.3 million and EUR 3.0 million, respectively, compared to year-end levels. This can be attributed to an update of the parameters in the ECL model, which partly takes into account the worsened short-term macroeconomic outlook in the wake of the COVID-19 pandemic. In addition, the credit volume in stage 2 increased. Stage 3 loss allowances fell by EUR 1.3 million, mainly due to the utilisation of loss allowances and stage transfers of credit exposures.
10 Quarterly Financial Report of the ProCredit Group as of 31 March 2020

Loss allowances in customer lending activities
in ‘000 EUR Stage 1 Stage 2 Stage 3
As of 31 March 2020
12-monthECL
Lifetime ECL
Lifetime ECL POCI Total
Germany
Gross outstanding amount 50,538 3,709 0 0 54,246Loss allowances -227 -401 0 0 -628
Carrying amount 50,310 3,308 0 0 53,618
South Eastern Europe
Gross outstanding amount 3,187,342 151,975 73,063 1,632 3,414,012
Loss allowances -22,733 -7,288 -43,465 -507 -73,992
Carrying amount 3,164,609 144,687 29,598 1,125 3,340,020
Eastern Europe
Gross outstanding amount 977,600 52,742 32,085 2,072 1,064,499
Loss allowances -8,658 -2,475 -17,388 -639 -29,159
Carrying amount 968,943 50,267 14,698 1,433 1,035,340
South America
Gross outstanding amount 288,143 10,734 7,845 0 306,722
Loss allowances -3,720 -377 -3,515 0 -7,613
Carrying amount 284,423 10,357 4,330 0 299,110
in ‘000 EUR Stage 1 Stage 2 Stage 3
As of 31 December 2019
12-monthECL
Lifetime ECL
Lifetime ECL POCI Total
Germany
Gross outstanding amount 54,122 1,940 0 0 56,062Loss allowances -224 -69 0 0 -293
Carrying amount 53,898 1,871 0 0 55,769
South Eastern Europe
Gross outstanding amount 3,169,889 115,976 74,649 1,667 3,362,181
Loss allowances -20,613 -5,488 -44,599 -491 -71,192
Carrying amount 3,149,276 110,488 30,050 1,175 3,290,989
Eastern Europe
Gross outstanding amount 1,018,989 34,981 34,031 2,204 1,090,206
Loss allowances -7,878 -1,699 -17,937 -588 -28,101
Carrying amount 1,011,112 33,283 16,094 1,616 1,062,105
South America
Gross outstanding amount 272,281 9,826 6,776 0 288,884
Loss allowances -3,308 -319 -3,159 0 -6,786
Carrying amount 268,974 9,507 3,617 0 282,098
11 Quarterly Financial Report of the ProCredit Group as of 31 March 2020

The positive long-term development of portfolio quality is founded on our clear focus on small and medium-sized businesses, as well as careful credit analysis and customer service. The share of the credit-impaired loan portfolio stood at 2.4%, which was slightly below the level of 2.5% reported at the previous year-end. The ratio of allowances to credit-impaired loans rose from 89.1% to 95.5%.
Aside from credit risk, other significant risks for the ProCredit group are foreign currency risk, interest rate risk, liquidity and funding risk, operational risk, business risk and model risk. There have been no substantial changes to any of these risks; therefore, the statements from the 2019 Annual Report still apply.
5. OUTLOOK
Based on the information available at the time of publication, we assume that the statements made in the Annual Report of 31 December 2019 concerning opportunities, risks and forecasts remain valid. A Management Statement on the status of the ProCredit group with regard to the COVID-19 pandemic was published on our website on 27 April 2020.
12 Quarterly Financial Report of the ProCredit Group as of 31 March 2020

6. SELECTED FINANCIAL INFORMATION
Consolidated Statement of Profit or Loss
in ‘000 EUR 01.01.-31.03.2020 01.01.-31.03.2019
Interest income (effective interest method) 79,471 70,731
Interest expenses 28,550 25,345
Net interest income 50,921 45,386
Loss allowances 6,887 2,084
Net interest income after allowances 44,034 43,302
Fee and commission income 16,375 16,726
Fee and commission expenses 4,409 3,984
Net fee and commission income 11,966 12,741
Result from foreign exchange transactions 4,008 2,721
Result from derivative financial instruments 82 221
Result on derecognition of financial assets measured at amortised cost 4 -21
Net other operating income -2,295 -2,013
Operating income 57,798 56,951
Personnel expenses 20,555 19,060
Administrative expenses 21,228 22,166
Operating expenses 41,784 41,225
Profit before tax 16,015 15,726
Income tax expenses 2,290 3,209
Profit of the period from continuing operations 13,725 12,517
Profit of the period from discontinued operations 0 -1,842
Profit of the period 13,725 10,675
Profit attributable to ProCredit shareholders 13,725 10,386
from continuing operations 13,725 12,158
from discontinued operations 0 -1,773
Profit attributable to non-controlling interests 0 289
from continuing operations 0 359
from discontinued operations 0 -70
13 Quarterly Financial Report of the ProCredit Group as of 31 March 2020

Consolidated Statement of Other Comprehensive Income
in ‘000 EUR 01.01.-31.03.2020 01.01.-31.03.2019
Profit of the period 13,725 10,675
Items that are or may be reclassified to profit or loss
Change in revaluation reserve -752 598
Reclasified to profit or loss 0 0
Change in value not recognised in profit or loss -765 698
Change in loss allowance (recognised in profit or loss) 13 -100
Change in deferred tax on revaluation reserve 61 -82
Change in translation reserve -22,977 5,058
Reclasified to profit or loss 0 92
Change in value not recognised in profit or loss -22,977 4,967
Other comprehensive income of the period, net of tax -23,668 5,575
Total comprehensive income of the period -9,943 16,250
Profit attributable to ProCredit shareholders -9,943 15,672
from continuing operations -9,943 20,389
from discontinued operations 0 - 4,717
Profit attributable to non-controlling interests 0 578
from continuing operations 0 637
from discontinued operations 0 -60
Earnings per share* in EUR 0.23 0.18
from continuing operations 0.23 0.21
from discontinued operations 0.00 -0.03
* Basic earnings per share were identical to diluted earnings per share.
14 Quarterly Financial Report of the ProCredit Group as of 31 March 2020

Consolidated Statement of Financial Position
in ‘000 EUR 31.03.2020 31.12.2019
Assets
Cash 132,033 142,982
Central bank balances 1,007,599 938,741
Loans and advances to banks 189,717 320,737
Derivative financial assets 2,138 306
Investment securities 314,183 378,281
Loans and advances to customers 4,728,088 4,690,961
Property, plant and equipment 134,170 138,407
Intangible assets 20,775 20,345
Current tax assets 6,741 5,314
Deferred tax assets 1,006 739
Other assets 58,111 60,747
Total assets 6,594,560 6,697,560
Liabilities
Liabilities to banks 215,616 226,819
Derivative financial liabilities 1,024 1,742
Liabilities to customers 4,259,022 4,333,436
Liabilities to international financial institutions 838,523 852,452
Debt securities 357,375 343,727
Other liabilities 35,012 33,361
Provisions 12,812 12,060
Current tax liabilities 2,112 2,022
Deferred tax liabilities 1,541 1,251
Subordinated debt 89,320 87,198
Total liabilities 5,812,357 5,894,068
Equity
Subscribed capital and capital reserve 441,277 441,277
Retained earnings 419,765 405,199
Translation reserve -80,046 -55,821
Revaluation reserve 1,207 1,896
Equity attributable to ProCredit shareholders 782,203 792,551
Non-controlling interests 0 10,941
Total equity 782,203 803,492
Total equity and liabilities 6,594,560 6,697,560
15 Quarterly Financial Report of the ProCredit Group as of 31 March 2020

7. FURTHER INFORMATION
Contact:ProCredit Holding AG & Co. KGaARohmerplatz 33-3760486 Frankfurt am MainGermany
Tel. +49 69 951 437 - 0Fax +49 69 951 437 - 168E-mail: [email protected]
Forward-looking statements and forecastsThis report contains forward-looking statements. Forward-looking statements are statements that do not describe past events. They include statements on the assumptions and expectations of ProCredit Holding as well as underlying assumptions. These statements are based on the plans, estimates and forecasts currently available to the Management of ProCredit Holding. Forward-looking statements therefore pertain solely to the date on which they are made. ProCredit Holding undertakes no obligation to update these statements in the event of new information or future events. Forward-looking statements naturally involve risks and uncertainties. A number of important factors can contribute to the fact that actual results may differ materially from forward-looking statements. These factors could include major disruptions in the Eurozone, a significant change in foreign trade or monetary policy, a worsening of the interest rate margin or pronounced exchange rate fluctuations. Should any of these factors arise, the impact could be manifested in decreased loan portfolio growth and an increase in past-due loans, and thus result in lower profitability.
16 Quarterly Financial Report of the ProCredit Group as of 31 March 2020

ProCredit Holding AG & Co. KGaARohmerplatz 33-3760486 Frankfurt am Main, GermanyTel. +49-(0)69 - 95 14 37-0Fax +49-(0)69 - 95 14 37-168www.procredit-holding.com
© 05/2020 ProCredit Holding AG & Co. KGaA All rights reserved