Q1 2020 Corporate Presentation - Bluestone Resources · The securities have not been and will not...
24
Q1 2020 Corporate Presentation Vision – A leading natural resource company driving stakeholder value through responsible, sustainable, and innovative development
Transcript of Q1 2020 Corporate Presentation - Bluestone Resources · The securities have not been and will not...
Q1 2020 Corporate Presentation
Vision – A leading natural resource company driving stakeholder value
through responsible, sustainable, and innovative development
This presentation contains “forward-looking information” within the meaning of Canadian securities legislation and “forward-looking statements” within the meaning of the United States Private Securities Litigation Reform Act of 1995 (collectively,
“forward-looking statements”). All statements, other than statements of historical fact, that address activities, events or developments that Bluestone Resources Inc. (“Bluestone” or the “Company”) believes, expects or anticipates will or may occur in
the future including, without limitation: The conversion of the inferred mineral resources; increasing the amount of measure and indicated mineral resource; The proposed timeline and benefits of further drilling and Feasibility Study; Statements about
the Company’s plans for its mineral properties; Bluestone’s business strategy, plans and outlook; the future financial or operating performance of Bluestone; capital expenditures, corporate general and administration expenses and exploration and
development expenses; expected working capital requirements; the future financial estimates of the Cerro Blanco Project economics, including estimates of capital costs of constructing mine facilities and bringing a mine into production and of
sustaining capital costs, estimates of operating costs and total costs, net present value and economic returns; proposed mine life, production timelines and rates; funding availability; resource estimates; metal or mineral recoveries; metal price
assumptions; and future exploration and operating plans are forward-looking statements. These forward-looking statements reflect the current expectations or beliefs of the Company based on information currently available to Bluestone and often use
words such as “expects”, “plans”, “anticipates”, “estimates”, “intends”, “may” or variations thereof or the negative of any of these terms.
All forward-looking statements are made based on the Company’s current beliefs as well as various assumptions made by the Company and information currently available to the Company. Generally, these assumptions include, among others: the
ability of Bluestone to carry on exploration and development activities; the price of gold, silver and other metals; there being no material variations in the current tax and regulatory environment; the exchange rates among the Canadian dollar,
Guatemalan quetzal and the United States dollar remaining consistent with current levels; the presence of and continuity of metals at the Cerro Blanco Project at estimated grades; the availability of personnel, machinery and equipment at estimated
prices and within estimated delivery times; metals sales prices and exchange rates assumed; appropriate discount rates applied to the cash flows in economic analyses; tax rates and royalty rates applicable to the proposed mining operation; the
availability of acceptable financing; anticipated mining losses and dilution; success in realizing proposed operations; anticipated timelines for community consultations and the impact of those consultations on the regulatory approval process.
Forward-looking statements are subject to a number of risks and uncertainties that may cause the actual results of the Company to differ materially from those discussed in the forward-looking statements and, even if such actual results are realized or
substantially realized, there can be no assurance that they will have the expected consequences to, or effects on, Bluestone. Factors that could cause actual results or events to differ materially from current expectations include, among other things:
risks and uncertainties related to expected production rates, timing and amount of production and total costs of production; risks and uncertainties related to ability to obtain or maintain necessary licenses, permits, or surface rights; risks associated
with technical difficulties in connection with mining development activities; risks and uncertainties related to the accuracy of mineral resource estimates and estimates of future production, future cash flow, total costs of production and diminishing
quantities or grades of mineral resources; risks associated with geopolitical uncertainty and political and economic instability in Guatemala; risks and uncertainties related to interruptions in production; the possibility that future exploration,
development or mining results will not be consistent with the Company’s expectations; uncertain political and economic environments and relationships with local communities; risks relating to variations in the mineral content within the mineral
identified as mineral resources from that predicted; variations in rates of recovery and extraction; developments in world metals markets; risks related to fluctuations in currency exchange rates; as well as those factors discussed under “Risk Factors” in
the Company’s Amended and Restated Annual Information Form.
Any forward-looking statement speaks only as of the date on which it was made, and except as may be required by applicable securities laws, Bluestone disclaims any intent or obligation to update any forward-looking statement, whether as a result of
new information, future events or results or otherwise. Although Bluestone believes that the assumptions inherent in the forward-looking statements are reasonable, forward-looking statements are not guarantees of future performance and accordingly
undue reliance should not be put on such statements due to their inherent uncertainty. There can be no assurance that forward-looking statements will prove to be accurate, and actual results and future events could differ materially from those
anticipated in such statements.
All mineral resource information has been estimated and disclosed in accordance with the definition standards on mineral resources and mineral reserves of the Canadian Institute of Mining, Metallurgy and Petroleum referred to in Canadian Securities
Administrators National Instrument 43-101 (“NI 43-101”), which requires disclosure of mineral resource information. U.S. reporting requirements for disclosure of mineral properties are governed by the United States Securities and Exchange
Commission Industry Guide 7, which sets forth substantially different guidelines than NI 43-101.
The Company has included certain non-International Financial Reporting Standards (“IFRS”) measures in this presentation. The Company believes that these measures, in addition to measures prepared in accordance with IFRS, provide investors an
improved ability to evaluate the underlying performance of the Company and to compare it to information reported by other companies. The non-IFRS measures are intended to provide additional information and should not be considered in isolation or
as a substitute for measures of performance prepared in accordance with IFRS. These measures do not have any standardized meaning prescribed under IFRS, and therefore may not be comparable to similar measures presented by other issuers. The
Company believes that all-in sustaining costs (“AISC”) more fully defines the total costs associated with producing gold. The Company calculates AISC as the sum of refining costs, third party royalties, site operating costs, sustaining capital costs and
closure capital costs all divided by the gold ounces sold to arrive at a per ounce amount. Other companies may calculate this measure differently as a result of differences in underlying principles and policies applied. Differences may also arise due to a
different definition of sustaining versus non-sustaining capital. Total cash costs is a common financial performance measure in the gold mining industry but has no standard meaning. The Company reports total cash costs on a gold ounce sold basis. The
Company believes that, in addition to measures prepared in accordance with IFRS, such as revenue, certain investors can use this information to evaluate the Company’s performance and ability to generate operating earnings and cash flow from its
mining operations. Management uses this metric as an important tool to monitor operating cost performance. Total cash costs include (cost of sales such as mining, processing, maintenance and site administration, royalties, selling costs and by-
product credits) to arrive at total cash costs per ounce of gold sold. Other companies may calculate this measure differently. ASIC and total cash costs are calculated based on the definitions published by the World Gold Council (“WGC”) (a market
development organization for the gold industry comprised of and funded by 18 gold mining companies from around the world). The WGC is not a regulatory organization.
This presentation does not constitute an offer to sell or a solicitation of an offer to buy any of the securities in the United States. The securities have not been and will not be registered under the United States Securities Act of 1933, as amended (the
“U.S. Securities Act”) or any state securities laws and may not be offered or sold within the United States or to U.S. Persons unless registered under the U.S. Securities Act and applicable state securities laws or an exemption from such registration is
available.
Compliance with NI 43-101
Certain information in this presentation is derived from the results of a Feasibility Study of the Cerro Blanco Project effective January 29, 2019, prepared in accordance with NI 43-101. A copy of the Feasibility Study is available on the SEDAR website
under the Company’s profile at www.sedar.com.
Risk Factors
As a mineral resource development company, Bluestone is engaged in a highly speculative business that involves a high degree of risk and is frequently unsuccessful. In addition to the information disclosed elsewhere in this presentation, readers
should carefully consider the risks and uncertainties described in the Company’s Amended and Restated Annual Information Form date December 31, 2018 which is available at www.sedar.com. These risk factors do not necessarily comprise all of the
risks to which Bluestone is or will be subject.
Forward Looking Statements & Risk Factors TSXV:BSR OTCQB:BBSRF | 2
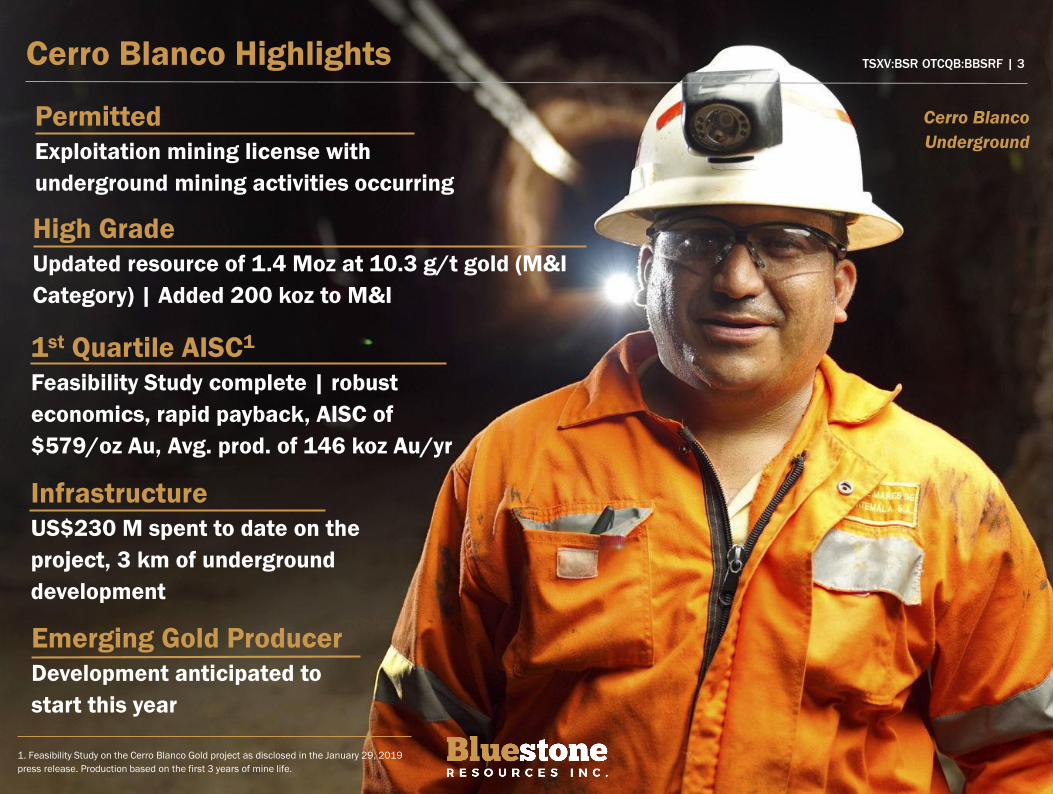
Cerro Blanco Highlights
High Grade
Updated resource of 1.4 Moz at 10.3 g/t gold (M&I
Category) | Added 200 koz to M&I
Permitted
Exploitation mining license with
underground mining activities occurring
1st Quartile AISC1
Feasibility Study complete | robust
economics, rapid payback, AISC of
$579/oz Au, Avg. prod. of 146 koz Au/yr
Infrastructure
US$230 M spent to date on the
project, 3 km of underground
development
Emerging Gold Producer
Development anticipated to
start this year
1. Feasibility Study on the Cerro Blanco Gold project as disclosed in the January 29, 2019
press release. Production based on the first 3 years of mine life.
TSXV:BSR OTCQB:BBSRF | 3
Cerro Blanco
Underground
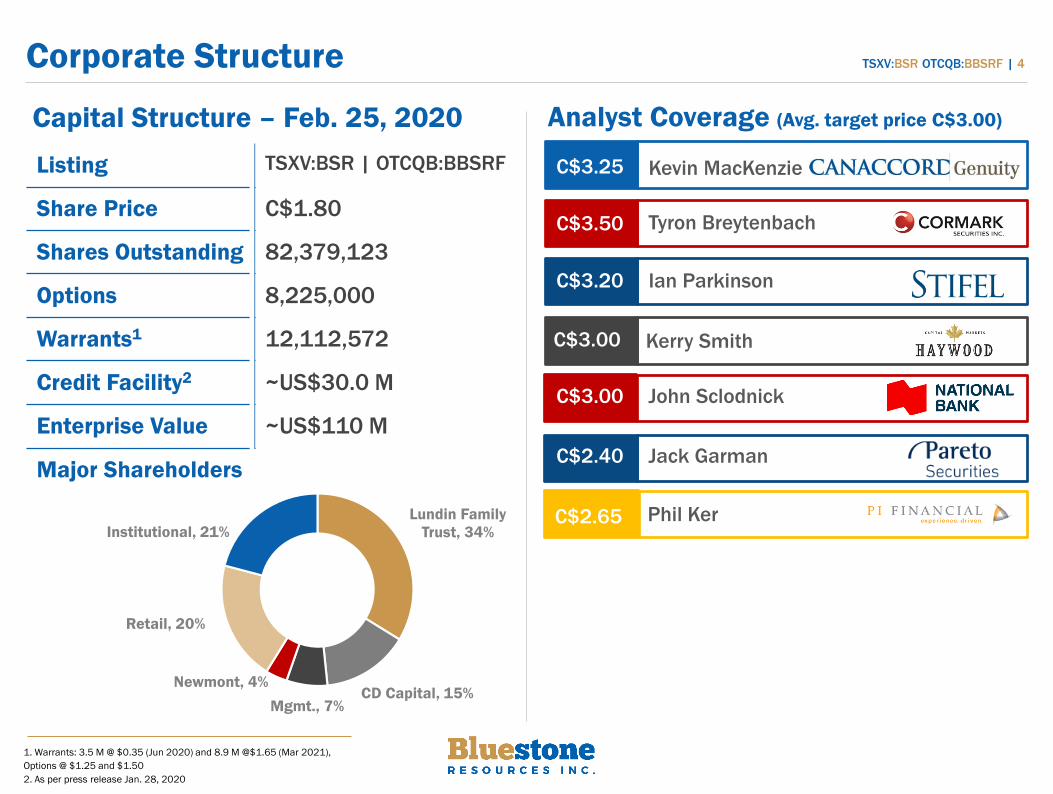
Corporate Structure
Capital Structure – Feb. 25, 2020
Listing TSXV:BSR | OTCQB:BBSRF
Share Price C$1.80
Shares Outstanding 82,379,123
Options 8,225,000
Warrants1 12,112,572
Credit Facility2 ~US$30.0 M
Enterprise Value ~US$110 M
Major Shareholders
TSXV:BSR OTCQB:BBSRF | 4
1. Warrants: 3.5 M @ $0.35 (Jun 2020) and 8.9 M @$1.65 (Mar 2021),
Options @ $1.25 and $1.50
2. As per press release Jan. 28, 2020
Analyst Coverage (Avg. target price C$3.00)
Tyron BreytenbachC$3.50
John SclodnickC$3.00
Kerry SmithC$3.00
Ian ParkinsonC$3.20
Kevin MacKenzieC$3.25
Lundin Family
Trust, 34%
CD Capital, 15%Mgmt., 7%
Newmont, 4%
Retail, 20%
Institutional, 21%C$2.65
Jack GarmanC$2.40
Phil Ker
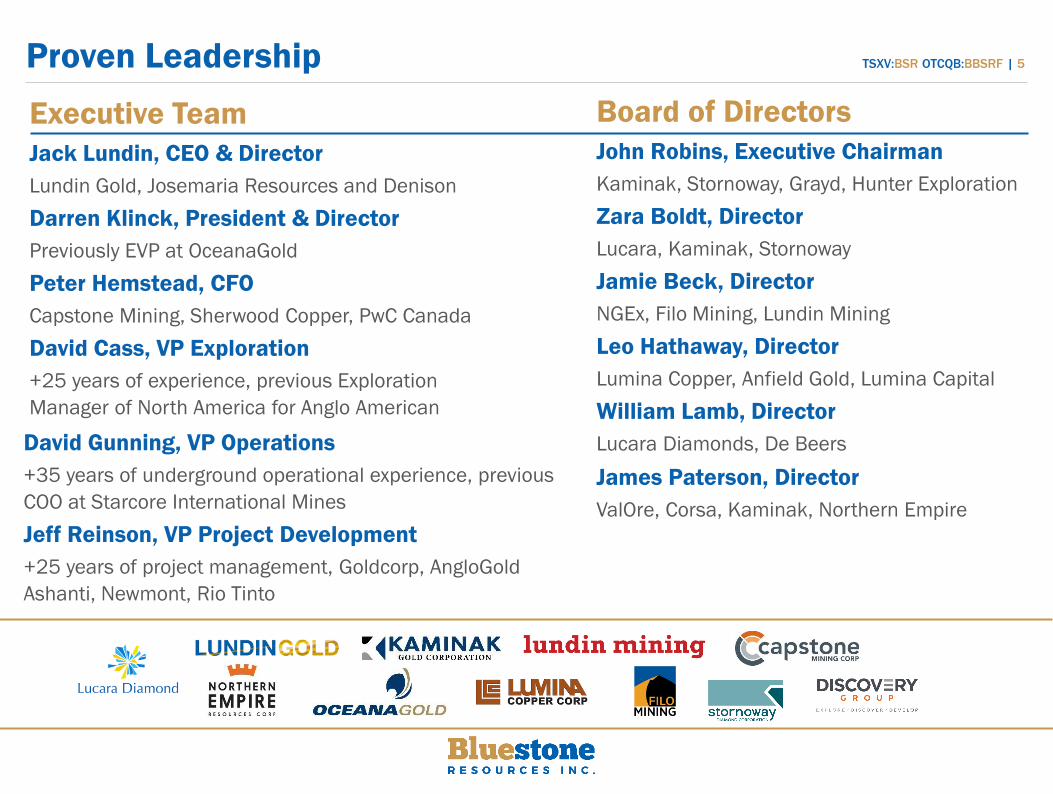
Proven Leadership
Executive Team
Jack Lundin, CEO & Director
Lundin Gold, Josemaria Resources and Denison
Darren Klinck, President & Director
Previously EVP at OceanaGold
Peter Hemstead, CFO
Capstone Mining, Sherwood Copper, PwC Canada
David Cass, VP Exploration
+25 years of experience, previous Exploration
Manager of North America for Anglo American
David Gunning, VP Operations
+35 years of underground operational experience, previous
COO at Starcore International Mines
Jeff Reinson, VP Project Development
+25 years of project management, Goldcorp, AngloGold
Ashanti, Newmont, Rio Tinto
Board of Directors
John Robins, Executive Chairman
Kaminak, Stornoway, Grayd, Hunter Exploration
Zara Boldt, Director
Lucara, Kaminak, Stornoway
Jamie Beck, Director
NGEx, Filo Mining, Lundin Mining
Leo Hathaway, Director
Lumina Copper, Anfield Gold, Lumina Capital
William Lamb, Director
Lucara Diamonds, De Beers
James Paterson, Director
ValOre, Corsa, Kaminak, Northern Empire
TSXV:BSR OTCQB:BBSRF | 5
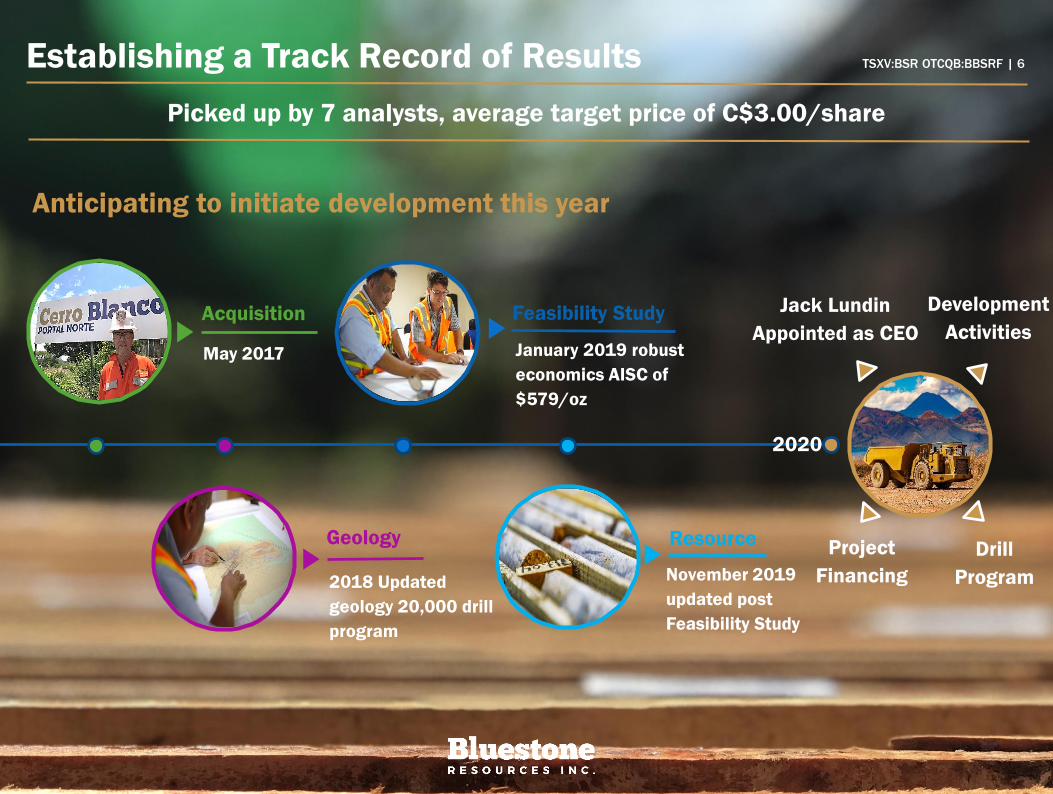
November 2019
updated post
Feasibility Study
Resource
Feasibility Study
Establishing a Track Record of Results
Anticipating to initiate development this year
Picked up by 7 analysts, average target price of C$3.00/share
Acquisition
GeologyDrill
Program
May 2017 January 2019 robust
economics AISC of
$579/oz
2018 Updated
geology 20,000 drill
program
TSXV:BSR OTCQB:BBSRF | 6
2020
Project
Financing
Jack Lundin
Appointed as CEO
Development
Activities
Sustainability
⚫ Responsible mining policy established
⚫ Underground mine with a small footprint
⚫ Dry stack tailings facility with waste rock stored underground
⚫ Low water consumption, net positive water balance
⚫ Community based water monitoring initiative in place for many years
⚫ Active reforestation program to replant native species within the
project footprint, net positive
⚫ Future potential for renewable geothermal power
⚫ Updated social baseline study undertaken to identify community
stakeholder needs and priorities
⚫ Workforce training, local procurement and supplier development
programs under development
Committed to IFC Performance Standards and international best practice for mining projects
TSXV:BSR OTCQB:BBSRF | 7
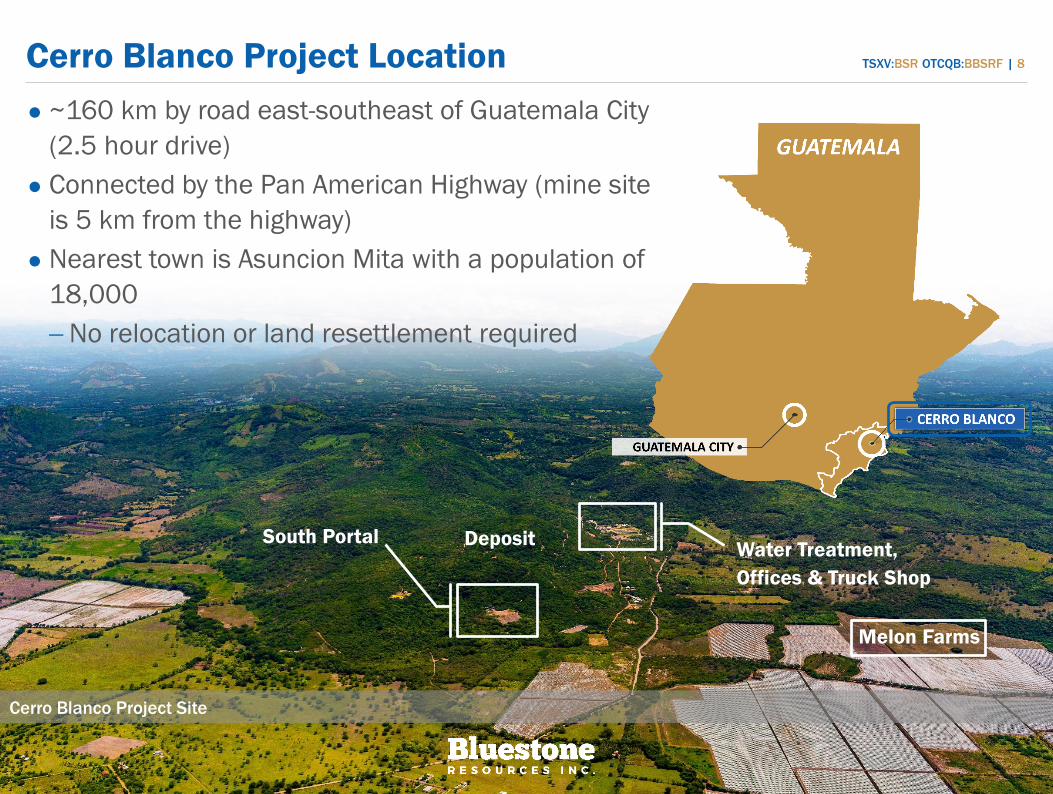
Cerro Blanco Project Location
Cerro Blanco Project Site
TSXV:BSR OTCQB:BBSRF | 8
⚫ ~160 km by road east-southeast of Guatemala City
(2.5 hour drive)
⚫ Connected by the Pan American Highway (mine site
is 5 km from the highway)
⚫ Nearest town is Asuncion Mita with a population of
18,000
−No relocation or land resettlement required
South Portal DepositWater Treatment,
Offices & Truck Shop
Melon Farms
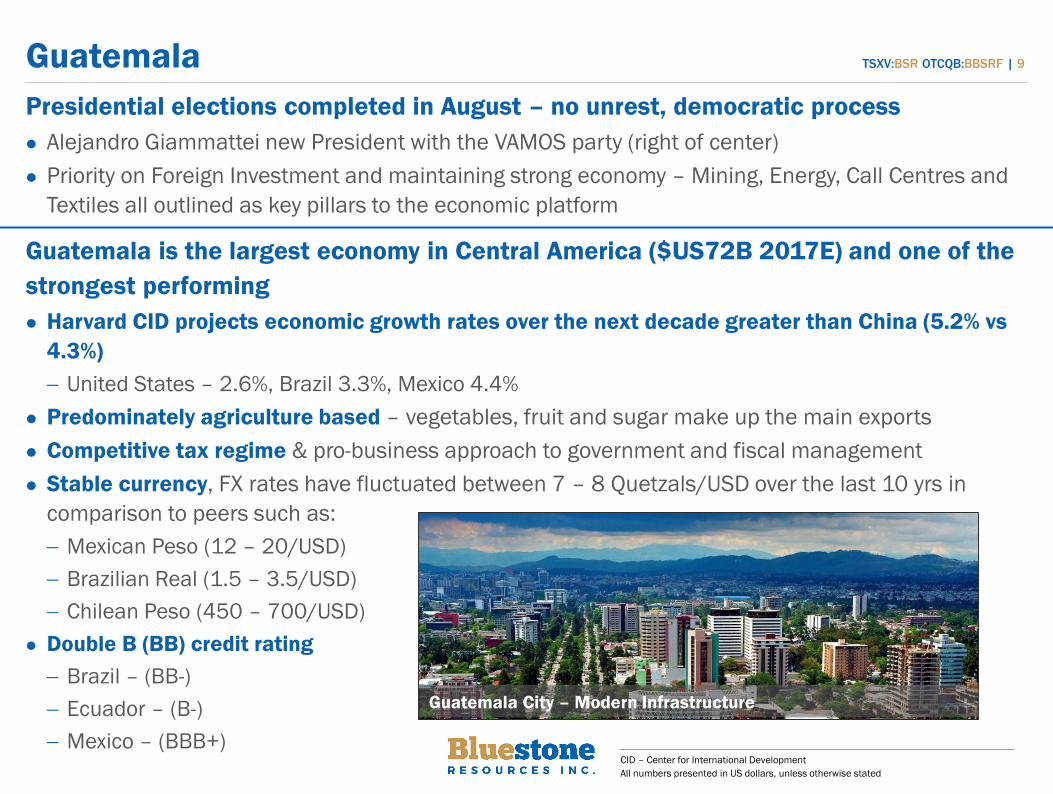
Presidential elections completed in August – no unrest, democratic process
⚫ Alejandro Giammattei new President with the VAMOS party (right of center)
⚫ Priority on Foreign Investment and maintaining strong economy – Mining, Energy, Call Centres and
Textiles all outlined as key pillars to the economic platform
Guatemala is the largest economy in Central America ($US72B 2017E) and one of the
strongest performing
⚫ Harvard CID projects economic growth rates over the next decade greater than China (5.2% vs
4.3%)
− United States – 2.6%, Brazil 3.3%, Mexico 4.4%
⚫ Predominately agriculture based – vegetables, fruit and sugar make up the main exports
⚫ Competitive tax regime & pro-business approach to government and fiscal management
⚫ Stable currency, FX rates have fluctuated between 7 – 8 Quetzals/USD over the last 10 yrs in
comparison to peers such as:
− Mexican Peso (12 – 20/USD)
− Brazilian Real (1.5 – 3.5/USD)
− Chilean Peso (450 – 700/USD)
⚫ Double B (BB) credit rating
− Brazil – (BB-)
− Ecuador – (B-)
− Mexico – (BBB+)
Guatemala
CID – Center for International Development
All numbers presented in US dollars, unless otherwise stated
TSXV:BSR OTCQB:BBSRF | 9
Guatemala City – Modern Infrastructure
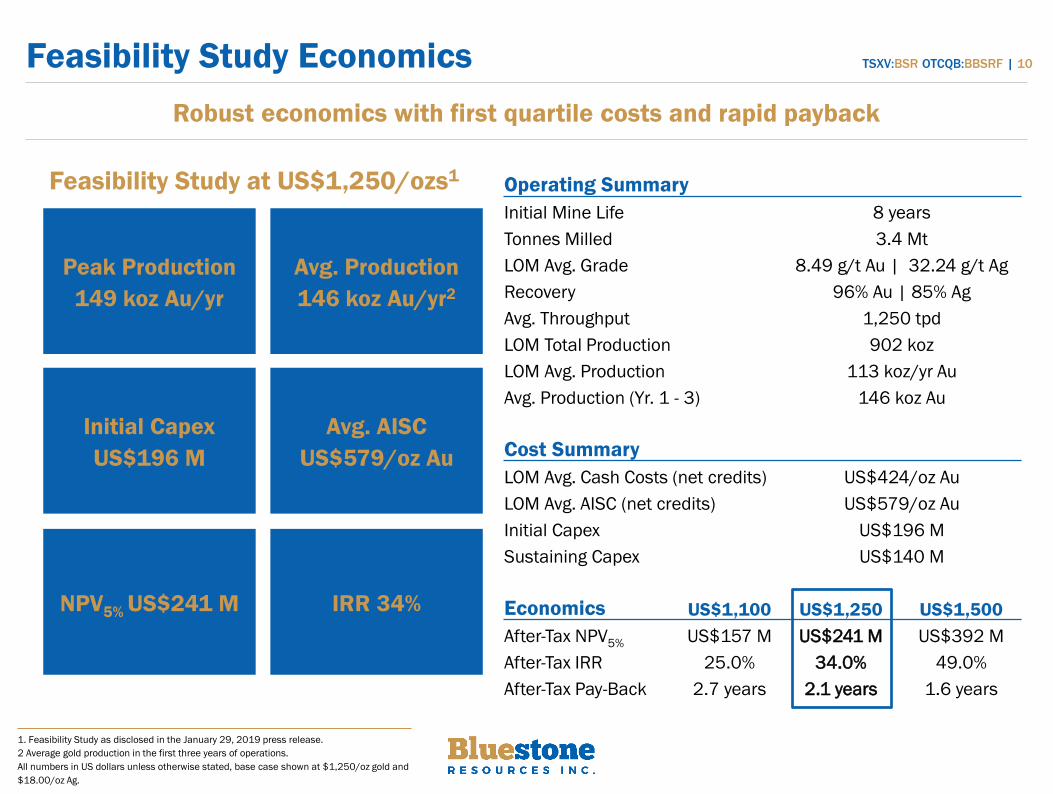
Feasibility Study Economics
Robust economics with first quartile costs and rapid payback
1. Feasibility Study as disclosed in the January 29, 2019 press release.
2 Average gold production in the first three years of operations.
All numbers in US dollars unless otherwise stated, base case shown at $1,250/oz gold and
$18.00/oz Ag.
TSXV:BSR OTCQB:BBSRF | 10
Peak Production
149 koz Au/yr
Avg. Production
146 koz Au/yr2
Initial Capex
US$196 M
Avg. AISC
US$579/oz Au
NPV5% US$241 M IRR 34%
Feasibility Study at US$1,250/ozs1Operating Summary
Initial Mine Life 8 years
Tonnes Milled 3.4 Mt
LOM Avg. Grade 8.49 g/t Au | 32.24 g/t Ag
Recovery 96% Au | 85% Ag
Avg. Throughput 1,250 tpd
LOM Total Production 902 koz
LOM Avg. Production 113 koz/yr Au
Avg. Production (Yr. 1 - 3) 146 koz Au
Cost Summary
LOM Avg. Cash Costs (net credits) US$424/oz Au
LOM Avg. AISC (net credits) US$579/oz Au
Initial Capex US$196 M
Sustaining Capex US$140 M
Economics US$1,100 US$1,250 US$1,500
After-Tax NPV5% US$157 M US$241 M US$392 M
After-Tax IRR 25.0% 34.0% 49.0%
After-Tax Pay-Back 2.7 years 2.1 years 1.6 years
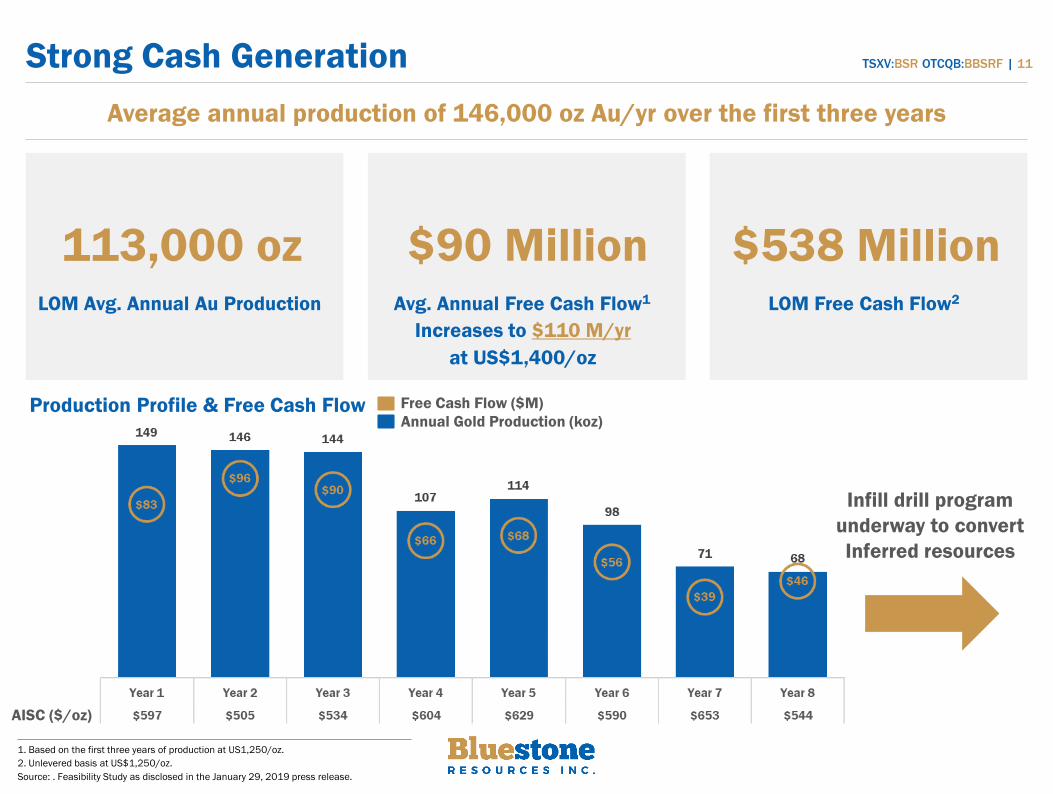
Strong Cash Generation
113,000 ozLOM Avg. Annual Au Production
$90 MillionAvg. Annual Free Cash Flow1
$538 MillionLOM Free Cash Flow2
Average annual production of 146,000 oz Au/yr over the first three years
Annual Gold Production (koz)
Free Cash Flow ($M)Production Profile & Free Cash Flow
AISC ($/oz)
1. Based on the first three years of production at US1,250/oz.
2. Unlevered basis at US$1,250/oz.
Source: . Feasibility Study as disclosed in the January 29, 2019 press release.
TSXV:BSR OTCQB:BBSRF | 11
Infill drill program
underway to convert
Inferred resources
Increases to $110 M/yr
at US$1,400/oz
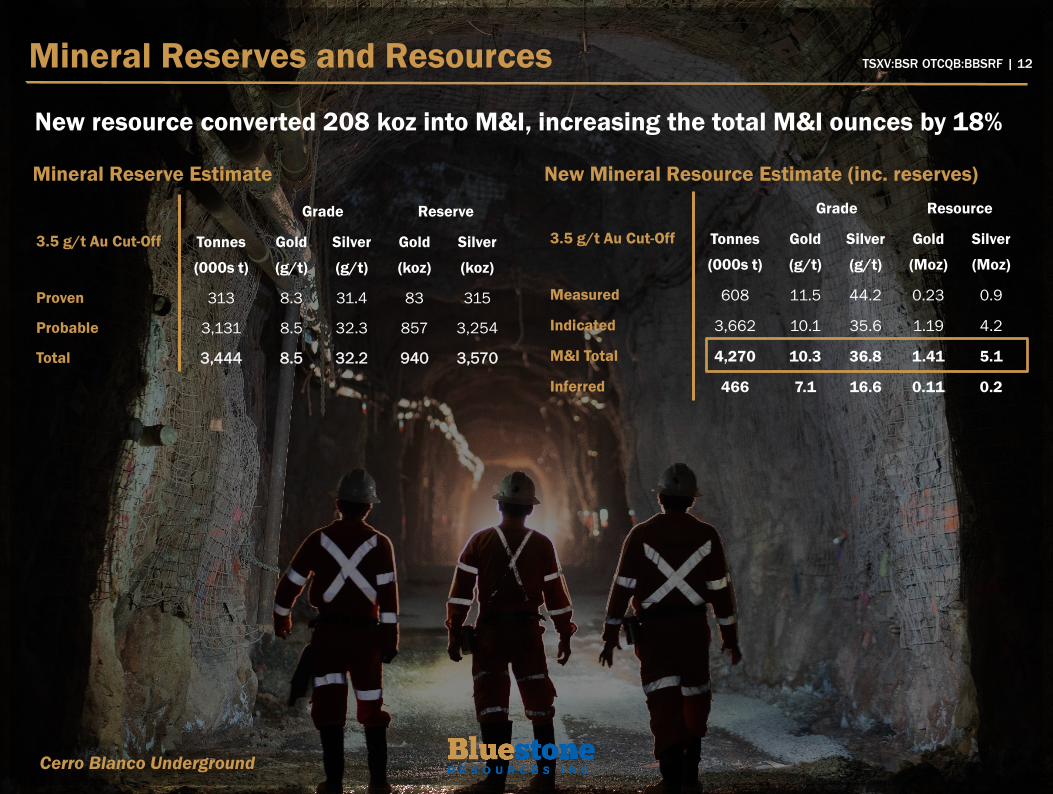
TSXV:BSR OTCQB:BBSRF | 12Mineral Reserves and Resources
Cerro Blanco Underground
New resource converted 208 koz into M&I, increasing the total M&I ounces by 18%
Grade Reserve
3.5 g/t Au Cut-Off Tonnes
(000s t)
Gold
(g/t)
Silver
(g/t)
Gold
(koz)
Silver
(koz)
Proven 313 8.3 31.4 83 315
Probable 3,131 8.5 32.3 857 3,254
Total 3,444 8.5 32.2 940 3,570
Mineral Reserve Estimate
Grade Resource
3.5 g/t Au Cut-Off Tonnes
(000s t)
Gold
(g/t)
Silver
(g/t)
Gold
(Moz)
Silver
(Moz)
Measured 608 11.5 44.2 0.23 0.9
Indicated 3,662 10.1 35.6 1.19 4.2
M&I Total 4,270 10.3 36.8 1.41 5.1
Inferred 466 7.1 16.6 0.11 0.2
New Mineral Resource Estimate (inc. reserves)
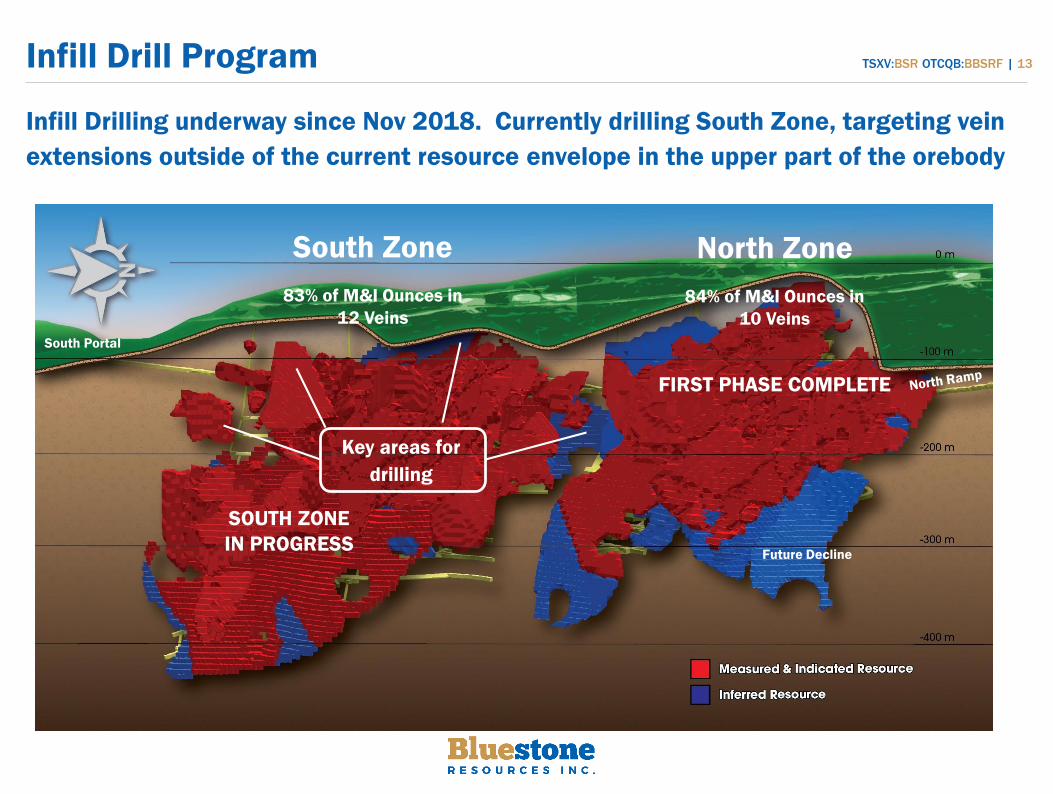
Infill Drill Program
Infill Drilling underway since Nov 2018. Currently drilling South Zone, targeting vein
extensions outside of the current resource envelope in the upper part of the orebody
TSXV:BSR OTCQB:BBSRF | 13
South Portal
North Zone
84% of M&I Ounces in
10 Veins
South Zone
83% of M&I Ounces in
12 Veins
Future Decline
Key areas for
drilling
1. As per the press release September 10, 2018
FIRST PHASE COMPLETE
SOUTH ZONE
IN PROGRESS
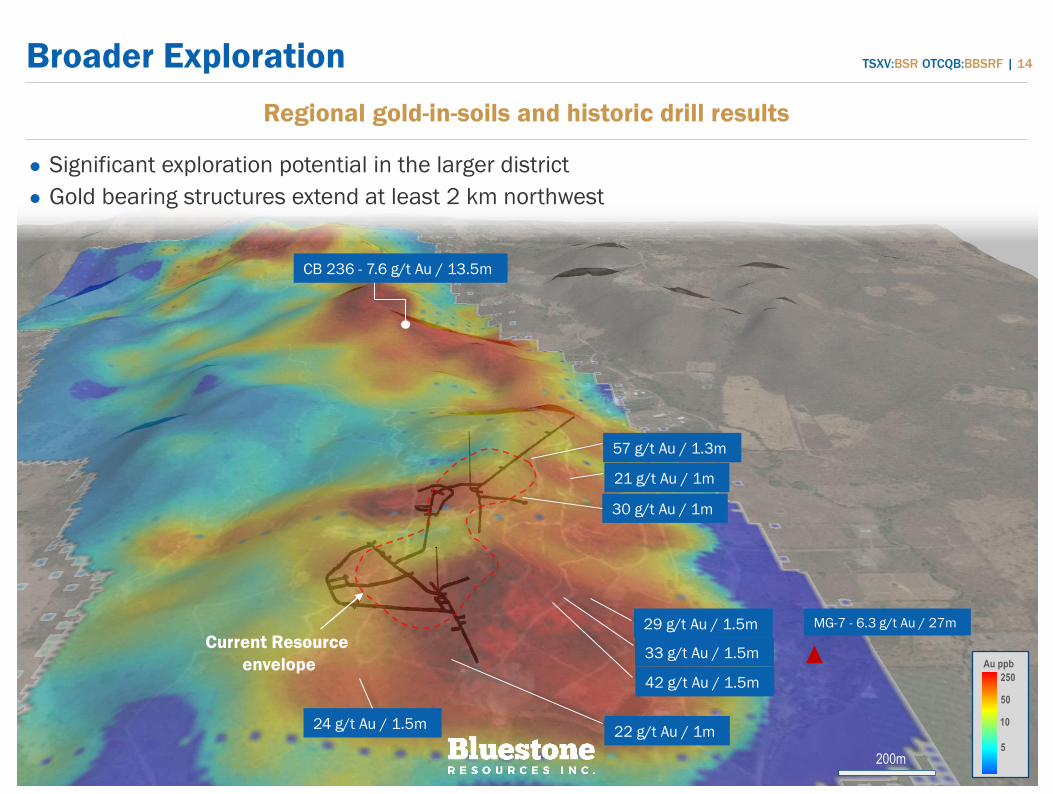
Broader Exploration
Regional gold-in-soils and historic drill results
57 g/t Au / 1.3m
MG-7 - 6.3 g/t Au / 27m
21 g/t Au / 1m
30 g/t Au / 1m
29 g/t Au / 1.5m
33 g/t Au / 1.5m
42 g/t Au / 1.5m
22 g/t Au / 1m 24 g/t Au / 1.5m
CB 236 - 7.6 g/t Au / 13.5m
Current Resource
envelope
200m
⚫ Significant exploration potential in the larger district
⚫ Gold bearing structures extend at least 2 km northwest
250
50
10
Au ppb
5
TSXV:BSR OTCQB:BBSRF | 14
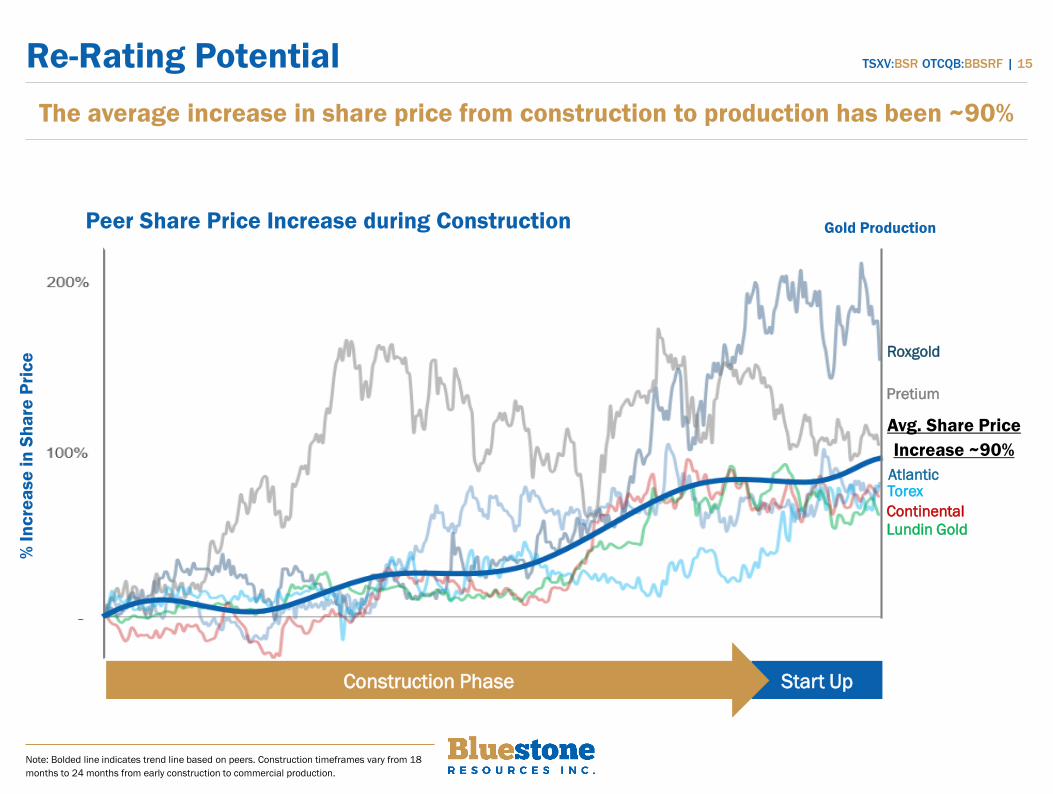
Re-Rating Potential
Peer Share Price Increase during Construction
The average increase in share price from construction to production has been ~90%
Gold Production
Roxgold
Pretium
AtlanticTorex
Continental
Lundin Gold
Note: Bolded line indicates trend line based on peers. Construction timeframes vary from 18
months to 24 months from early construction to commercial production.
Construction Phase Start Up
Avg. Share Price
Increase ~90%
TSXV:BSR OTCQB:BBSRF | 15
% I
nc
rea
se
in
Sh
are
Pri
ce
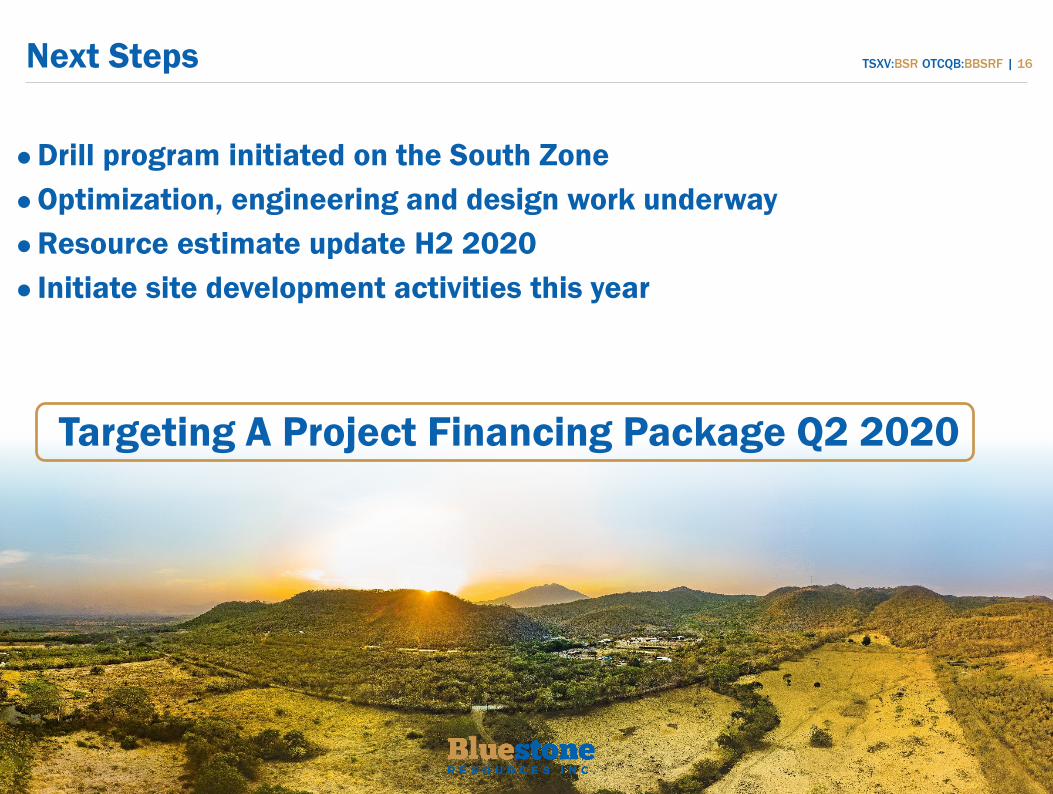
Next Steps TSXV:BSR OTCQB:BBSRF | 16
⚫ Drill program initiated on the South Zone
⚫ Optimization, engineering and design work underway
⚫ Resource estimate update H2 2020
⚫ Initiate site development activities this year
Targeting A Project Financing Package Q2 2020
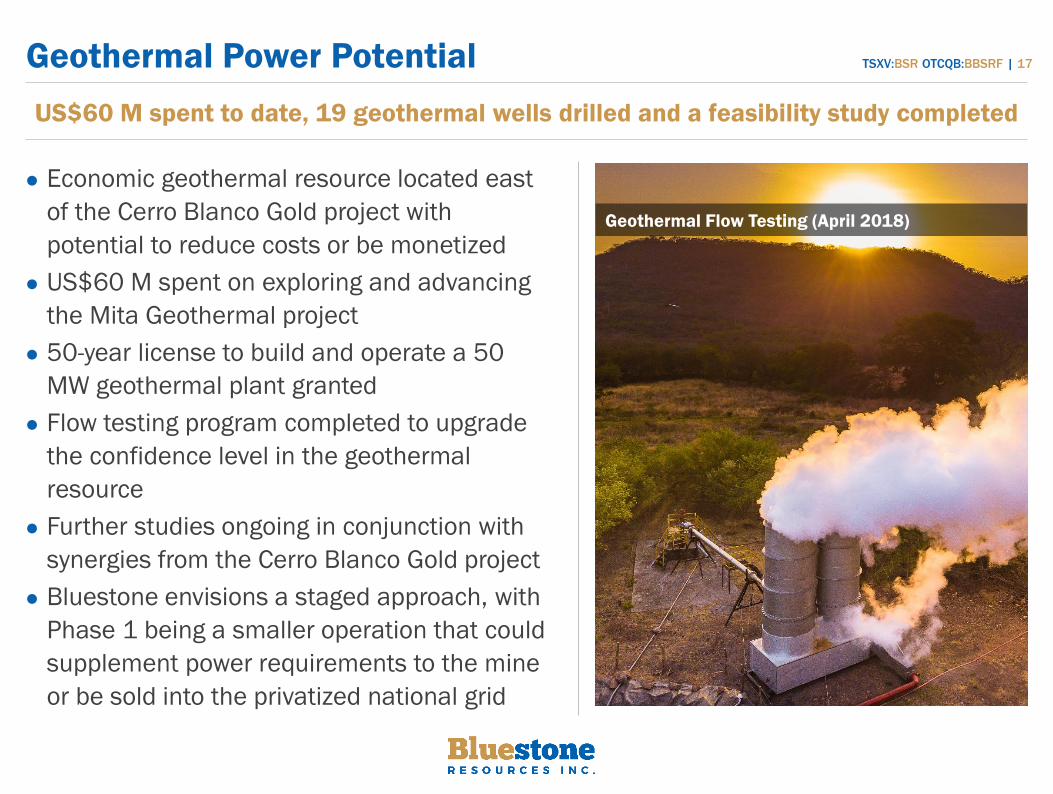
Geothermal Power Potential
⚫ Economic geothermal resource located east
of the Cerro Blanco Gold project with
potential to reduce costs or be monetized
⚫ US$60 M spent on exploring and advancing
the Mita Geothermal project
⚫ 50-year license to build and operate a 50
MW geothermal plant granted
⚫ Flow testing program completed to upgrade
the confidence level in the geothermal
resource
⚫ Further studies ongoing in conjunction with
synergies from the Cerro Blanco Gold project
⚫ Bluestone envisions a staged approach, with
Phase 1 being a smaller operation that could
supplement power requirements to the mine
or be sold into the privatized national grid
US$60 M spent to date, 19 geothermal wells drilled and a feasibility study completed
TSXV:BSR OTCQB:BBSRF | 17
Geothermal Flow Testing (April 2018)
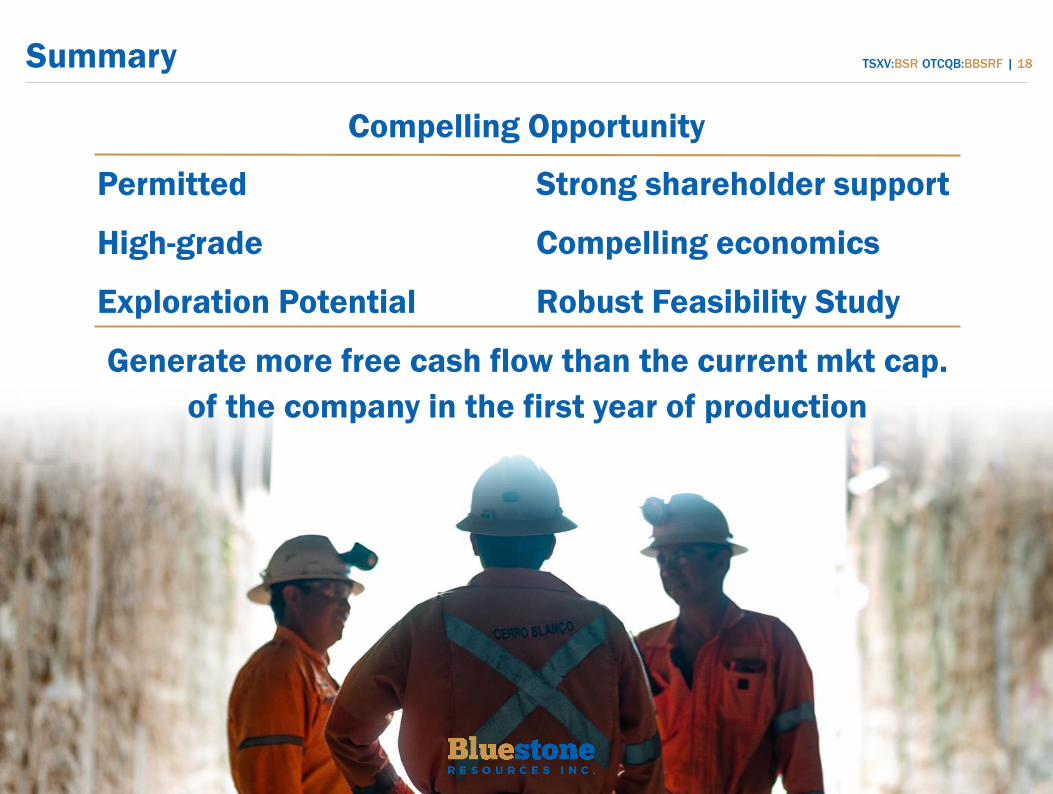
Summary TSXV:BSR OTCQB:BBSRF | 18
Permitted
High-grade
Exploration Potential
Strong shareholder support
Compelling economics
Robust Feasibility Study
Compelling Opportunity
Generate more free cash flow than the current mkt cap.
of the company in the first year of production
Appendix
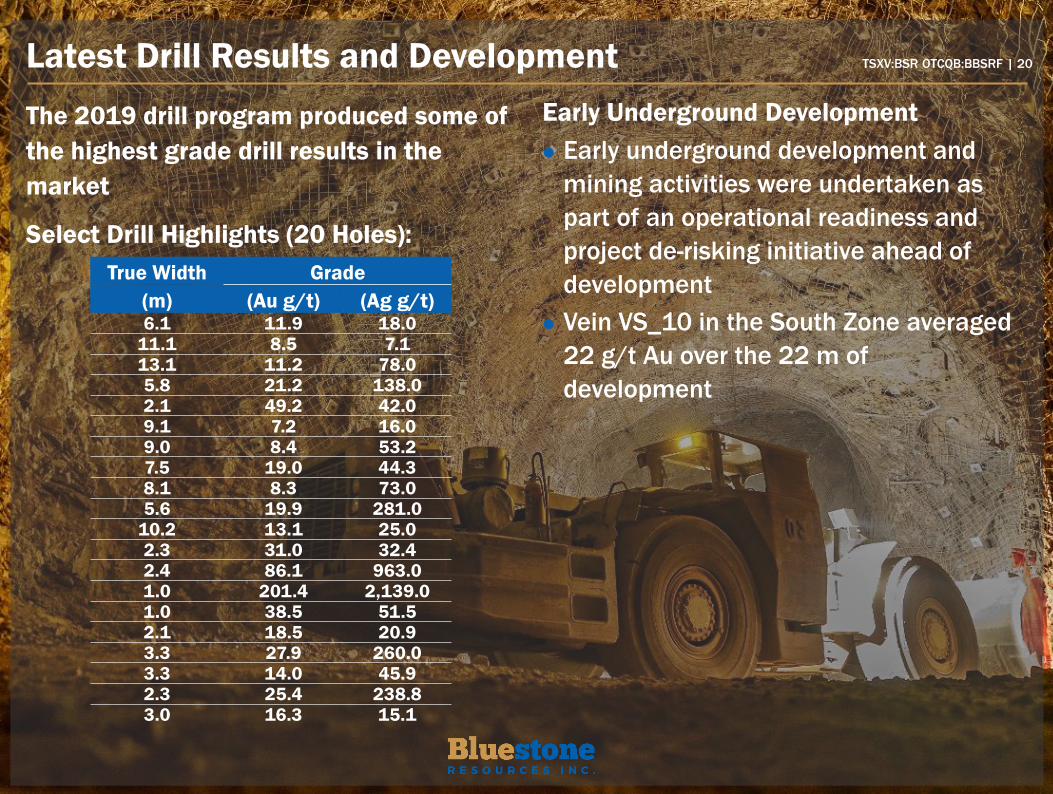
Latest Drill Results and Development
The 2019 drill program produced some of
the highest grade drill results in the
market
Select Drill Highlights (20 Holes):
Early Underground Development
⚫ Early underground development and
mining activities were undertaken as
part of an operational readiness and
project de-risking initiative ahead of
development
⚫ Vein VS_10 in the South Zone averaged
22 g/t Au over the 22 m of
development
True Width Grade
(m) (Au g/t) (Ag g/t)6.1 11.9 18.0
11.1 8.5 7.113.1 11.2 78.05.8 21.2 138.02.1 49.2 42.09.1 7.2 16.09.0 8.4 53.27.5 19.0 44.38.1 8.3 73.05.6 19.9 281.0
10.2 13.1 25.02.3 31.0 32.42.4 86.1 963.01.0 201.4 2,139.01.0 38.5 51.52.1 18.5 20.93.3 27.9 260.03.3 14.0 45.92.3 25.4 238.83.0 16.3 15.1
TSXV:BSR OTCQB:BBSRF | 20
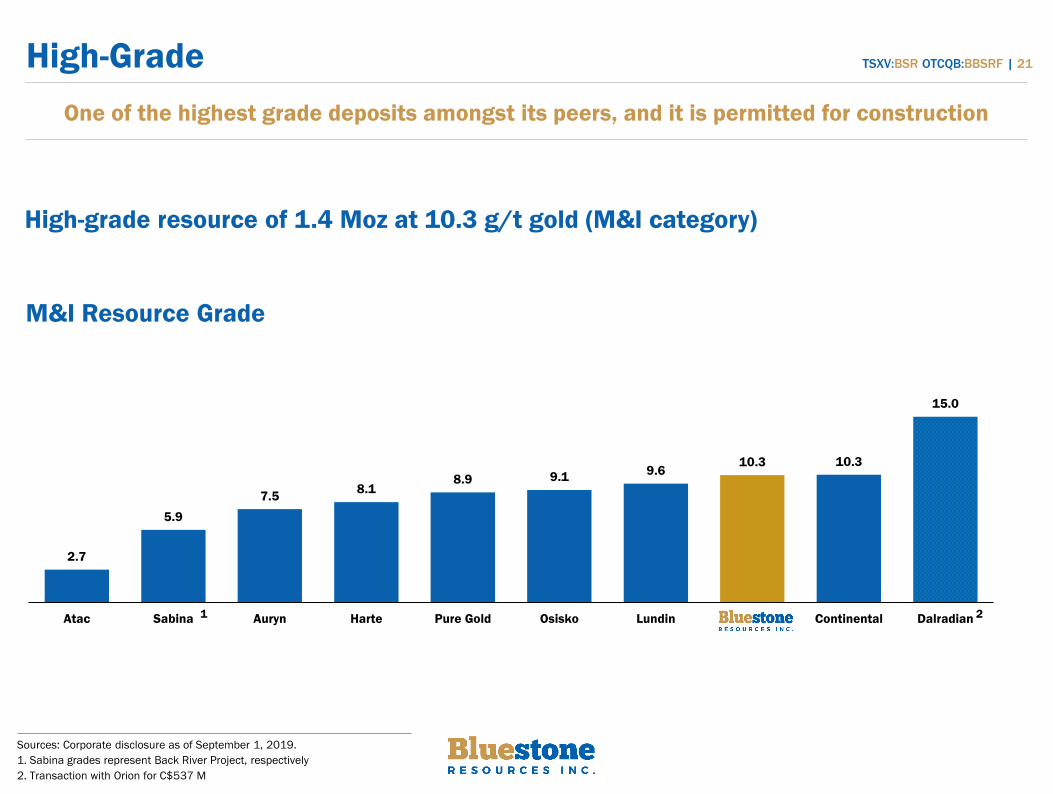
2.7
5.9
7.58.1
8.9 9.19.6
10.3 10.3
15.0
Atac Sabina Auryn Harte Pure Gold Osisko Lundin Bluestone Continental Dalradian
High-Grade
M&I Resource Grade
One of the highest grade deposits amongst its peers, and it is permitted for construction
Sources: Corporate disclosure as of September 1, 2019.
1. Sabina grades represent Back River Project, respectively
2. Transaction with Orion for C$537 M
1
TSXV:BSR OTCQB:BBSRF | 21
2
High-grade resource of 1.4 Moz at 10.3 g/t gold (M&I category)
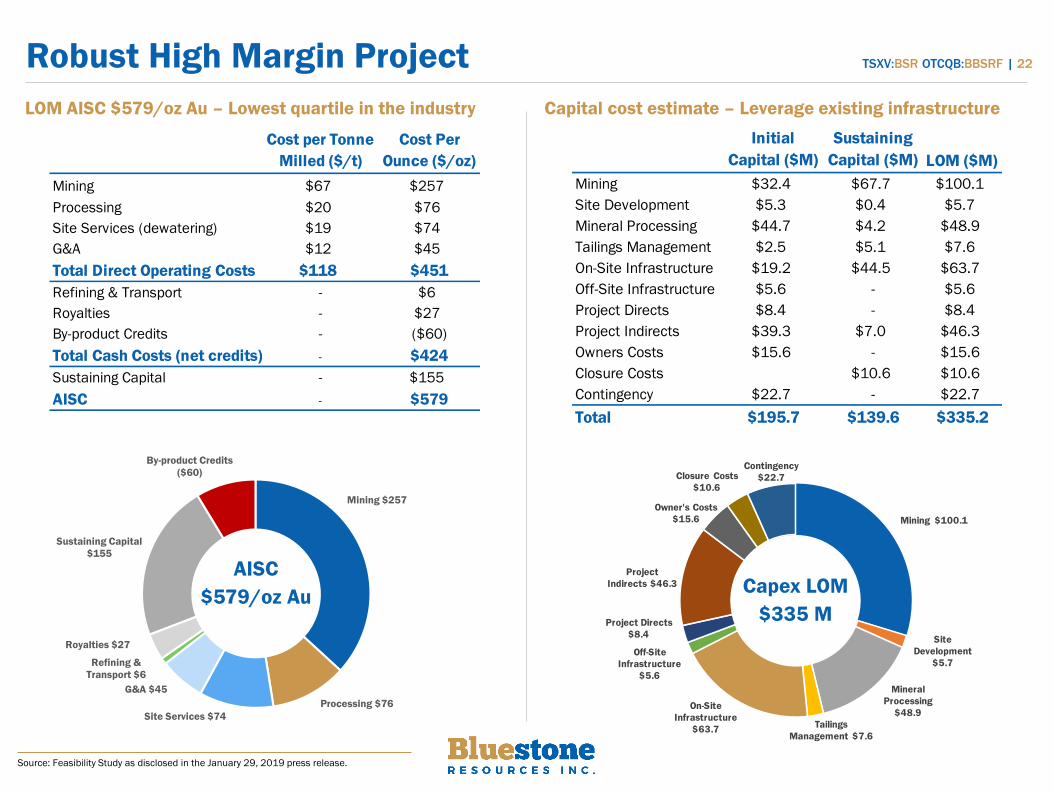
Robust High Margin Project
LOM AISC $579/oz Au – Lowest quartile in the industry Capital cost estimate – Leverage existing infrastructure
Mining $257
Processing $76
Site Services $74
G&A $45
Refining &
Transport $6
Royalties $27
Sustaining Capital
$155
By-product Credits
($60)
AISC
$579/oz Au
Cost per Tonne
Milled ($/t)
Cost Per
Ounce ($/oz)
Mining $67 $257
Processing $20 $76
Site Services (dewatering) $19 $74
G&A $12 $45
Total Direct Operating Costs $118 $451
Refining & Transport - $6
Royalties - $27
By-product Credits - ($60)
Total Cash Costs (net credits) - $424
Sustaining Capital - $155
AISC - $579
Initial
Capital ($M)
Sustaining
Capital ($M) LOM ($M)
Mining $32.4 $67.7 $100.1
Site Development $5.3 $0.4 $5.7
Mineral Processing $44.7 $4.2 $48.9
Tailings Management $2.5 $5.1 $7.6
On-Site Infrastructure $19.2 $44.5 $63.7
Off-Site Infrastructure $5.6 - $5.6
Project Directs $8.4 - $8.4
Project Indirects $39.3 $7.0 $46.3
Owners Costs $15.6 - $15.6
Closure Costs $10.6 $10.6
Contingency $22.7 - $22.7
Total $195.7 $139.6 $335.2
Mining $100.1
Site
Development
$5.7
Mineral
Processing
$48.9
Tailings
Management $7.6
On-Site
Infrastructure
$63.7
Off-Site
Infrastructure
$5.6
Project Directs
$8.4
Project
Indirects $46.3
Owner's Costs
$15.6
Closure Costs
$10.6
Contingency
$22.7
TSXV:BSR OTCQB:BBSRF | 22
Capex LOM
$335 M
Source: Feasibility Study as disclosed in the January 29, 2019 press release.
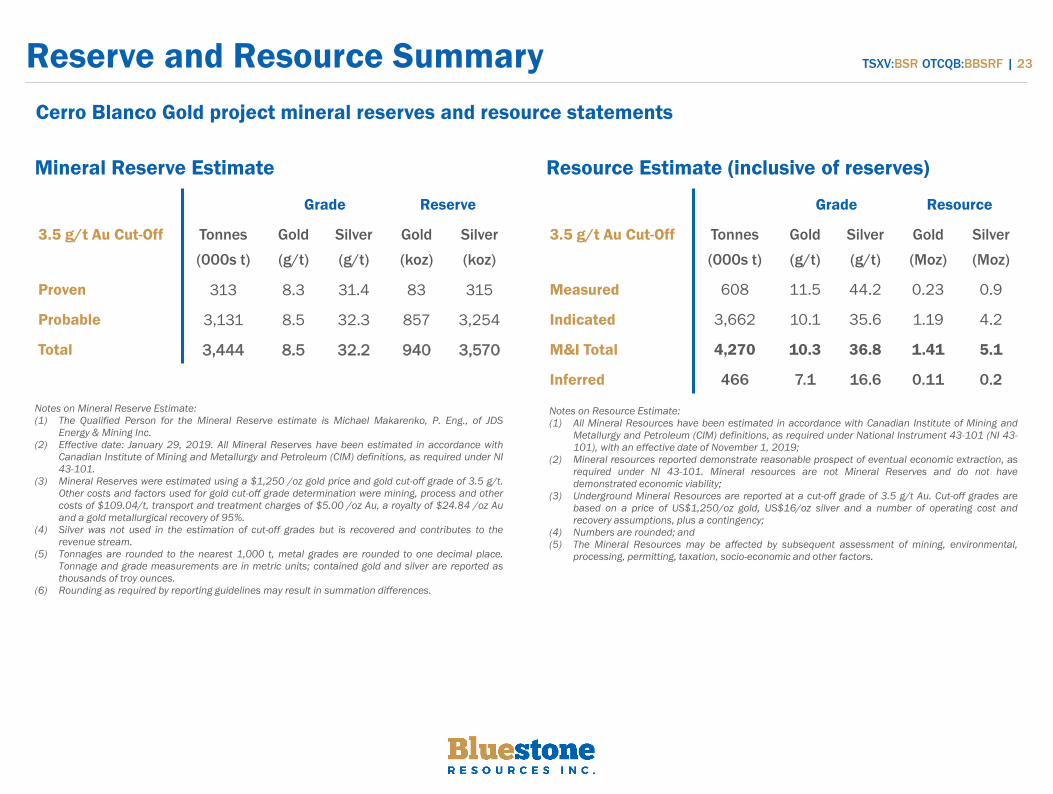
Reserve and Resource Summary
Cerro Blanco Gold project mineral reserves and resource statements
Notes on Mineral Reserve Estimate:
(1) The Qualified Person for the Mineral Reserve estimate is Michael Makarenko, P. Eng., of JDS
Energy & Mining Inc.
(2) Effective date: January 29, 2019. All Mineral Reserves have been estimated in accordance with
Canadian Institute of Mining and Metallurgy and Petroleum (CIM) definitions, as required under NI
43-101.
(3) Mineral Reserves were estimated using a $1,250 /oz gold price and gold cut-off grade of 3.5 g/t.
Other costs and factors used for gold cut-off grade determination were mining, process and other
costs of $109.04/t, transport and treatment charges of $5.00 /oz Au, a royalty of $24.84 /oz Au
and a gold metallurgical recovery of 95%.
(4) Silver was not used in the estimation of cut-off grades but is recovered and contributes to the
revenue stream.
(5) Tonnages are rounded to the nearest 1,000 t, metal grades are rounded to one decimal place.
Tonnage and grade measurements are in metric units; contained gold and silver are reported as
thousands of troy ounces.
(6) Rounding as required by reporting guidelines may result in summation differences.
TSXV:BSR OTCQB:BBSRF | 23
Grade Reserve
3.5 g/t Au Cut-Off Tonnes
(000s t)
Gold
(g/t)
Silver
(g/t)
Gold
(koz)
Silver
(koz)
Proven 313 8.3 31.4 83 315
Probable 3,131 8.5 32.3 857 3,254
Total 3,444 8.5 32.2 940 3,570
Notes on Resource Estimate:
(1) All Mineral Resources have been estimated in accordance with Canadian Institute of Mining and
Metallurgy and Petroleum (CIM) definitions, as required under National Instrument 43-101 (NI 43-
101), with an effective date of November 1, 2019;
(2) Mineral resources reported demonstrate reasonable prospect of eventual economic extraction, as
required under NI 43-101. Mineral resources are not Mineral Reserves and do not have
demonstrated economic viability;
(3) Underground Mineral Resources are reported at a cut-off grade of 3.5 g/t Au. Cut-off grades are
based on a price of US$1,250/oz gold, US$16/oz silver and a number of operating cost and
recovery assumptions, plus a contingency;
(4) Numbers are rounded; and
(5) The Mineral Resources may be affected by subsequent assessment of mining, environmental,
processing, permitting, taxation, socio-economic and other factors.
Mineral Reserve Estimate
Grade Resource
3.5 g/t Au Cut-Off Tonnes
(000s t)
Gold
(g/t)
Silver
(g/t)
Gold
(Moz)
Silver
(Moz)
Measured 608 11.5 44.2 0.23 0.9
Indicated 3,662 10.1 35.6 1.19 4.2
M&I Total 4,270 10.3 36.8 1.41 5.1
Inferred 466 7.1 16.6 0.11 0.2
Resource Estimate (inclusive of reserves)

Contact:
Stephen Williams, P.Eng., MBA
VP Corporate Development & Investor Relations
Email: [email protected]
Phone: +1 (604) 646-4534