Q1 2018 Sales - valeo.com · IFRS 15 Strong basis of comparison in Q1 2017 with: ... +5pts vs IHS...
34
April 25, 2018 Q1 2018 SALES JACQUES ASCHENBROICH – CHAIRMAN & CEO
Transcript of Q1 2018 Sales - valeo.com · IFRS 15 Strong basis of comparison in Q1 2017 with: ... +5pts vs IHS...

April 25, 2018
Q1 2018 SALES
JACQUES ASCHENBROICH – CHAIRMAN & CEO

Valeo has applied IFRS 15 since January 1, 2018, with comparative periods restated.
For the sake of consistency, the first section of this presentation shows first-quarter 2018 sales figures under the sameaccounting principles as in 2017 (i.e., before the application of IFRS 15). First-quarter 2018 sales figures after applying IFRS
15 are then presented on pages 14 to 20.
The impact of IFRS 15 (0.7% of sales) is presented on pages 22 and 23 of this document.
� under IFRS 15, customer contributions to Research and Development (including prototypes), which were previously accounted for as adeduction from “Research and Development expenditure, net”, are now presented in sales under “Miscellaneous”. This reclassification tosales represented a positive amount of 85 million euros for first-quarter 2018 and 83 million euros for first-quarter 2017, and is expected toimpact net Research and Development expenditure as a percentage of sales by 2 percentage points ;
APPLICATION OF THE NEW IFRS 15 STANDARD AS OF JANUARY 1, 2018
April 25, 2018
impact net Research and Development expenditure as a percentage of sales by 2 percentage points ;
� under IFRS 15, the external cost of components imposed by customers (for which Valeo acts as an agent within the meaning of IFRS 15),which was previously accounted for in original equipment sales, is now presented as a deduction from “Raw materials consumed”. Thisreclassification represented a negative amount of 121 million euros for first-quarter 2018 and 107 million euros for first-quarter 2017. Itmainly concerns the Thermal Systems Business Group’s front-end module operations.
In millions of euros
Q1 2018 Q1 2017 Q1 2018/Q1 2017(like for like)
Before IFRS 15 After IFRS 15 Before IFRS 15 After IFRS 15 Non-IFRS 15 IFRS 15
OEM 4,275 4,154 4,174 4,067 +1% 0%
Aftermarket 523 523 487 487 +3% +3%
Miscellaneous 119 204 106 189 -2% +1%
Total 4,917 4,881 4,767 4,743 +1% 0%
2
NON-IFRS 15
April 25, 2018
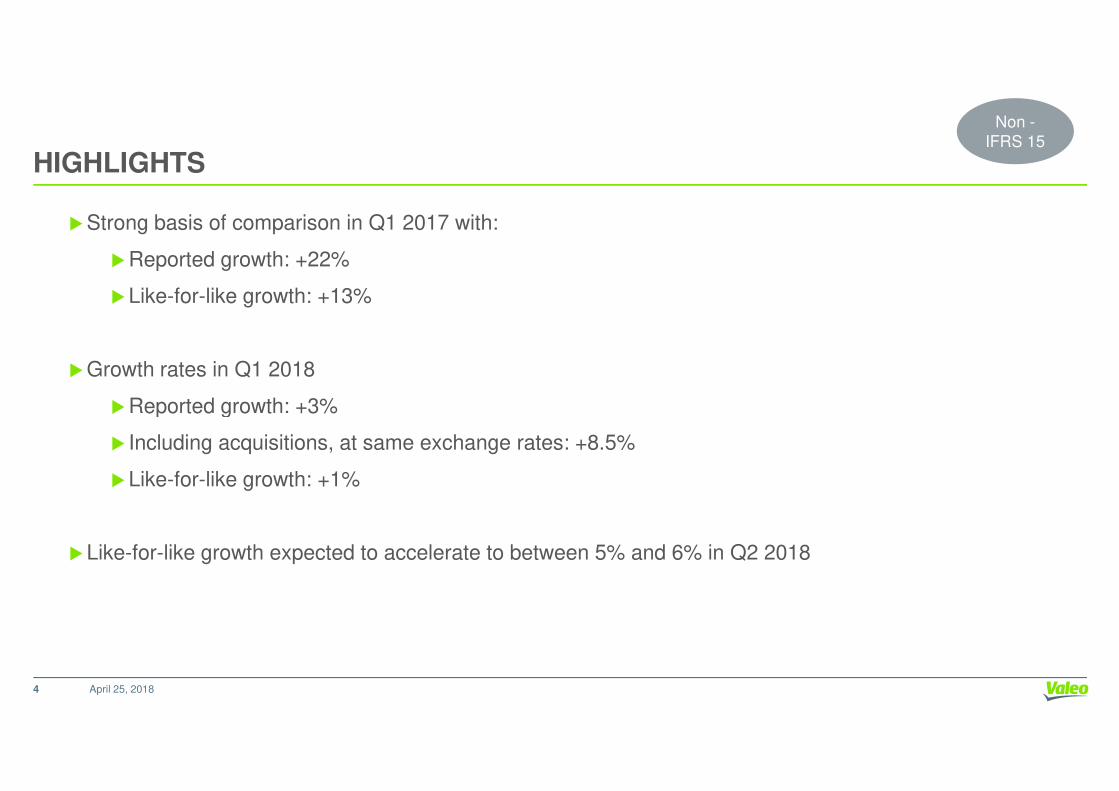
HIGHLIGHTS
Non -
IFRS 15
�Strong basis of comparison in Q1 2017 with:
�Reported growth: +22%
�Like-for-like growth: +13%
�Growth rates in Q1 2018
Reported growth: +3%
April 25, 20184
�Reported growth: +3%
� Including acquisitions, at same exchange rates: +8.5%
�Like-for-like growth: +1%
�Like-for-like growth expected to accelerate to between 5% and 6% in Q2 2018

523
119
+1%+1% +3% -2%Like-for-like
Q1 SALES UP 3% AS REPORTED, UP 8.5% INCL. ACQUISITIONS EXCL. EXCHANGE RATES, UP 1% LIKE FOR LIKESTRONG BASIS OF COMPARISON IN Q1 2017ACCELERATION IN SALES GROWTH IN Q2
Non-
IFRS 15
April 25, 2018
4,2754,917
OEM Aftermarket Miscellaneous Sales
+3%
Q1 2017 4,767
Exchange rates -5.4%
Scope +7.5%
+2%
Q1 2017 4,174
Exchange rates -5.4%
Scope +7.0%
+7%
Q1 2017 487
Exchange rates -5.1%
Scope +9.6%
€m
+12%
Q1 2017 106
Exchange rates -5.7%
Scope +19.9%
Reported
Incl. - 0.3pt impact of South Korea
5

North AmericaOEM sales** +6%
Production*** +4%
Q1
Like-for-like
Europe(1)
North America
49% of Valeo sales(2)
19% of Valeo sales(2)OEM
sales(2)
-2%
OEM
sales(2)
+1%
World
Q1 2018 LIKE-FOR-LIKE OEM SALES OUTPERFORMANCEIN LINE WITH LMC PRODUCTION, INCLUDING -0.3PT IMPACT OF SOUTH KOREA
OEM
sales(2)
+1%
South
Koreanimpact
-0.3pts
Outperformance+1pt vs LMC(3)
+1pt vs IHS(4)
Outperformance-2pts vs LMC(3)
+1pt vs IHS(4)
Outperformance0pts vs LMC(3)
+2pts vs IHS(4)
Non-
IFRS 15
(1) Europe including Africa; Asia including Middle East
(2) Valeo OEM sales by destination(3) LMC estimates released on April 10, 2018 – light vehicle production(4) IHS estimates released on April 16, 2018 – light vehicle production
Asia(1) excl. China
South America
17% of Valeo sales(2)
2% of Valeo sales(2)
OEM
sales(2)
+4%
OEM
sales(2)
+29%
13% of Valeo sales(2)
OEM
sales(2)
-3%
China
April 25, 2018
South
Koreanimpact
-2.0pts
+1pt vs IHS(4)
Outperformance+18pts vs LMC(3)
+17pts vs IHS(4)
Outperformance+1pt vs LMC(3)
+3pts vs IHS(4)
Outperformance-2pts vs LMC(3)
0pts vs IHS(4)
6
Japan
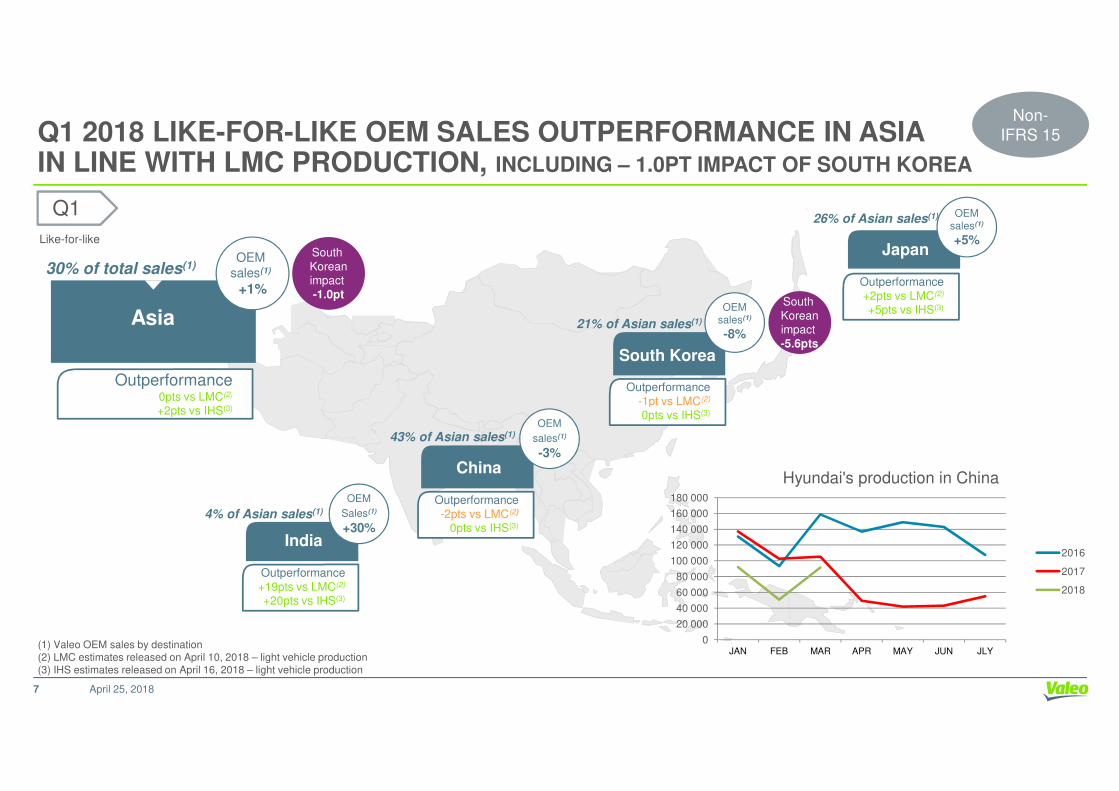
26% of Asian sales(1)
South Korea
21% of Asian sales(1)
OEM sales(1)
+5%
Q1
Like-for-like
Asia
30% of total sales(1)
Q1 2018 LIKE-FOR-LIKE OEM SALES OUTPERFORMANCE IN ASIAIN LINE WITH LMC PRODUCTION, INCLUDING – 1.0PT IMPACT OF SOUTH KOREA
OEM
sales(1)
+1%
South
Koreanimpact
-1.0ptOEM
sales(1)
-8%
South
Koreanimpact
-5.6pts
Outperformance0pts vs LMC(2)
Outperformance
-1pt vs LMC(2)
Outperformance
+2pts vs LMC(2)
+5pts vs IHS(3)
Non-
IFRS 15
India
4% of Asian sales(1)
China
43% of Asian sales(1)
OEM
Sales(1)
+30%
(1) Valeo OEM sales by destination(2) LMC estimates released on April 10, 2018 – light vehicle production(3) IHS estimates released on April 16, 2018 – light vehicle production
OEM
sales(1)
-3%
April 25, 2018
0pts vs LMC(2)
+2pts vs IHS(3)
Outperformance
+19pts vs LMC(2)
+20pts vs IHS(3)
Outperformance
-2pts vs LMC(2)
0pts vs IHS(3)
-1pt vs LMC(2)
0pts vs IHS(3)
7
0
20 000
40 000
60 000
80 000
100 000
120 000
140 000
160 000
180 000
JAN FEB MAR APR MAY JUN JLY
Hyundai's production in China
2016
2017
2018
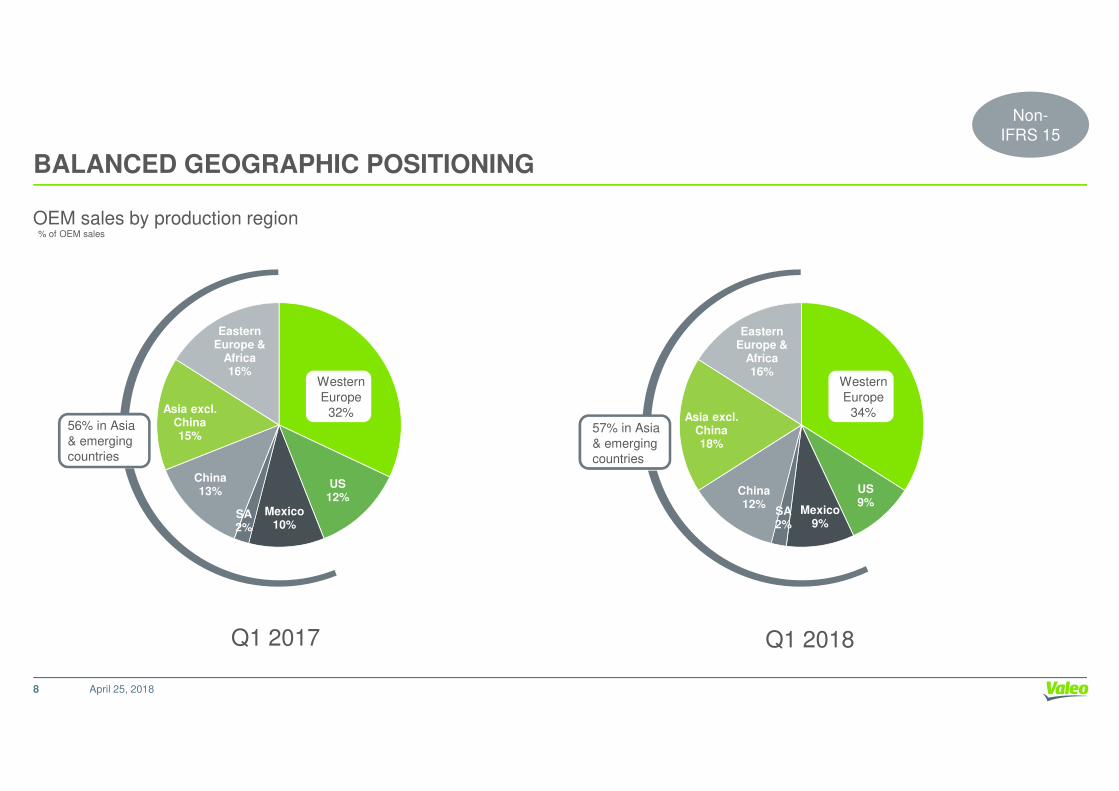
BALANCED GEOGRAPHIC POSITIONING
Eastern Europe &
Africa16%
Western
Europe
OEM sales by production region
Eastern Europe &
Africa16%
Western
Europe
% of OEM sales
Non-
IFRS 15
April 25, 2018
Q1 2018
US9%
Mexico9%
SA 2%
China12%
Asia excl. China18%
Europe
34%
Q1 2017
US12%
Mexico10%
SA 2%
China13%
Asia excl. China15%
Europe
32%56% in Asia
& emerging
countries
57% in Asia
& emerging
countries
8

A DIVERSE CUSTOMER PORTFOLIO
French* 15%
Other6%
German**
28%
% of OEM sales
French* 15%
Other6%
German**
28%
Non-
IFRS 15
April 25, 2018
Asian**26%
American18%
Q1 2018Q1 2017
* Including Opel**Excluding Opel
Asian
33%Asian**
26%
American19%
Asian
32%
9
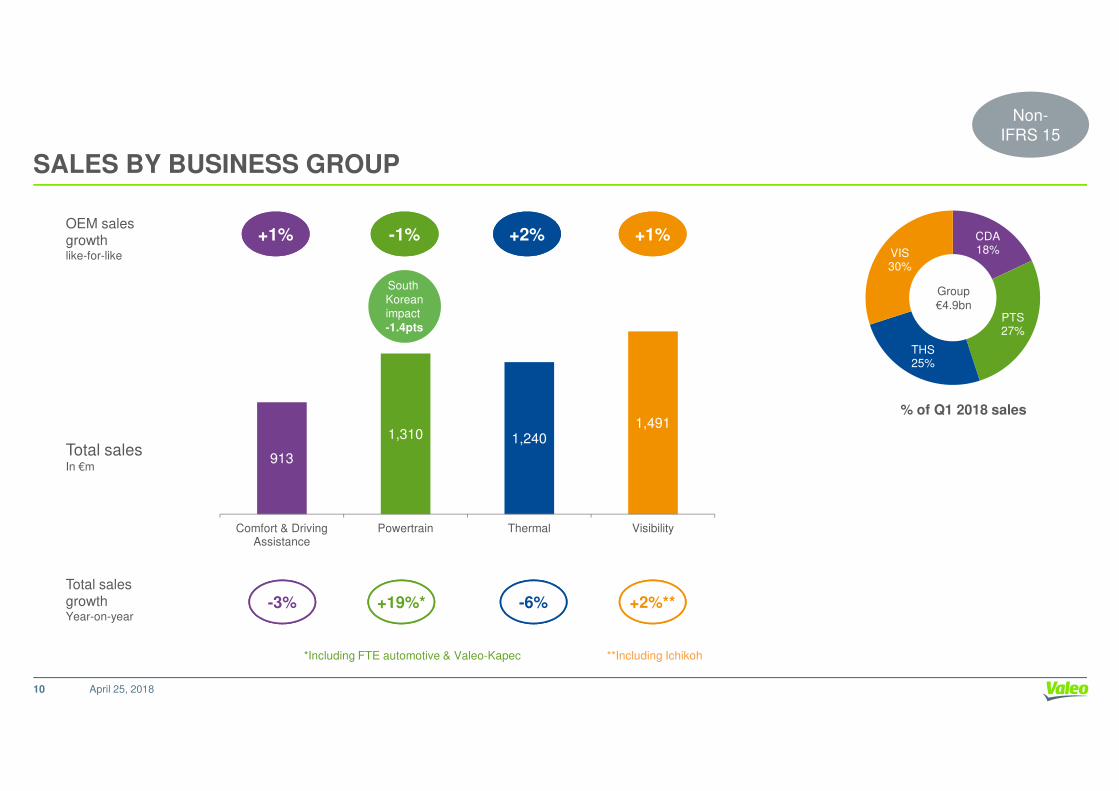
SALES BY BUSINESS GROUP
CDA 18%
PTS27%
THS25%
VIS30%
Group
€4.9bn
OEM sales growthlike-for-like
+1% -1% +2% +1%
South
Koreanimpact
-1.4pts
Non-
IFRS 15
April 25, 2018
*Including FTE automotive & Valeo-Kapec **Including Ichikoh
% of Q1 2018 sales
913
1,310 1,2401,491
Comfort & Driving Assistance
Powertrain Thermal Visibility
Total sales In €m
-3% +19%* -6% +2%**Total salesgrowth Year-on-year
10

OUTLOOK: FEBRUARY 2018 GUIDANCE CONFIRMED
April 25, 2018

FEBRUARY 2018 GUIDANCE CONFIRMED
Based on the following assumptions:
�an increase in global automotive production of 1.5% in 2018;
� raw material prices and exchange rates in line with those of February 2018 levels.
The Valeo Group confirms its objectives:
April 25, 2018
The Valeo Group confirms its objectives:
�nominal sales growth of around 8% for 2018;
� like-for-like growth in original equipment sales of:
�between 5% and 6% in the second quarter,
�around 5% in 2018, accelerating in the second half ahead of expected double-digit growth in 2019;
� in 2018, operating margin excluding share in net earnings of equity-accounted companies (as a % of sales) in line with 2017.
12
VALEO SIEMENS EAUTOMOTIVE
�Valeo Siemens eAutomotive had a strong order intake of 6.1 billion euros in 2017 and a cumulative10 billion euros at end-February 2018;
� to accommodate its fast-paced expansion going forward, Valeo Siemens eAutomotive will bear the costsrequired to push ahead with ongoing projects and structure its organization. Accordingly, the “Share in netearnings of equity-accounted companies” caption will have an impact of around -0.2 points on Valeo’sstatement of income in 2018.
April 25, 2018
Medium-term objectives:
By 2022, Valeo Siemens eAutomotive should be delivering:
� sales of more than 2 billion euros,
� a similar EBITDA margin (as a % of sales) to that of Valeo.
13

IFRS 15
April 25, 2018

523
204
+0%+0% +3% +1%Like-for-like
Q1 SALES UP 3% AS REPORTED, UP 7.6% INCL. ACQUISITIONS EXCL. EXCHANGE
RATES, UP 0% LIKE FOR LIKESTRONG BASIS OF COMPARISON IN Q1 2017ACCELERATION IN SALES GROWTH IN Q2
IFRS 15
April 25, 2018
4,1544,881
OEM Aftermarket Miscellaneous Sales
+3%
Q1 2017 4,743
Exchange rates -5.1%
Scope +7.6%
+2%
Q1 2017 4,067
Exchange rates -5.2%
Scope +7.2%
+7%
Q1 2017 487
Exchange rates -5.1%
Scope +9.6%
€m
+8%
Q1 2017 189
Exchange rates -4.2%
Scope +11.6%
Reported
Incl. - 0.3pt impact of South Korea
15

North AmericaOEM sales** +6%
Production*** +4%
Q1
Like-for-like
Europe(1)
North America
50% of Valeo sales(2)
17% of Valeo sales(2)OEM
sales(2)
-4%
OEM
sales(2)
+1%
World
-1 POINT LIKE-FOR-LIKE OEM SALES OUTPERFORMANCEVS LMC PRODUCTION, INCLUDING -0.3PT IMPACT OF SOUTH KOREA
OEM
sales(2)
+0%
South
Koreanimpact
-0.3pts
Outperformance-1pt vs LMC(3)
-1pt vs IHS(4)
Outperformance-2pts vs LMC(3)
+1pt vs IHS(4)
Outperformance-1pt vs LMC(3)
+1pt vs IHS(4)
IFRS 15
Asia(1) excl. China
South America
18% of Valeo sales(2)
3% of Valeo sales(2)
OEM
sales(2)
+3%
OEM
sales(2)
+28%
12% of Valeo sales(2)
OEM
sales(2)
-4%
China
April 25, 2018
South
Koreanimpact
-2.0pts
-1pt vs IHS(4)
Outperformance+17pts vs LMC(3)
+16pts vs IHS(4)
Outperformance0pts vs LMC(3)
+2pts vs IHS(4)
Outperformance-3pts vs LMC(3)
-1pt vs IHS(4)
16
(1) Europe including Africa; Asia including Middle East
(2) Valeo OEM sales by destination(3) LMC estimates released on April 10, 2018 – light vehicle production(4) IHS estimates released on April 16, 2018 – light vehicle production

Japan
26% of Asian sales(1)
South Korea
22% of Asian sales(1)
OEM sales(1)
+4%
Q1Like-for-like
Asia
30% of total sales(1)
-1 POINT LIKE-FOR-LIKE OUTPERFORMANCE IN ASIAVS LMC PRODUCTION, INCLUDING – 1.0PT IMPACT OF SOUTH KOREA
OEM
sales(1)
+0%
South
Koreanimpact
-1.0ptOEM
sales(1)
-8%
South
Koreanimpact
-5.6pts
Outperformance-1pt vs LMC(2)
Outperformance
-1pt vs LMC(2)
Outperformance
+1pt vs LMC(2)
+4pts vs IHS(3)
IFRS 15
India
4% of Asian sales(1)
China
42% of Asian sales(1)
OEM
sales(1)
+30%
OEM sales(1)
-4%
April 25, 2018
-1pt vs LMC(2)
+1pt vs IHS(3)
Outperformance
+19pts vs LMC(2)
+20pts vs IHS(3)
Outperformance
-3pts vs LMC(2)
-1pt vs IHS(3)
-1pt vs LMC(2)
0pts vs IHS(3)
17
(1) Valeo OEM sales by destination(2) LMC estimates released on April 10, 2018 – light vehicle production(3) IHS estimates released on April 16, 2018 – light vehicle production
0
20 000
40 000
60 000
80 000
100 000
120 000
140 000
160 000
180 000
JAN FEB MAR APR MAY JUN JLY
Hyundai's production in China
2016
2017
2018

BALANCED GEOGRAPHIC POSITIONING
Eastern Europe &
Africa16%
Western
Europe
OEM sales by production region
Eastern Europe &
Africa16%
Western
Europe
% of OEM sales
IFRS 15
April 25, 2018
Q1 2018
US8%Mexico
9%SA 2%
China12%
Asia excl. China18%
Europe
35%
Q1 2017
US10%
Mexico10%
SA 2%
China14%
Asia excl. China15%
Europe
33%57% in Asia
& emerging
countries
57% in Asia
& emerging
countries
18

A DIVERSE CUSTOMER PORTFOLIO
French* 15%
Other6%
German**
29%
% of OEM sales
French* 15%
Other6%
German**
29%
IFRS 15
April 25, 2018
Asian**26%
American18%
Q1 2018Q1 2017
* Including Opel**Excluding Opel
Asian
32%Asian**
26%
American20%
Asian
30%
19

SALES BY BUSINESS GROUP
CDA 19%
PTS27%
THS23%
VIS31%
Group
€4.9bn
% of Q1 2018 sales
OEM sales growthlike-for-like
+1% -1% -1% +1%
South
Koreanimpact
-1.4pts
IFRS 15
April 25, 2018
% of Q1 2018 sales
938
1,3261,140
1,514
Comfort & Driving Assistance
Powertrain Thermal Visibility
Total sales In €m
-3% +19%* -7% +2%**Total salesgrowth Year-on-year
20
*Including FTE automotive & Valeo-Kapec **Including Ichikoh

BACK-UP
April 25, 2018

2017 QUARTERLY INFORMATION - SALES BY TYPE (IN €M)
� As reported during fiscal year 2017
Sales by type (IFRS 15 pro forma)
Q1-17 Q2-17 Q3-17 Q4-17 FY 17
Original Equipment 4,174 4,061 3,751 4,134 16,120
Aftermarket 487 476 446 478 1,887
Miscellaneous 106 160 104 173 543
Total sales 4,767 4,697 4,301 4,785 18,550
� Sales by type (IFRS 15 pro forma)
� Restatement by quarter
Q1-17 Q2-17 Q3-17 Q4-17 FY 17*
Original Equipment 4,067 3,960 3,648 4,021 15,696
Aftermarket 487 476 446 478 1,887
Miscellaneous 189 254 175 283 901
Total sales 4,743 4,690 4,269 4,782 18,484
April 25, 201822
Q1-17 Q2-17 Q3-17 Q4-17 FY 17
Total sales -24 -7 -32 -3 -66
*2017 data restated (unaudited)

� As reported during fiscal year 2017
Sales by segment (IFRS 15 pro forma)
2017 QUARTERLY INFORMATION - SALES BY SEGMENT (IN €M)
Q1-17 Q2-17 Q3-17 Q4-17 FY 17
Comfort & Driving Assistance Systems 938 899 859 894 3,590
Powertrain Systems 1,105 1,058 963 1,174 4,300
Thermal Systems 1,312 1,282 1,157 1,252 5,003
Visibility Systems 1,458 1,495 1,355 1,500 5,808
Total sales 4,767 4,697 4,301 4,785 18,550
� Sales by segment (IFRS 15 pro forma)
� Restatement by quarter
April 25, 201823
Q1-17 Q2-17 Q3-17 Q4-17 FY 17*
Comfort & Driving Assistance Systems 962 927 878 932 3,699
Powertrain Systems 1,117 1,072 972 1,190 4,351
Thermal Systems 1,224 1,201 1,070 1,167 4,662
Visibility Systems 1,485 1,529 1,381 1,526 5,921
Total sales 4,743 4,690 4,269 4,782 18,484
Q1-17 Q2-17 Q3-17 Q4-17 FY 17
Total sales -24 -7 -32 -3 -66
*2017 data restated (unaudited)

VALEOAN ORGANIZATIONAL STRUCTURE BUILT ON FOUR MARKET-LEADING, HIGH-GROWTH POTENTIAL BUSINESS GROUPS
April 20182424
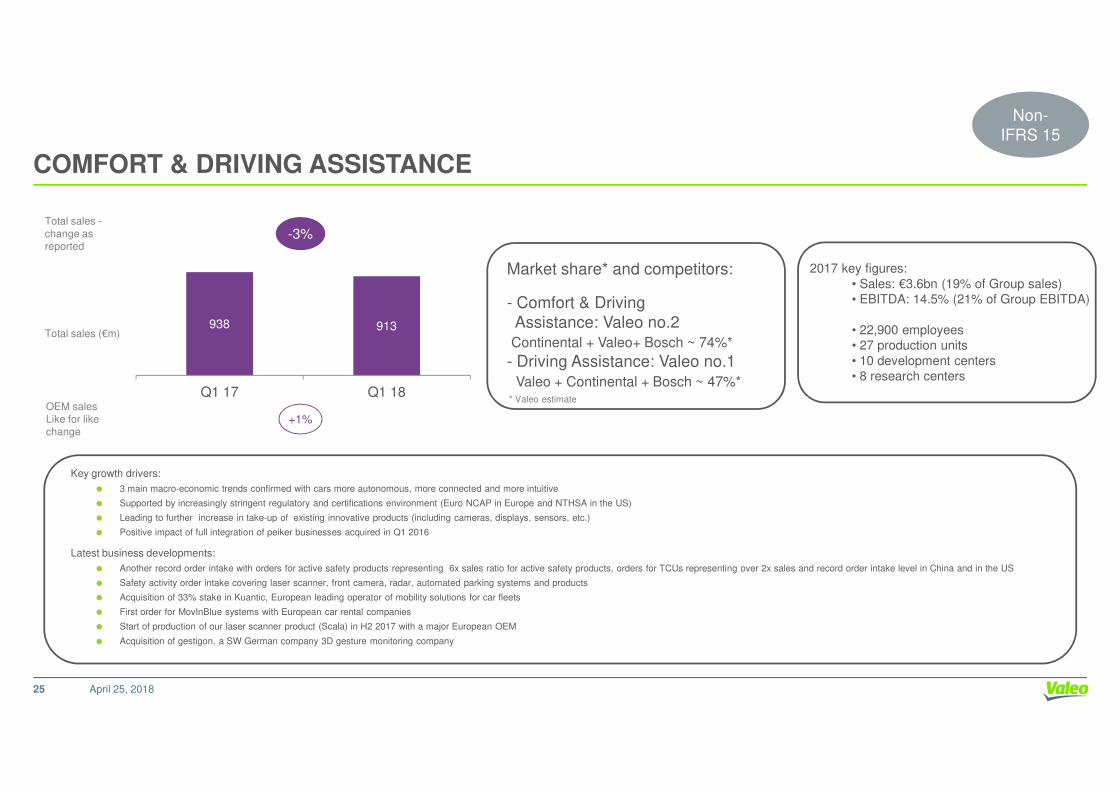
COMFORT & DRIVING ASSISTANCE
2017 key figures:
• Sales: €3.6bn (19% of Group sales)
• EBITDA: 14.5% (21% of Group EBITDA)
• 22,900 employees
• 27 production units
• 10 development centers
• 8 research centers
* Valeo estimate
Total sales (€m)
Total sales -change asreported
Market share* and competitors:
- Comfort & Driving
Assistance: Valeo no.2Continental + Valeo+ Bosch ~ 74%*
- Driving Assistance: Valeo no.1
Valeo + Continental + Bosch ~ 47%*
938 913
Q1 17 Q1 18
-3%
Non-
IFRS 15
April 25, 2018
* Valeo estimateOEM sales Like for likechange
Q1 17 Q1 18
+1%
Key growth drivers:
� 3 main macro-economic trends confirmed with cars more autonomous, more connected and more intuitive
� Supported by increasingly stringent regulatory and certifications environment (Euro NCAP in Europe and NTHSA in the US)
� Leading to further increase in take-up of existing innovative products (including cameras, displays, sensors, etc.)
� Positive impact of full integration of peiker businesses acquired in Q1 2016
Latest business developments:
� Another record order intake with orders for active safety products representing 6x sales ratio for active safety products, orders for TCUs representing over 2x sales and record order intake level in China and in the US
� Safety activity order intake covering laser scanner, front camera, radar, automated parking systems and products
� Acquisition of 33% stake in Kuantic, European leading operator of mobility solutions for car fleets
� First order for MovInBlue systems with European car rental companies
� Start of production of our laser scanner product (Scala) in H2 2017 with a major European OEM
� Acquisition of gestigon, a SW German company 3D gesture monitoring company
25

POWERTRAIN SYSTEMS
2017 key figures:
• Sales: €4.3bn (23% of Group sales)
• EBITDA: 13.2% (23% of Group EBITDA)
• 25,000 employees
• 55 production units
• 13 development centers
• 7 research centers
*Valeo estimate
Total sales (€m)
OEM sales Like for like
Total sales -change asreported Market share* and competitors:
- Electrical Systems: Valeo no.1Valeo + Denso + Bosch/ZMJ ~ 70%*
- Transmission Systems: Valeo no.2Luk + Valeo + Exedy + ZF Sachs ~ 75%*
1,1051,310
Q1 17 Q1 18
+19%
-1%
Non-
IFRS 15
April 25, 2018
Key growth drivers: Objective of reducing CO2 emissions and fossil fuel consumption through 3 priorities for engines:� Downsizing/downspeeding
� Gearbox automation
� Powertrain electrification and development of low (12V, 48V) and high voltage
Latest business developments:� Major contracts won by the Valeo Siemens eAutomotive joint venture in Europe and China for the electric and hybrid vehicles
� Significant contract for torque converters in North America and Asia
� New contracts for 48 V and Istars
� Acquisition of FTE automotive, effective November 1, 2017
� Creation of Valeo-Kapec joint venture with Korean partner PHC, effective December 1, 2017
Like for likechange
-1%
26

THERMAL SYSTEMS
2017 key figures:
• Sales: €5.0bn (27% of Group sales)
• EBITDA: 10.8% (22% of Group EBITDA)
• 24,200 employees
• 62 production units
• 10 development centers
• 3 research centers
*Valeo estimate
Total sales (€m)
OEM sales Like for like
Total sales -change asreported
Market share* and competitors:
Thermal Systems: Valeo no.2Denso + Valeo + Hanon + Mahle ~ 54%*
1,3121,240
Q1 17 Q1 18
-6%
+2%
Non-
IFRS 15
April 25, 2018
Key growth drivers:
� Innovative solutions to comply with new regulations on gas pollutants and fuel consumption
� Thermal solutions for Electrified vehicles (PHEV/EV)
� Innovative solutions for in-vehicle air quality management
Latest business developments: New contracts with major automakers worldwide took Thermal Systems order intake for 2017 to an all-time high, above 2016 figuresEspecially in Europe and China, with several awards from German automakers
� New order for heat pump system with production in China
� New order for electrical driven compressor with production in China. With these orders, Valeo is demonstrating its capability for advanced technology in this field
� New order on HVAC for electric vehicles with Valeo brushless motor and high voltage PTC
� New orders on air quality with Chinese automakers
� First order on Valeo brushless motor for fan system
� Intensive development plans with many customers on future generations of electric vehicles, to optimize the size, performance and cost of future solutions
Like for likechange
+2%
27

VISIBILITY SYSTEMS
2017 key figures:
• Sales: €5.8bn (31% of Group sales)
• EBITDA: 13.2% (32% of Group EBITDA)
• 37,200 employees
• 49 production units
• 15 development centers
• 5 research centers
*Valeo estimate
Total sales (€m)
OEM sales Like for likechange
Total sales -change asreported
Market share* and competitors:
- Lighting Systems: Valeo no.1Valeo + Koito + Magnetti Marelli ~ 58%*
- Wiper Systems: Valeo no.1Valeo + Denso + Bosch ~ 67%*
1,458 1,491
Q1 17 Q1 18
+2%
+1%
Non-
IFRS 15
April 25, 2018
Key growth drivers:� Consolidation of Ichikoh group in Visibility since February 2017
� Increasing LED take rate, in particular in the B&C Segment with PSA (Crossland X, 3008 & 5008), Volkswagen (Passat, Polo), Audi A3, Seat (Leon, Ibiza, Ateca, Arona), Renault (Megane,
Talisman) and Geely (Boyue)
� Increasing LED content with ADB on premium vehicles with BMW, Volvo and Volkswagen (Arteon) and the Laser on JLR Velar
Latest business developments:� Continued increase in order intake for LEDs in North America (Dodge RAM, GM T1 facelift) and with ADB in Europe (VW Golf & T6, Audi A3, Renault XFD2) and China (VW Passat, Geely
platforms)
� Growth in interior lighting business; selective zoning with Daimler and RGB ambient with Volvo
� Award of Fusion/Mondeo and introduction of Aquablade for Mondeo/S-Max/Galaxy confirms strategic alignment with Ford
� 4-poles electronized motors perceived as competitive in the market
� Interest for brushless motor is growing, especially for electrical vehicles
� Growing interest on sensor cleaning activity
change
28

QUARTERLY INFORMATION (IN €M)
� Sales by segment
Q1-14 Q2-14 Q3-14 Q4-14 Q1-15 Q2-15 Q3-15 Q4-15 Q1-16 Q2-16 Q3-16 Q4-16 Q1-17 Q2-17 Q3-17 Q4-17 Q1 18
Comfort & Driving
Assistance Systems552 572 573 614 657 679 663 721 794 866 825 877 938 899 859 894 913
Powertrain
Systems848 848 798 843 948 978 877 959 983 1,028 966 1,051 1,105 1,058 963 1,174 1,310
Thermal Systems 880 934 889 934 1,007 1,039 992 1,036 1,063 1,186 1,140 1,255 1,312 1,282 1,157 1,252 1,240
Visibility Systems 876 925 856 957 1,022 1,072 967 1,124 1,119 1,176 1,102 1,252 1,458 1,495 1,355 1,500 1,491
Non-
IFRS 15
� Sales by type
Q1-14 Q2-14 Q3-14 Q4-14 Q1-15 Q2-15 Q3-15 Q4-15 Q1-16 Q2-16 Q3-16 Q4-16 Q1-17 Q2-17 Q3-17 Q4-17 Q1 18
Original Equipment 2,677 2,755 2,644 2,814 3,113 3,203 2,990 3,294 3,437 3,669 3,472 3,822 4,174 4,061 3,751 4,134 4,275
Aftermarket 376 377 366 376 400 413 387 399 411 434 417 417 487 476 446 478 523
Miscellaneous 59 103 59 119 68 101 72 104 69 110 105 156 106 160 104 173 119
Total sales 3,112 3,235 3,069 3,309 3,581 3,717 3,449 3,797 3,917 4,213 3,994 4,395 4,767 4,697 4,301 4,785 4,917
Total sales 3,112 3,235 3,069 3,309 3,581 3,717 3,449 3,797 3,917 4,213 3,994 4,395 4,767 4,697 4,301 4,785 4,917
April 25, 201829
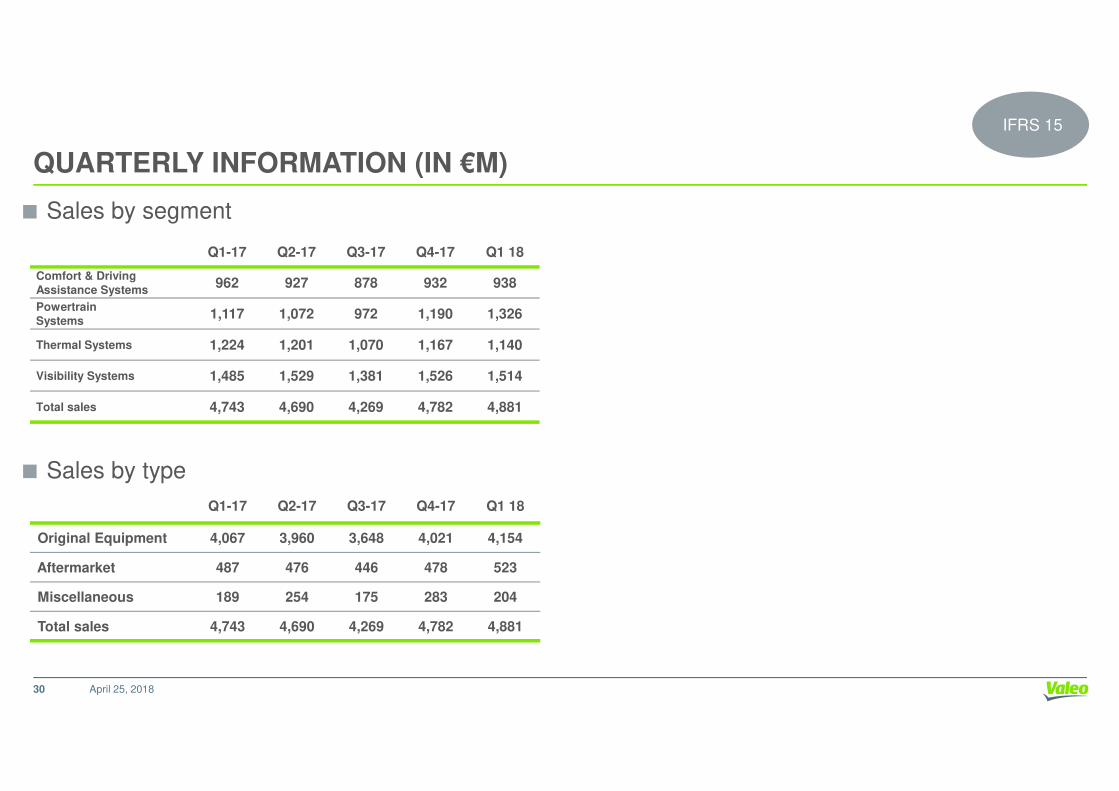
QUARTERLY INFORMATION (IN €M)
� Sales by segment
Q1-17 Q2-17 Q3-17 Q4-17 Q1 18
Comfort & Driving
Assistance Systems962 927 878 932 938
Powertrain
Systems1,117 1,072 972 1,190 1,326
Thermal Systems 1,224 1,201 1,070 1,167 1,140
Visibility Systems 1,485 1,529 1,381 1,526 1,514
IFRS 15
� Sales by type
Q1-17 Q2-17 Q3-17 Q4-17 Q1 18
Original Equipment 4,067 3,960 3,648 4,021 4,154
Aftermarket 487 476 446 478 523
Miscellaneous 189 254 175 283 204
Total sales 4,743 4,690 4,269 4,782 4,881
Total sales 4,743 4,690 4,269 4,782 4,881
April 25, 201830
CONTACTS
Investor Relations
Thierry Lacorre43, rue BayenF-75848 Paris Cedex 17
April 25, 2018
F-75848 Paris Cedex 17France
Tel.: +33 (0) 1.40.55.37.93Fax: +33 (0) 1.40.55.20.40E-mail: [email protected]
Website: www.valeo.com
31

SHARE INFORMATION
Share Data
• Bloomberg Ticker
• Reuters Ticker• ISIN Number• Shares outstanding as of March 30, 2018
FR FPVLOF.PAFR 0013176526
239,653,121
April 25, 2018
ADR Data
• Ticker/Trading Symbol
• CUSIP Number• Exchange• Ratio (ADR: ord)• Depositary Bank
• Contact at J.P. Morgan – ADR broker relationship desk
VLEEY919134304OTC
1:2J.P. MorganJim Reeves
+1 212-622-2710
32
SAFE HARBOR STATEMENT
Statements contained in this document, which are not historical fact, constitute “forward-looking statements”. These statements include
projections and estimates and their underlying assumptions, statements regarding projects, objectives, intentions and expectations with
respect to future financial results, events, operations, services, product development and potential, and statements regarding future
performance. Even though Valeo’s Management feels that the forward-looking statements are reasonable as at the date of this document,investors are put on notice that the forward-looking statements are subject to numerous factors, risks and uncertainties that are difficult to
predict and generally beyond Valeo’s control, which could cause actual results and events to differ materially from those expressed or
projected in the forward-looking statements. Such factors include, among others, the Company’s ability to generate cost savings or
manufacturing efficiencies to offset or exceed contractually or competitively required price reductions. The risks and uncertainties to which
April 25, 201833
manufacturing efficiencies to offset or exceed contractually or competitively required price reductions. The risks and uncertainties to whichValeo is exposed mainly comprise the risks resulting from the investigations currently being carried out by the antitrust authorities as
identified in the Registration Document, risks which relate to being a supplier in the automotive industry and to the development of new
products and risks due to certain global and regional economic conditions. Also included are environmental and industrial risks as well as
risks and uncertainties described or identified in the public documents submitted by Valeo to the French financial markets authority (Autorité
des marchés financiers – AMF), including those set out in the “Risk factors” section of the 2017 Registration Document registered with the
AMF on March 29, 2018 (under number D.18-0208).
The Company assumes no responsibility for any analyses issued by analysts and any other information prepared by third parties which may
be used in this document. Valeo does not intend or assume any obligation to review or to confirm the estimates of analysts or to update any
forward-looking statements to reflect events or circumstances which occur subsequent to the date of this document.