Q1 2017 U.S. Multifamily MarketView Snapshot FIGURES · • Overall, there was no year-over-year...
7
U.S. MULTIFAMILY MARKETVIEW SNAPSHOT FIGURES Q1 2017
Transcript of Q1 2017 U.S. Multifamily MarketView Snapshot FIGURES · • Overall, there was no year-over-year...

U.S. MULTIFAMILYMARKETVIEW SNAPSHOTFIGURES
Q1 2017

2 U.S. MULTIFAMILY MARKETVIEW SNAPSHOT | Q1 2017 FIGURESCBRE RESEARCH
U.S. MULTIFAMILY MARKETVIEW Q1 2017MULTIFAMILY ABSORPTION MAINTAINS HIGH LEVELS
• Net absorption of multifamily units totaled 30,500 in Q1 and 208,700 over the year ending Q1, reflecting sustained favorable multifamily demand.
• The relatively healthy U.S. economy and job growth have helped boost consumer confidence and household formation. While some millennials are moving out of multifamily rentals into homeownership, those who are under 30 years old (50%) remain a prime rental cohort.
• The leading U.S. metros for Q1 net absorption were New York (6,400 units), San Francisco Bay area (3,600), Washington, D.C. (3,400), Phoenix (3,300) and Seattle (2,600).
Arrows indicate change from previous year.*Total past four quarters.
Vacancy Rate4.9%
Rentable Completions*252,100 Units
Net Absorption*208,700 Units
Acquisitions Volume*$146 Billion
3 U.S. MULTIFAMILY MARKETVIEW SNAPSHOT | Q1 2017 FIGURESCBRE RESEARCH
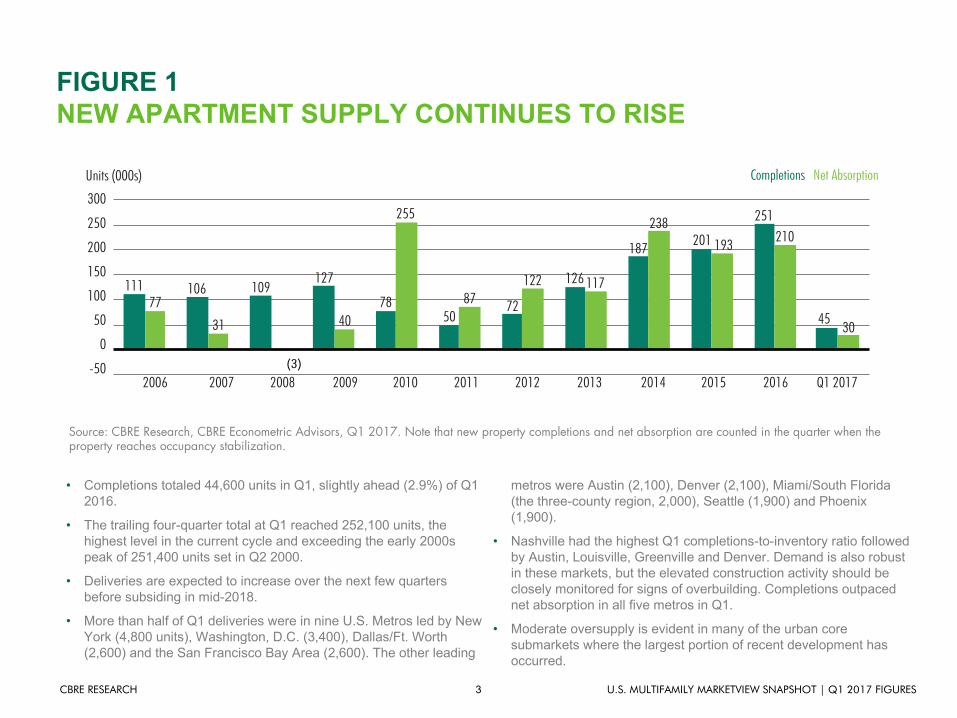
FIGURE 1NEW APARTMENT SUPPLY CONTINUES TO RISE
• Completions totaled 44,600 units in Q1, slightly ahead (2.9%) of Q1 2016.
• The trailing four-quarter total at Q1 reached 252,100 units, the highest level in the current cycle and exceeding the early 2000s peak of 251,400 units set in Q2 2000.
• Deliveries are expected to increase over the next few quarters before subsiding in mid-2018.
• More than half of Q1 deliveries were in nine U.S. Metros led by New York (4,800 units), Washington, D.C. (3,400), Dallas/Ft. Worth (2,600) and the San Francisco Bay Area (2,600). The other leading
metros were Austin (2,100), Denver (2,100), Miami/South Florida (the three-county region, 2,000), Seattle (1,900) and Phoenix (1,900).
• Nashville had the highest Q1 completions-to-inventory ratio followed by Austin, Louisville, Greenville and Denver. Demand is also robust in these markets, but the elevated construction activity should be closely monitored for signs of overbuilding. Completions outpaced net absorption in all five metros in Q1.
• Moderate oversupply is evident in many of the urban core submarkets where the largest portion of recent development has occurred.
Source: CBRE Research, CBRE Econometric Advisors, Q1 2017. Note that new property completions and net absorption are counted in the quarter when the property reaches occupancy stabilization.
Units (000s) Completions Net Absorption
(3)
300
250
50
100
150
200
-502006 2007 2008 2009 2010 2011 2012 2013 2014 2015 2016 Q1 2017
45
251
193201238
187
117126122
7287
255
7840
127109106111
3177
50
210
300
4 U.S. MULTIFAMILY MARKETVIEW SNAPSHOT | Q1 2017 FIGURESCBRE RESEARCH
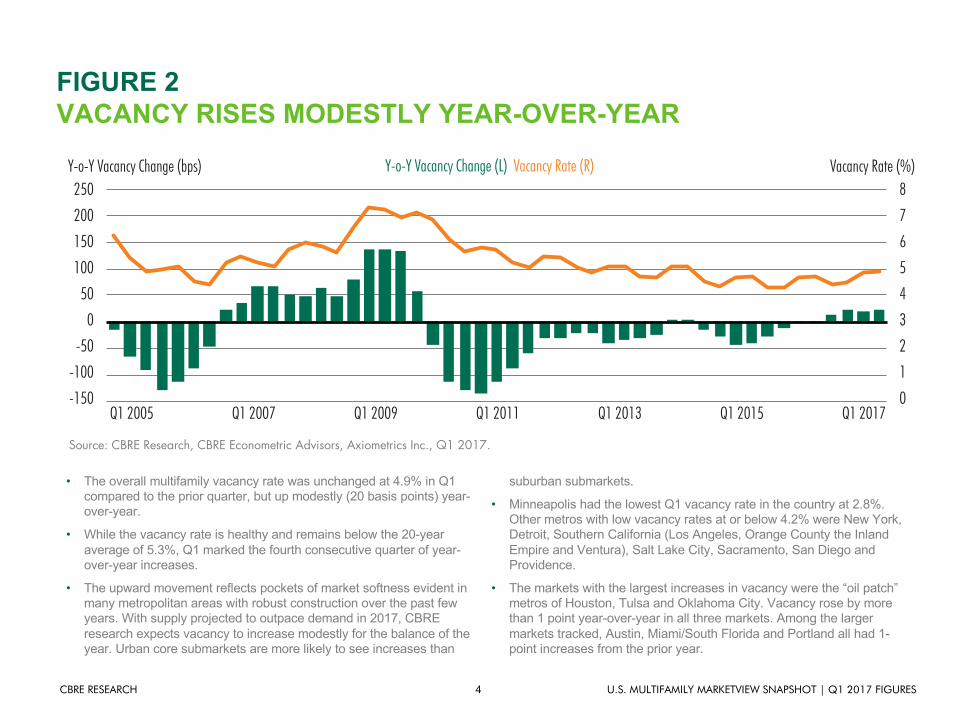
FIGURE 2VACANCY RISES MODESTLY YEAR-OVER-YEAR
• The overall multifamily vacancy rate was unchanged at 4.9% in Q1 compared to the prior quarter, but up modestly (20 basis points) year-over-year.
• While the vacancy rate is healthy and remains below the 20-year average of 5.3%, Q1 marked the fourth consecutive quarter of year-over-year increases.
• The upward movement reflects pockets of market softness evident in many metropolitan areas with robust construction over the past few years. With supply projected to outpace demand in 2017, CBRE research expects vacancy to increase modestly for the balance of the year. Urban core submarkets are more likely to see increases than
suburban submarkets.
• Minneapolis had the lowest Q1 vacancy rate in the country at 2.8%. Other metros with low vacancy rates at or below 4.2% were New York, Detroit, Southern California (Los Angeles, Orange County the Inland Empire and Ventura), Salt Lake City, Sacramento, San Diego and Providence.
• The markets with the largest increases in vacancy were the “oil patch” metros of Houston, Tulsa and Oklahoma City. Vacancy rose by more than 1 point year-over-year in all three markets. Among the larger markets tracked, Austin, Miami/South Florida and Portland all had 1-point increases from the prior year.
Source: CBRE Research, CBRE Econometric Advisors, Axiometrics Inc., Q1 2017.
Y-o-Y Vacancy Change (bps) Vacancy Rate (%)Y-o-Y Vacancy Change (L) Vacancy Rate (R)250 8
4
6
2
7
3
5
10
200
100
0
-100
150
50
-50
-150Q1 2017Q1 2005 Q1 2007 Q1 2009 Q1 2011 Q1 2013 Q1 2015
5 U.S. MULTIFAMILY MARKETVIEW SNAPSHOT | Q1 2017 FIGURESCBRE RESEARCH
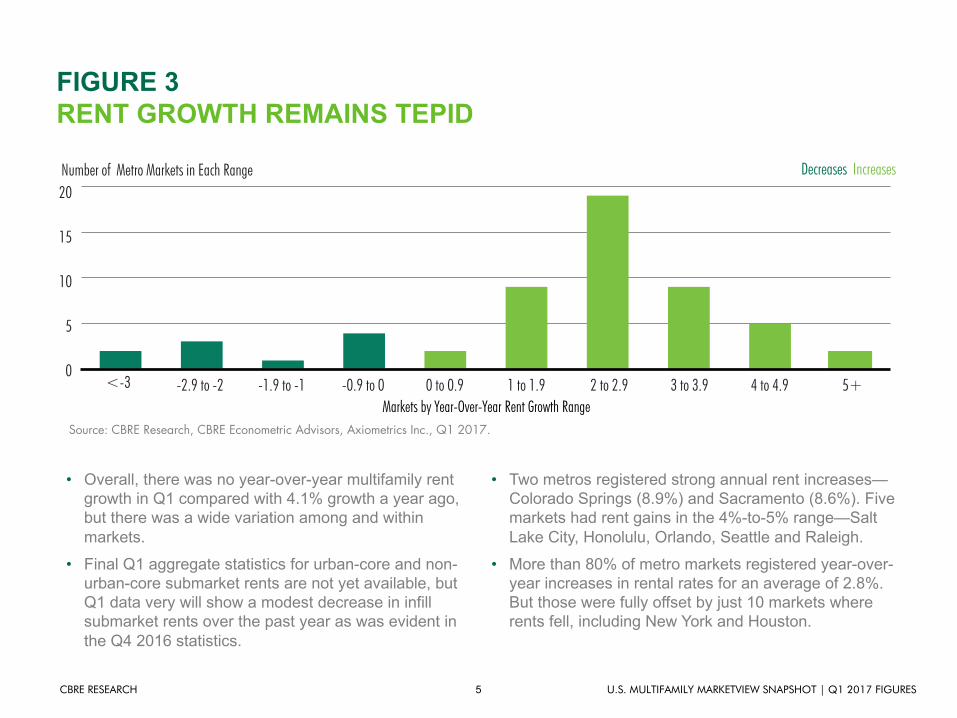
FIGURE 3RENT GROWTH REMAINS TEPID
• Overall, there was no year-over-year multifamily rent growth in Q1 compared with 4.1% growth a year ago, but there was a wide variation among and within markets.
• Final Q1 aggregate statistics for urban-core and non-urban-core submarket rents are not yet available, but Q1 data very will show a modest decrease in infill submarket rents over the past year as was evident in the Q4 2016 statistics.
• Two metros registered strong annual rent increases—Colorado Springs (8.9%) and Sacramento (8.6%). Five markets had rent gains in the 4%-to-5% range—Salt Lake City, Honolulu, Orlando, Seattle and Raleigh.
• More than 80% of metro markets registered year-over-year increases in rental rates for an average of 2.8%. But those were fully offset by just 10 markets where rents fell, including New York and Houston.
Source: CBRE Research, CBRE Econometric Advisors, Axiometrics Inc., Q1 2017.
Number of Metro Markets in Each Range Decreases Increases20
15
5
10
0<-3 -1.9 to -1 0 to 0.9 2 to 2.9 4 to 4.9-2.9 to -2 -0.9 to 0 1 to 1.9 3 to 3.9 5+
Markets by Year-Over-Year Rent Growth Range
6 U.S. MULTIFAMILY MARKETVIEW SNAPSHOT | Q1 2017 FIGURESCBRE RESEARCH
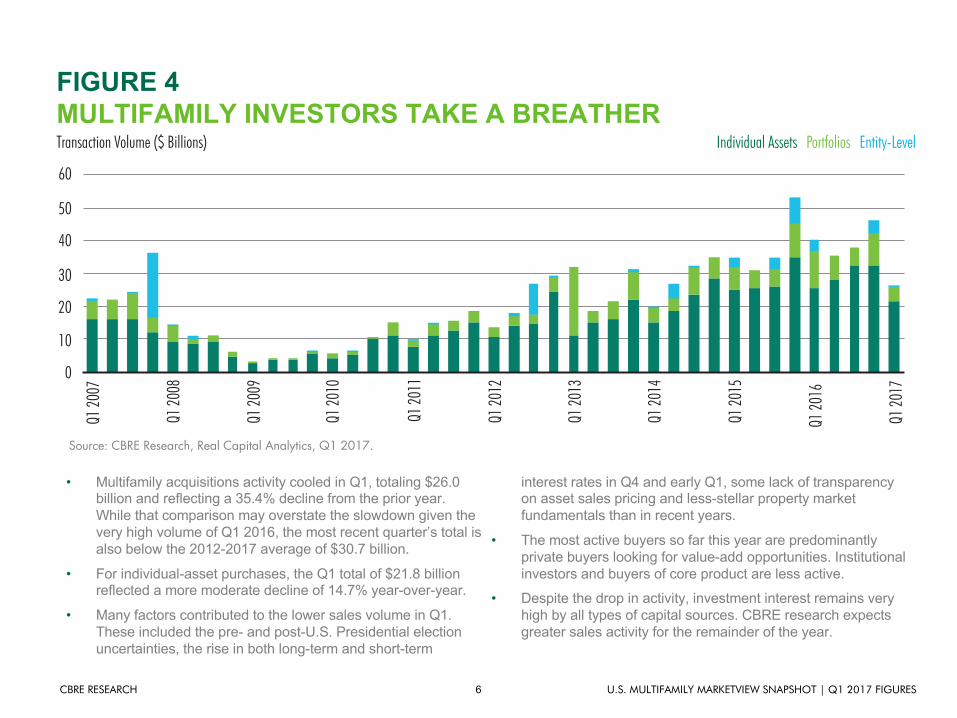
FIGURE 4MULTIFAMILY INVESTORS TAKE A BREATHER
• Multifamily acquisitions activity cooled in Q1, totaling $26.0 billion and reflecting a 35.4% decline from the prior year. While that comparison may overstate the slowdown given the very high volume of Q1 2016, the most recent quarter’s total is also below the 2012-2017 average of $30.7 billion.
• For individual-asset purchases, the Q1 total of $21.8 billion reflected a more moderate decline of 14.7% year-over-year.
• Many factors contributed to the lower sales volume in Q1. These included the pre- and post-U.S. Presidential election uncertainties, the rise in both long-term and short-term
interest rates in Q4 and early Q1, some lack of transparency on asset sales pricing and less-stellar property market fundamentals than in recent years.
• The most active buyers so far this year are predominantly private buyers looking for value-add opportunities. Institutional investors and buyers of core product are less active.
• Despite the drop in activity, investment interest remains very high by all types of capital sources. CBRE research expects greater sales activity for the remainder of the year.
Source: CBRE Research, Real Capital Analytics, Q1 2017.
Transaction Volume ($ Billions) Individual Assets Portfolios Entity-Level
60
50
30
10
40
20
0
Q1 20
17
Q1 20
07
Q1 20
08
Q1 20
10
Q1 20
12
Q1 20
14
Q1 20
16
Q1 20
09
Q1 20
11
Q1 20
13
Q1 20
15
FOR MORE INFORMATION, PLEASE CONTACT:
CAPITAL MARKETS
Brian McAuliffePresidentCapital Markets, Institutional Properties+1 312 935 [email protected]
CAPITAL MARKETS - MULTIFAMILY
Peter DonovanExecutive Managing DirectorCapital Markets, Multifamily+1 617 217 [email protected]
Chris AkinsSenior Managing DirectorCapital Markets, Multifamily Investment Sales+1 321 861 [email protected]
Mitchell KiffeSenior Managing Director Capital Markets, Multifamily Debt & Structured Finance +1 703 905 [email protected]
Colleen Pentland LallyDirectorCapital Markets, Multifamily+1 617 217 [email protected]
Spencer G. LevyAmericas Head of Research+1 617 912 [email protected] Spencer on Twitter: @SpencerGLevy
Jeanette I. Rice, CREAmericas Head of Multifamily Research+1 214 979 [email protected] Jeanette on Twitter: @RiceJeanette
Matt VanceDirector, Research & AnalysisEconomist+1 303 628 [email protected] Matt on Twitter: @vancenomics
Disclaimer: Information contained herein, including projections, has been obtained from sources believed to be reliable. While we do not doubt its accuracy, we have not verified it and make no guarantee, warranty or representation about it. It is your responsibility to confirm independently its accuracy and completeness. This information is presented exclusively for use by CBRE clients and professionals and all rights to the material are reserved and cannot be reproduced without prior written permission of CBRE.