Q1 2016 Results - Continental USA...Q1 2016 Results – May 4, 2016 EDMR – Equity and Debt Markets...
53
Q1 2016 Results Hanover – May 4, 2016 Ticker: CON ADR-Ticker: CTTAY T itt @C ti t l IR http://www.continental-ir.com Wolfgang Schaefer – CFO T witter: @Continental_IR
Transcript of Q1 2016 Results - Continental USA...Q1 2016 Results – May 4, 2016 EDMR – Equity and Debt Markets...

Q1 2016 ResultsHanover – May 4, 2016
Ticker: CONADR-Ticker: CTTAYT itt @C ti t l IRhttp://www.continental-ir.com Wolfgang Schaefer – CFO Twitter: @Continental_IR

AGENDA
Corporation Highlights1 3Corporation Highlights1 3Automotive Group2 10Rubber Group3 13Rubber Group3 13Indebtedness and Cash Flow4 16Outlook 20165 19Outlook 20165 19Back-up & Fact Sheets 2014 – Q1 20166 28
Q1 2016 Results – May 4, 2016EDMR – Equity and Debt Markets Relations 2

1) Corporation Highlights M t I t t KPI Q1 2016Most Important KPIs Q1 2016
› Sales up by 3% to €9.9 bn; organic sales growth at 4%; FX negative at €200 mn
Adj EBIT1 b 8% t €1 1 b dj EBIT1 i t 11 3%› Adj. EBIT1 up by 8% to €1.1 bn; adj. EBIT1 margin at 11.3%(PPA -€34 mn and special effects -€15 mn)
› NIAT2 up by 12% to €734 mn
› Free cash flow amounted to €489 mn including €78 mn cash outflow for acquisitions; free cash flow before acquisitions amounted to €567 mn
› Gearing ratio down to 23%; equity ratio at 40%› Gearing ratio down to 23%; equity ratio at 40%
› Value creation: trailing ROCE3 up by 160 bps to 21.1% YOY
Other topics:› Earthquake in Kumamoto Prefecture (Japan) on April 16 severely damaged the production facilities
of Renesas Electronics one of the largest semiconductor producers worldwide; most of these semiconductor products are very difficult to substitute; therefore the impact on the global supply chain is currently not reliably assessablechain is currently not reliably assessable
› Syndicated loan facility: Term loan originally amounting to €1.5 bn paid back in full, revolving credit facility in the amount of €3 bn prolonged until April 2021O d i t k i th A t ti G t th €9 b
1 Before amortization of intangibles from PPA, consolidation and special effects2 Attributable to the shareholders of the parent3 Trailing ROCE is calculated as reported EBIT for the last twelve months (LTM) divided by average operating assets for the LTM
› Order intake in the Automotive Group up to more than €9 bn
Q1 2016 Results – May 4, 2016EDMR – Equity and Debt Markets Relations 3

1) Corporation Highlights Di i i l Hi hli ht Q1 2016Divisional Highlights Q1 2016
› Chassis & Safety: 9.8% adj. EBIT1 margin (PY: 10.1%); organic sales up by 4%; ADAS sales up by more
e G
roup
› Chassis & Safety: 9.8% adj. EBIT margin (PY: 10.1%); organic sales up by 4%; ADAS sales up by more than 50% in Q1 2016; solid order intake in VED and ADAS
› Powertrain: 4.0% adj. EBIT1 margin (PY: 5.4%); organic sales up by 1%; adj. EBIT1 margin before HEV at 6.1%; margin down on expiring diesel business and high R&D spending ahead of several SOPs
tom
otiv
e
› Interior: 8.5% adj. EBIT1 margin (PY 9.7%); organic sales increased by 3%; margin decline explained by significant application engineering efforts for new infotainment business
› Automotive Group: Organic sales increased by 3%, worldwide car production up by 1%; adj. EBIT1 margin
Aut
› Tires: Adj EBIT1 margin increased by 250 bps to 21 3% benefitting from lower raw material costs totaling
decreased by 90 bps to 7.6%; R&D expenses increased by €68 mn (+12%) on new programs
› Order intake in the Automotive Group increased to more than €9 bn
Gro
up
› Tires: Adj. EBIT1 margin increased by 250 bps to 21.3% benefitting from lower raw material costs totaling €50 mn in Q1 2016, solid price mix (-2%); volumes were up by 9% in Q1 2016; FX impacted tire sales negatively by 3% in Q1 2016
› Tire markets: PC & LT tire replacement demand in Europe was up by 2%; NAFTA was up by 5% where the
ubbe
r G
p p p y p yintroduction of import duties impacted replacement demand in 2015
› ContiTech: Adj. EBIT1 margin increased by 400 bps to 10.5%; organic sales up by 3%; Veyance Technologies now fully includedConsolidation effect for Jan 2016: €93 mn to sales and €9 mn to EBITR Consolidation effect for Jan 2016: €93 mn to sales and -€9 mn to EBIT
› Rubber Group: Organic sales up by 5% and adj. EBIT1 margin up to 17.8% (PY: 14.7%)
Q1 2016 Results – May 4, 2016EDMR – Equity and Debt Markets Relations 4
1 Before amortization of intangibles from PPA, consolidation and special effects

1) Corporation Highlights S l d Adj t d EBIT1 b Q tSales and Adjusted EBIT1 by Quarter
FY Sales €34 506 mn Q1 Sales €9,851 mnFY Sales €39 232 mn
9 56910,030
9 61810,016 9,851
FY Sales €34,506 mn Adj. EBIT1 €1,095 mnFY Sales €39,232 mn
8 390 8,528 8,6708,918
9,569 9,618
8,390
1,0101,095
Q1/14 Q2/14 Q3/14 Q4/14 Q1/15 Q2/15 Q3/15 Q4/15 Q1/16 Q2/16 Q3/16 Q4/16
Sales (mn €) Adj. EBIT (mn €)1
Q1 2016 Results – May 4, 2016EDMR – Equity and Debt Markets Relations 5
1 Before amortization of intangibles from PPA, consolidation and special effects
1) Corporation Highlights A t ti G d R bb G b Q tAutomotive Group and Rubber Group by Quarter
Automotive Group Rubber Group
912
996
1 005
011
Sales (mn €) Adj. EBIT (mn €) Sales (mn €) Adj. EBIT (mn €)1 1
5,12
9
5,17
6
5,16
2
5,44
2 5,9 5,9
5,66
1
6,0
6,0
71 362
,518
,487
3,66
9
4,04
5
3,96
8
4,02
2
3,85
2
505456
3,2 3,3 3 3, 3
538667
/14
2/14
3/14
4/14 /1
5
2/15
3/15
4/15 /1
6
2/16
3/16
4/16 /1
4
2/14
3/14
4/14 /1
5
2/15
3/15
4/15 /1
6
2/16
3/16
4/16
Q1
Q2
Q3
Q4
Q1
Q2
Q3
Q4
Q1
Q2
Q3
Q4
Q1
Q2
Q3
Q4
Q1
Q2
Q3
Q4
Q1
Q2
Q3
Q4
1 Before amortization of intangibles from PPA, consolidation and special effects
Q1 2016 Results – May 4, 2016EDMR – Equity and Debt Markets Relations 6

1) Corporation Highlights G th P fil f th C ti Q1 2016
ContiTechAutomotive
Growth Profile of the Corporation Q1 2016
C C
3%
PC & LT prod
ContiTechorganic sales
growth3%
PC & LT prod
AutomotiveGroup organic sales growth
Conti
Conti
1 5%
2%
GDP growth
PC & LT prod.growth Europe
3%
1%
PC & LT prod.
PC & LT prod. growth ww
Market
1
Market
1.5%gEurozone 20163%p
growth EU/NAFTA
t
1 According to IMF (WEO Update April 2016)
1
t
9%Passenger &
Light Truck Tires volume growth
7%CommercialVehicle Tires
volume growth
Conti
Conti
2%
R l t
Replacement tire volume
growth Europe2%
Replacement
Replacement tire volume
growth EuropeM
ark
Mark
5%Replacement tire volume
growth NAFTA4%
Replacement tire volume
growth NAFTA
ket
ket
Q1 2016 Results – May 4, 2016EDMR – Equity and Debt Markets Relations 7

1) Corporation Highlights S t i bl V l C tiSustainable Value Creation
20.6% 20.8%19.3%
20.0% 19.5%20.3%
21.6%20.9% 21.1%
16,6
25
16,5
22
16,5
36
16,7
27
17,5
10
18,1
98
18,9
10
19,6
81
19,7
67
Q1 Q2 Q3 Q4 Q1 Q2 Q3 Q4 Q1 Q2 Q3 Q4
2014 2015 2016
trailing OA (mn €) trailing ROCE1 Trailing operating assets are calculated as assets for the last twelve months2 Trailing ROCE is calculated as reported EBIT for the last twelve months divided by trailing operating assets
1 2
Q1 2016 Results – May 4, 2016EDMR – Equity and Debt Markets Relations 8
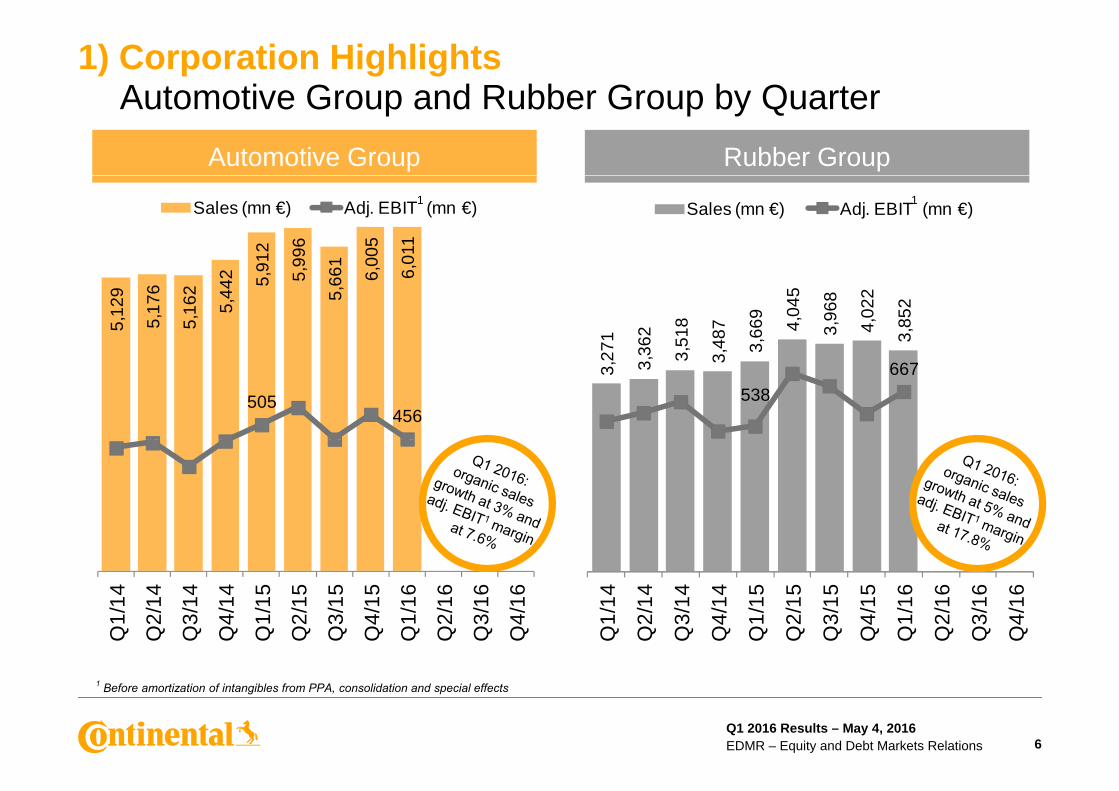
1) Corporation Highlights M t iti f S di t d L d B d 1 ( €)Maturities for Syndicated Loan and Bonds1 (mn €)As at March 31, 2016
( €) FY 15 Q1 16(mn €) FY 15 Q1 16
Gross indebtedness 5,245 4,878
Cash 1,622 1,694
Net indebtedness 3,542 3,083
66
3,5 3,083
Available credit lines 3,612 3,760
Total liquidity 5,233 5,454
66
750 750500
750
2016 2017 2018 2019 2020
2
1 All amounts shown are nominal values2 Any utilization under the Revolving Credit Facility (RCF) has to be shown as short term debt acc. to IFRS although the RCF matures originally in 2020. It has a total volume of €3,000
mn; it has been recently prolonged until 2021
Syndicated loan Bonds2
Q1 2016 Results – May 4, 2016EDMR – Equity and Debt Markets Relations 9
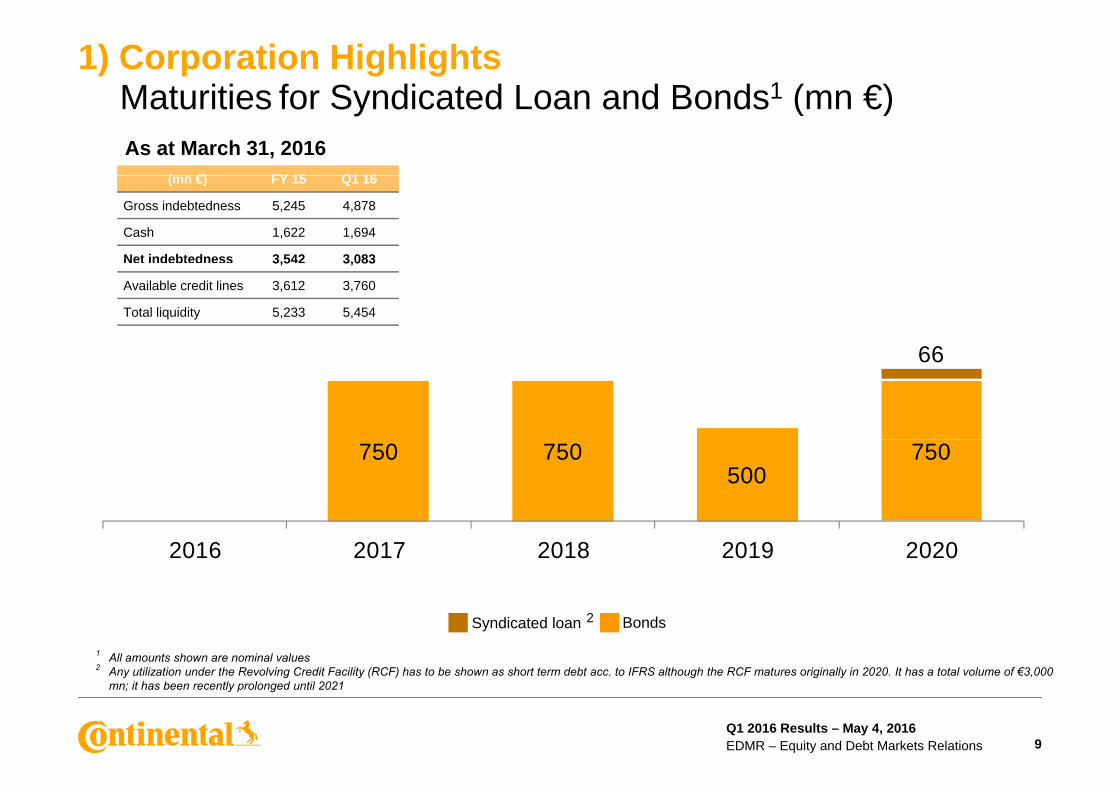
2) Automotive GroupQ1 2016 G th I t d b Ad P d ti P ttQ1 2016: Growth Impacted by Adverse Production Pattern
Production Overview1 Europe Production Overview1 Worldwide
22.6 22.9
5.4 5.5
Q1 2016 (mn units) Q1 2016 (mn units)
14 7 15.214.7
7.9 7.72.7 2.62.7 2.8
TOP 5 customer
Other OEM Total TOP 5 customer
Other OEM Total customer
Q1 2015 Q1 2016E
customer
Q1 2015 Q1 2016E1 IHS data as of April 2016 and own estimates
Q1 2016 Results – May 4, 2016EDMR – Equity and Debt Markets Relations 10

2) Automotive GroupS l d Adj EBIT1 b Di i iSales and Adj. EBIT1 by Division
Automotive Group Sales (mn €) Q1 2016 Automotive Group Adj. EBIT1 (mn €) Q1 2016
168 4562,023
27
6,011
2.6% 2.5%
p ( ) p j ( )
-
216
730
4.0%
8.5% 7.6%
2 202
1,814
0.7%
9.8%
Adj. EBIT margin (%)
2,202
3.9%Organic sales growth (%)
1
Chassis & Safety
Powertrain Interior cons. AutomotiveGroup
Chassis & Safety
Powertrain Interior cons. AutomotiveGroup
Reported change in salesReported change in sales› Chassis & Safety: 3.1%› Powertrain: -0.7% › I t i 2 4%
› Reported EBITDA: €699 mn (11.6% of sales) › Reported EBIT: €440 mn (7.3% of sales)› R&D €625 (10 4% f l )› Interior: 2.4%
› Automotive Group: 1.7% 1 Before amortization of intangibles from PPA, consolidation and special effects
› R&D: €625 mn (10.4% of sales) › Capex: €202 mn (3.4% of sales)
Q1 2016 Results – May 4, 2016EDMR – Equity and Debt Markets Relations 11

2) Automotive GroupQ1 2016 Adj EBIT1 I t d b Hi h R&D EQ1 2016: Adj. EBIT1 Impacted by High R&D Expenses
Automotive Group Sales (mn €) Adj. EBIT1 (mn €) and Adj. EBIT1 Margin
5,912 5,996 5,661 6,005 6,011 505 456
p ( ) j ( ) j g
8.5%7 6%7.6%
+99 49
Q1/15 Q2/15 Q3/15 Q4/15 Q1/16 Q1/15 Q2/15 Q3/15 Q4/15 Q1/16
› S l i d b €99 i l th i Q1 2016 t 2 5% d t l d ti t t f
+99 -49
› Sales increased by €99 mn; organic sales growth in Q1 2016 at 2.5% due to slow production start of four out of our five main customers
› Adj. EBIT1 decreased by €49 mn mainly because of high R&D costs for new car programs1› Adj. EBIT1 margin at 7.6% (PY: 8.5%)
1 Before amortization of intangibles from PPA, consolidation and special effects
Q1 2016 Results – May 4, 2016EDMR – Equity and Debt Markets Relations 12

3) Rubber Group S l d Adj EBIT1 b Di i iSales and Adj. EBIT1 by Division
Rubber Group Sales (mn €) Q1 2016 Rubber Group Adj. EBIT1 (mn €) Q1 2016
2,51320
3,852
6 7% 5 3%
5330
66721.3% 17.8%
ubbe G oup Sa es ( €) Q 0 6 ubbe G oup dj ( €) Q 0 6
- 06.7% 5.3%
1,3592.7%
Organic sales growth (%)
134
10.5% Adj. EBIT margin (%)1
ContiTech Tires cons. Rubber Group ContiTech Tires cons. Rubber Group
Adj. EBIT margin (%)
Reported change in sales› ContiTech: 7.2%› Tires: 3.8%
› Reported EBITDA: €834 mn (21.7% of sales) › Reported EBIT: €629 mn (16.3% of sales)› R&D: €91 mn (2 4% of sales)› Tires: 3.8%
› Rubber Group: 5.0%
1 Before amortization of intangibles from PPA, consolidation and special effects
› R&D: €91 mn (2.4% of sales) › Capex: €196 mn (5.1% of sales)
Q1 2016 Results – May 4, 2016EDMR – Equity and Debt Markets Relations 13
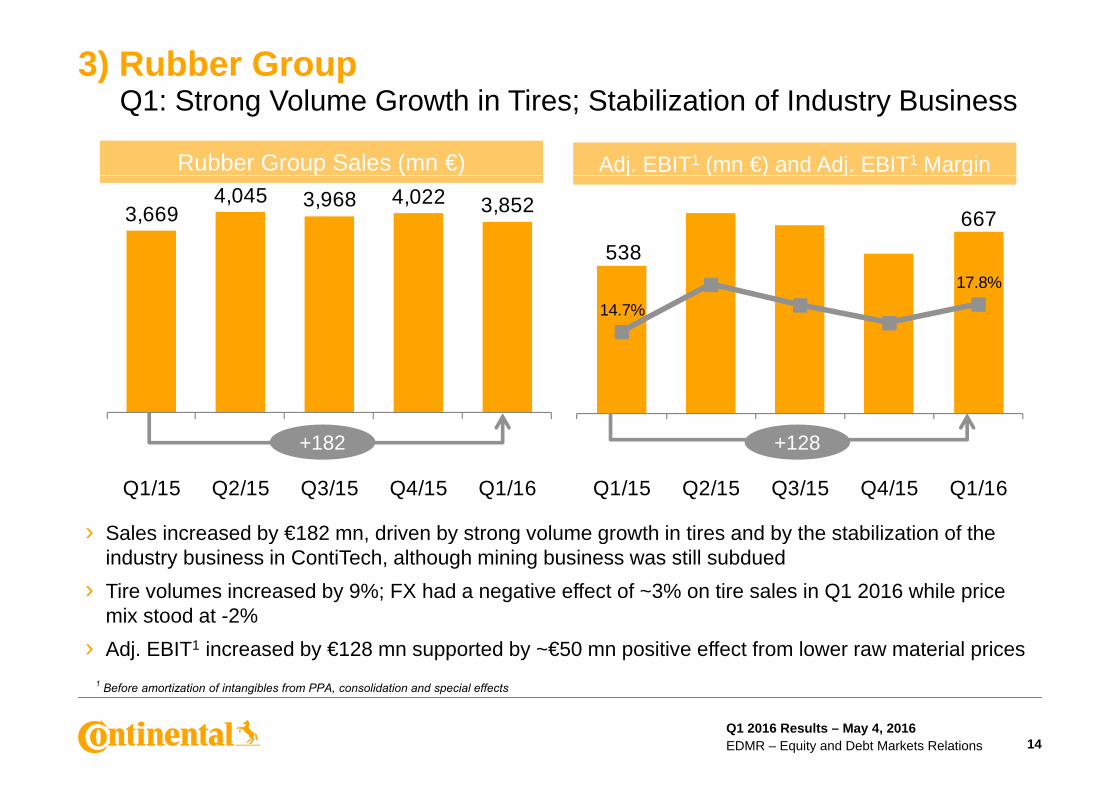
3) Rubber GroupQ1: Strong Volume Growth in Tires; Stabilization of Industry Business
Rubber Group Sales (mn €) Adj. EBIT1 (mn €) and Adj. EBIT1 Margin
3,6694,045 3,968 4,022 3,852
538667
j ( ) j g
14.7%
17.8%
+182 +128
Q1/15 Q2/15 Q3/15 Q4/15 Q1/16 Q1/15 Q2/15 Q3/15 Q4/15 Q1/16
S l i d b €182 d i b t l th i ti d b th t bili ti f th
+182 +128
› Sales increased by €182 mn, driven by strong volume growth in tires and by the stabilization of the industry business in ContiTech, although mining business was still subdued
› Tire volumes increased by 9%; FX had a negative effect of ~3% on tire sales in Q1 2016 while price mix stood at 2%mix stood at -2%
› Adj. EBIT1 increased by €128 mn supported by ~€50 mn positive effect from lower raw material prices1 Before amortization of intangibles from PPA, consolidation and special effects
Q1 2016 Results – May 4, 2016EDMR – Equity and Debt Markets Relations 14

3) Rubber GroupE t d R M t i l P i D l t i 2016
› Natural rubber price (TSR 20)
Expected Raw Material Price Development in 2016
Raw Material Price Development1
600
› Natural rubber price (TSR 20) expected to average U.S. $1.50 in 2016 (unchanged from prior forecast)
Raw Material Price Development2011 - 2016E (U.S. cents/kg)
1 1 1 1Average (Y)
TSR 20: 463Butadiene: 297
Average (Y)TSR 20: 326
Butadiene: 244
Average (Y)TSR 20: 259
Butadiene: 148
Average (Y)TSR 20: 181
Butadiene: 132
Average (Y)TSR 20: 144
Butadiene: 90
Average (Y)TSR 20: 150
Butadiene: 90
400
500forecast)
› Synthetic rubber price (butadiene feedstock) forecasted to average U S $0 90 i 2016 ( h d
121 14
516
017
5
200
300U.S. $0.90 in 2016 (unchanged from prior forecast)
› Tailwind from lower raw material
86 85 95 95
0
100
/11
/11
/11
/11
/12
/12
/12
/12
/13
/13
/13
/13
/14
/14
/14
/14
/15
/15
/15
/15
/16
6E 6E 6E
Tailwind from lower raw material cost to amount to about €100 mn in 2016 (unchanged from prior forecast)
Q1/
Q2/
Q3/
Q4/
Q1/
Q2/
Q3/
Q4/
Q1/
Q2/
Q3/
Q4/
Q1/
Q2/
Q3/
Q4/
Q1/
Q2/
Q3/
Q4/
Q1/
Q2/
16Q
3/16
Q4/
16
TSR 20 (U.S. cents/kg) Butadiene (U.S. cents/kg)
)
1 Source: Bloomberg and Continental estimates for 2016
Q1 2016 Results – May 4, 2016EDMR – Equity and Debt Markets Relations 15

4) Indebtedness and Cash Flow N t I d bt d B id ( €)Net Indebtedness Bridge (mn €)
408 78
575 200
281
3,542
408465
973 3,083€494 mn outflow from
change in working capital27%%
GearingRatio
ss ex ns n es n es in s on CF ss
23%
1
a o
2
Net
eb
tedn
esFY
201
5)
Cap
e
cqui
sitio
n
Cha
nge
inec
eiva
ble
Cha
nge
inv
ento
rie
Cha
nge
ipa
yabl
es
Dep
r. an
dm
ortiz
atio
Oth
er C
Net
eb
tedn
esQ
1 20
16)
inde (F Ac C re C in C D am in
de (Q
1 According to cash flow statement incl. intangible assets2 Several smaller acquisitions in the Automotive and Rubber Groups
Q1 2016 Results – May 4, 2016EDMR – Equity and Debt Markets Relations 16
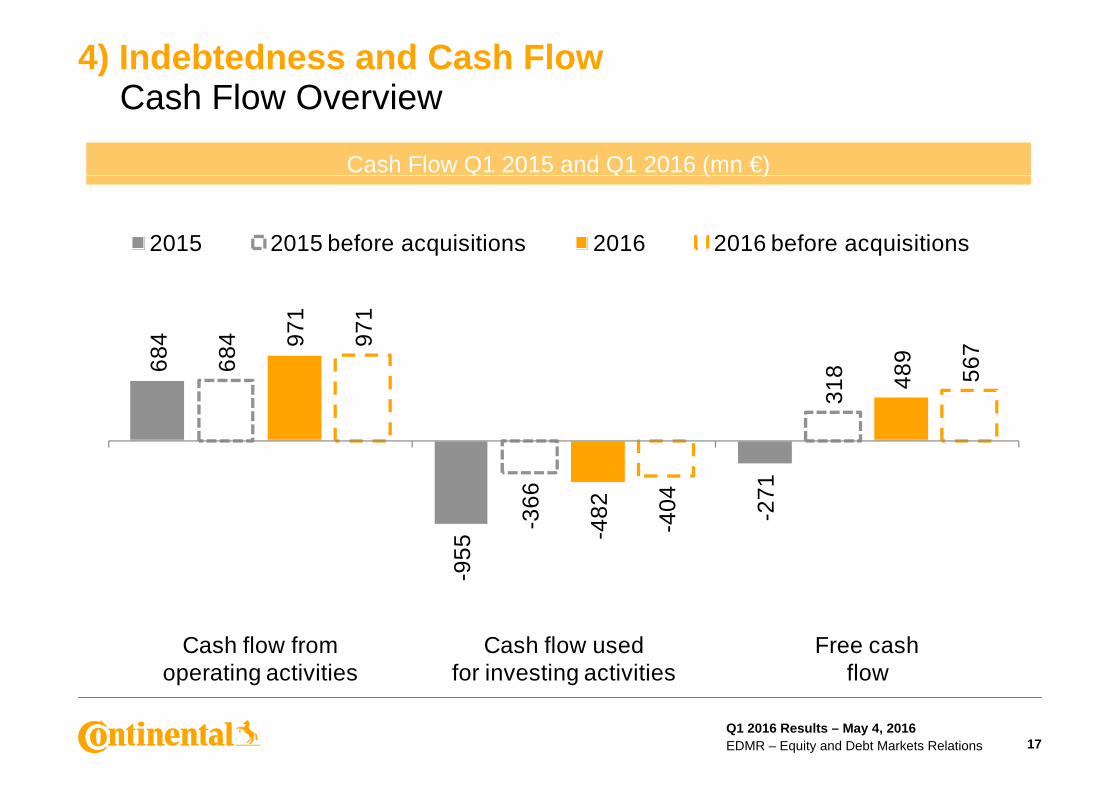
4) Indebtedness and Cash Flow C h Fl O iCash Flow Overview
Cash Flow Q1 2015 and Q1 2016 (mn €)
2015 2015 before acquisitions 2016 2016 before acquisitions
( )84 84 97
1
9
971
7
68 68
318 48
9
567
-271
-366
482
-404
-955
- -4 -Cash flow from
operating activitiesCash flow used
for investing activitiesFree cash
flow
Q1 2016 Results – May 4, 2016EDMR – Equity and Debt Markets Relations 17

4) Indebtedness and Cash Flow N t I d bt d d G i R tiNet Indebtedness and Gearing Ratio
Net indebtedness (mn €) Gearing ratioNet indebtedness (mn €) Gearing ratio
43% 42% 36%26% 34% 34% 34% 27% 23%
242
273
926
824
099
236
296
542
083
% 23%
4,2
4,2
3, 2, 4, 4,2
4,2
3, 3,
Q1 H1 9M YE Q1 H1 9M YE Q1 H1 9M YE
2014 2015 2016
Q1 2016 Results – May 4, 2016EDMR – Equity and Debt Markets Relations 18

5) Outlook 2016PC & LT P d ti b Q tPC & LT Production by Quarter
Europe (mn units) NAFTA (mn units) China (mn units)
0
2014: 19.9
2015: 20.7
2016E: 21.1
2014: 17.0
2015: 17.5
2016E: 17.5
2014: 22.6
2015: 23.7
2016E: 24.6
69 89 6.23
2.9
7170
8
7.17
06.
250
6.10
00
6.84
0
9 1 6 80 700
5.56
5.58
5.22
0 55.
74.
830
65.
380
11%15%
11%4.20
44.
412
4.17
74.
237
4.26
74.
521
4.35
04.
363
4.44
04.
580
4.25
04.
2635.
173
5.26
94.
492
4.93
15.
381
5.40
64.
710
5.15
35.
4 8 5.7
4.80
55.
140
9%11%
6% 6% 7%
2%5%
7%11%
-5%
4 45% 4%
8%5%
1% 2% 4% 3% 4%1%
-2%-2%
9%
4%0% 1%
4% 3%5% 5%
2%5%
2%0%
-7%5%
/14
/14
/14
/14
/15
/15
/15
/15
6E 6E 6E 6E/14
/14
/14
/14
/15
/15
/15
/15
6E 6E 6E 6E/14
/14
/14
/14
/15
/15
/15
/15
6E 6E 6E 6E
Q1/
Q2/
Q3/
Q4/
Q1/
Q2/
Q3/
Q4/
Q1/
1Q
2/1
Q3/
1Q
4/1
China chg YOY
Q1
Q2
Q3
Q4
Q1
Q2
Q3
Q4
Q1/
1Q
2/1
Q3/
1Q
4/1
NAFTA chg YOY
Q1/
Q2/
Q3/
Q4/
Q1/
Q2/
Q3/
Q4/
Q1/
1Q
2/1
Q3/
1Q
4/1
Europe chg YOY
Q1 2016 Results – May 4, 2016EDMR – Equity and Debt Markets Relations 19Source: IHS and own estimates, Europe excluding Kazakhstan and Uzbekistan

5) Outlook 2016M k t O tl k f M j R i 2016Market Outlook for Major Regions 2016
Commercial Vehicle2 Prod. (k units)PC & LT1 Production (mn units)
46.4 47.82015E 2016E
1,575 1,6002015E 2016E
20.7 17.5
3.0
21.1 17.5
2.6
569 585
101
590 528
860%
Europe NAFTA South America
Asia Europe NAFTA South America
Asia
CV Repl 4 Tire Market (mn units)
Source: IHS and own estimatesSource: IHS and own estimates
PC & LT Repl 3 Tire Market (mn units)85.0 87.02015E 2016E
324278
415329
283
4362015E 2016E
CV Repl. Tire Market (mn units)PC & LT Repl. Tire Market (mn units)
23.5 22.813.2
24.2 23.212.0
278
64
283
60
Europe NAFTA South America
AsiaEurope NAFTA South America
Asia Source: LMC and own estimatesSource: LMC and own estimates
Q1 2016 Results – May 4, 2016EDMR – Equity and Debt Markets Relations 20
1 Passenger car and light truck <6t2 Heavy vehicles >6t3 Passenger car & light truck replacement 4 Commercial vehicle replacement (radial and biased)

5) Outlook 2016C ti t l C tiContinental Corporation
2015 2016E
Consolidated sales adj. EBIT1
€39.2 bn€4.5 bn
Automotive Group €23.6 bn
To increase to ~€41 bn at constant FX rates~11%
~€25 bnpadj. EBIT1 €2.1 bn
Rubber Groupadj. EBIT1
€15.7 bn€2.5 bn
>8.5%
>€16 bn>16%
Raw material cost impact
Relief of about €250 mn
S ff €
Raw materials to positively affect Rubber Group results in 2016 by about €100 mn
€Special effects -€116 mn
Net interest resultTax rate
-€246 mn28.2%
About -€100 mn
<-€250 mn~30%%
CapexPPA
€2.2 bn€138 mn
Free cash flow before
%
Capex at around 6% of sales PPA amortization: ~€150 mn
Free cash flow before acquisitions €2.7 bn At least €2 bn
Q1 2016 Results – May 4, 2016EDMR – Equity and Debt Markets Relations 21
1 Before amortization of intangibles from PPA, consolidation (2015 in comparison to 2014) and special effects
Thank you!y
Official Sponsor of the UEFA European Football Championship™
Q1 2016 Results – May 4, 2016EDMR – Equity and Debt Markets Relations 22

Disclaimer
› This presentation has been prepared by Continental Aktiengesellschaft solely in connection with the release of theQ1 2016 results on May 4, 2016, in Hanover. It has not been independently verified. It does not constitute an offer,invitation or recommendation to purchase or subscribe for any shares or other securities issued by Continental AG orp y yany subsidiary and neither shall any part of it form the basis of, or be relied upon in connection with, any contract orcommitment concerning the purchase or sale of such shares or other securities whatsoever.
› Neither Continental Aktiengesellschaft nor any of its affiliates, advisors or representatives shall have any liabilitywhatsoever (in negligence or otherwise) for any loss that may arise from any use of this presentation or its contents( g g ) y y y por otherwise arising in connection with this presentation.
› This presentation includes assumptions, estimates, forecasts and other forward-looking statements, includingstatements about our beliefs and expectations regarding future developments as well as their effect on the results ofContinental. These statements are based on plans, estimates and projections as they are currently available to theContinental. These statements are based on plans, estimates and projections as they are currently available to themanagement of Continental. Therefore, these statements speak only as of the date they are made, and weundertake no obligation to update publicly any of them in light of new information or future events. Furthermore,although the management is of the opinion that these statements, and their underlying beliefs and expectations, arerealistic as of the date they are made, no guarantee can be given that the expected developments and effects willactually occur Many factors may cause the actual development to be materially different from the expectationsactually occur. Many factors may cause the actual development to be materially different from the expectationsexpressed here. Such factors include, for example and without limitation, changes in general economic and businessconditions, fluctuations in currency exchange rates or interest rates, the introduction of competing products, the lackof acceptance for new products or services and changes in business strategy.
› All t t t ith d t k t k t iti ( ) f C ti t l f it tit ti t f› All statements with regard to markets or market position(s) of Continental or any of its competitors are estimates ofContinental based on data available to Continental. Such data are neither comprehensive nor independently verified.Consequently, the data used are not adequate for and the statements based on such data are not meant to be anaccurate or proper definition of regional and/or product markets or market shares of Continental and any of theparticipants in any market.p p y
› Unless otherwise stated, all amounts are shown in millions of euro. Please note that differences may arise as a resultof the use of rounded amounts and percentages.
Q1 2016 Results – May 4, 2016EDMR – Equity and Debt Markets Relations 23
ContactE it d D bt M k t R l tiEquity and Debt Markets Relations
Vahrenwalder Str. 930165 Hanover
Michael SaemannAnalysts, Institutional Investors and Sustainability Investors
Germanye-mail: [email protected]
y , yPhone: +49 511 938 1307e-mail: [email protected]
Klaus PaeslerRolf WollerHead of IRPhone: +49 511 938 1068e-mail: [email protected]
Analysts, Institutional Investors, ADR and Private Investors Phone: +49 511 938 1316 e-mail: [email protected]
Ingrid KampfAssistant to the Head of IRRoadshow and Conference OrganizationPh 49 511 938 1163
Sabine ReeseSustainability, ASM, CMD Organization, IR Website, Capital Market Disclosure RequirementsPhone: +49 511 938 1027
il bi @ ti dPhone: +49 511 938 1163Fax: +49 511 938 1080e-mail: [email protected]
e-mail: [email protected]
Henry SchniewindAnalysts, Institutional InvestorsPhone: +49 511 938 1062Phone: +49 511 938 1062e-mail: [email protected]
Marvin KalberlahSocial MediaSocial MediaPhone: +49 511 938 14034e-mail: [email protected]
Q1 2016 Results – May 4, 2016EDMR – Equity and Debt Markets Relations 24
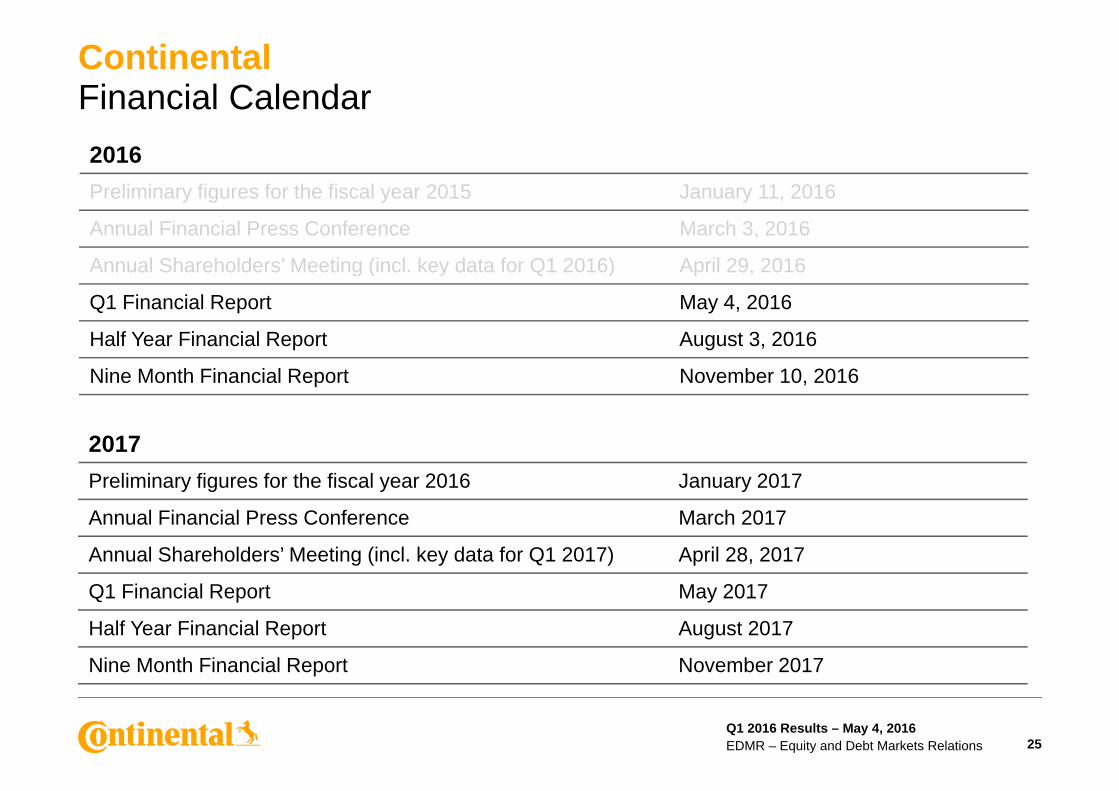
ContinentalFi i l C l dFinancial Calendar2016Preliminary figures for the fiscal year 2015 January 11, 2016
Annual Financial Press Conference March 3, 2016
Annual Shareholders’ Meeting (incl key data for Q1 2016) April 29 2016Annual Shareholders Meeting (incl. key data for Q1 2016) April 29, 2016
Q1 Financial Report May 4, 2016
Half Year Financial Report August 3, 2016
2017
Nine Month Financial Report November 10, 2016
2017Preliminary figures for the fiscal year 2016 January 2017
Annual Financial Press Conference March 2017
Annual Shareholders’ Meeting (incl. key data for Q1 2017) April 28, 2017
Q1 Financial Report May 2017
Half Year Financial Report August 2017
Nine Month Financial Report November 2017
Q1 2016 Results – May 4, 2016EDMR – Equity and Debt Markets Relations 25

ContinentalSh D t / ADR D tShare Data / ADR DataShare DataT f h N l hType of share No-par value share
Bloomberg Ticker CON
Reuters Ticker CONG
German Security Identification Number (WKN) 543 900
ISIN Number DE0005439004
Sh t t di t M h 31 2016 200 005 983Shares outstanding as at March 31, 2016 200,005,983
ADR DataRatio (ordinary share: ADR) 1:5
Bloomberg Ticker CTTAY
Reuters Ticker CTTAY PKReuters Ticker CTTAY.PK
ISIN Number US2107712000
ADR Level Level 1
Exchange OTC
Sponsor Deutsche Bank Trust Company Americas
Q1 2016 Results – May 4, 2016EDMR – Equity and Debt Markets Relations 26

ContinentalB d D tBond Data
Issuer Conti-Gummi Finance B.V., Netherlands1 Continental AG Continental AG Continental Rubber of
America, Corp.1
Issue Senior Notes Senior Notes Senior Notes Senior NotesIssue Senior Notes Senior Notes Senior Notes Senior Notes
Principal amount €750 mn €750 mn €750 mn €500 mn
Offering price 99.595% 98.950% 99.228% 99.739%
Ba1 (Moody’s4) Ba2 (Moody’s4) Ba1 (Moody’s4)Rating at issuance date BB (S&P)
BBB (Fitch2)BB (S&P)BB (Fitch2)
BB (S&P)BBB (Fitch2)
BBB (S&P)BBB (Fitch)
Current corporationand bond ratings3 BBB (Fitch), BBB (S&P), Baa1 (Moody’s4)
Coupon 2.5% p.a. 3.0% p.a. 3.125% p.a. 0.5% p.a.
Issue date September 19, 2013 July 16, 2013 September 9, 2013 November 19, 2015
Maturity March 20, 2017 July 16, 2018 September 9, 2020 February 19, 2019
AnnualInterest payment Annual
March 20Semi annualJanuary 16/July 16
AnnualSeptember 9
AnnualFebruary 19, commencing on February 20, 2017
WKN A1VC6B A1X24V A1X3B7 A1Z7C3
ISIN XS0972719412 XS0953199634 XS0969344083 DE000A1Z7C39
Denomination €1,000 with min. tradable amount €1,000
€1,000 with min. tradable amount €1,000
€1,000 with min. tradable amount €1,000
€1,000 with min. tradable amount €1,000
1 Guaranteed by Continental AG2 Non-contracted rating at date of issuance3 Fitch since July 15, 2013; S&P since December 6, 2013; Moodyʼs since June 30, 20154 Non-contracted rating since February 1, 2014
Q1 2016 Results – May 4, 2016EDMR – Equity and Debt Markets Relations 27

Back-up
Q1 2016 Results – May 4, 2016EDMR – Equity and Debt Markets Relations 28

6) Back-upC ti Hi hli ht Q1 2016Corporation Highlights Q1 2016
› Sales
› EBITDA
Increase of 2.9% to €9,850.7 mn (PY: €9,568.9 mn); organic sales up 3.6%
I f 7 3% t €1 505 5 (PY €1 403 2 )› EBITDA
› EBIT
Increase of 7.3% to €1,505.5 mn (PY: €1,403.2 mn)
Increase of 6.4% to €1,040.7 mn (PY: €977.9 mn);Adj. EBIT1 increase to €1,095.0 mn (11.3% adj. EBIT1 margin);
2
› NIAT3
› EPS3
PPA2 effect -€34.0 mn; total special effects -€14.9 mn
Increase of 11.8% to €733.9 mn (PY: €656.7 mn)
EPS f €3 67 (PY €3 28)› EPS3
› Capex
EPS of €3.67 (PY: €3.28)EPS before PPA2 €3.79 (PY: €3.40 before PPA2)
Capex increased to €397.8 mn (PY: €356.8 mn); capex ratio 4.0% of sales; capex 2
› R&D
to depreciation coverage 0.9x (0.9x ex PPA2)
Expenses for research and development increased by 11.4% to €716.1 mn (PY: €643.0 mn); R&D ratio 7.3% of sales (PY: 6.7%)
› Cash flow
› Net debt
Operating cash flow up by €287.2 mn to €970.8 mn; free cash flow €489.0 mn
Net indebtedness down by €458.6 mn to €3,083.3 mn vs. FY 2015;Liquidity and undrawn credit lines amounted to €5,453.8 mn
1 Before amortization of intangibles from PPA, consolidation and special effects2 Amortization of intangibles from PPA, tax rate of 28% applied for EPS calculation3 Attributable to the shareholders of the parent
Q1 2016 Results – May 4, 2016EDMR – Equity and Debt Markets Relations 29

6) Back-upO i f V l D l tOverview of Volume Development Units (YOY change) Q1/14 H1/14 9M/14 FY 14 Q1/15 H1/15 9M/15 FY 15 Q1/16
Market data for PC & LT productionEU 9% 6% 4% 3% 4% 3% 4% 4% 2%NAFTA 5% 4% 5% 5% 1% 2% 3% 3% 4%EU and NAFTA combined 7% 5% 5% 4% 3% 3% 3% 3% 3%Worldwide 5% 4% 4% 3% 2% 1% 1% 1% 1%Worldwide 5% 4% 4% 3% 2% 1% 1% 1% 1%Continental Electronic stability control (ESC) 14% 12% 11% 12% 16% 14% 11% 11% 2%Anti-lock brake system (ABS) -13% -11% -16% -19% -34% -31% -30% -24% -11%Boosters 8% 10% 6% 5% -1% -4% -8% -7% -3%Calipers 7% 2% 1% 0% -1% 0% -3% -2% -8%Calipers 7% 2% 1% 0% 1% 0% 3% 2% 8%Advanced driver assistance systems (ADAS) 53% 50% 47% 47% 46% 53% 59% 58% 51%Engine electronic control units (ECUs) 7% 6% 6% 4% -1% -3% -5% -5% -2%Injectors -3% -3% -5% -5% -8% -8% -11% -11% -5%Transmissions 8% 8% 6% 6% 6% 2% 0% -1% -1%Turbochargers 64% 68% 71% 78% 59% 45% 50% 43% 23%Turbochargers 64% 68% 71% 78% 59% 45% 50% 43% 23%
Market data tiresPC & LT replacement tires Europe 6% 5% 4% 2% -1% 2% 0% 0% 2%PC & LT replacement tires NAFTA 7% 6% 5% 6% -6% 0% 1% 1% 5%
Commercial vehicle tires OE Europe 1% -7% -4% -7% 0% 4% 5% 5% 6%Commercial vehicle tires OE NAFTA 6% 10% 12% 12% 21% 17% 12% 7% -12%Commercial vehicle replacement tires Europe 15% 6% 3% 1% -4% 2% -1% 0% 2%Commercial vehicle replacement tires NAFTA 9% 9% 9% 8% 3% 5% 3% 3% 4%ContinentalPC & LT tires 9% 6% 5% 3% -1% 3% 2% 5% 9%
Commercial vehicle tires 13% 8% 5% 3% -3% 0% 3% 5% 7%ContiTech organic sales growth 5% 2% 2% 1% 2% 4% 4% 4% 3%
Q1 2016 Results – May 4, 2016EDMR – Equity and Debt Markets Relations 30

6) Back-upK Hi t i l C dit M t i IAS 19 ( 2011) li d6Key Historical Credit Metrics – IAS 19 (rev. 2011) applied6
(mn €)1 2011 2012 2013 2014 2015 LTM 2016Statement of Cash FlowsStatement of Cash FlowsAdjusted EBITDA2 4,247 4,822 5,094 5,318 6,094 6,201Reported EBITDA 4,228 4,967 5,095 5,134 6,001 6,104Net cash interest paid -662 -575 -534 -158 -174 -152Tax paid -466 -684 -805 -775 -1 015 -963Tax paid -466 -684 -805 -775 -1,015 -963Change in net working capital3 -556 564 -4 -207 -107 -69Other4 -256 -488 -30 175 210 283Cash flow arising from operating activities 2,289 3,785 3,722 4,168 4,916 5,203C h fl i i f i ti ti iti 1 798 2 132 1 904 2 153 3 472 2 999Cash flow arising from investing activities -1,798 -2,132 -1,904 -2,153 -3,472 -2,999 - thereof capex in PPE and intangibles -1,813 -2,081 -2,024 -2,110 -2,265 -2,299Cash flow before financing activities 491 1,653 1,818 2,015 1,444 2,204Statement of Financial PositionCash and cash equivalents 1 541 2 397 2 045 3 244 1 622 1 694Cash and cash equivalents 1,541 2,397 2,045 3,244 1,622 1,694Derivative instruments and interest-bearing investments 249 536 303 364 81 101Total indebtedness 8,562 8,253 6,638 6,432 5,245 4,878Net indebtedness 6,772 5,320 4,289 2,824 3,542 3,083Credit Ratios
1 Amounts shown may contain rounding differences2 Adjusted EBITDA starting 2011 as defined in syndicated loan but IAS 19 (rev 2011) not applied in 2012
Credit RatiosNet indebtedness / adjusted EBITDA2 1.6x 1.1x 0.8x 0.5x 0.6x 0.5xNet cash interest paid coverage (ratio)5 6.4x 8.4x 9.5x 33.7x 35.1x 40.9x
2 Adjusted EBITDA starting 2011 as defined in syndicated loan but IAS 19 (rev. 2011) not applied in 20123 Includes changes in inventories, trade accounts receivable, trade accounts payable and discounted notes4 Includes dividends received, income from at-equity accounted and other investments, incl. impairment and reversal of impairment losses, gains / losses from the disposal of assets, companies and business operations, other non-cash items as well as changes in employee benefits and other provisions and in other assets and liabilities
5 Adjusted EBITDA to net cash interest paid6 Since 2012
Q1 2016 Results – May 4, 2016EDMR – Equity and Debt Markets Relations 31

6) Back-upC D i ti d EPS B kd Q1 2016Capex, Depreciation and EPS Breakdown Q1 2016Capex, Depreciation and PPA1 (mn €) EPS ex PPA1,2 (€)
398 431 3.67 0 123.79
341 357
342393
431
4.1%3 7%
4.0%
3.67 0.12
3.7%
51 32 34
2014 2015 2016
Capex (PPE), percentage of salesDepreciation, w/o PPA Reported EPS PPA after tax EPS ex
1 1 1,22p ,PPA
pper share PPA
1 Amortization of intangibles from PPA2 Assuming corporate tax rate of 28%
1
Q1 2016 Results – May 4, 2016EDMR – Equity and Debt Markets Relations 32
6) Back-upA t ti G Fi i l Ch i & S f t
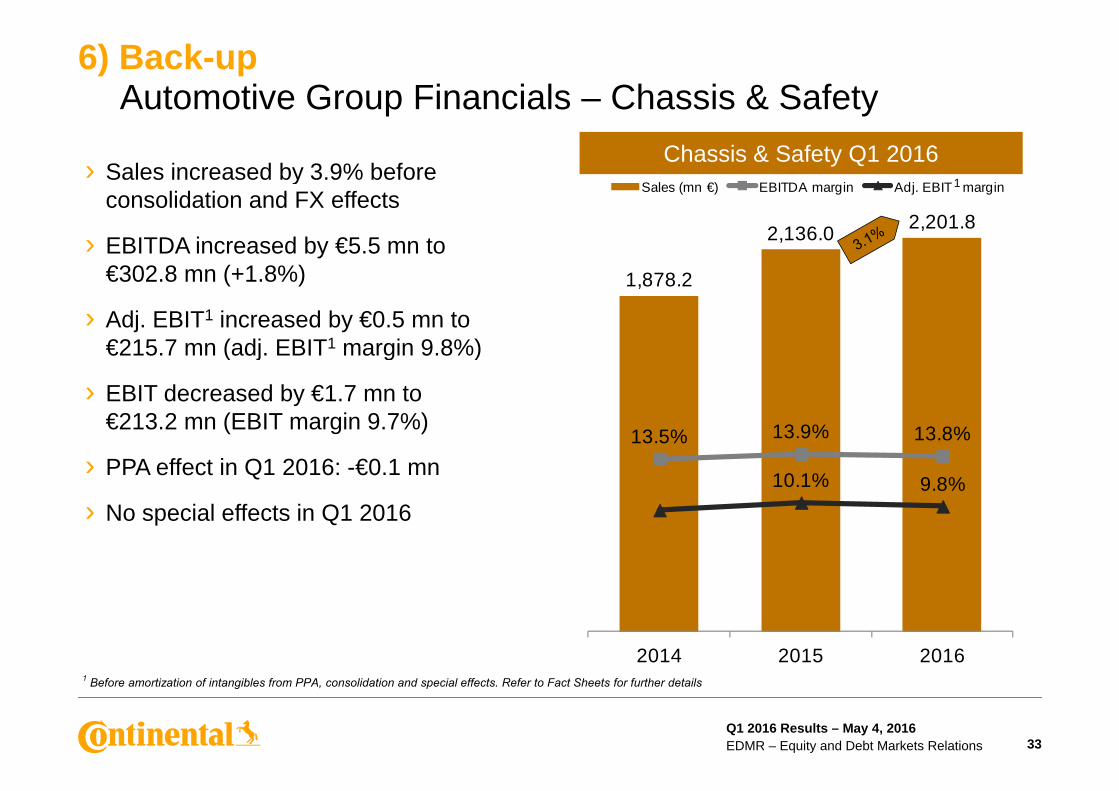
› Sales increased by 3 9% before
Automotive Group Financials – Chassis & SafetyChassis & Safety Q1 2016
2,136.0 2,201.8
Sales (mn €) EBITDA margin Adj. EBIT margin› Sales increased by 3.9% before
consolidation and FX effects
› EBITDA increased by €5.5 mn to
1
1,878.2€302.8 mn (+1.8%)
› Adj. EBIT1 increased by €0.5 mn to €215 7 mn (adj EBIT1 margin 9 8%)
13 5% 13.9% 13.8%
€215.7 mn (adj. EBIT margin 9.8%)
› EBIT decreased by €1.7 mn to €213.2 mn (EBIT margin 9.7%)
13.5% 13.8%
10.1% 9.8%› PPA effect in Q1 2016: -€0.1 mn
› No special effects in Q1 2016
2014 2015 20161 Before amortization of intangibles from PPA, consolidation and special effects. Refer to Fact Sheets for further details
Q1 2016 Results – May 4, 2016EDMR – Equity and Debt Markets Relations 33

6) Back-upA t ti G Fi i l P t iAutomotive Group Financials – Powertrain
Powertrain Q1 2016› Sales increased by 0 7% beforeSales (mn €) EBITDA margin Adj. EBIT margin1
› Sales increased by 0.7% before consolidation and FX effects
› EBITDA decreased by €18.4 mn to
1,579.1
1,826.5 1,813.5€158.8 mn (-10.4%)
› Adj. EBIT1 decreased by €26.2 mn to €72 6 mn (adj EBIT1 margin 4 0%)
9.9% 9.7% 8.8%
€72.6 mn (adj. EBIT margin 4.0%)
› EBIT decreased by €30.2 mn to €66.5 mn (EBIT margin 3.7%)
5.4% 4.0%
› PPA effect in Q1 2016: -€2.1 mn
› Special effects in Q1 2016: -€3.5 mn 0%
2014 2015 20161 Before amortization of intangibles from PPA, consolidation and special effects. Refer to Fact Sheets for further details
Q1 2016 Results – May 4, 2016EDMR – Equity and Debt Markets Relations 34

6) Back-upA t ti G Fi i l I t i
› Sales increased by 2 6% before
Automotive Group Financials – InteriorInterior Q1 2016
1 975 2 2,023.0
Sales (mn €) EBITDA margin Adj. EBIT margin
› Sales increased by 2.6% before consolidation and FX effects
› EBITDA decreased by €15.5 mn to
1
1,699.1
1,975.2 2,023.0€237.4 mn (-6.1%)
› Adj. EBIT1 decreased by €23.3 mn to €168 0 mn (adj EBIT1 margin 8 5%)
13.1% 12.8%11.7%
€168.0 mn (adj. EBIT margin 8.5%)
› EBIT decreased by €30.8 mn to €160.1 mn (EBIT margin 7.9%) 11.7%
9.7% 8 5%
› PPA effect in Q1 2016: -€9.0 mn
› No special effects in Q1 2016 8.5%
2014 2015 20161 Before amortization of intangibles from PPA, consolidation and special effects. Refer to Fact Sheets for further details
Q1 2016 Results – May 4, 2016EDMR – Equity and Debt Markets Relations 35

6) Back-upR bb G Fi i l Ti
› Sales increased by 6 7% before
Rubber Group Financials – TiresTires Q1 2016
2 512 7
Sales (mn €) EBITDA margin Adj. EBIT margin
› Sales increased by 6.7% before consolidation and FX effects
› EBITDA increased by €78.4 mn to
1
2,318.3 2,419.8
2,512.7
26 2%
€658.1 mn (+13.5%)
› Adj. EBIT1 increased by €77.4 mn to €533 0 mn (adj EBIT1 margin 21 3%)
23.5% 24.0%26.2%€533.0 mn (adj. EBIT margin 21.3%)
› EBIT increased by €76.0 mn to €530.0 mn (EBIT margin 21.1%)
18.8%21.3%› PPA effect in Q1 2016: -€1.9 mn
› No special effects in Q1 2016
2014 2015 20161 Before amortization of intangibles from PPA, consolidation and special effects. Refer to Fact Sheets for further details
Q1 2016 Results – May 4, 2016EDMR – Equity and Debt Markets Relations 36

6) Back-upTi P d Li ht T k Ti D dTires – Passenger and Light Truck Tire Demand
Replacement Tire Demand Replacement Tire Demand
15%
20%
15%
20%
for PC & LT Europe for PC & LT NAFTA
5%
10%
5%
10%
-5%
0%
-5%
0%
-20%
-15%
-10%
-15%
-10%
-25%
20%
Jan-
11
May
-11
Sep
-11
Jan-
12
May
-12
Sep
-12
Jan-
13
May
-13
Sep
-13
Jan-
14
May
-14
Sep
-14
Jan-
15
May
-15
Sep
-15
Jan-
16-25%
-20%
n-11
y-11
p-11
n-12
y-12
p-12
n-13
y-13
p-13
n-14
y-14
p-14
n-15
y-15
p-15
n-16
M M M M M
PC & LT Tire Replacement (YOY chg. monthly)
Vehicle miles YOY chg. monthly (DOT)
Jan
May
Sep Jan
May
Sep Jan
May
Sep Jan
May
Sep Jan
May
Sep Jan
PC & LT Tire Replacement (YOY chg. monthly)
1 U.S. Department of Transportation
1
Q1 2016 Results – May 4, 2016EDMR – Equity and Debt Markets Relations 37
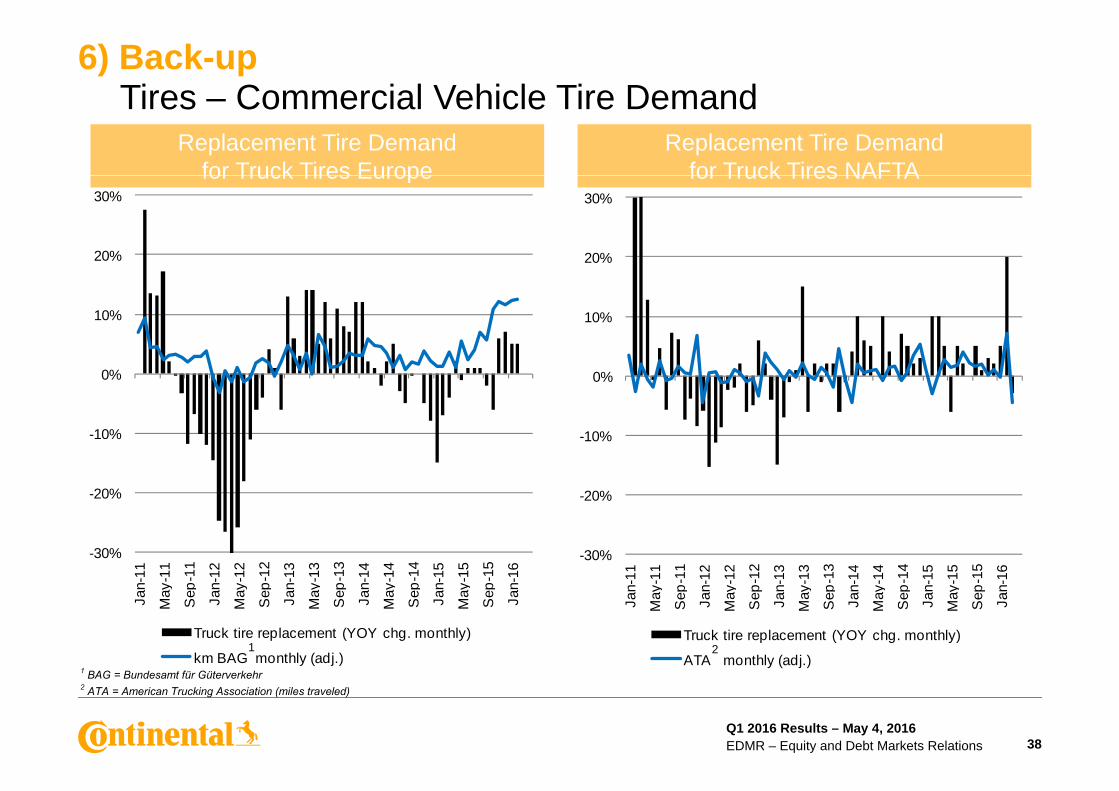
6) Back-upTi C i l V hi l Ti D dTires – Commercial Vehicle Tire Demand
Replacement Tire Demand for Truck Tires Europe
Replacement Tire Demand for Truck Tires NAFTA
20%
30%
20%
30%for Truck Tires Europe for Truck Tires NAFTA
10%10%
-10%
0%
-10%
0%
-20%
10%
-20%
%
-30%
Jan-
11
May
-11
Se p
-11
Jan-
12
Ma y
-12
Sep
-12
Jan-
13
May
-13
Se p
-13
Jan-
14
May
-14
Se p
-14
Jan-
15
May
-15
Sep
-15
Jan-
16
-30%
Jan-
11
May
-11
Se p
-11
Jan-
12
Ma y
-12
Se p
-12
Jan-
13
May
-13
Se p
-13
Jan-
14
Ma y
-14
Se p
-14
Jan-
15
May
-15
Se p
-15
Jan-
16
Truck tire replacement (YOY chg. monthly)
ATA monthly (adj.)
Truck tire replacement (YOY chg. monthly)
km BAG monthly (adj.)1 BAG = Bundesamt für Güterverkehr2 ATA = American Trucking Association (miles traveled)
21
Q1 2016 Results – May 4, 2016EDMR – Equity and Debt Markets Relations 38
6) Back-upR bb G Fi i l C tiT h
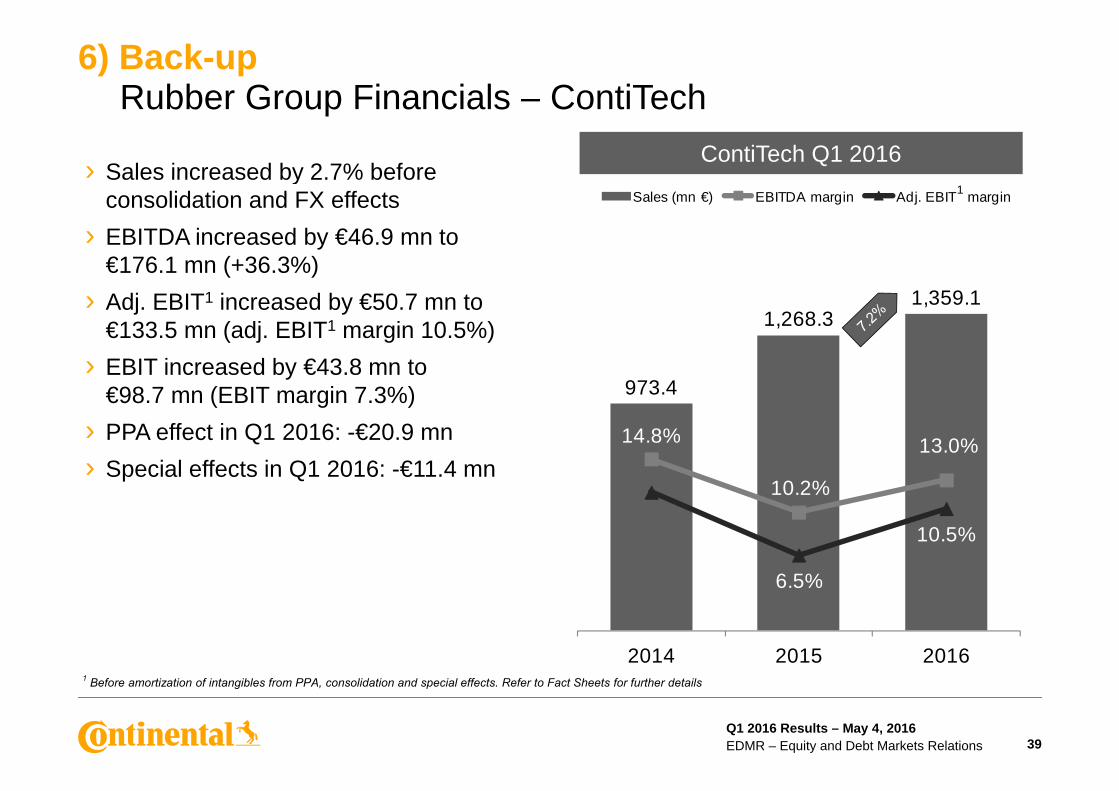
› Sales increased by 2 7% before
Rubber Group Financials – ContiTechContiTech Q1 2016
Sales (mn €) EBITDA margin Adj. EBIT margin› Sales increased by 2.7% before
consolidation and FX effects › EBITDA increased by €46.9 mn to
€176 1 mn (+36 3%)
1
1,268.31,359.1
€176.1 mn (+36.3%) › Adj. EBIT1 increased by €50.7 mn to
€133.5 mn (adj. EBIT1 margin 10.5%)
973.4
14 8% 13 0%
› EBIT increased by €43.8 mn to €98.7 mn (EBIT margin 7.3%)
› PPA effect in Q1 2016: -€20.9 mn 14.8%
10.2%
13.0%
10 5%
PPA effect in Q1 2016: €20.9 mn› Special effects in Q1 2016: -€11.4 mn
6.5%
10.5%
2014 2015 20161 Before amortization of intangibles from PPA, consolidation and special effects. Refer to Fact Sheets for further details
Q1 2016 Results – May 4, 2016EDMR – Equity and Debt Markets Relations 39

Fact Sheets 2014 – Q1 2016
Q1 2016 Results – May 4, 2016EDMR – Equity and Debt Markets Relations 40

6) Fact SheetsQ t l S l A l iQuarterly Sales Analysis
Q1 Q2 Q3 Q4 Year Q1 Q2 Q3 Q4 Year Q1 Q2 Q3 Q4 YearSales (mn €)
2014 2015 2016Q1 Q2 Q3 Q4 Year Q1 Q2 Q3 Q4 Year Q1 Q2 Q3 Q4 Year
Chassis & Safety 1,878.2 1,868.5 1,823.4 1,944.8 7,514.9 2,136.0 2,142.1 1,999.0 2,172.6 8,449.7 2,201.8
Powertrain 1,579.1 1,598.4 1,638.9 1,677.9 6,494.3 1,826.5 1,819.8 1,657.4 1,764.8 7,068.5 1,813.5
Interior 1,699.1 1,733.9 1,725.4 1,844.1 7,002.5 1,975.2 2,057.0 2,028.2 2,094.4 8,154.8 2,023.0
Tires 2,318.3 2,405.9 2,557.8 2,502.4 9,784.4 2,419.8 2,644.4 2,654.4 2,690.2 10,408.8 2,512.7, , , , , , , , , , ,
ContiTech 973.4 978.6 979.6 999.6 3,931.2 1,268.3 1,418.8 1,330.8 1,349.9 5,367.8 1,359.1
Other / Consolidation -58.0 -57.3 -55.6 -50.7 -221.6 -56.9 -52.4 -52.2 -56.1 -217.6 -59.4
Continental Corporation 8,390.1 8,528.0 8,669.5 8,918.1 34,505.7 9,568.9 10,029.7 9,617.6 10,015.8 39,232.0 9,850.7
Q1 Q2 Q3 Q4 Year Q1 Q2 Q3 Q4 Year
Chassis & Safety 13.7 14.6 9.6 11.7 12.4 3.1
Changes Y-o-Y in %2015 2016
Powertrain 15.7 13.9 1.1 5.2 8.8 -0.7
Interior 16.2 18.6 17.5 13.6 16.5 2.4
Tires 4.4 9.9 3.8 7.5 6.4 3.8
ContiTech 30.3 45.0 35.9 35.0 36.5 7.2
Continental Corporation 14 0 17 6 10 9 12 3 13 7 2 9Continental Corporation 14.0 17.6 10.9 12.3 13.7 2.9
Q1 2016 Results – May 4, 2016EDMR – Equity and Debt Markets Relations 41
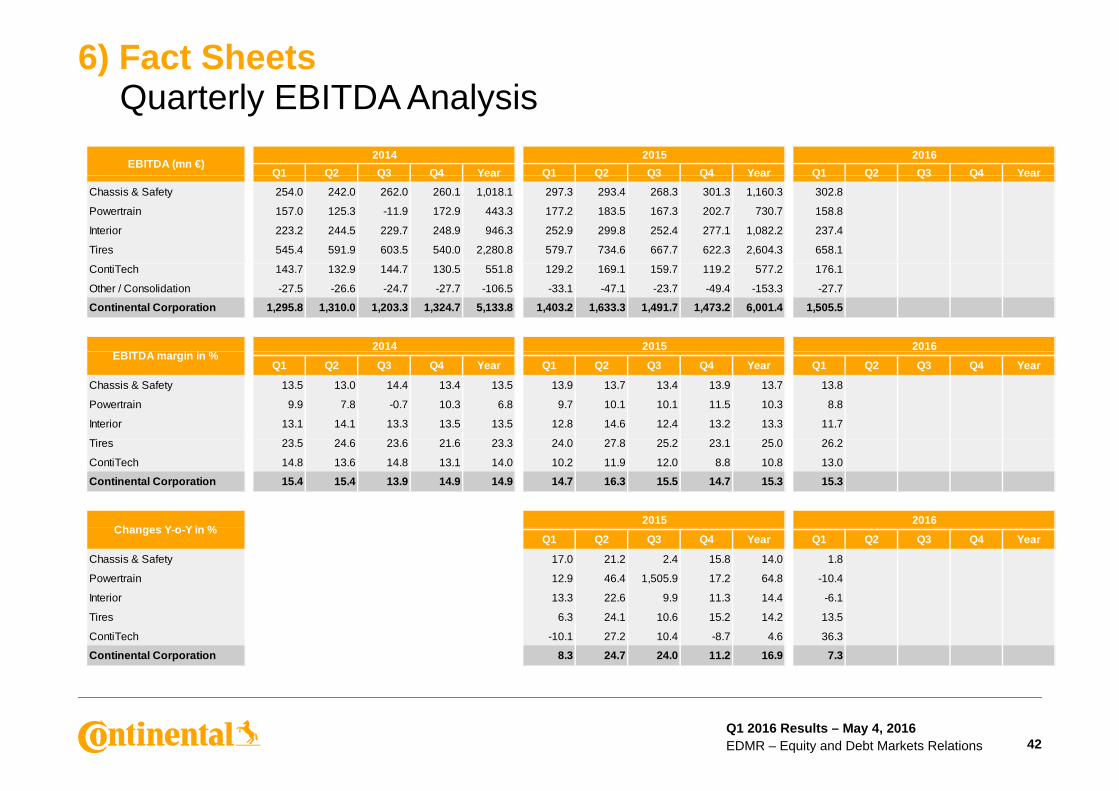
6) Fact SheetsQ t l EBITDA A l iQuarterly EBITDA Analysis
Q1 Q2 Q3 Q4 Year Q1 Q2 Q3 Q4 Year Q1 Q2 Q3 Q4 YearEBITDA (mn €)
2014 2015 2016Q1 Q2 Q3 Q4 Year Q1 Q2 Q3 Q4 Year Q1 Q2 Q3 Q4 Year
Chassis & Safety 254.0 242.0 262.0 260.1 1,018.1 297.3 293.4 268.3 301.3 1,160.3 302.8
Powertrain 157.0 125.3 -11.9 172.9 443.3 177.2 183.5 167.3 202.7 730.7 158.8
Interior 223.2 244.5 229.7 248.9 946.3 252.9 299.8 252.4 277.1 1,082.2 237.4
Tires 545.4 591.9 603.5 540.0 2,280.8 579.7 734.6 667.7 622.3 2,604.3 658.1
ContiTech 143.7 132.9 144.7 130.5 551.8 129.2 169.1 159.7 119.2 577.2 176.1
Other / Consolidation -27.5 -26.6 -24.7 -27.7 -106.5 -33.1 -47.1 -23.7 -49.4 -153.3 -27.7
Continental Corporation 1,295.8 1,310.0 1,203.3 1,324.7 5,133.8 1,403.2 1,633.3 1,491.7 1,473.2 6,001.4 1,505.5
2014 2015 2016
Q1 Q2 Q3 Q4 Year Q1 Q2 Q3 Q4 Year Q1 Q2 Q3 Q4 Year
Chassis & Safety 13.5 13.0 14.4 13.4 13.5 13.9 13.7 13.4 13.9 13.7 13.8
Powertrain 9.9 7.8 -0.7 10.3 6.8 9.7 10.1 10.1 11.5 10.3 8.8
Interior 13.1 14.1 13.3 13.5 13.5 12.8 14.6 12.4 13.2 13.3 11.7
Ti 23 5 24 6 23 6 21 6 23 3 24 0 27 8 25 2 23 1 25 0 26 2
EBITDA margin in %
Tires 23.5 24.6 23.6 21.6 23.3 24.0 27.8 25.2 23.1 25.0 26.2
ContiTech 14.8 13.6 14.8 13.1 14.0 10.2 11.9 12.0 8.8 10.8 13.0
Continental Corporation 15.4 15.4 13.9 14.9 14.9 14.7 16.3 15.5 14.7 15.3 15.3
Ch Y Y i %2015 2016
Q1 Q2 Q3 Q4 Year Q1 Q2 Q3 Q4 Year
Chassis & Safety 17.0 21.2 2.4 15.8 14.0 1.8
Powertrain 12.9 46.4 1,505.9 17.2 64.8 -10.4
Interior 13.3 22.6 9.9 11.3 14.4 -6.1
Tires 6 3 24 1 10 6 15 2 14 2 13 5
Changes Y-o-Y in %
Tires 6.3 24.1 10.6 15.2 14.2 13.5
ContiTech -10.1 27.2 10.4 -8.7 4.6 36.3
Continental Corporation 8.3 24.7 24.0 11.2 16.9 7.3
Q1 2016 Results – May 4, 2016EDMR – Equity and Debt Markets Relations 42
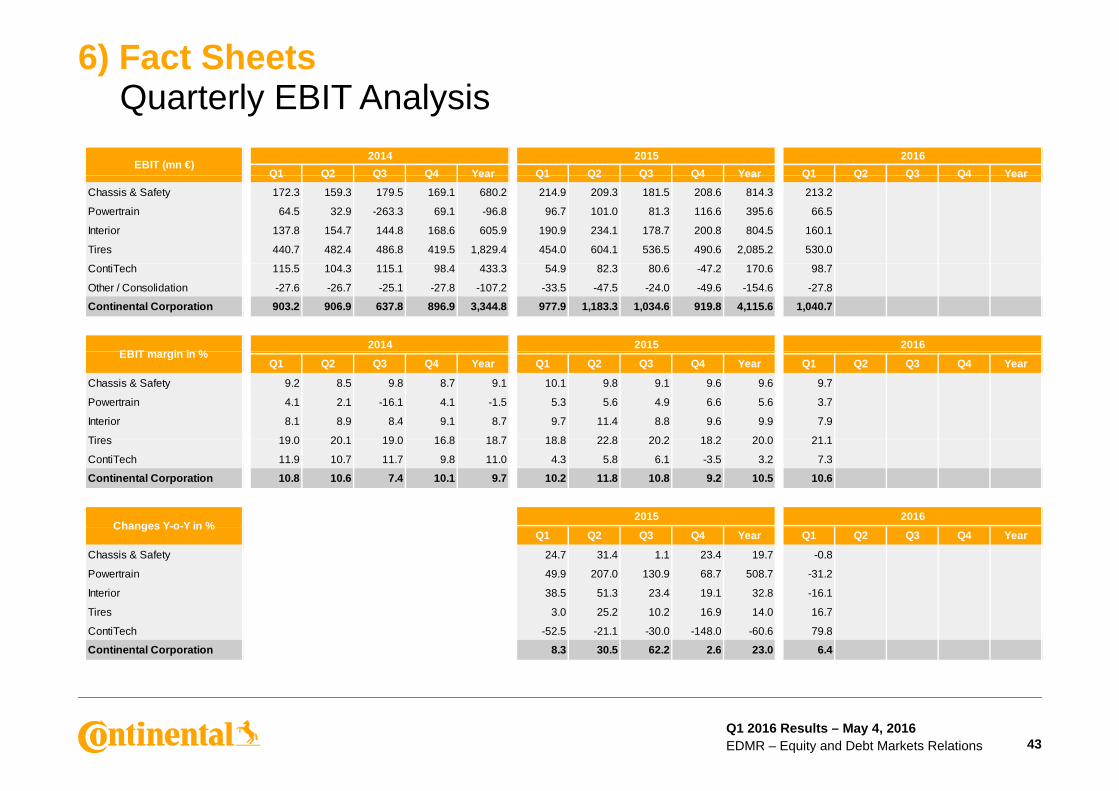
6) Fact SheetsQ t l EBIT A l iQuarterly EBIT Analysis
Q1 Q2 Q3 Q4 Year Q1 Q2 Q3 Q4 Year Q1 Q2 Q3 Q4 YearEBIT (mn €)
2014 2015 2016Q1 Q2 Q3 Q4 Year Q1 Q2 Q3 Q4 Year Q1 Q2 Q3 Q4 Year
Chassis & Safety 172.3 159.3 179.5 169.1 680.2 214.9 209.3 181.5 208.6 814.3 213.2
Powertrain 64.5 32.9 -263.3 69.1 -96.8 96.7 101.0 81.3 116.6 395.6 66.5
Interior 137.8 154.7 144.8 168.6 605.9 190.9 234.1 178.7 200.8 804.5 160.1
Tires 440.7 482.4 486.8 419.5 1,829.4 454.0 604.1 536.5 490.6 2,085.2 530.0
ContiTech 115.5 104.3 115.1 98.4 433.3 54.9 82.3 80.6 -47.2 170.6 98.7
Other / Consolidation -27.6 -26.7 -25.1 -27.8 -107.2 -33.5 -47.5 -24.0 -49.6 -154.6 -27.8
Continental Corporation 903.2 906.9 637.8 896.9 3,344.8 977.9 1,183.3 1,034.6 919.8 4,115.6 1,040.7
EBIT i i %2014 2015 2016
Q1 Q2 Q3 Q4 Year Q1 Q2 Q3 Q4 Year Q1 Q2 Q3 Q4 Year
Chassis & Safety 9.2 8.5 9.8 8.7 9.1 10.1 9.8 9.1 9.6 9.6 9.7
Powertrain 4.1 2.1 -16.1 4.1 -1.5 5.3 5.6 4.9 6.6 5.6 3.7
Interior 8.1 8.9 8.4 9.1 8.7 9.7 11.4 8.8 9.6 9.9 7.9
Tires 19 0 20 1 19 0 16 8 18 7 18 8 22 8 20 2 18 2 20 0 21 1
EBIT margin in %
Tires 19.0 20.1 19.0 16.8 18.7 18.8 22.8 20.2 18.2 20.0 21.1
ContiTech 11.9 10.7 11.7 9.8 11.0 4.3 5.8 6.1 -3.5 3.2 7.3
Continental Corporation 10.8 10.6 7.4 10.1 9.7 10.2 11.8 10.8 9.2 10.5 10.6
Changes Y-o-Y in %2015 2016
Q1 Q2 Q3 Q4 Year Q1 Q2 Q3 Q4 Year
Chassis & Safety 24.7 31.4 1.1 23.4 19.7 -0.8
Powertrain 49.9 207.0 130.9 68.7 508.7 -31.2
Interior 38.5 51.3 23.4 19.1 32.8 -16.1
Tires 3.0 25.2 10.2 16.9 14.0 16.7
Changes Y-o-Y in %
Tires 3.0 25.2 10.2 16.9 14.0 16.7
ContiTech -52.5 -21.1 -30.0 -148.0 -60.6 79.8
Continental Corporation 8.3 30.5 62.2 2.6 23.0 6.4
Q1 2016 Results – May 4, 2016EDMR – Equity and Debt Markets Relations 43
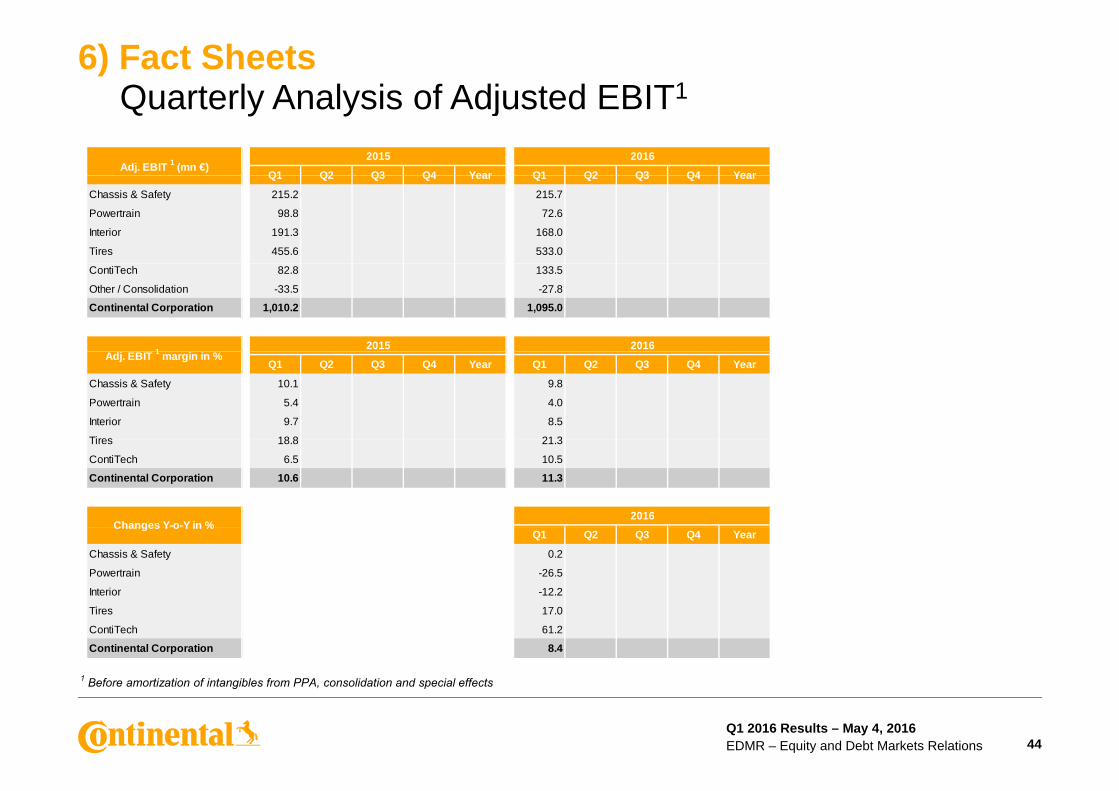
6) Fact SheetsQ t l A l i f Adj t d EBIT1Quarterly Analysis of Adjusted EBIT1
Q1 Q2 Q3 Q4 Year Q1 Q2 Q3 Q4 YearAdj. EBIT 1 (mn €)
2015 2016
Q1 Q2 Q3 Q4 Year Q1 Q2 Q3 Q4 Year
Chassis & Safety 215.2 215.7
Powertrain 98.8 72.6
Interior 191.3 168.0
Tires 455.6 533.0
ContiTech 82.8 133.5
Other / Consolidation -33.5 -27.8
Continental Corporation 1,010.2 1,095.0
1 2015 2016
Q1 Q2 Q3 Q4 Year Q1 Q2 Q3 Q4 Year
Chassis & Safety 10.1 9.8
Powertrain 5.4 4.0
Interior 9.7 8.5
Tires 18 8 21 3
Adj. EBIT 1 margin in %
Tires 18.8 21.3
ContiTech 6.5 10.5
Continental Corporation 10.6 11.3
Changes Y-o-Y in %2016
Q1 Q2 Q3 Q4 Year
Chassis & Safety 0.2
Powertrain -26.5
Interior -12.2
Tires 17.0
Changes Y o Y in %
1 Before amortization of intangibles from PPA, consolidation and special effects
ContiTech 61.2
Continental Corporation 8.4
Q1 2016 Results – May 4, 2016EDMR – Equity and Debt Markets Relations 44

6) Fact SheetsC lid t d St t t f IConsolidated Statement of Income
2016 2015 20141 - 3 1 - 3 1 - 3(mn €)
Sales 9,850.7 9,568.9 8,390.1
Cost of sales -7,249.6 -7,146.1 -6,294.4
Gross margin on sales 2,601.1 2,422.8 2,095.7
Research and development expenses -716 1 -643 0 -544 1Research and development expenses -716.1 -643.0 -544.1
Selling and logistics expenses -548.0 -520.9 -430.9
Administrative expenses -243.7 -214.5 -178.9
Other expenses and income -69.0 -77.7 -47.0
Income from at-equity accounted investees 16.4 11.2 8.4
Other income from investments - 0.0 0.0
Earnings before interest and taxes 1,040.7 977.9 903.2
Interest income 24 8 27 8 26 6Interest income 24.8 27.8 26.6
Interest expense -58.6 -83.5 -106.6
Net interest result -33.8 -55.7 -80.0
Earnings before tax 1,006.9 922.2 823.2
Income tax expense -255.8 -244.4 -215.6
Net income 751.1 677.8 607.6
Non-controlling interests -17.2 -21.1 -19.3
Net income attributable to the shareholders of the parent 733 9 656 7 588 3Net income attributable to the shareholders of the parent 733.9 656.7 588.3
Basic earnings per share (in €) 3.67 3.28 2.94
Diluted earnings per share (in €) 3.67 3.28 2.94
Q1 2016 Results – May 4, 2016EDMR – Equity and Debt Markets Relations 45

6) Fact SheetsC lid t d St t t f Fi i l P iti A tConsolidated Statement of Financial Position – Assetsin € millions March 31, 2016 Dec. 31, 2015 March 31, 2015
Goodwill 6,600.9 6,640.6 6,198.8
Other intangible assets 1,298.7 1,336.4 1,194.1
Property, plant and equipment 9,434.9 9,538.9 9,351.5
Investment property 15.8 16.0 17.6
Investments in at-equity accounted investees 354 6 345.8 299 4Investments in at equity accounted investees 354.6 345.8 299.4
Other investments 39.7 14.1 12.5
Deferred tax assets 1,815.0 1,669.7 1,894.2
Defined benefit assets 16.7 18.9 3.1
L t d i ti i t t d i t t b i i t t 31 5 17 1 289 4Long-term derivative instruments and interest-bearing investments 31.5 17.1 289.4
Long-term other financial assets 49.4 47.6 37.3
Long-term other assets 22.8 21.5 21.9
Non-current assets 19,680.0 19,666.6 19,319.8
Inventories 3,523.0 3,360.1 3,607.1
Trade accounts receivable 7,185.1 6,722.9 7,396.7
Short-term other financial assets 465.0 434.7 423.9
Short-term other assets 837.5 803.9 873.7
Income tax receivables 141.8 149.7 131.0
Short-term derivative instruments and interest-bearing investments 69.4 64.3 166.0
Cash and cash equivalents 1,693.8 1,621.5 2,372.3
Assets held for sale 10 3 12 0 53 7Assets held for sale 10.3 12.0 53.7Current assets 13,925.9 13,169.1 15,024.4
Total assets 33,605.9 32,835.7 34,344.2
Q1 2016 Results – May 4, 2016EDMR – Equity and Debt Markets Relations 46
Starting from the year under review, 2016, the structure of the equity and liabilities side is presented in an adjusted form to increase transparency with regards to employee benefits. All of the following figures from comparative periods are accordingly adjusted.
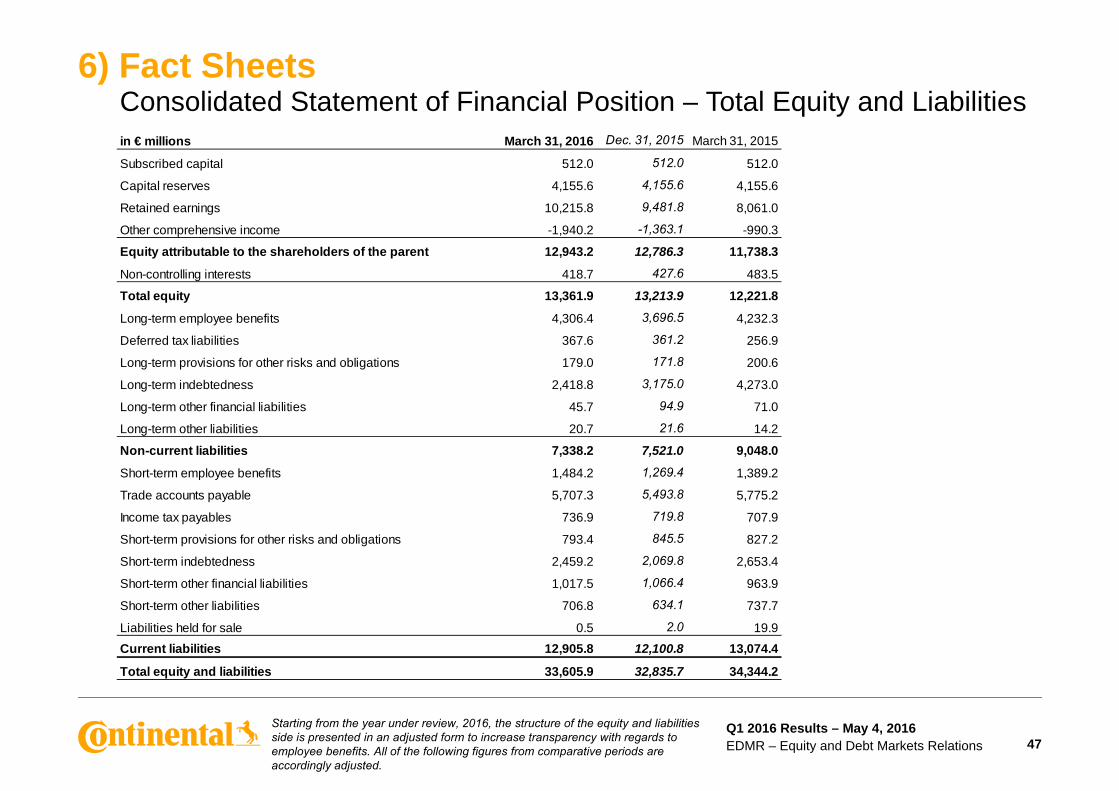
6) Fact SheetsConsolidated Statement of Financial Position – Total Equity and Liabilitiesin € millions March 31, 2016 Dec. 31, 2015 March 31, 2015
Subscribed capital 512.0 512.0 512.0
Capital reserves 4,155.6 4,155.6 4,155.6
Retained earnings 10,215.8 9,481.8 8,061.0
Other comprehensive income -1,940.2 -1,363.1 -990.3
Equity attributable to the shareholders of the parent 12,943.2 12,786.3 11,738.3
Non-controlling interests 418.7 427.6 483.5
Total equity 13,361.9 13,213.9 12,221.8
Long-term employee benefits 4,306.4 3,696.5 4,232.3
Deferred tax liabilities 367.6 361.2 256.9
Long-term provisions for other risks and obligations 179.0 171.8 200.6
Long-term indebtedness 2,418.8 3,175.0 4,273.0
Long-term other financial liabilities 45.7 94.9 71.0
Long-term other liabilities 20.7 21.6 14.2
Non-current liabilities 7,338.2 7,521.0 9,048.0
Short-term employee benefits 1,484.2 1,269.4 1,389.2
Trade accounts payable 5,707.3 5,493.8 5,775.2
Income tax payables 736.9 719.8 707.9
Short-term provisions for other risks and obligations 793.4 845.5 827.2
Short-term indebtedness 2,459.2 2,069.8 2,653.4
Short-term other financial liabilities 1,017.5 1,066.4 963.9
Short-term other liabilities 706.8 634.1 737.7
Liabilities held for sale 0.5 2.0 19.9Current liabilities 12,905.8 12,100.8 13,074.4
Total equity and liabilities 33,605.9 32,835.7 34,344.2
Q1 2016 Results – May 4, 2016EDMR – Equity and Debt Markets Relations 47
Starting from the year under review, 2016, the structure of the equity and liabilities side is presented in an adjusted form to increase transparency with regards to employee benefits. All of the following figures from comparative periods are accordingly adjusted.
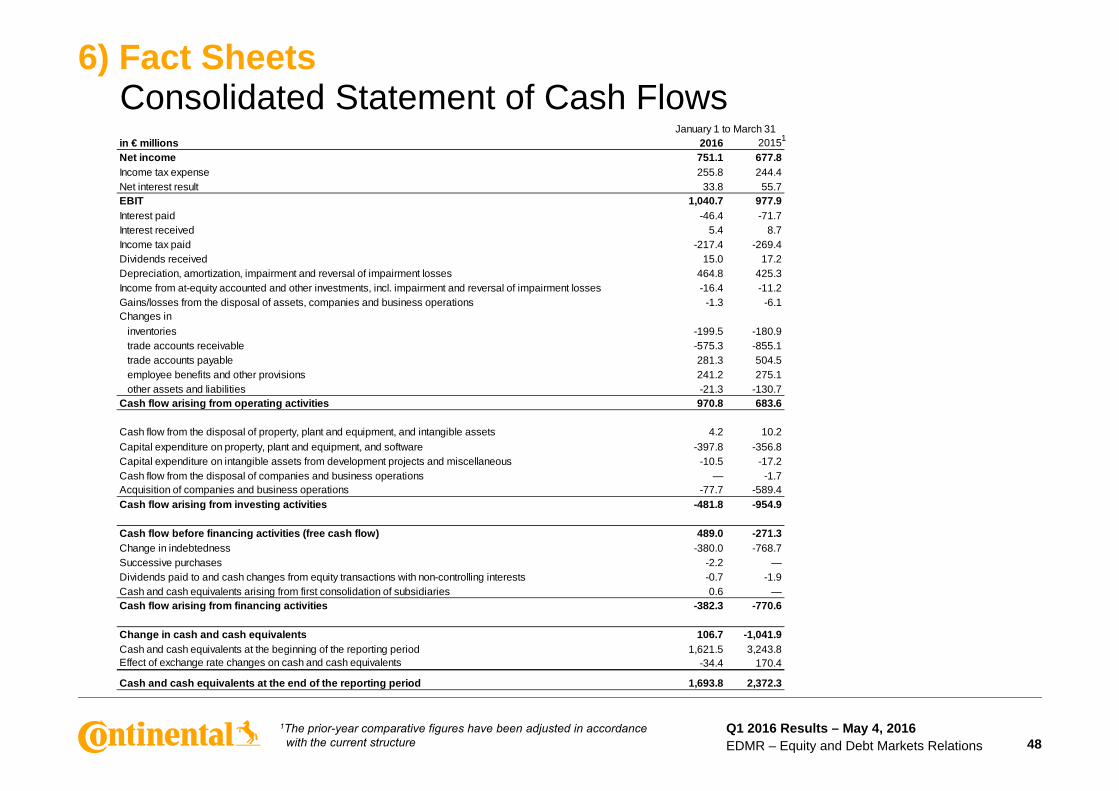
6) Fact SheetsC lid t d St t t f C h FlConsolidated Statement of Cash Flowsin € millions 2016 2015Net income 751.1 677.8Income tax expense 255.8 244.4
January 1 to March 311
Income tax expense 255.8 244.4Net interest result 33.8 55.7EBIT 1,040.7 977.9Interest paid -46.4 -71.7Interest received 5.4 8.7Income tax paid -217.4 -269.4Dividends received 15.0 17.2Depreciation, amortization, impairment and reversal of impairment losses 464.8 425.3Income from at-equity accounted and other investments, incl. impairment and reversal of impairment losses -16.4 -11.2Gains/losses from the disposal of assets, companies and business operations -1.3 -6.1Changes in
inventories -199.5 -180.9trade accounts receivable -575.3 -855.1trade accounts payable 281.3 504.5employee benefits and other provisions 241.2 275.1other assets and liabilities -21.3 -130.7
Cash flow arising from operating activities 970.8 683.6
Cash flow from the disposal of property, plant and equipment, and intangible assets 4.2 10.2Capital expenditure on property, plant and equipment, and software -397.8 -356.8Capital expenditure on intangible assets from development projects and miscellaneous -10.5 -17.2Cash flow from the disposal of companies and business operations — -1.7Acquisition of companies and business operations -77.7 -589.4Cash flow arising from investing activities -481.8 -954.9
Cash flow before financing activities (free cash flow) 489.0 -271.3Change in indebtedness -380.0 -768.7Successive purchases -2.2 —Dividends paid to and cash changes from equity transactions with non-controlling interests -0.7 -1.9Cash and cash equivalents arising from first consolidation of subsidiaries 0.6 —Cash flow arising from financing activities -382.3 -770.6
Change in cash and cash equivalents 106.7 -1,041.9Cash and cash equivalents at the beginning of the reporting period 1,621.5 3,243.8Effect of exchange rate changes on cash and cash equivalents -34.4 170.4
Cash and cash equivalents at the end of the reporting period 1,693.8 2,372.3
Q1 2016 Results – May 4, 2016EDMR – Equity and Debt Markets Relations 48
1The prior-year comparative figures have been adjusted in accordance with the current structure
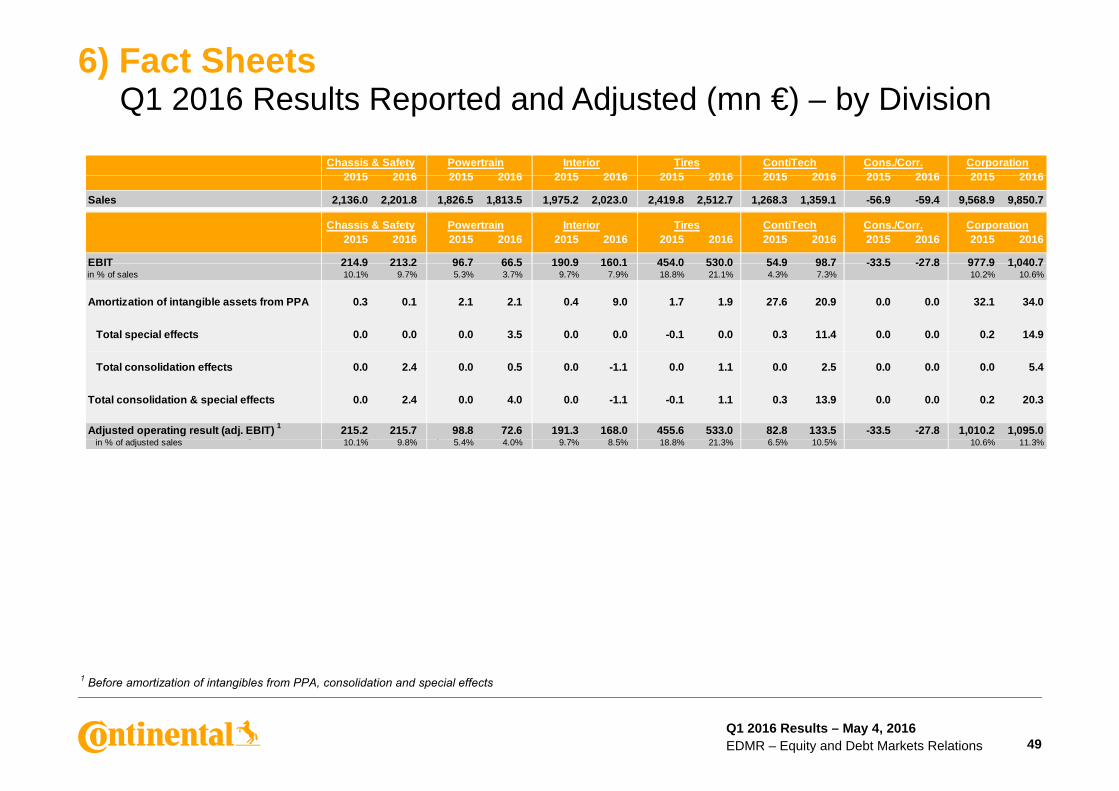
6) Fact SheetsQ1 2016 R lt R t d d Adj t d ( €) b Di i iQ1 2016 Results Reported and Adjusted (mn €) – by Division
2015 2016 2015 2016 2015 2016 2015 2016 2015 2016 2015 2016 2015 2016CorporationInteriorChassis & Safety Powertrain Tires ContiTech Cons./Corr.
2015 2016 2015 2016 2015 2016 2015 2016 2015 2016 2015 2016 2015 2016
Sales 2,136.0 2,201.8 1,826.5 1,813.5 1,975.2 2,023.0 2,419.8 2,512.7 1,268.3 1,359.1 -56.9 -59.4 9,568.9 9,850.7
2015 2016 2015 2016 2015 2016 2015 2016 2015 2016 2015 2016 2015 2016
EBIT 214 9 213 2 96 7 66 5 190 9 160 1 454 0 530 0 54 9 98 7 -33 5 -27 8 977 9 1 040 7
InteriorChassis & Safety Powertrain Tires ContiTech Cons./Corr. Corporation
EBIT 214.9 213.2 96.7 66.5 190.9 160.1 454.0 530.0 54.9 98.7 -33.5 -27.8 977.9 1,040.7in % of sales 10.1% 9.7% 5.3% 3.7% 9.7% 7.9% 18.8% 21.1% 4.3% 7.3% 10.2% 10.6%
Amortization of intangible assets from PPA 0.3 0.1 2.1 2.1 0.4 9.0 1.7 1.9 27.6 20.9 0.0 0.0 32.1 34.0
Total special effects 0.0 0.0 0.0 3.5 0.0 0.0 -0.1 0.0 0.3 11.4 0.0 0.0 0.2 14.9
1 Before amortization of intangibles from PPA, changes in the scope of consolidation and special effects
Total consolidation effects 0.0 2.4 0.0 0.5 0.0 -1.1 0.0 1.1 0.0 2.5 0.0 0.0 0.0 5.4
Total consolidation & special effects 0.0 2.4 0.0 4.0 0.0 -1.1 -0.1 1.1 0.3 13.9 0.0 0.0 0.2 20.3
Adjusted operating result (adj. EBIT) 1 215.2 215.7 98.8 72.6 191.3 168.0 455.6 533.0 82.8 133.5 -33.5 -27.8 1,010.2 1,095.0i % f dj t d l 10 1% 9 8% 5 4% 4 0% 9 7% 8 5% 18 8% 21 3% 6 5% 10 5% 10 6% 11 3%
g g p pin % of adjusted sales 10.1% 9.8% 5.4% 4.0% 9.7% 8.5% 18.8% 21.3% 6.5% 10.5% 10.6% 11.3%
1 Before amortization of intangibles from PPA, consolidation and special effects
Q1 2016 Results – May 4, 2016EDMR – Equity and Debt Markets Relations 49
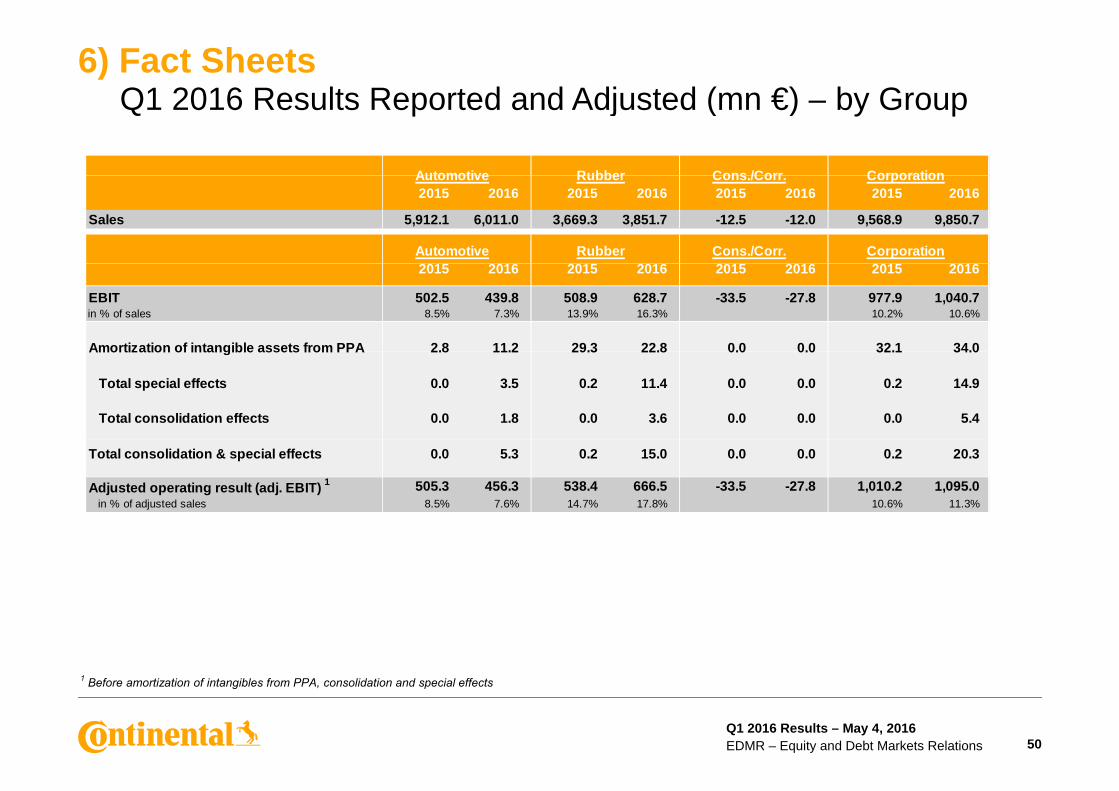
6) Fact SheetsQ1 2016 R lt R t d d Adj t d ( €) b GQ1 2016 Results Reported and Adjusted (mn €) – by Group
Automotive Rubber Cons /Corr Corporation2015 2016 2015 2016 2015 2016 2015 2016
Sales 5,912.1 6,011.0 3,669.3 3,851.7 -12.5 -12.0 9,568.9 9,850.7
Automotive Rubber Cons./Corr. Corporation
Automotive Rubber Cons./Corr. Corporation
2015 2016 2015 2016 2015 2016 2015 2016
EBIT 502.5 439.8 508.9 628.7 -33.5 -27.8 977.9 1,040.7in % of sales 8.5% 7.3% 13.9% 16.3% 10.2% 10.6%
Amortization of intangible assets from PPA 2.8 11.2 29.3 22.8 0.0 0.0 32.1 34.0Amortization of intangible assets from PPA 2.8 11.2 29.3 22.8 0.0 0.0 32.1 34.0
Total special effects 0.0 3.5 0.2 11.4 0.0 0.0 0.2 14.9
Total consolidation effects 0.0 1.8 0.0 3.6 0.0 0.0 0.0 5.4
1 Before amortization of intangibles from PPA, changes in the scope of consolidation and special effectsTotal consolidation & special effects 0.0 5.3 0.2 15.0 0.0 0.0 0.2 20.3
Adjusted operating result (adj. EBIT) 1 505.3 456.3 538.4 666.5 -33.5 -27.8 1,010.2 1,095.0in % of adjusted sales 8.5% 7.6% 14.7% 17.8% 10.6% 11.3%
1 Before amortization of intangibles from PPA, consolidation and special effects
Q1 2016 Results – May 4, 2016EDMR – Equity and Debt Markets Relations 50
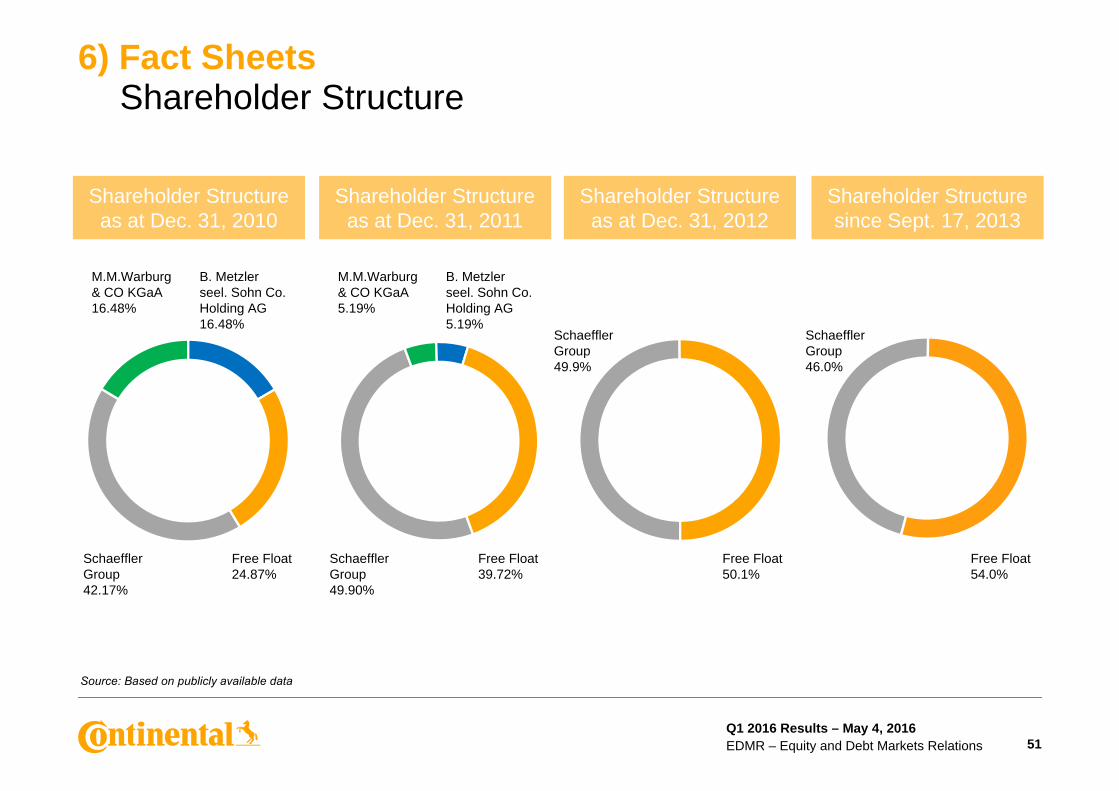
6) Fact SheetsSh h ld St tShareholder Structure
Shareholder Structure as at Dec. 31, 2010
Shareholder Structure as at Dec. 31, 2011
Shareholder Structure as at Dec. 31, 2012
Shareholder Structure since Sept. 17, 2013
M.M.Warburg & CO KGaA16.48%
M.M.Warburg & CO KGaA5.19%
B. Metzler seel. Sohn Co. Holding AG16.48%
B. Metzler seel. Sohn Co. Holding AG5.19%
Schaeffler Group
Schaeffler GroupGroup
49.9%Group46.0%
Schaeffler Group42.17%
Schaeffler Group49.90%
Free Float39.72%
Free Float50.1%
Free Float54.0%
Free Float24.87%
Source: Based on publicly available data
Q1 2016 Results – May 4, 2016EDMR – Equity and Debt Markets Relations 51

6) Fact SheetsC ti t l’ C dit R tiContinental’s Credit Rating
S&P, Fitch / Moody’sStandard & Poor’s1 Moody’s2 Fitch3
BBB+ / Baa1
tmen
t ad
e
BBB / Baa2
BBB- / Baa3
Inve
stG
ra
BB+ / Ba1
men
t
BB / Ba2
BB- / Ba3Before
Siemens VDO
Non
-Inve
stm
Gra
de
B+ / B1
VDO
2000 2001 2002 2003 2004 2005 2006 2007 2008 2009 2010 2011 2012 2013 2014 2015 2016
B / B2
Q1 2016 Results – May 4, 2016EDMR – Equity and Debt Markets Relations 52
1 Contracted rating since May 19, 20002 Non-contracted rating since February 1, 20143 Contracted rating since November 7, 2013

ReferencesU f l Li kUseful Links
Continental Investor Relations website http://www.continental-ir.com
Annual and interim reports http://www.continental-corporation.com/www/portal_com_en/themes/ir/financial_reports/
2015 Fact Book http://www continental2015 Fact Book http://www.continental-corporation.com/www/portal_com_en/themes/ir/financial_reports/
Investor Relationsevents and presentations
http://www.continental-corporation.com/www/portal_com_en/themes/ir/events/
Sustainability at Continental (presentation and fact sheet for investors)
http://www.continental-ir.com
C t S i l R ibilit htt // ti t l t i bilitCorporate Social Responsibility http://www.continental-sustainability.com
Corporate Governance Principles http://www.continental-corporation.com/www/portal_com_en/themes/ir/corporate_governance/
Continental share http://www.continental-corporation.com/www/portal_com_en/themes/ir/share/
Continental bonds and rating http://www.continental-corporation.com/www/portal_com_en/themes/ir/bonds/
Continental IR mobile website http://continental.ir-portal.de
Q1 2016 Results – May 4, 2016EDMR – Equity and Debt Markets Relations 53