Q1 2015 Conference Call - Moodle - Université Lille...
63
Q1 2015 Conference Call April 30, 2015
Transcript of Q1 2015 Conference Call - Moodle - Université Lille...

Q1 2015 Conference CallApril 30, 2015

Agenda
Mark Alles, President & Chief Operating Officer
Peter Kellogg, Chief Financial Officer
Jackie Fouse, President, Global Hematology & Oncology
Scott Smith, President, Global I&I
B b H i Ch i & Chi f E ti Offi
Q&A
Bob Hugin, Chairman & Chief Executive Officer
2
Q&A
Forward Looking Statements and Adjusted Financial Information
This presentation contains forward-looking statements, which are generally statements that are nothistorical facts. Forward-looking statements can be identified by the words “expects,” “anticipates,”“believes,” “intends,” “estimates,” “plans,” “will,” “outlook” and similar expressions. Forward-looking, , , p , , p gstatements are based on management’s current plans, estimates, assumptions and projections, andspeak only as of the date they are made. We undertake no obligation to update any forward-lookingstatement in light of new information or future events, except as otherwise required by law. Forward-looking statements involve inherent risks and uncertainties, most of which are difficult to predict andare generally beyond our control Actual results or outcomes may differ materially from those impliedare generally beyond our control. Actual results or outcomes may differ materially from those impliedby the forward-looking statements as a result of the impact of a number of factors, many of whichare discussed in more detail in our Annual Report on Form 10-K and our other reports filed with theSecurities and Exchange Commission.
In addition to financial information prepared in accordance with U.S. GAAP, this presentation alsocontains adjusted financial measures that we believe provide investors and management withsupplemental information relating to operating performance and trends that facilitate comparisonsbetween periods and with respect to projected information. These adjusted financial measures arenon-GAAP and should be considered in addition to but not as a substitute for the informationnon GAAP and should be considered in addition to, but not as a substitute for, the informationprepared in accordance with U.S. GAAP. We typically exclude certain GAAP items thatmanagement does not believe affect our basic operations and that do not meet the GAAP definitionof unusual or non-recurring items. Other companies may define these measures in different ways.Further information relevant to the interpretation of adjusted financial measures, and reconciliations
f th dj t d fi i l t th t bl GAAP b f d
3
of these adjusted financial measures to the most comparable GAAP measures, may be found onCelgene’s website at www.Celgene.com in the “Investor Relations” section.

Mark Alles

Q1 2015: Strong Growth and Investment for the Future
Outstanding Financial ResultsOutstanding Financial Results
– Strong top- and bottom-line growth – Continued operating momentum with improving adjusted margins
– Growth of key products driven by increased market share and duration
Strong Performance Across All Operating MetricsStrong Performance Across All Operating Metrics
– Significant global regulatory approvals across the portfolio
Building for the FutureBuilding for the Future
– Advancing early- to mid-stage pipeline programs– Investing in next generation growth drivers
gg
5

Peter Kellogg

Q1 2015 Financial Highlights
Strong Q1 E ec tion Pro ides Fo ndation for F t re Gro thStrong Q1 E ec tion Pro ides Fo ndation for F t re Gro thStrong Q1 Execution Provides Foundation for Future GrowthStrong Q1 Execution Provides Foundation for Future Growth
Q1 Product Approvals Provide New Growth DriversQ1 Product Approvals Provide New Growth Drivers
Investing in Next-Generation Growth DriversInvesting in Next-Generation Growth Drivers
Executing a Balanced Capital Allocation StrategyExecuting a Balanced Capital Allocation Strategy
7
Executing a Balanced Capital Allocation Strategy Executing a Balanced Capital Allocation Strategy

Total Net Product Sales(Growth Rates = Growth vs. Prior Year Period)
$1,708
$2,055
s
$1,429
$ M
illio
ns
↑15% ↑19% ↑20%
Q1:13 Q1:14 Q1:15
8

Volume Drove Q1 2015 Growth
Contribution to Q1:15 Net Product Sales Growth(Growth Rates = Growth vs. Prior Year Period)
$2 000
↑20.4%↓1.6%↑19.3% ↑2.7%
$1,500
$2,000
lions
$1,000
Mill
$0
$500
$0Q1:14 Volume Price Fx / Hedge Q1:15
9
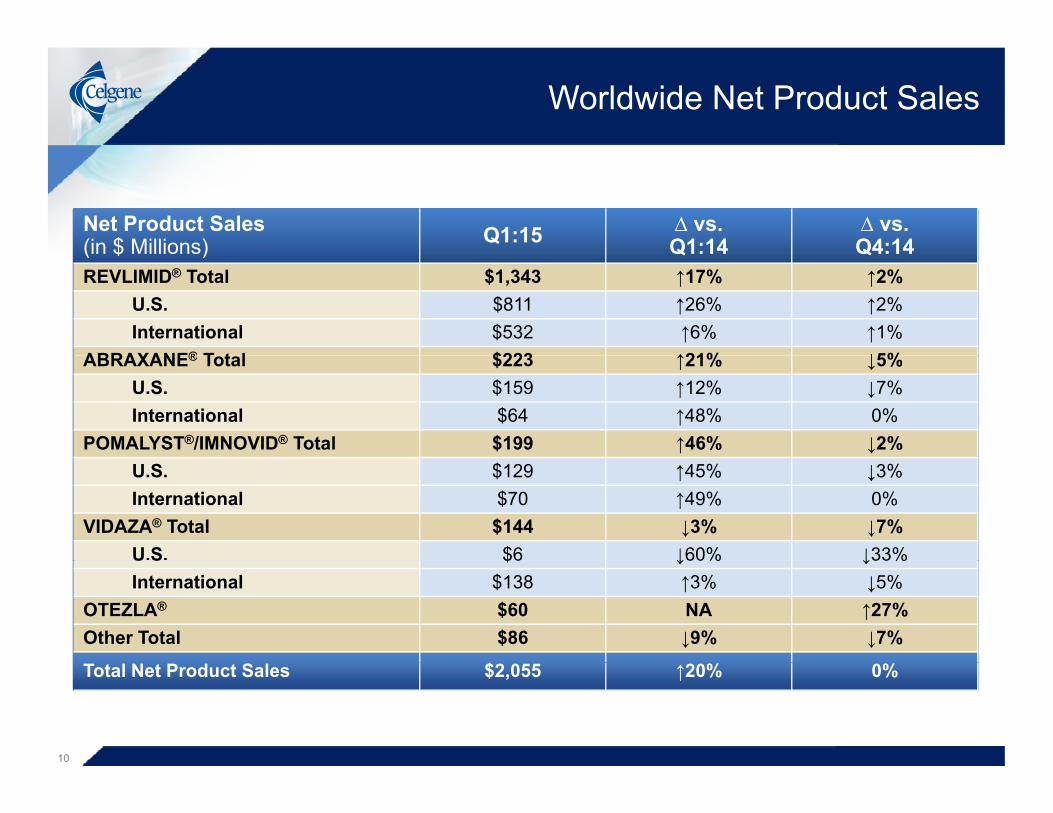
Worldwide Net Product Sales
Net Product Sales(in $ Millions) Q1:15 ∆ vs.
Q1:14∆ vs.Q4:14(in $ Millions) Q1:14 Q4:14
REVLIMID® Total $1,343 ↑17% ↑2%U.S. $811 ↑26% ↑2%International $532 ↑6% ↑1%
ABRAXANE® T t l $223 ↑21% ↓5%ABRAXANE® Total $223 ↑21% ↓5%U.S. $159 ↑12% ↓7%International $64 ↑48% 0%
POMALYST®/IMNOVID® Total $199 ↑46% ↓2%U.S. $129 ↑45% ↓3%International $70 ↑49% 0%
VIDAZA® Total $144 ↓3% ↓7%U.S. $6 ↓60% ↓33%U S $6 ↓60% ↓33%International $138 ↑3% ↓5%
OTEZLA® $60 NA ↑27%Other Total $86 ↓9% ↓7%
$
10
Total Net Product Sales $2,055 ↑20% 0%

Adjusted Diluted Earnings Per Share(Growth Rate = Growth vs. Prior Year Period)
$1 07
$0.83
$1.07
e
$0.68$
Per S
hare
↑27% ↑22%Dol
lars
↑29%
Q1:13 Q1:14 Q1:15
11
Footnote: Adjusted EPS is split-adjusted for Q1:13 and Q1:14

Key P&L Line Items (Adjusted)
Q1:15 ∆ vs. ∆ vs.Q1:15 Q1:14 Q4:14
Product Gross Margin 95.3% 0 bps 0 bps
R&D expenses% of revenue
$431M 20.7%
0 bps ↓220 bps
SG&A expenses $463MSG&A expenses% of revenue
$463M 22.3%
↓190 bps ↓70 bps
Operating Margin 52.4% ↑190 bps ↑280 bps
Effective Tax Rate 15.7% ↓90 bps ↑40 bps
12

Q1 2015 Adjusted Diluted EPS Growth Driven by Increased Operating Income
Contribution to Q1:15 Adjusted Diluted EPS
$1.07$0.21$0.83 $0.01 $0.02$0.00
Shar
eD
olla
rs P
er
Q1:14 Operating Financial Tax Rate Share Q1:15
D
Q p gIncome Income /
ExpenseCount
Q
13
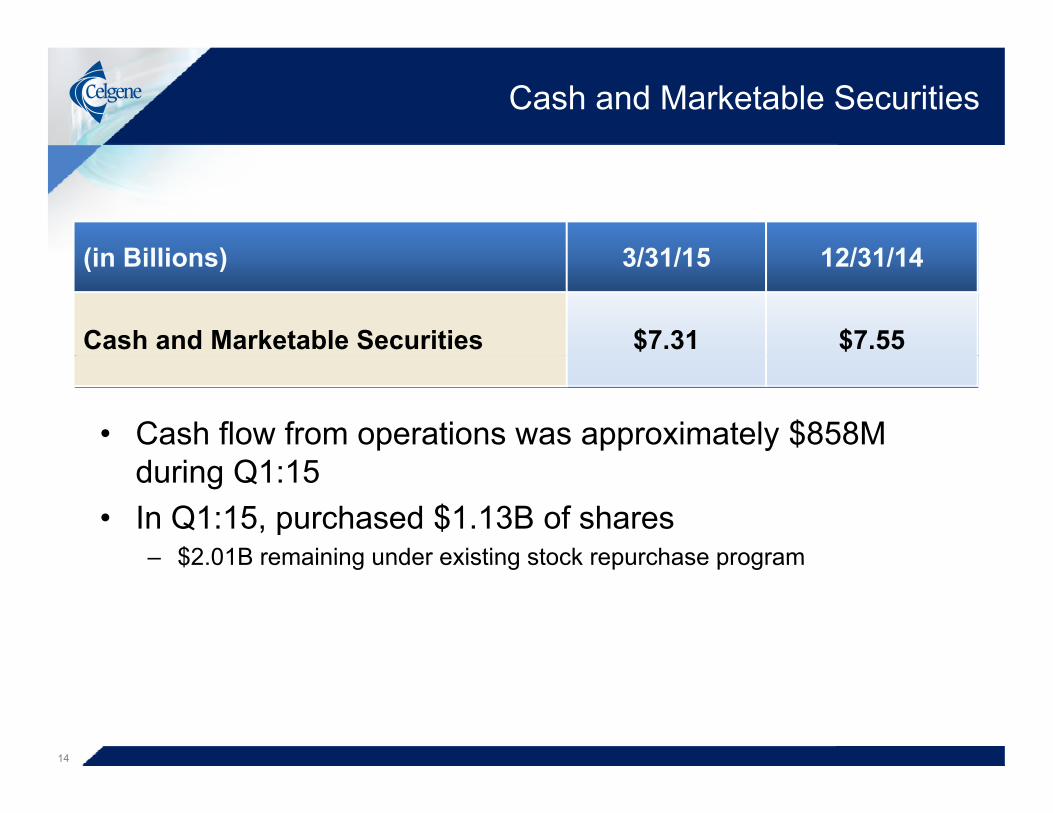
Cash and Marketable Securities
(in Billions) 3/31/15 12/31/14(in Billions) 3/31/15 12/31/14
Cash and Marketable Securities $7.31 $7.55
• Cash flow from operations was approximately $858M during Q1:15
• In Q1:15, purchased $1.13B of shares– $2 01B remaining under existing stock repurchase program$2.01B remaining under existing stock repurchase program
14

Focused on Returns
45 0%$14 0
ROIC
35.0%
40.0%
45.0%
$10.0
$12.0
$14.0
20.0%
25.0%
30.0%
$6.0
$8.0
$10.0
illio
n
5 0%
10.0%
15.0%
$2.0
$4.0
$ B
i
Average Invested Capital0.0%
5.0%
$0.02009 2010 2011 2012 2013 2014 2015 (TTM)
Capital Base Excluding Cash* Capital Base ROIC Excluding Cash* ROIC
Average Invested Capital
Cap ta ase c ud g Cas Cap ta ase O C c ud g Cas O C
15
* For purposes of this calculation, cash includes cash and cash equivalents and marketable securities available for sale.
Footnote: Refer to reconciliation tables for ROIC calculation methodology. Calculation revised in 2015 for all prior periods to reflect amortization of certain charges excluded from 2008 calculation.
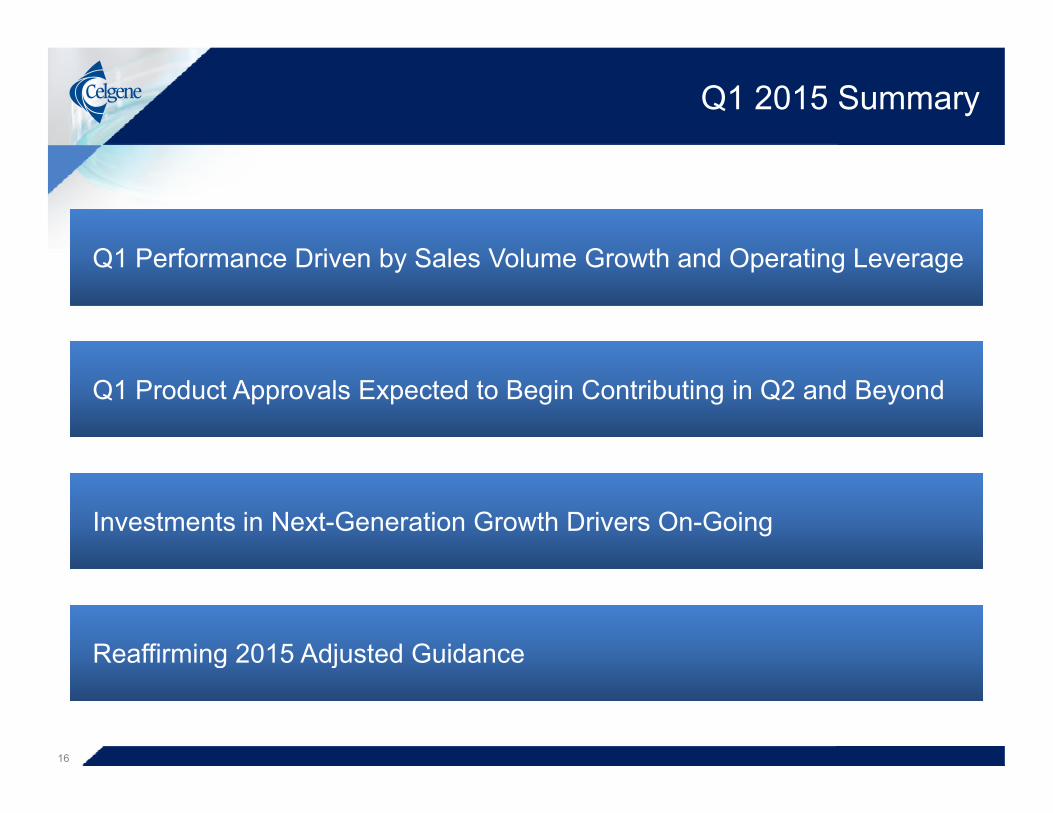
Q1 2015 Summary
Q1 P f D i b S l V l G th d O ti LQ1 P f D i b S l V l G th d O ti LQ1 Performance Driven by Sales Volume Growth and Operating LeverageQ1 Performance Driven by Sales Volume Growth and Operating Leverage
Q1 Product Approvals Expected to Begin Contributing in Q2 and BeyondQ1 Product Approvals Expected to Begin Contributing in Q2 and Beyond
Investments in Next-Generation Growth Drivers On-GoingInvestments in Next-Generation Growth Drivers On-Going
Reaffirming 2015 Adjusted GuidanceReaffirming 2015 Adjusted Guidance
16
g jg j

Jackie Fouse
Q1 2015 Hematology & Oncology Franchise Results
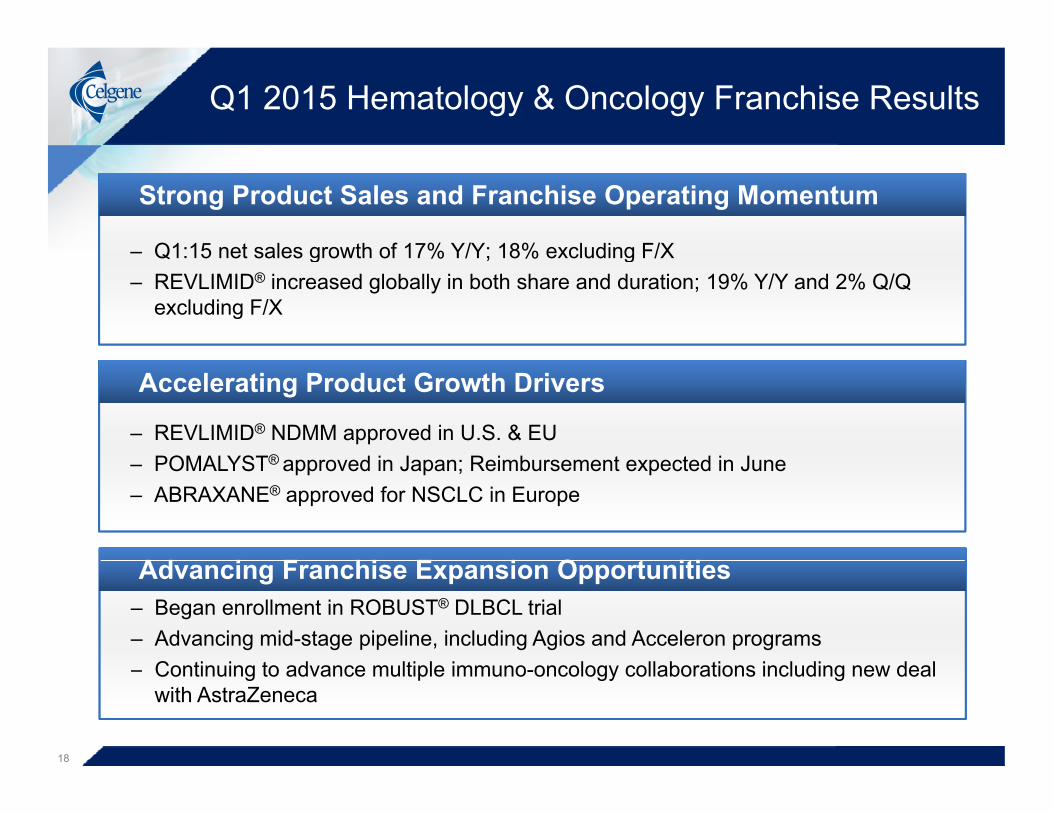
– Q1:15 net sales growth of 17% Y/Y; 18% excluding F/X
Strong Product Sales and Franchise Operating MomentumStrong Product Sales and Franchise Operating Momentum
– Q1:15 net sales growth of 17% Y/Y; 18% excluding F/X– REVLIMID® increased globally in both share and duration; 19% Y/Y and 2% Q/Q
excluding F/X
– REVLIMID® NDMM approved in U.S. & EUPOMALYST® d i J R i b t t d i J
Accelerating Product Growth DriversAccelerating Product Growth Drivers
– POMALYST® approved in Japan; Reimbursement expected in June– ABRAXANE® approved for NSCLC in Europe
Ad i F hi E i O t itiAd i F hi E i O t iti– Began enrollment in ROBUST® DLBCL trial– Advancing mid-stage pipeline, including Agios and Acceleron programs
C ti i t d lti l i l ll b ti i l di d l
Advancing Franchise Expansion OpportunitiesAdvancing Franchise Expansion Opportunities
18
– Continuing to advance multiple immuno-oncology collaborations including new deal with AstraZeneca
Q1 2015 REVLIMID® Net Sales Summary
Current Results & Future Growth DriversCurrent Results & Future Growth Drivers
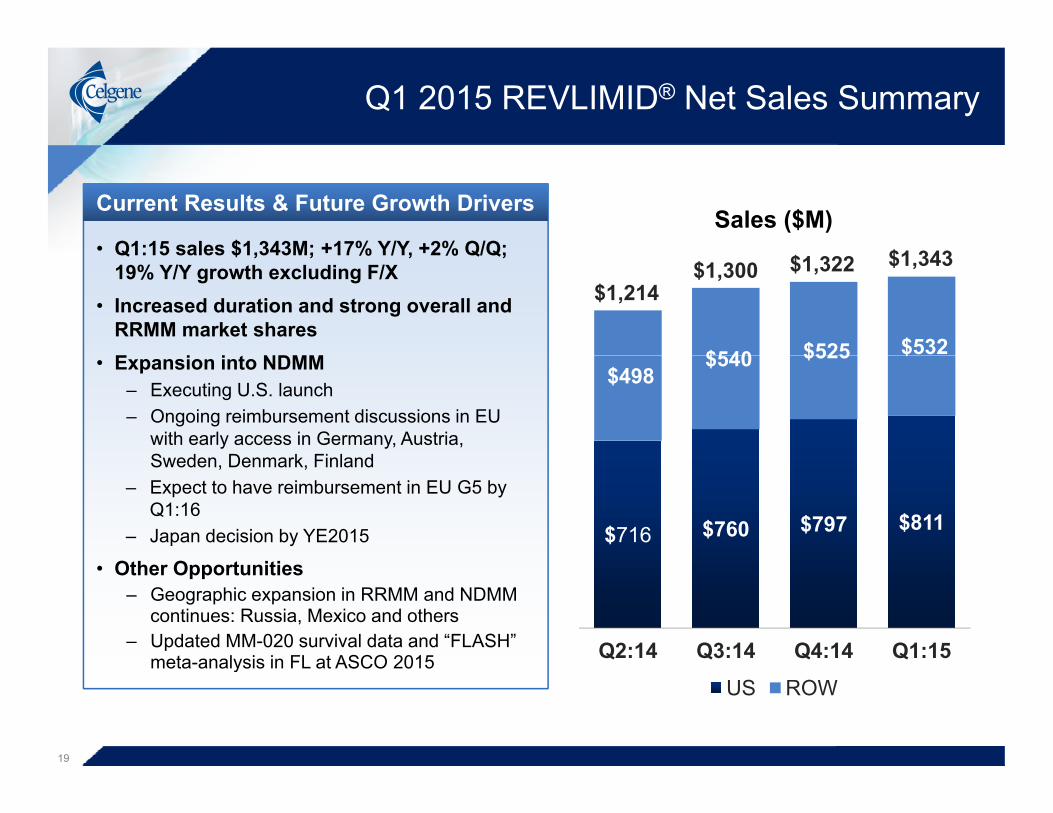
• Q1:15 sales $1,343M; +17% Y/Y, +2% Q/Q;Sales ($M)
$1 343Q1:15 sales $1,343M; +17% Y/Y, +2% Q/Q; 19% Y/Y growth excluding F/X
• Increased duration and strong overall and RRMM market shares E i i NDMM $540 $525 $532
$1,214$1,300 $1,322 $1,343
• Expansion into NDMM– Executing U.S. launch – Ongoing reimbursement discussions in EU
with early access in Germany, Austria, Sweden Denmark Finland
$498 $540 $525 $
Sweden, Denmark, Finland– Expect to have reimbursement in EU G5 by
Q1:16– Japan decision by YE2015 $716 $760 $797 $811
• Other Opportunities– Geographic expansion in RRMM and NDMM
continues: Russia, Mexico and others– Updated MM-020 survival data and “FLASH”
meta-analysis in FL at ASCO 2015 Q2:14 Q3:14 Q4:14 Q1:15
19
meta-analysis in FL at ASCO 2015US ROW
2015 REVLIMID® Growth Drivers
Total REVLIMID® by Quarter 2015 Commercial Drivers
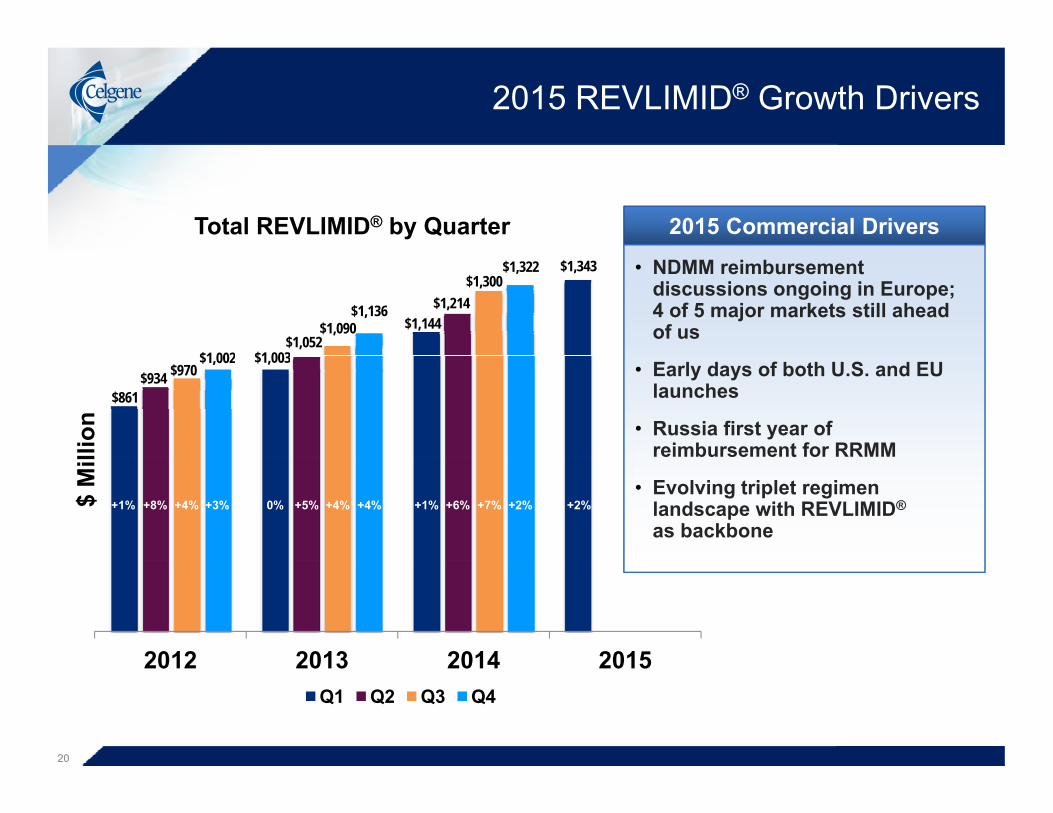
$1 003
$1,144
$1,343
$1,052
$1,214$1,090
$1,300
$1 002
$1,136
$1,322 • NDMM reimbursement discussions ongoing in Europe; 4 of 5 major markets still ahead of us
$861
$1,003$934 $970
$1,002 • Early days of both U.S. and EU launches
• Russia first year of reimbursement for RRMMlli
on
+2%+1% +6% +7% +2% +2%+5% +4% +4% +1%+8% +4% +3% 0%
• Evolving triplet regimen landscape with REVLIMID®
as backbone
$ M
il
2012 2013 2014 20150%
2012 2013 2014 2015Q1 Q2 Q3 Q4
20

Q1 2015 POMALYST®/IMNOVID® Sales Summary
Current Results & Future Growth DriversCurrent Results & Future Growth Drivers
$202• Q1:15 sales $199M; +46% Y/Y -2% Q/QSales ($M)
$70 $70 $161$181
$202 $199Q1:15 sales $199M; +46% Y/Y, -2% Q/Q
• Expansion of POMALYST®/IMNOVID®
continues – Approval in Japan 18 months ahead of
t ti R i b t t d i J
$57 $63 expectations; Reimbursement expected in June
– U.S. label update with OS– Strong U.S. POMALYST® 3rd line+ share– Duration has been steadily increasing in the
$104 $118 $132 $129
Duration has been steadily increasing in the U.S. since launch
– EU IMNOVID® achieving rapid penetration of 3rd line+ market
• Continue to advance POMALYST®/IMNOVID®
Q2:14 Q3:14 Q4:14 Q1:15
• Continue to advance POMALYST®/IMNOVID®
combinations with other novel agents– Phase II trials with checkpoint inhibitors, HDAC
inhibitors, proteasome inhibitors enrolling
21
US ROW
2015 POMALYST®/IMNOVID® Growth Drivers
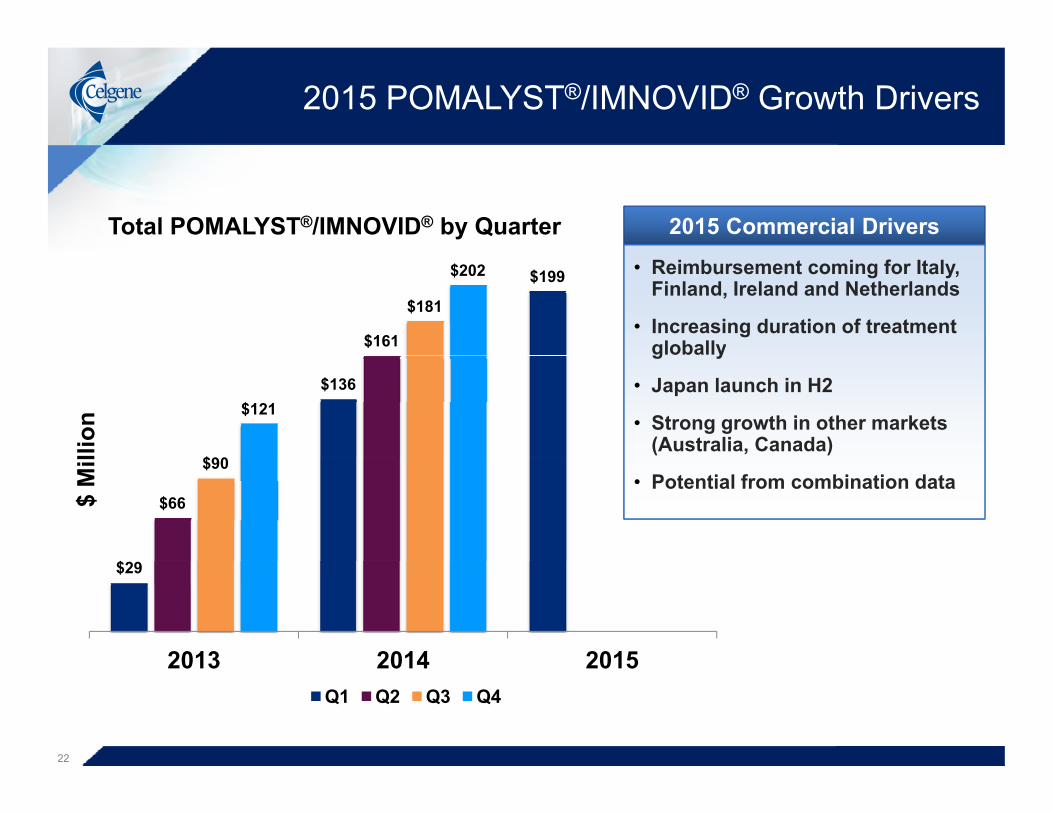
Total POMALYST®/IMNOVID® by Quarter 2015 Commercial Drivers
$199
$161
$181
$202 • Reimbursement coming for Italy, Finland, Ireland and Netherlands
• Increasing duration of treatment globally
$136
$90
$121
g y
• Japan launch in H2
• Strong growth in other markets (Australia, Canada)lli
on
$66
$90• Potential from combination data
$ M
il
$29
2013 2014 20152013 2014 2015Q1 Q2 Q3 Q4
22
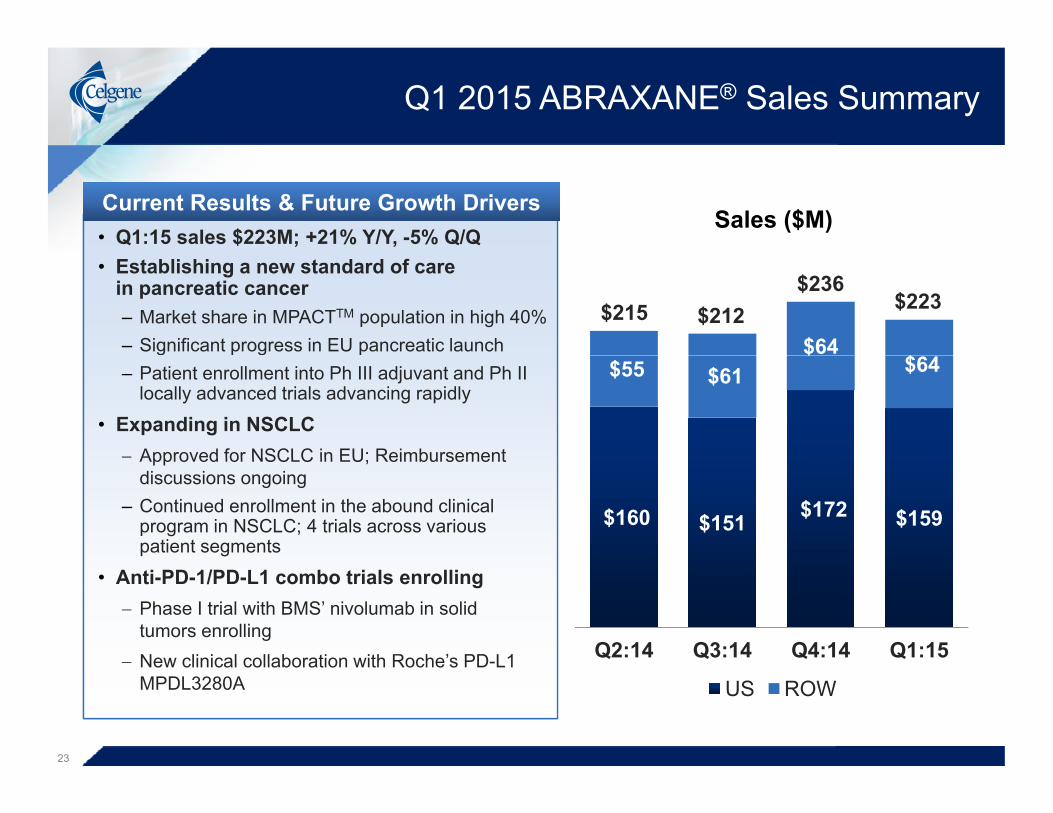
Q1 2015 ABRAXANE® Sales Summary
• Q1:15 sales $223M; +21% Y/Y, -5% Q/QCurrent Results & Future Growth DriversCurrent Results & Future Growth Drivers
Sales ($M)
$64$
$215 $212$236
$223• Establishing a new standard of care
in pancreatic cancer– Market share in MPACTTM population in high 40%– Significant progress in EU pancreatic launch
$55 $61 $
$64 – Patient enrollment into Ph III adjuvant and Ph II locally advanced trials advancing rapidly
• Expanding in NSCLC Approved for NSCLC in EU; Reimbursement
$160 $151 $172 $159
Approved for NSCLC in EU; Reimbursement discussions ongoing
– Continued enrollment in the abound clinical program in NSCLC; 4 trials across various patient segments
Q2:14 Q3:14 Q4:14 Q1:15
• Anti-PD-1/PD-L1 combo trials enrolling Phase I trial with BMS’ nivolumab in solid
tumors enrolling New clinical collaboration with Roche’s PD-L1
23
US ROWNew clinical collaboration with Roche s PD-L1 MPDL3280A

2015 ABRAXANE® Growth Drivers
$236
2015 Commercial DriversTotal ABRAXANE® by Quarter
$185
$223$215
$170
$212$202
$236 • Early days of EU pancreatic launch
• Reimbursement for PanC in Spain, Italy Q1; France, Belgium
$104
$123$110
$155
$106
$170
$106
p , y Q ; , gand others to come
• Launching in EU for NSCLC in early access markets with others still to comelli
on
$104 $106 $106
+2%
+1% +16% -1% +11% -6%+26% +10% +19% -8%+5% -3% 0% +15%• Potential in I/O combinations as
well as data readouts from ongoing Celgene trials
$ M
il
2012 2013 2014 20150%
2012 2013 2014 2015Q1 Q2 Q3 Q4
24

Clinical Data Across the Portfolio to Be Presented at Major Medical Congresses
~65 Abstracts Accepted
• Hematology®• Updated OS from FIRST®
• FLASH analysis correlating CR with PFS in 1st Line FL
• MM triplet data
ASCOASCOAcceptancesAcceptances
June 2015June 2015• Oncology
• Phase I data on demcizumab• Emerging combination data with immuno-
therapeutics
29 Abstracts Accepted
2 Oral Presentations:• Phase II data on sotatercept in lower risk MDS
MDS MDS Foundation Foundation
AcceptancesAcceptances• Phase II data on luspatercept in MDSApril 2015April 2015
49 Abstracts SubmittedPh I d PK/PD d t AG 221 i IDH 2
EHAEHASubmissionsSubmissions • Phase I and PK/PD data on AG-221 in IDH-2
mutant malignanciesSubmissionsSubmissions
June 2015June 2015
25
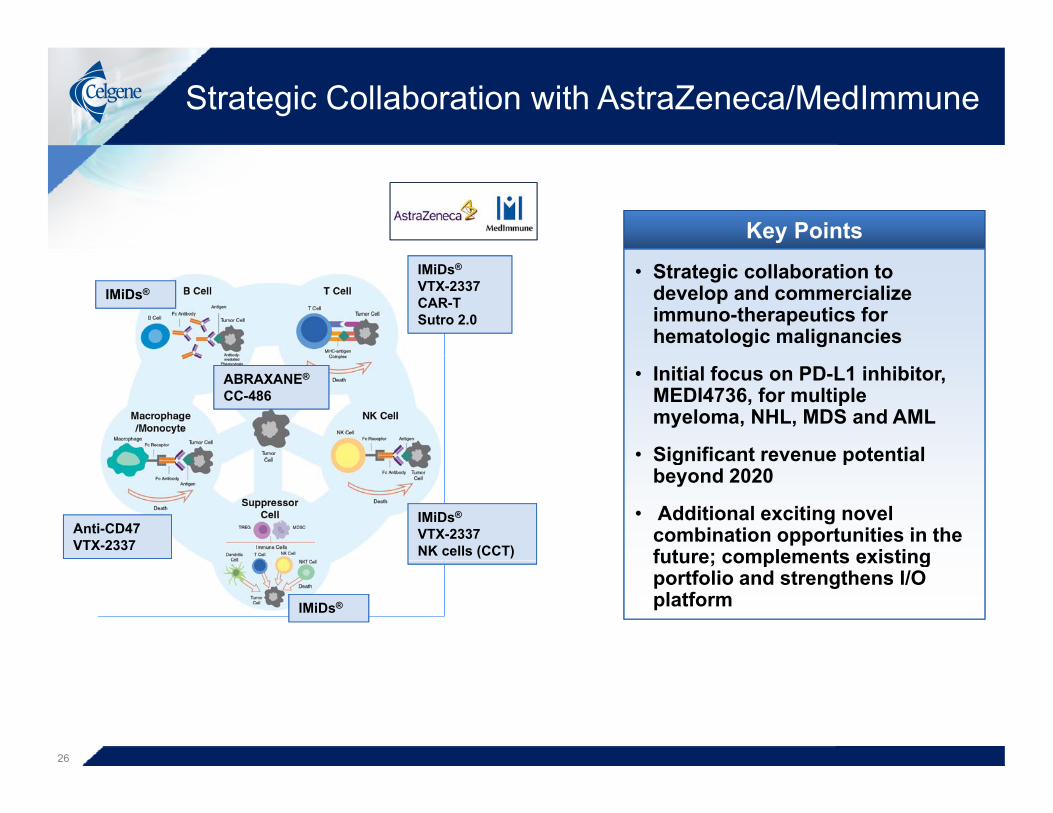
Strategic Collaboration with AstraZeneca/MedImmune
Key PointsIMiDs®
VTX-2337CAR-TSutro 2.0
IMiDs®
• Strategic collaboration to develop and commercialize immuno-therapeutics for hematologic malignancies
ABRAXANE®
CC-486• Initial focus on PD-L1 inhibitor,
MEDI4736, for multiple myeloma, NHL, MDS and AML
• Significant revenue potential
IMiDs®
VTX-2337NK cells (CCT)
Anti-CD47VTX-2337
Significant revenue potential beyond 2020
• Additional exciting novel combination opportunities in the future; complements existing
IMiDs®
future; complements existing portfolio and strengthens I/O platform
26

Scott Smith

Q1 2015 I&I Franchise Update
– Entrenching brand position in both PsA and psoriasis; Q1:15 sales $60M
Executing “Best in Class” U.S. Launch for OTEZLA®Executing “Best in Class” U.S. Launch for OTEZLA®
Entrenching brand position in both PsA and psoriasis; Q1:15 sales $60M– Over ~40,000 patients in the U.S. have been treated with OTEZLA® since launch
Expanding OTEZLA®’s Geographic FootprintExpanding OTEZLA®’s Geographic Footprint
– EU launch off to strong start• Positive early feedback from commercial launch in Germany, the UK and Nordics
Expanding OTEZLA® s Geographic FootprintExpanding OTEZLA® s Geographic Footprint
• Access broadening to increasing number of European markets– OTEZLA® approved in Australia and Canada
– Expanding lifecycle applications for OTEZLA®
– Executing pivotal program for GED-0301
Advancing Development of I&I PipelineAdvancing Development of I&I Pipeline
28
Executing pivotal program for GED 0301– Developing new products – sotatercept and CC-220

Leading Indicators Favorable for Future Growth
Source of Business Predominantly Non-BiologicLast Therapy Prior to OTEZLA®* for Psoriasis
Strong Prescription GrowthWeekly TRx
Strong Prescription GrowthWeekly TRx
2014 2015
OTEZLA (PsA/PSOR)XELJANZ (RA)CIMZIA (Crohn's)SIMPONI (RA/PsA/AS)STELARA (PsO)
15%
11%29%
Biologic
Oral Systemic
Topical
Patient Access
1 4 7 10 13 16 19 22 25 28 31 34 37 40 43 46 49 52 55
Week Since Product Launch
Depth of Prescribing
45%Naïve (No tx in prior 12 months)
30%1 TRx
Patient Access
99%Formulary Covered
Depth of PrescribingNumber of TRx per Trialist
30%
17%53%
2 TRx
≥ 3 TRx
72%
0% 20% 40% 60% 80% 100%
Adjudicated OTEZLA® Claims**
Note: STELARA TRx launch aligned based on 4 week trailing average; TRx reflects total number of new and refill prescriptions to-date; Symphony data subject to restatement; Source of Business includes both add-on and switch patients; *Based on 12-month window. **Includes titration, bridge and PAP. Source: IMS SMART. through week ending April 17, 2015; Symphony Prescriber; through week ending March 20, 2015; SHA PTD claims data (Jan’15 feed for month ending Nov’14)
29
0% 20% 40% 60% 80% 100%

In “New-to-Brand” Patient Share, OTEZLA® Achieved Lead Positions in Both PsA and Psoriasis
New to Brand Share – PsA(Normalized Patient Equivalents)
45%
New to Brand Share – Psoriasis(Normalized Patient Equivalents)
OTEZLA®45%
OTEZLA®
33%
30%
35%
40%OTEZLA®
39%
30%
35%
40%
15%
20%
25%
15%
20%
25%
0%
5%
10%
0%
5%
10%
0%
ENBREL SIMPONI HUMIRACIMZIA STELARA Sulfasalazine
0%
Acitretin Cyclosporine HUMIRAENBREL STELARA OTEZLA
30
CIMZIA STELARA SulfasalazineMethotrexate Leflunomide OTEZLA
ENBREL STELARA OTEZLAMethotrexate
Note: Symphony data is subject to restatementSource: SHA PTD claims data (March 2015 feed for month ending January 2015)

Robust Data Rollout Planned for Upcoming Congresses
All 7 Abstracts Accepted2 Oral Presentations:
• Efficacy in difficult-to-treat PSOR manifestationsWCD WCD
AcceptancesAcceptances
All 11 Abstracts Accepted
y• MAPP global survey results
Other Abstracts Focused on PSOR Long-term Data
AcceptancesAcceptancesJune 2015June 2015
All 11 Abstracts Accepted
2 Oral Presentations:• 2 year enthesitis and dactylitis in PsA• CC-220 pre-clinical and Ph I data in healthy
EULAR EULAR AcceptancesAcceptances
volunteers
Other Abstracts focused on OTEZLA® PsA long-term Data and PSOR Overview Results
June 2015June 2015
9 Abstracts Submitted• 32 week efficacy PSOR
(post-hoc comparison to etanercept)• 32 week safety PSOR
EADV EADV SubmissionsSubmissionsO t b 2015O t b 2015
y• New composite efficacy measure• Metabolic parameters
October 2015October 2015
31

GED-0301 Development Highlights
Program Updates– Registration-enabling endoscopy trial underway– Startup activities for phase III registration trials ongoing;
study initiation expected mid-year– Ulcerative colitis phase II to begin H2:15
P i f d l t i di t i C h ’ di– Preparing for development in pediatric Crohn’s disease
Data Dissemination– Phase II manuscript published in The New England p p g
Journal of Medicine (March 18, 2015)– 2 abstracts accepted for presentation at DDW
(Digestive Disease Week) May 2015 Congress; i l d 1 l t ti d 1 t t tiincludes 1 oral presentation and 1 poster presentation
– Special encore of UEGW oral presentation
Upcoming Analyst & Investor Event
32
p g yGED-0301 “Deep Dive”
May 17, 2015

I&I Franchise Momentum Accelerating
Successfully launch OTEZLA® in the U.S., EU, and expand into additional key geographies
Maximizing the OTEZLA® Opportunity
geographies Completion and top-line results from PsA Ph IIIb and Japan registration trials Development of OTEZLA® in new indications (Behçet’s disease, atopic dermatitis,
and ulcerative colitis)
Complete enrollment of registration-enabling endoscopy trial for GED-0301 in
Moving GED-0301 Forward
Crohn’s disease Initiate enrollment in Ph III trials of GED-0301 in adults and adolescents with
Crohn’s disease Initiate clinical program in ulcerative colitis for GED-0301Initiate clinical program in ulcerative colitis for GED 0301
Complete Ph IIb enrollment for sotatercept in ESRD patients with anemia
New Products Furthering the I&I PipelineNew Products Furthering the I&I Pipeline
33
Complete Ph IIb enrollment for sotatercept in ESRD patients with anemia Complete enrollment in Ph IIa trial with CC-220 in patients with SLE

Bob Hugin
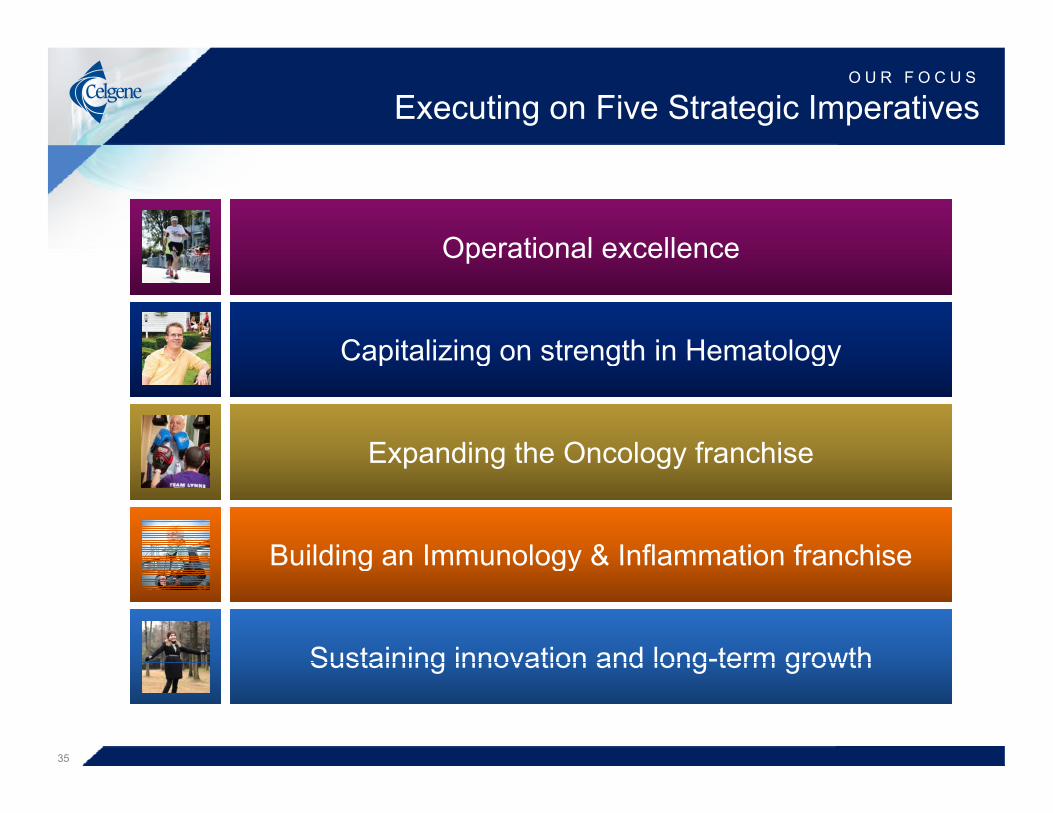
O U R F O C U S
Executing on Five Strategic Imperatives
Operational excellenceOperational excellenceOperational excellenceOperational excellence
Capitalizing on strength in HematologyCapitalizing on strength in HematologyCapitalizing on strength in HematologyCapitalizing on strength in Hematology
Expanding the Oncology franchiseExpanding the Oncology franchiseExpanding the Oncology franchise Expanding the Oncology franchise
Building an Immunology & Inflammation franchiseBuilding an Immunology & Inflammation franchise
Sustaining innovation and long-term growthSustaining innovation and long-term growth
Building an Immunology & Inflammation franchiseBuilding an Immunology & Inflammation franchise
35
Sustaining innovation and long term growthSustaining innovation and long term growth
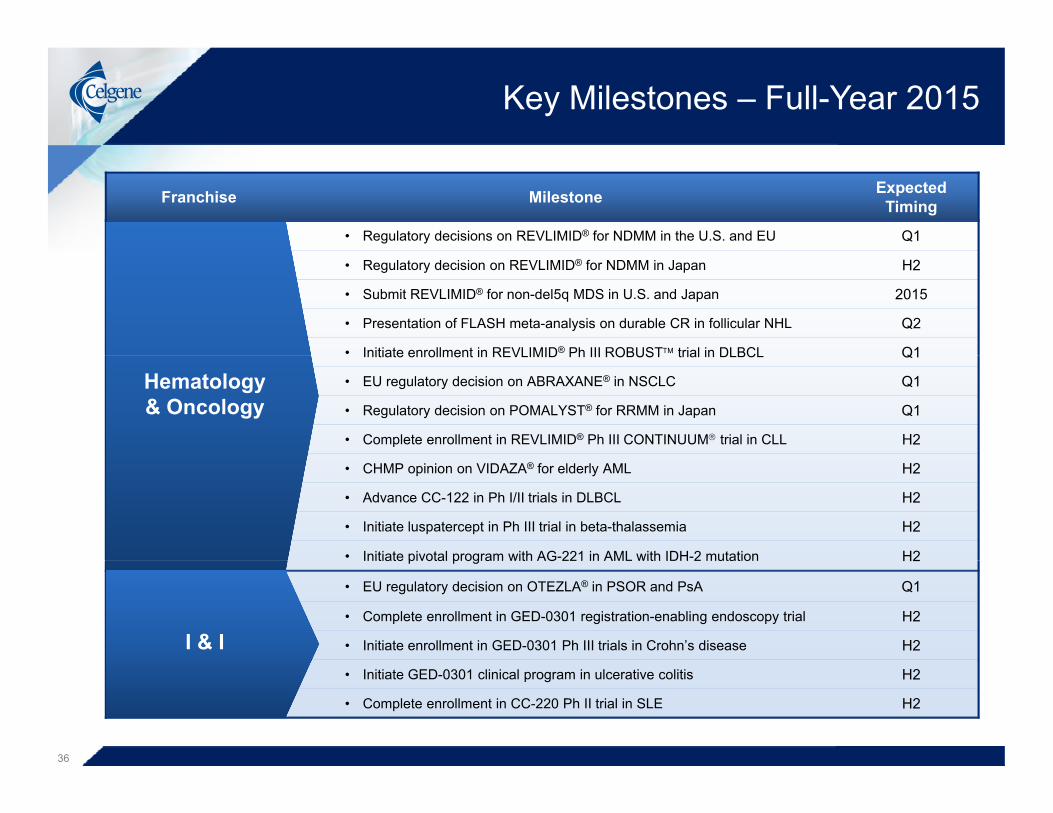
Key Milestones – Full-Year 2015
Franchise Milestone ExpectedTiming
• Regulatory decisions on REVLIMID® for NDMM in the U.S. and EU Q1
• Regulatory decision on REVLIMID® for NDMM in Japan H2
• Submit REVLIMID® for non-del5q MDS in U.S. and Japan 2015
• Presentation of FLASH meta-analysis on durable CR in follicular NHL Q2
• Initiate enrollment in REVLIMID® Ph III ROBUST trial in DLBCL Q1Initiate enrollment in REVLIMID Ph III ROBUST trial in DLBCL Q1
• EU regulatory decision on ABRAXANE® in NSCLC Q1
• Regulatory decision on POMALYST® for RRMM in Japan Q1
• Complete enrollment in REVLIMID® Ph III CONTINUUM trial in CLL H2
Hematology& Oncology
• CHMP opinion on VIDAZA® for elderly AML H2
• Advance CC-122 in Ph I/II trials in DLBCL H2
• Initiate luspatercept in Ph III trial in beta-thalassemia H2
• Initiate pivotal program with AG-221 in AML with IDH-2 mutation H2Initiate pivotal program with AG 221 in AML with IDH 2 mutation H2
• EU regulatory decision on OTEZLA® in PSOR and PsA Q1
• Complete enrollment in GED-0301 registration-enabling endoscopy trial H2
• Initiate enrollment in GED-0301 Ph III trials in Crohn’s disease H2I & I• Initiate GED-0301 clinical program in ulcerative colitis H2
• Complete enrollment in CC-220 Ph II trial in SLE H2
36

Q1 2015 Conference CallApril 30, 2015

ReconciliationReconciliation Tables

Reconciliation Tables
2014 1,
707.
5$
22
.5
1,73
0.0
86.1
713.
7
49
4.1
65.7
8.
6
1,
368.
2
361.
8
6.4
(29.
3)
(6.6
)
33
2.3
52.6
279.
7$
0.
34$
0.
33$
81
1.5
845.
1
Dec
embe
r 31,
2014 7,
546.
7$
17,3
40.1
60
5.9
6,26
5.7
6,
524.
8
8, 2
014,
to
nd e
ffec
t a tw
o-fo
r-re
sent
ed h
erei
n
31,
erio
ds E
nded
2015 2,
055.
2$
25
.6
2,08
0.8
104.
0
50
6.0
529.
2
63.6
19
.0
1,22
1.8
859.
0
9.0
(49.
2)
8.3
827.
1
10
8.2
718.
9$
0.90
$
0.
86$
798.
9
83
4.1
Mar
ch 3
1,20
15 7,31
3.5
$
17
,480
.5
504.
4
6,30
3.0
6,
764.
8
corp
orat
ion
on J
une
18llio
n to
1.1
50 b
illion
an
d pe
r sha
re a
mou
nts
pr
iari
esof
Inco
me
Mar
ch
Thre
e-M
onth
Pe
rm d
ebt
ded
its c
ertif
icat
e of
inc
n st
ock
from
575
.0 m
ilco
rdin
gly,
all
shar
e an
d
tion
and
Subs
idi
ted
Stat
emen
ts o
naud
ited)
xcep
t per
sha
re d
ata)
izatio
n of
asse
ts
keta
ble
secu
ritie
s
rren
t por
tion
of lo
ng-te
l, th
e C
ompa
ny a
men
dize
d sh
ares
of c
omm
onng
com
mon
sto
ck. A
ccsp
lit.
elge
ne C
orpo
rat
ense
d C
onso
lidat (Un
(In m
illio
ns, e
x
ales
e venu
e
sold
(exc
ludi
ng a
mor
tin
tang
ible
ass
ets)
deve
lopm
ent
al a
nd a
dmin
istra
tive
of a
cqui
red
inta
ngib
le a
late
d ch
arge
s, ne
tst
s an
d ex
pens
es
ome
nves
tmen
t inc
ome,
net
nse)
(exp
ense
), ne
t
e in
com
e ta
xes
ovisi
on
er c
omm
on s
hare
:(1)
rage
sha
res:(1
)
et it
ems:
sh e
quiv
alen
ts &
mar
ket
sm
bor
row
ings
and
cur
m d
ebt
ckho
lder
s' eq
uity
g st
ockh
olde
r app
rova
lth
e nu
mbe
r of a
utho
rizk
split
of i
ts o
utst
andi
nhe
impa
ct o
f the
sto
ck Ce
Con
de
39
Net
pro
duct
sa
Oth
er re
venu
eTo
tal r
ev
Cos
t of g
oods
ac
quire
d R
esea
rch
and
Sellin
g, g
ener
aA
mor
tizat
ion
oA
cqui
sitio
n re
lTo
tal c
os
Ope
ratin
g in
co
Inte
rest
and
inIn
tere
st (e
xpen
Oth
er in
com
e
Inco
me
befo
r e
Inco
me
tax
pro
Net
inco
me
Net
inco
me
peB
asic
Dilu
ted
Wei
ghte
d av
e rB
asic
Dilu
ted
Bal
ance
she
eC
ash,
cas
Tota
l ass
Shor
t-ter
mLo
ng-te
rmTo
tal s
toc
(1)
Follo
win
gin
crea
se
one
stoc
kre
flect
th
Reconciliation Tables
2014 27
9.7
6.1
47
.0
30
9.0
51
.3
25
.0
65
.7
8.6
(87
.5)
70
4.9
0.87
0.83
lso co
ntains
lin
form
ation
th
resp
ect to
ed
in ad
dition
lly
exclu
de
meet
the
n diff
eren
t
ds E
nded
2015 71
8.9$
$
6.7
56.2
19
.0
65.9
-
63.6
19.0
(58.3)
89
1.0$
$
1.12
$
$
1.07
$
$
P, th
is pr
ess r
eleas
e al
ment
with
supp
lemen
tal
twee
n per
iods a
nd w
itnd
shou
ld be
cons
idere
U.S.
GAAP
. We t
ypica
ation
s and
that
do no
t efi
ne th
ese m
easu
res i
ries
t Inc
ome
Three
-Mon
th Pe
rioM
arch 3
1,
(1) (1) (2) (1) (3) (4) (5) (6)
danc
e with
U.S.
GAA
Pve
stors
and m
anag
emilit
ate co
mpar
isons
bet
ures
are n
on-G
AAP
and i
n acc
orda
nce w
ith U
affec
t our
basic
oper
athe
r com
panie
s may
de
tion a
nd Su
bsidi
aP
to Ad
justed
Ne
cept
per s
hare
data)
g amo
rtizati
onts)
: n exp
ense
n exp
ense
ense
rative
:n e
xpen
seob
ligati
on
angib
le as
sets
net:
ontin
gent
cons
iderat
ion
Adjus
ted
ion pr
epar
ed in
acco
rdwe
belie
ve pr
ovide
ince
and t
rend
s tha
t fac
ius
ted fi
nanc
ial m
easu
e inf
orma
tion p
repa
red
ment
does
not b
eliev
e aon
-recu
rring
items
. Ot
Celge
ne C
orpo
rat
ncilia
tion o
f GAA
P(In
mill
ions,
exc
- GAA
P
e tax
adjus
tmen
ts:of
good
s sold
(exc
ludin g
cquir
ed in
tangib
le as
setha
re-ba
sed c
ompe
nsati
on
arch a
nd de
velop
ment:
hare-
base
d com
pens
ation
pfron
t coll
abora
tion e
xpe
ng, g
enera
l and
admi
nistr
hare-
base
d com
pens
ation
ttleme
nt of
conti
ngen
t o
rtizati
on of
acqu
ired i
nta
uisitio
n rela
ted ch
arges
, nha
nge i
n fair
value
of co
come
tax a
djustm
ents
- Ad
justed
per c
ommo
n sha
re -
A
d to fin
ancia
l info
rmati
nanc
ial m
easu
res t
hat
oper
ating
perfo
rman
cnf
orma
tion.
Thes
e adj
as a
subs
titute
for,
theAP
items
that
mana
gem
nition
of un
usua
l or n
oCRe
con
40
Net in
come
Befor
e C
ost
of
a
Sh
Res
ea
Sh
U
p
Sell
in
Sh
S
e
Amo
r
Acq
u
Ch
Net in
cNe
t inco
me
Net in
come
Ba
sicDi
lute d
In ad
dition
ad
juste
d fin
relat
ing to
opr
ojec
ted in
to, bu
t not
ace
rtain
GAA
GAAP
defin
ways
.
Reconciliation Tables
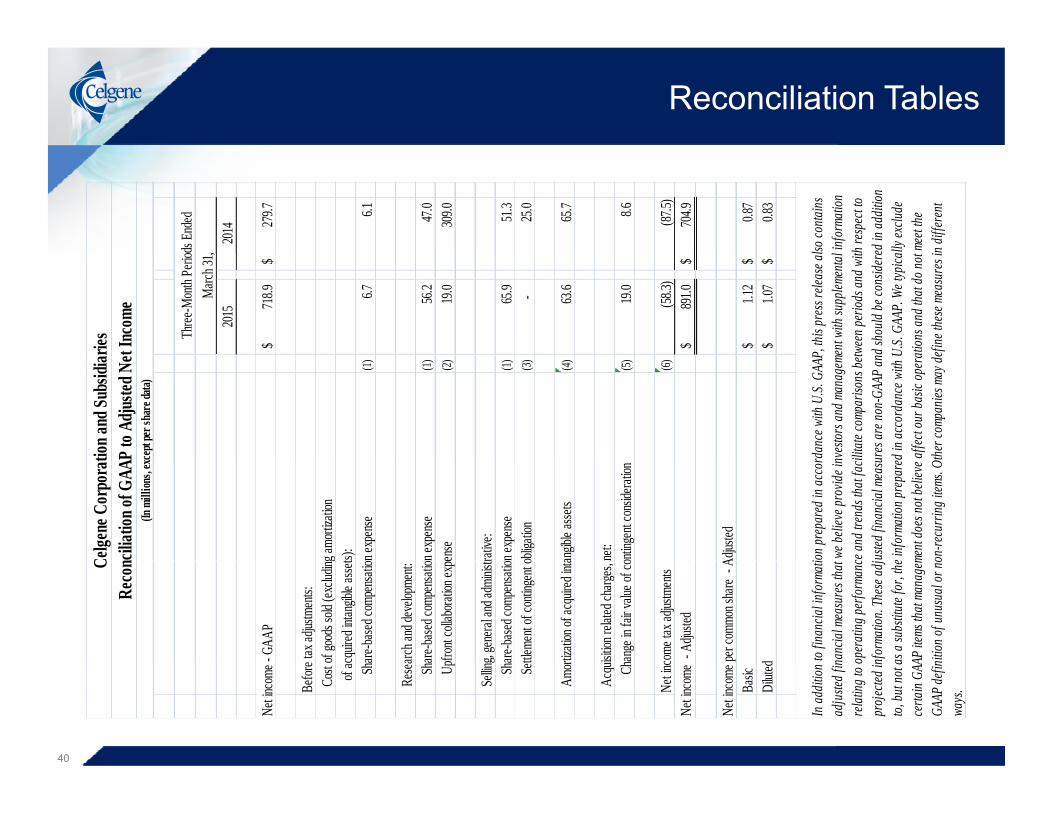
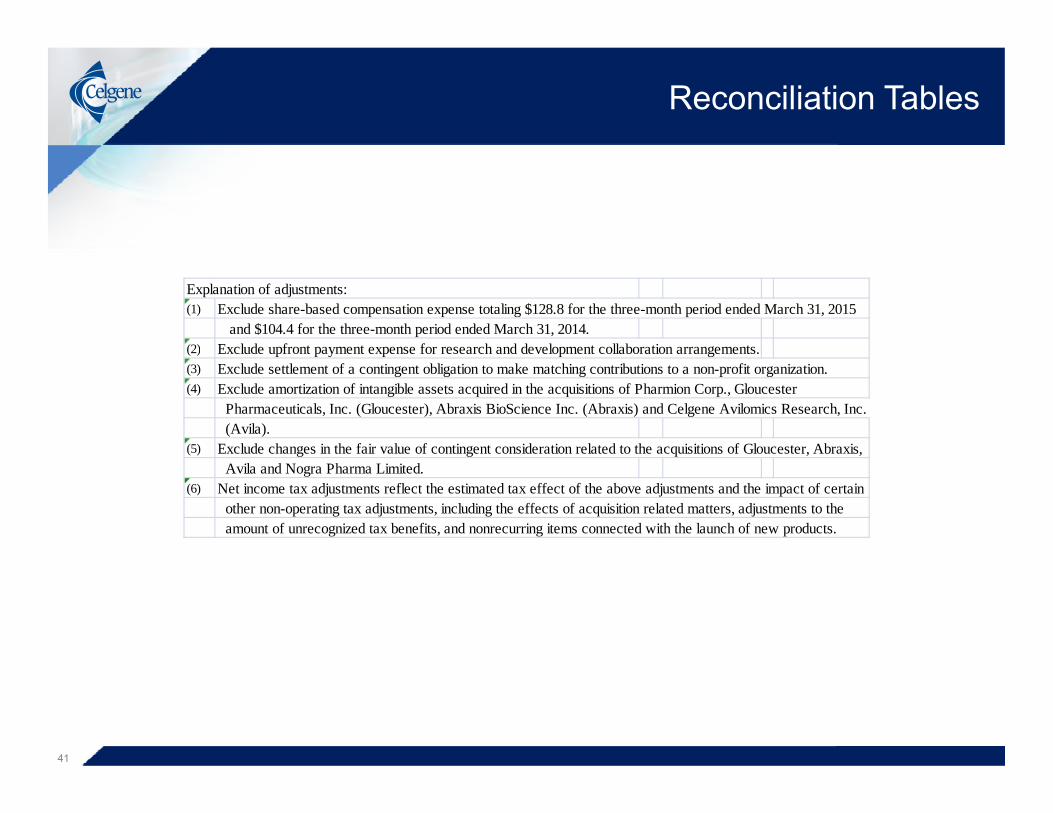
Explanation of adjustments:(1) Exclude share-based compensation expense totaling $128.8 for the three-month period ended March 31, 2015
and $104.4 for the three-month period ended March 31, 2014. (2) Exclude upfront payment expense for research and development collaboration arrangements.( ) p p y p p g(3) Exclude settlement of a contingent obligation to make matching contributions to a non-profit organization.(4) Exclude amortization of intangible assets acquired in the acquisitions of Pharmion Corp., Gloucester
Pharmaceuticals, Inc. (Gloucester), Abraxis BioScience Inc. (Abraxis) and Celgene Avilomics Research, Inc. (Avila).
(5) Exclude changes in the fair value of contingent consideration related to the acquisitions of Gloucester, Abraxis, Avila and Nogra Pharma Limited.
(6) Net income tax adjustments reflect the estimated tax effect of the above adjustments and the impact of certain other non-operating tax adjustments, including the effects of acquisition related matters, adjustments to the amount of unrecognized tax benefits, and nonrecurring items connected with the launch of new products.
41

Reconciliation Tables
High 2,6
51.5
$
34.0
25
5.4
499.0
29
2.1
254.6
91
.0
(135.1
)
3,9
42.5
$
3.19
$
4.7
5$
830.0
ge n agre
emen
ts,
as pa
rt of
the
Inco
me
Low
1)2,4
68.2
$
36.5
26
8.9
499.0
30
4.0
254.6
11
6.2
(129.4
)
3,8
18.0
$
2.97
$
4.6
0$
830.0
Ran g
mbina
tions
, coll
abora
tion
e of o
ur CV
Rs is
sued
s p
ress r
eleas
e.
iaries
to A
djus
ted N
et
(1
uired ed ct of
any b
usine
ss co
mha
nges
in th
e fair
value
prior
to the
date
of thi
s
tion a
nd S
ubsid
iro
jected
GAA
P t
xcep
t per
shar
e data
)
g amo
rtizati
on of
acqu
on ex
pens
e
on ex
pens
e pe
nse
rative
:on
expe
nse
ngibl
e asse
ts
net:
nting
ent c
onsid
eratio
n
mmon
share
- GA
AP
mmon
share
- A
djuste
share
s
o not
includ
e the
effec
sset im
pairm
ents,
or ch
y occ
ur aft
er the
day p
elgen
e Cor
pora
tull
-Yea
r 201
5 Pr
(In m
illion
s, ex
incom
e - G
AAP
ax ad
justm
ents:
f goo
ds so
ld (ex
cludin
gan
gible
asse
ts):
are-ba
sed c
ompe
nsati
o
rch an
d dev
elopm
ent:
are-ba
sed c
ompe
nsati
ofro
nt co
llabo
ration
exp
, gen
eral a
nd ad
minis
trare
-base
d com
pens
atio
zatio
n of a
cquir
ed in
tan
ition r
elated
charg
es, n
ge in
fair v
alue o
f con
me ta
x adju
stmen
ts
incom
e - A
djuste
d
incom
e per
dilute
d com
incom
e per
dilute
d com
ghted
avera
ge di
luted
ected
2015
earni
ngs d
oqu
isition
s, int
angib
le as
on of
Abra
xis th
at ma
yCeon
ciliat
ion of
Fu
42
Proje
cted n
et i
Befor
e ta
Cost
of
inta
Sha
Rese
ar S
ha U
pf
Sellin
g, S
ha
Amo
rtiz
Acq
uisi
Cha
ng
Net in
com
Proje
cted n
et i
Proje
cted n
et i
Proje
cted n
et i
Proje
cted w
eig
(1)Ou
r proj
eas
set a
cqac
quisit
io
Reco
Return on Invested Capital Calculation
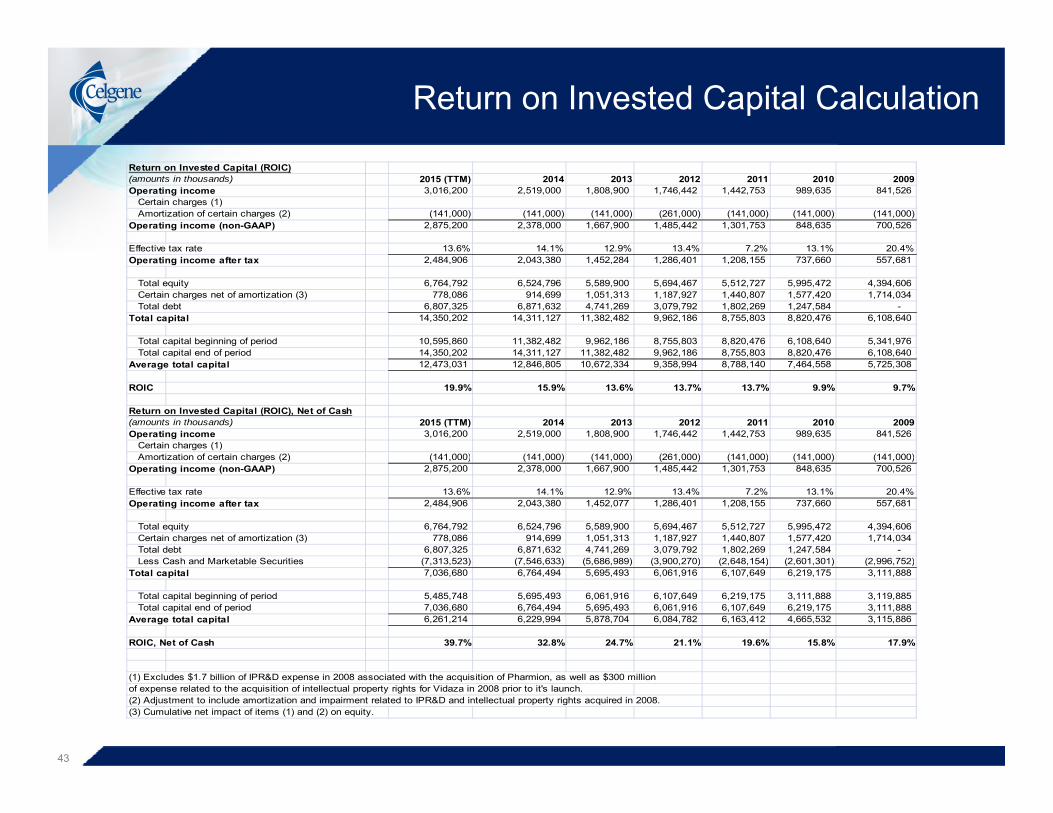
Return on Invested Capital (ROIC)(amounts in thousands) 2015 (TTM) 2014 2013 2012 2011 2010 2009Operating income 3,016,200 2,519,000 1,808,900 1,746,442 1,442,753 989,635 841,526
Certain charges (1)Amortization of certain charges (2) (141,000) (141,000) (141,000) (261,000) (141,000) (141,000) (141,000)
Operating income (non-GAAP) 2,875,200 2,378,000 1,667,900 1,485,442 1,301,753 848,635 700,526
Effective tax rate 13.6% 14.1% 12.9% 13.4% 7.2% 13.1% 20.4%Operating income after tax 2,484,906 2,043,380 1,452,284 1,286,401 1,208,155 737,660 557,681
Total equity 6,764,792 6,524,796 5,589,900 5,694,467 5,512,727 5,995,472 4,394,606 Certain charges net of amortization (3) 778,086 914,699 1,051,313 1,187,927 1,440,807 1,577,420 1,714,034 Total debt 6,807,325 6,871,632 4,741,269 3,079,792 1,802,269 1,247,584 -
Total capital 14,350,202 14,311,127 11,382,482 9,962,186 8,755,803 8,820,476 6,108,640
Total capital beginning of period 10,595,860 11,382,482 9,962,186 8,755,803 8,820,476 6,108,640 5,341,976 Total capital end of period 14,350,202 14,311,127 11,382,482 9,962,186 8,755,803 8,820,476 6,108,640Total capital end of period 14,350,202 14,311,127 11,382,482 9,962,186 8,755,803 8,820,476 6,108,640
Average total capital 12,473,031 12,846,805 10,672,334 9,358,994 8,788,140 7,464,558 5,725,308
ROIC 19.9% 15.9% 13.6% 13.7% 13.7% 9.9% 9.7%
Return on Invested Capital (ROIC), Net of Cash(amounts in thousands) 2015 (TTM) 2014 2013 2012 2011 2010 2009Operating income 3,016,200 2,519,000 1,808,900 1,746,442 1,442,753 989,635 841,526
Certain charges (1)Amortization of certain charges (2) (141 000) (141 000) (141 000) (261 000) (141 000) (141 000) (141 000)Amortization of certain charges (2) (141,000) (141,000) (141,000) (261,000) (141,000) (141,000) (141,000)
Operating income (non-GAAP) 2,875,200 2,378,000 1,667,900 1,485,442 1,301,753 848,635 700,526
Effective tax rate 13.6% 14.1% 12.9% 13.4% 7.2% 13.1% 20.4%Operating income after tax 2,484,906 2,043,380 1,452,077 1,286,401 1,208,155 737,660 557,681
Total equity 6,764,792 6,524,796 5,589,900 5,694,467 5,512,727 5,995,472 4,394,606 Certain charges net of amortization (3) 778,086 914,699 1,051,313 1,187,927 1,440,807 1,577,420 1,714,034 Total debt 6,807,325 6,871,632 4,741,269 3,079,792 1,802,269 1,247,584 - Less Cash and Marketable Securities (7 313 523) (7 546 633) (5 686 989) (3 900 270) (2 648 154) (2 601 301) (2 996 752)Less Cash and Marketable Securities (7,313,523) (7,546,633) (5,686,989) (3,900,270) (2,648,154) (2,601,301) (2,996,752)
Total capital 7,036,680 6,764,494 5,695,493 6,061,916 6,107,649 6,219,175 3,111,888
Total capital beginning of period 5,485,748 5,695,493 6,061,916 6,107,649 6,219,175 3,111,888 3,119,885 Total capital end of period 7,036,680 6,764,494 5,695,493 6,061,916 6,107,649 6,219,175 3,111,888
Average total capital 6,261,214 6,229,994 5,878,704 6,084,782 6,163,412 4,665,532 3,115,886
ROIC, Net of Cash 39.7% 32.8% 24.7% 21.1% 19.6% 15.8% 17.9%
43
(1) Excludes $1.7 billion of IPR&D expense in 2008 associated with the acquisition of Pharmion, as well as $300 millionof expense related to the acquisition of intellectual property rights for Vidaza in 2008 prior to it's launch. (2) Adjustment to include amortization and impairment related to IPR&D and intellectual property rights acquired in 2008.(3) Cumulative net impact of items (1) and (2) on equity.

Appendix
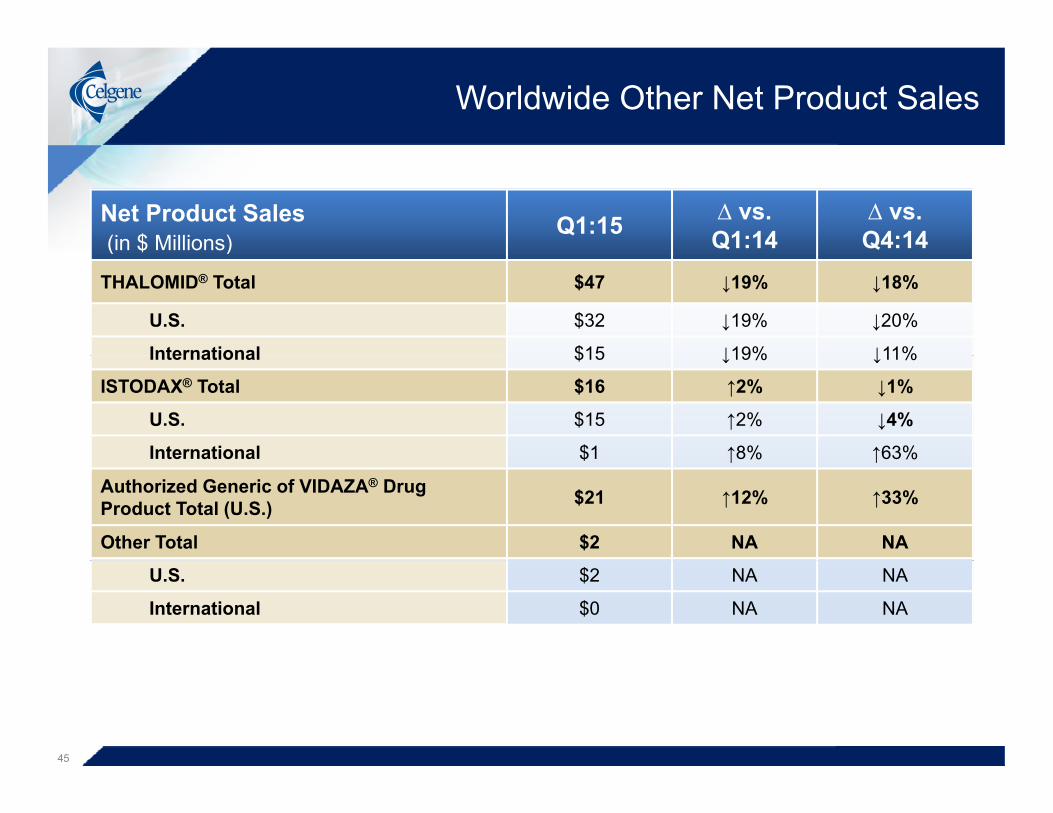
Worldwide Other Net Product Sales
Net Product Sales(in $ Millions)
Q1:15 ∆ vs.Q1:14
∆ vs.Q4:14( )
THALOMID® Total $47 ↓19% ↓18%
U.S. $32 ↓19% ↓20%
International $15 ↓19% ↓11%International $15 ↓19% ↓11%
ISTODAX® Total $16 ↑2% ↓1%
U.S. $15 ↑2% ↓4%
International $1 ↑8% ↑63%International $1 ↑8% ↑63%
Authorized Generic of VIDAZA® Drug Product Total (U.S.) $21 ↑12% ↑33%
Other Total $2 NA NA
U.S. $2 NA NA
International $0 NA NA
45

Celgene Pipeline
46

Celgene Pipeline
47

Celgene Pipeline
48

Celgene Pipeline
49

REVLIMID® Multiple Myeloma Late Stage Programs
Patient Population NDMM Non-ASCT Eligible NDMM Non-ASCT Eligible
Trial Name MM-015MM-020
Trial Name MM-015FIRST®
Phase III III
Target Enrollment 459 1,623
Design
Arm A: REVLIMID® (10mg)/melphalan/ prednisone for 9 cycles followed by REVLIMID® (10mg) maintenance to
disease progressionArm B: REVLIMID® (10mg)/melphalan/
prednisone for 9 cycles followed by placebo
Arm A: REVLIMID® (25mg)/low-dose dexamethasone until disease progression
Arm B: REVLIMID® (25mg)/low-dose dexamethasone for 18 4-week cycles g prednisone for 9 cycles followed by placebo
maintenance to disease progressionArm C: Melphalan/prednisone for 9 cycles
followed by placebo maintenance to disease progression
(72 weeks)Arm C: THALOMID®/melphalan/prednisone
for 12 6-week cycles (72 weeks)
P i E d i tPrimary Endpoint Progression Free Survival Progression Free Survival
Status
Study met primary endpoint July 2009Data presented at ASH 2009 with follow-up data at ASCO 2010, ASH and IMW 2011,
ASH 2012 and IMW 2013 PFS2 presented
Enrollment completeTrial met primary endpoint for PFS
Final PFS and interim OS presented at ASH 2013ASH 2012 and IMW 2013. PFS2 presented
at ASH 2013. Published in NEJM May 2012Follow-up continuing
ASH 2013REVLIMID® approved for NDMM in U.S. and
EU
50

REVLIMID® Multiple Myeloma Late Stage Programs
Patient Population Maintenance Post-ASCT Maintenance Post-ASCT
Trial Name CALGB 100104 IFM 2005-02
Phase III III
Target Enrollment 459 614
DesignArm A: REVLIMID® (10mg) until disease
progression Arm B: Placebo until disease progression
Arm A: REVLIMID® consolidation (25mg) for 2 cycles followed by REVLIMID®
(10-15mg) until disease progressionArm B: REVLIMID® consolidation (25mg)
for 2 cycles followed by placebo until disease progressiondisease progression
Primary Endpoint Time to Progression Progression Free Survival
Trial met primary endpoint in Dec 2009Data presented at ASCO 2010. Follow-up
Trial met primary endpoint in June 2010Data presented at ASCO 2010. Follow-up
StatusData presented at ASCO 2010. Follow up
data at ASH 2010, IMW 2011 and IMW 2013.
Published in NEJM May 2012Follow-up for survival continuing
Data presented at ASCO 2010. Follow up data at ASH 2010, IMW 2011 and
ASH 2013.Published in NEJM May 2012
Follow-up for survival continuing
51
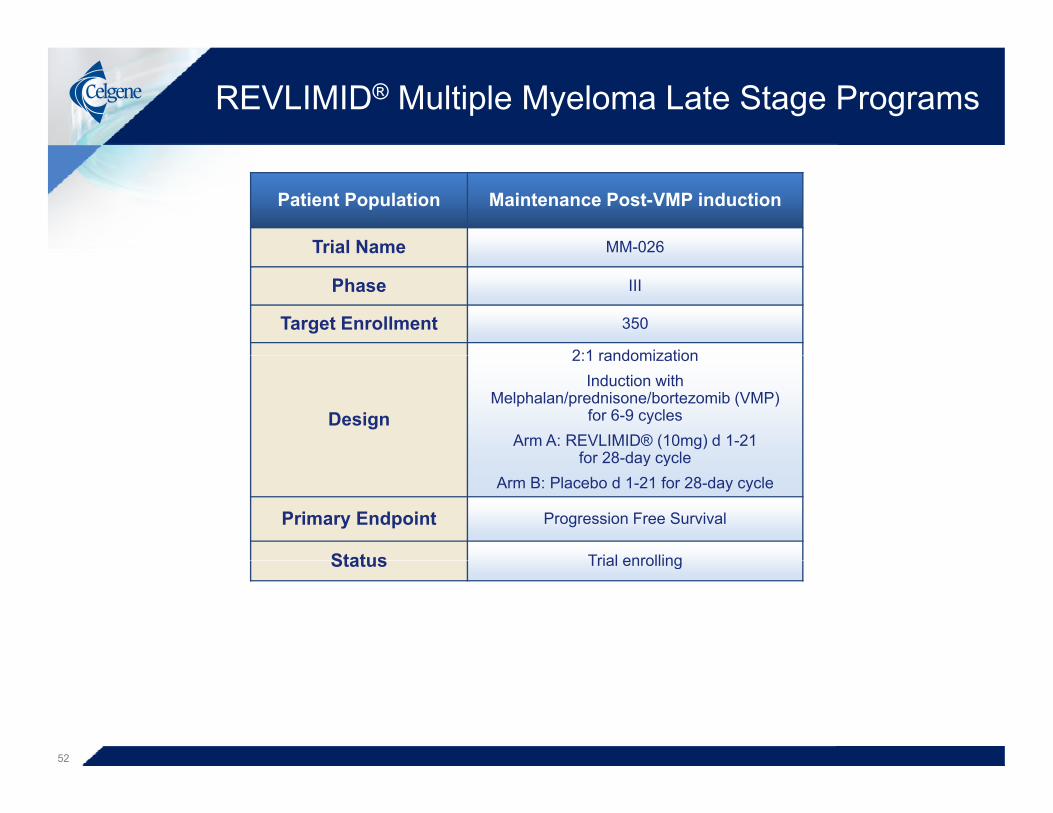
REVLIMID® Multiple Myeloma Late Stage Programs
Patient Population Maintenance Post-VMP induction
Trial Name MM-026Trial Name
Phase III
Target Enrollment 350
2:1 randomization
Design
2:1 randomizationInduction with
Melphalan/prednisone/bortezomib (VMP) for 6-9 cycles
Arm A: REVLIMID® (10mg) d 1-21 for 28 day cyclefor 28-day cycle
Arm B: Placebo d 1-21 for 28-day cycle
Primary Endpoint Progression Free Survival
Status Trial enrollingStatus Trial enrolling
52

REVLIMID® Multiple Myeloma Late Stage Programs
Patient Population Maintenance in ASCT EligibleTrial Name MYELOMA XI
Phase III
Target Enrollment 3,970
Arm A: Cyclophosphamide (500mg) d1,8,15; THALOMID® (100mg d1-21 then 200mg daily), Dexamethasone (40mg) d1-4, 12-15 for minimum of 4 21-day cycle
Arm B: REVLIMID® (25mg) d 1-21, Cyclophosphamde (500mg) d1,8, dexamethasone (40mg)
Design
( g) y ( g) ( g)d1-4,12-15 for minimum of 4 28-day cycles
Arm C: Cyclophosphamde (500mg) d1,8, Carfilzomib (20 mg/m2) d 1,2 cycle 1 then (36 mg/m2) d 1,2,8,9,15,16, REVLIMID® (25mg) d1-21, Dexamethasone (40mg) d 1-
4,8,9,15,16 for 4 21-day cyclesPatients with no change, progressive disease, PR or MR randomized toDesign
Arm A: Bortezomib (1.3mg/m2) d 1,4,8,11, Cyclophosphamide (500mg) d 1,8,15, Dexamethasone (20mg) d 1,2,4,5,8,9,11,12 for max of 8 21-day cycles
Arm B: No treatmentAll patients go to SCT
After SCT randomization to:Arm A: REVLIMID® (10mg) d 1-21 for 28-day cycle to disease progression
Arm B: No maintenance
Primary Endpoint Overall Survival and Progression Free Survival
StatusTrial enrolling
Possible interim data in mid-2015E
53
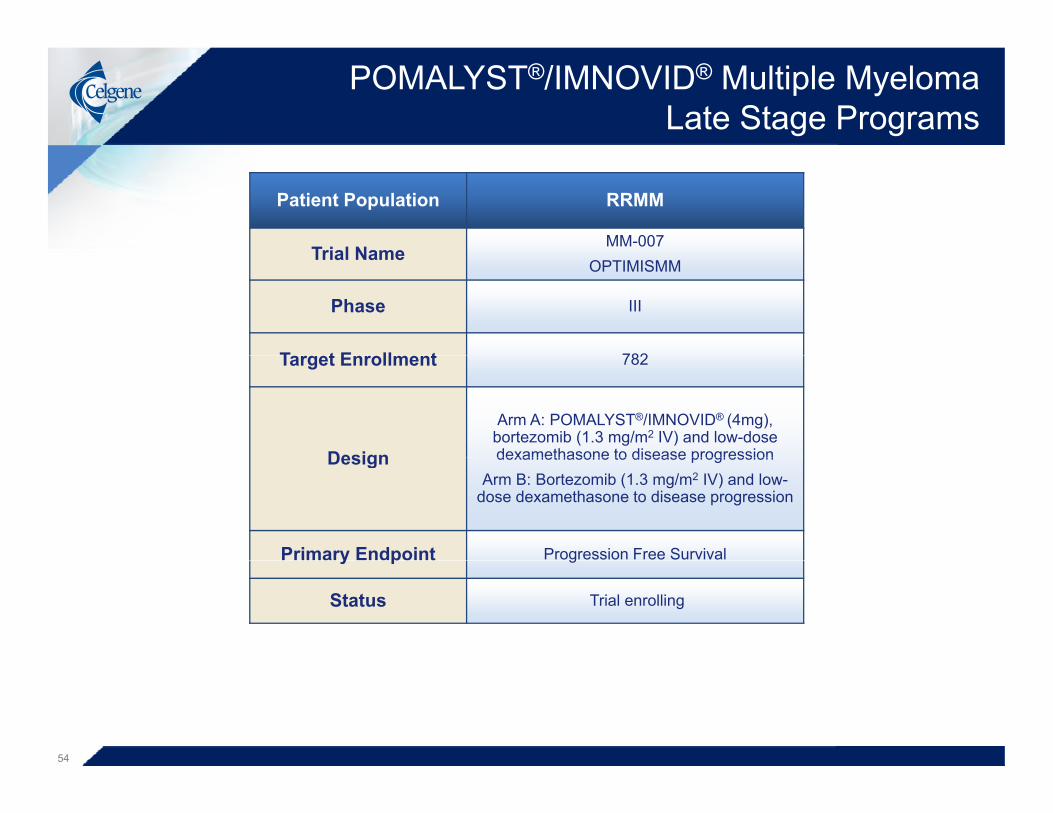
POMALYST®/IMNOVID® Multiple Myeloma Late Stage Programs
Patient Population RRMM
Trial NameMM-007
Trial NameOPTIMISMM
Phase III
T t E ll t 782Target Enrollment 782
Design
Arm A: POMALYST®/IMNOVID® (4mg), bortezomib (1.3 mg/m2 IV) and low-dose dexamethasone to disease progressionDesign dexamethasone to disease progression
Arm B: Bortezomib (1.3 mg/m2 IV) and low-dose dexamethasone to disease progression
Primary Endpoint Progression Free Survivaly p g
Status Trial enrolling
54

MDS/AML/MF Late Stage Programs
Patient Population Non-del5Q low risk/INT-1 transfusion-dependent MDS
Low risk/INT-1 transfusion-dependent MDS
CC 486Molecule REVLIMID®
CC-486(Oral Azacitidine)
Trial Name MDS-005 AZA-MDS-003
Phase III III
Target Enrollment 239 386g
DesignArm A: REVLIMID® (10mg)
Arm B: PlaceboArm A: CC-486 (150mg or 200mg)
Arm B: Placebo
Primary Endpoint RBC-transfusion independencefor at least 8 weeks
RBC-transfusion independence for more than 12 weeks
Primary endpoint metStatus
yData presented at ASH 2014
Submission to FDA expected in 2015Trial enrolling
55

MDS/AML/MF Late Stage Programs
Patient Population Elderly Newly Diagnosed AML Post induction AML Maintenance
MoleculeVIDAZA® CC-486
Molecule(azacitidine) (oral azacitidine)
Trial Name AZA-AML-001 CC-486-AML-001
Phase III III
Target Enrollment 488 460
Arm A: VIDAZA®
(75 mg/m2 SC) daily for D1-7 of a 28-day cycle until disease progression
Designcycle until disease progression
Arm B: Conventional Care Regimen (intensive chemotherapy, low-dose
cytarabine or best supportive care) to disease progression
Arm A: CC-486 (150mg or 200mg)Arm B: Best Supportive Care
Primary Endpoint Overall Survival Overall Survival
StatusData presented at EHA 2014 and ASH 2014
S b itt d t EU i 2014Trial enrolling
Submitted to EU in 2014g
56
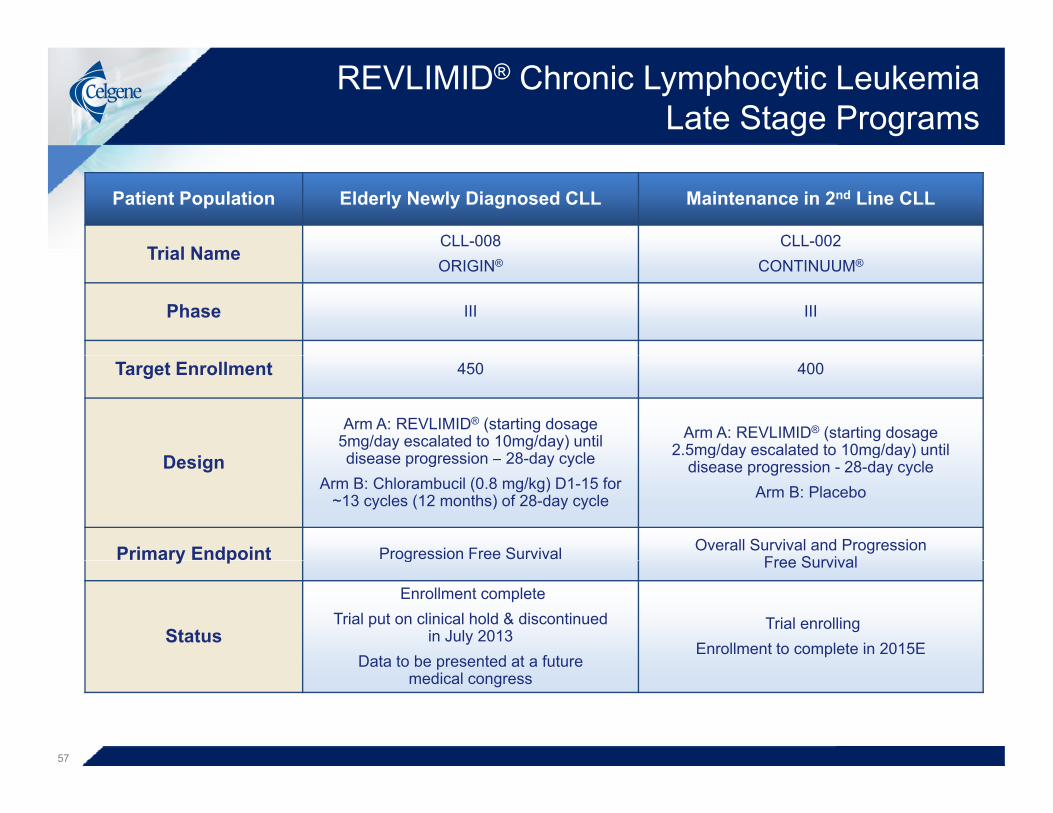
REVLIMID® Chronic Lymphocytic Leukemia Late Stage Programs
Patient Population Elderly Newly Diagnosed CLL Maintenance in 2nd Line CLL
Trial NameCLL-008 CLL-002
Trial NameORIGIN® CONTINUUM®
Phase III III
Target Enrollment 450 400
D i
Arm A: REVLIMID® (starting dosage 5mg/day escalated to 10mg/day) until disease progression 28 day cycle
Arm A: REVLIMID® (starting dosage 2.5mg/day escalated to 10mg/day) until
Design disease progression – 28-day cycleArm B: Chlorambucil (0.8 mg/kg) D1-15 for
~13 cycles (12 months) of 28-day cycle
g y g y)disease progression - 28-day cycle
Arm B: Placebo
Primary Endpoint Progression Free Survival Overall Survival and ProgressionFree Survivaly p g Free Survival
Status
Enrollment completeTrial put on clinical hold & discontinued
in July 2013Data to be presented at a future
Trial enrollingEnrollment to complete in 2015E
Data to be presented at a future medical congress
57
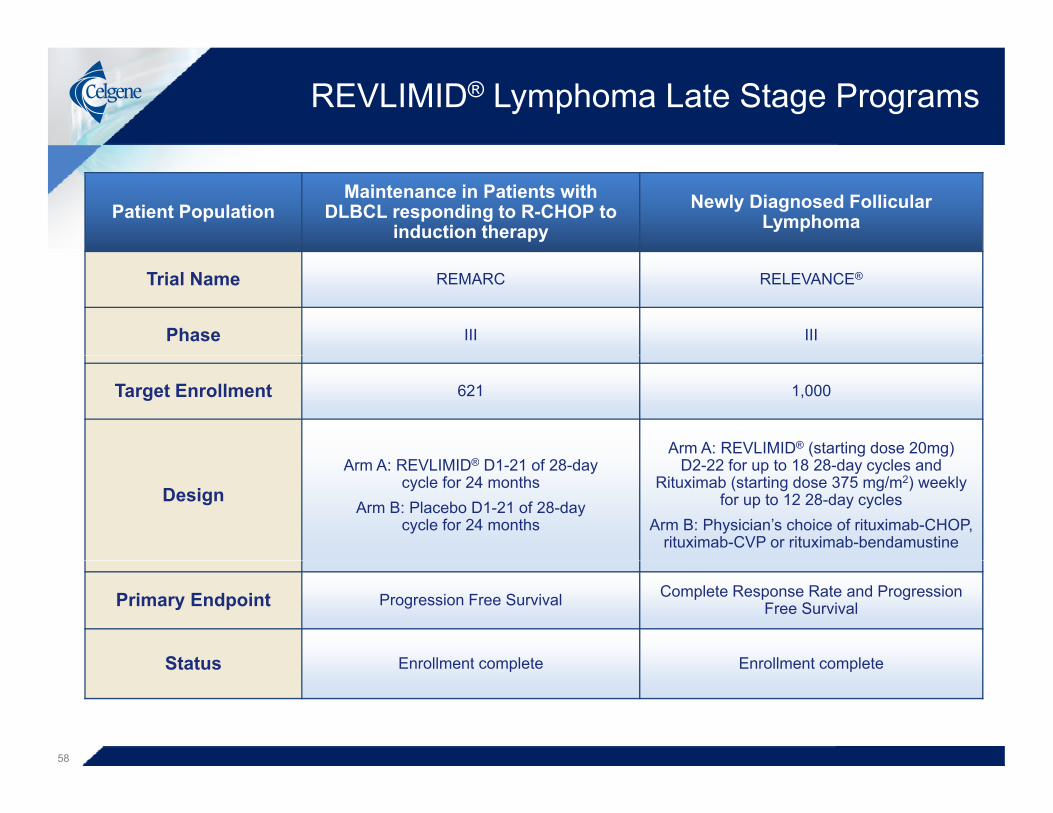
REVLIMID® Lymphoma Late Stage Programs
Patient PopulationMaintenance in Patients with
DLBCL responding to R-CHOP to induction therapy
Newly Diagnosed Follicular Lymphoma
Trial Name REMARC RELEVANCE®
Phase III III
Target Enrollment 621 1,000
Arm A: REVLIMID® (starting dose 20mg)
DesignArm A: REVLIMID® D1-21 of 28-day
cycle for 24 monthsArm B: Placebo D1-21 of 28-day
cycle for 24 months
D2-22 for up to 18 28-day cycles and Rituximab (starting dose 375 mg/m2) weekly
for up to 12 28-day cyclesArm B: Physician’s choice of rituximab-CHOP,
rituximab-CVP or rituximab-bendamustine
Primary Endpoint Progression Free Survival Complete Response Rate and Progression Free Survival
Status Enrollment complete Enrollment completeStatus Enrollment complete Enrollment complete
58

REVLIMID® Lymphoma Late Stage Programs
Patient Population Relapsed or Refractory Follicular Lymphoma
Untreated Activated B-Cell DLBCL
T i l NAUGMENTTM ROBUSTTM
Trial NameNHL-007 DLC-002
Phase III III
Target Enrollment 500 560Target Enrollment 500 560
Design
Arm A: REVLIMID® (10-20mg) D1-21 / Rituximab 375 mg/m2 weekly for cycle 1
then D 1 of cycles 2-5 for 5 28-day cycles Arm a: REVLIMID® (15mg) D1-14/+ R-CHOP21 for 6 21-day cyclesDesign
Arm B: Placebo D1-21, / Rituximab 375 mg/m2 weekly for cycle 1 then D 1 of
cycles 2-5 for 5 28-day cycles
CHOP21 for 6 21 day cyclesArm B: Placebo + R-CHOP21 for 6 cycles
Primary Endpoint Progression Free Survival Progression Free Survival
Status Trial enrolling Trial enrolling
59

REVLIMID® Lymphoma Late Stage Programs
Patient Population Relapsed or Refractory Indolent Lymphoma
Trial NameMAGNIFYTM
NHL-008
Phase III
T t E ll t 500Target Enrollment 500
D i
Arm A: REVLIMID® (10-20mg) D1-21 / Rituximab 375 mg/m2 weekly for cycle 1 then D 1 of cycles 3, 5, 7,9 and 11 for 12 28-day cycles followed by REVLIMID® (10mg) D1-21 / Rituximab 375 mg/m2 D 1 of cycles 13, 15, 17,19, 21, 23, 25, 27 and 29 for
18 28-day cycles followed by REVLIMID® (10mg) D 1-21 until disease progression –28 day cycleDesign 28 day cycle
Arm B: REVLIMID® (10-20mg) D1-21 / Rituximab 375 mg/m2 weekly for cycle 1 then D 1 of cycles 3, 5, 7,9 and 11 for 12 28-day cycles followed by REVLIMID® (10mg) D1-21 / Rituximab 375 mg/m2 D 1 of cycles 13, 15, 17,19, 21, 23, 25, 27 and 29 for
18 28-day cycles
Primary Endpoint Progression Free Survival
Status Trial enrolling
60

ABRAXANE® Solid Tumor Late Stage Programs
Patient PopulationMaintenance After Induction in
Squamous Non-Small Cell Lung Cancer
Adjuvant Therapy in Surgically Resected Pancreatic Cancer
Trial Name NSCL-003 PANC-003
Phase III III
Target Enrollment 540 800
Induction: ABRAXANE® (100 mg/m2) D 1, 8,and 15 / Carboplatin (6 mg min/mL) D 1 for
4 21-day cycles A A ABRAXANE® (125 / 2) / G it bi
Design
4 21-day cyclesMaintenance:
Arm A: ABRAXANE® (100 mg/m2) D 1 and 8 plus BSC until disease progression –
21-day cycle
Arm A: ABRAXANE® (125 mg/m2) / Gemcitabine (1000 mg/m2) D 1, 8 and 15 for 6 28-day cyclesArm B: Gemcitabine (1000 mg/m2) D 1, 8 and
15 for 6 28-day cycles.
Arm B: BSC until disease progression
Primary Endpoint Progression Free Survival Disease Free Survival
Status Trial enrolling Trial enrolling
61

ABRAXANE® Solid Tumor Late Stage Programs
Patient Population First-Line Triple Negative Metastatic Breast Cancer
tnAcity™Trial Name
tnAcity™ABI-007-MBC-001
Phase II/III
Target Enrollment 240/550Target Enrollment 240/550
Phase IIArm A: ABRAXANE® 1(25mg/m2) / Gemcitabine
(1000 mg/m2) D 1 and 8 – 21-day cycleArm B: ABRAXANE® (125mg/m2) / Carboplatin
DesignAUC 2 IV, D 1 and 8 – 21-day cycle
Arm C: Gemcitabine (1000 mg/m2) / Carboplatin AUC 2 IV, D 1 and 8 – 21-day cycle
Phase IIIArm 1: Selected phase II ABRAXANE® armp
Arm 2: Gemcitabine (1000 mg/m2) / Carboplatin AUC 2 IV, D 1 and 8 – 21-day cycle
Primary Endpoint Progression Free Survival
Status Trial enrolling
62

I&I Late Stage Programs
Patient Population
Untreated Moderate-to-Severe
Late Stage Psoriatic Arthritis
Moderate-to-Severe Plaque Psoriasis Active Behçet’s Disease
Molecule OTEZLA® OTEZLA® OTEZLA®
Trial Name PSA-006 PSOR-010BCT-002RELIEFTM
Phase III IIIb III
Target Enrollment 214 240 204
Arm A: OTEZLA® single agent (30mg)
Arm A: OTEZLA® (30 mg) twice daily
Arm A; Placebo for 12 weeks followed by 30mg OTEZLA®
i d il f 2 kDesign(30mg)
twice dailyArm B: Placebo
Arm B: Etanercept (50 mg subcutaneous) once weekly
Arm C: Placebo
twice daily for 52-weeksArm B: 30mg OTEZLA® twice
daily for 64 weeks
Primary ACR 20 t W k 16 PASI75Area under the curve (AUC) for th b f l l fPrimary
Endpoint ACR 20 at Week 16 PASI75 the number of oral ulcers from baseline through week 12
Status EnrollingEnrollment complete
Trial enrollingStatus gData presented at AAD 2015
g
63