PZU Group Financial Results
41
PZU Group Financial Results Warsaw, 26 August 2021 in 2Q21
Transcript of PZU Group Financial Results

PZU GroupFinancial Results
Warsaw, 26 August 2021
in 2Q21

2
hasło do omówienia
PZU Group’s main accomplishments
Business development
Financial results
PZU Group Strategy in 2021- 2024
Attachments
3
8
17
26
31
Table of contents

3
1. PZU Group’s main accomplishments
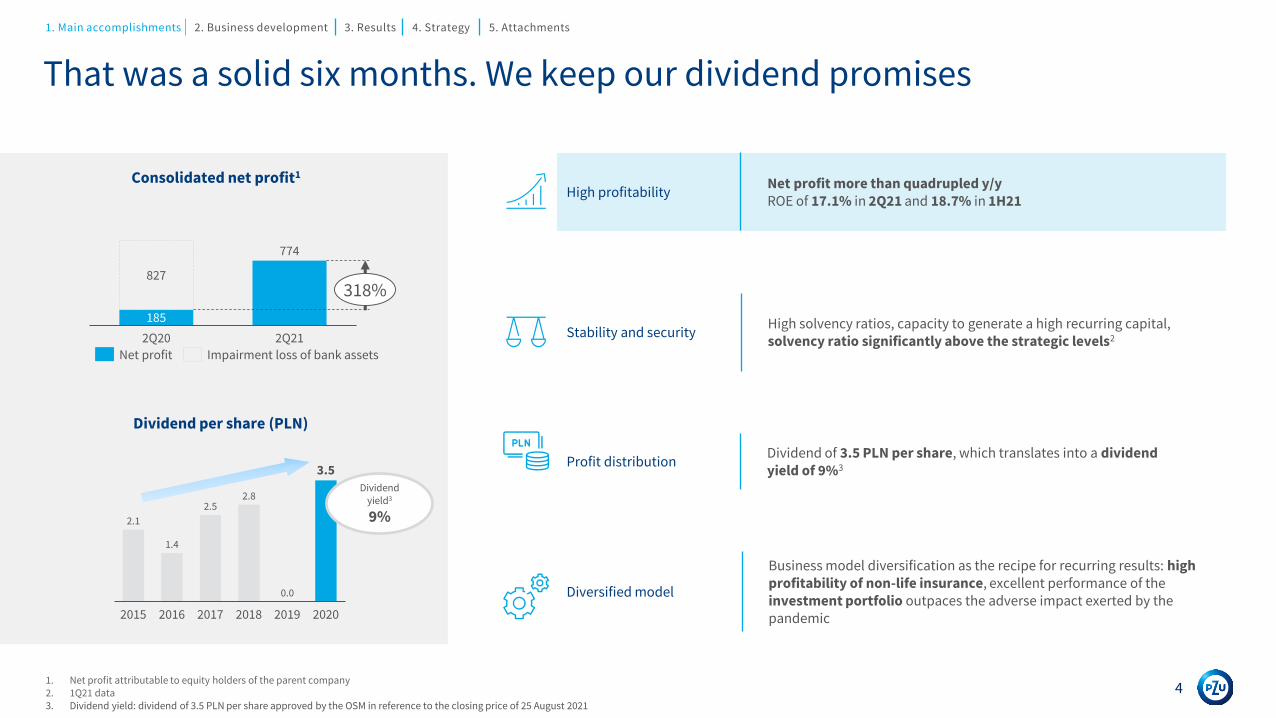
Profit distributionDividend of 3.5 PLN per share, which translates into a dividend yield of 9%3
Stability and securityHigh solvency ratios, capacity to generate a high recurring capital, solvency ratio significantly above the strategic levels2
High profitabilityNet profit more than quadrupled y/yROE of 17.1% in 2Q21 and 18.7% in 1H21
Diversified model
Business model diversification as the recipe for recurring results: high profitability of non-life insurance, excellent performance of the investment portfolio outpaces the adverse impact exerted by the pandemic
That was a solid six months. We keep our dividend promises
Consolidated net profit1
1. Net profit attributable to equity holders of the parent company2. 1Q21 data3. Dividend yield: dividend of 3.5 PLN per share approved by the OSM in reference to the closing price of 25 August 2021
185
774
827
2Q20 2Q21
318%
20162015 20192017
1.4
2018
2.1
2020
2.52.8
0.0
3.5
Dividend per share (PLN)
Net profit Impairment loss of bank assets
Dividend yield3
9%
4
1. Main accomplishments 2. Business development 3. Results 4. Strategy 5. Attachments

Record 1H sales, with quarterly sales up 11%
Gross written premium and its growth in 2Q21 (bn PLN)
• Acceleration of the revenue growth rate, premium up by 11% y/y in 2Q21 (1% in 1Q21)
• Dynamic growth of premiums in non-life insurance – premium up by 15% y/y in 2Q21. Strong demand for corporate insurance. Motor insurance under pressure from the market’s expanding competitiveness and falling prices
• Protection products with premium growth of 34% y/y were the main driver of premium growth in life insurance. Strong premium growth in investment products (+23.8% y/y)
• Intensive development of sales through the bancassurance channel: doubling gross written premium y/y from cooperation with PZU Group’s banks
• Ongoing dynamic growth in the demand for private medical services; PZU Zdrowie’s revenue up 28.5%1 y/y in 1H21, which included a 39.3% y/y increase in revenues generated by centers
• Intensive development of the investment pillar - TFI PZU one of the leaders in the sales of funds in 1H21 and market share in ECS, funds continue to attract incoming investments with interest rates at record-breaking low levels
• Market share in ECS at 36%3, including the net asset value of 822.1 m PLN (>95 thousand companies acquired)
1. Data presented for the centers for the period from the beginning of the year regardless of the time of acquisition 2. By the number of companies
0.5
2Q20 2Q21
Foreign operations
Non-life 3.0
Life
5.6
6.2
2.1
0.5
3.5
2.2
11%
+15% r/r
+5% r/r
5
1. Main accomplishments 2. Business development 3. Results 4. Strategy 5. Attachments

High business profitability in 2Q21
• Very high profitability maintained in non-life insurance – combined ratio of 87.1% in 2Q21 (86.8% in 2Q20)
• Return on the main portfolio: 4.7% in 2Q21 and 6.3% in 1H21 (5.1% in 2Q20), positive impact exerted by the results on the equity portfolio
• Operating margin in group and individually continued insurance in 2Q21 affected by the pandemic at 10.0%; adjusted margin 26.1%4
• Costs under strict control; despite pressure to raise wages and other costs related to the COVID-19 pandemic, the cost ratio5 was 6.8% in 2Q21 (7.2% in 2Q20)
• Return on equity of 17.1% in 2Q21 and 18.7% in 1H21 ; PZU among the insurers generating the highest ROE in Europe
GWP
6.2 bn PLN(vs. 5.6 in 2Q20)
Net profit
774 m PLN(vs. 185 in 2Q20)
Operating margin2
10.0%(vs. 29.9% in 2Q20)
Combined ratio3
87.1%(vs. 86.8% in 2Q20)
1. Annualized ratio, attributable to equity holders of the parent company2. Margin in 2Q20 and 2Q21 for the group and individually continued insurance segment3. Non-life insurance in the PZU Group (Poland) 4. Margin adjusted to account for the deviation resulting mainly from the pandemic and the related excess mortality5. PZU and PZU Życie
6
ROE17.1%1
1. Main accomplishments 2. Business development 3. Results 4. Strategy 5. Attachments

High level of safety in the conducted business makes it possible to disburse cumulative dividends for 2019-20 in line with the regulator’s recommendation
Dividend per share (PLN)
• The dividend of 3.5 PLN per share approved by the Ordinary Shareholder Meeting, translates into a 9% dividend yield1
• Solvency II as at 31 March 2021 at very high levels on a European scale: 223%2 for the Group
• S&P Global Ratings rating at A- with a stable outlook.
• Safe and diversified investment portfolio:augmented share of portfolios securing a high level of profitability versus the low level of market interest rates, including corporate debt with an investment-grade rating
1. Dividend yield: dividend of 3.5 PLN per share approved by the OSM in reference to the closing price of 25 August 20212. Data as at 31 March 2021, calculated based on circular letter of Polish FSA to insurance companies dated 16.04.2021
2015
2.1
2016 2017 2018 2019 2020
1.4
2.5
2.8
0.0
3.5
7
Solvency II for the PZU Group compared to the average of European insurers (1Q21)
0%
50%
100%
150%
200%
250%
PZU Average for Europeaninsurers
223%
201%
1. Main accomplishments 2. Business development 3. Results 4. Strategy 5. Attachments

2. Business development

Trends on the non-life insurance market in Poland
• Sales growth in motor insurance in 1Q21 (+2.4% y/y) coupled with sales growth in MODof 5.8% and in motor TPL of 0.7%
• Rising number of policies in TPL (+2.0% y/y) in conjunction with a decline of averageprices (-1.1% y/y)1
• Recovery on the non-motor insurance market (+8.1% y/y). The largest contributors tothis growth included property insurance (+9.0% y/y) and general TPL (+12.1% y/y)
• The PZU Group’s market share in non-life insurance (direct business) in 1Q21 was31.7%
• PZU Group’s high percentage of the market’s technical result at 41.1%1
Market shares2
Growth rate of the motor insurance market1, y/y
Growth rate of the non-motor insurance market1, y/y
1. according to the Polish FSA’s 1Q21 report2. according to the Polish FSA’s 1Q21 report; i.e. the market and market shares including PZU’s inward reinsurance from LINK4 and TUW PZUW3. PZU Group’s market share in non-life insurance on direct business at the end of 1Q214. movement in market share y/y on PZU’s inward reinsurance from LINK4 and TUW PZUW and direct activity, respectively.
34.0% 2
31.7% 3
(1.8) p.p. 4
(1.6) p.p. 4
2%
15%
-10%
10%
-5%
0%
5%
4Q17 4Q201Q18 2Q18 3Q18 4Q18 1Q19 2Q19 3Q19 1Q204Q19 2Q20 3Q20 1Q21
Motor MTPL MTPL ex reinsurance MOD
8%10%
-10%
-15%
-5%
15%
5%
0%
25%
20%
30%
2Q204Q17 1Q18 2Q18 4Q203Q18 4Q18 1Q19 2Q19 1Q203Q19 4Q19 3Q20 1Q21
Non-motor Insurance against fire and other damage to property (gr. 8+9) Other segments
9
PZU, TUW
PZUW, LINK4
Ergo 16.0%Talanx 14.8%
VIG 10.9%
UNIQA (with
Axa) 7.4%
Allianz 6.0%
GENERALI
4.5%
Others 6.4%
1. Main accomplishments 2. Business development 3. Results 4. Strategy 5. Attachments
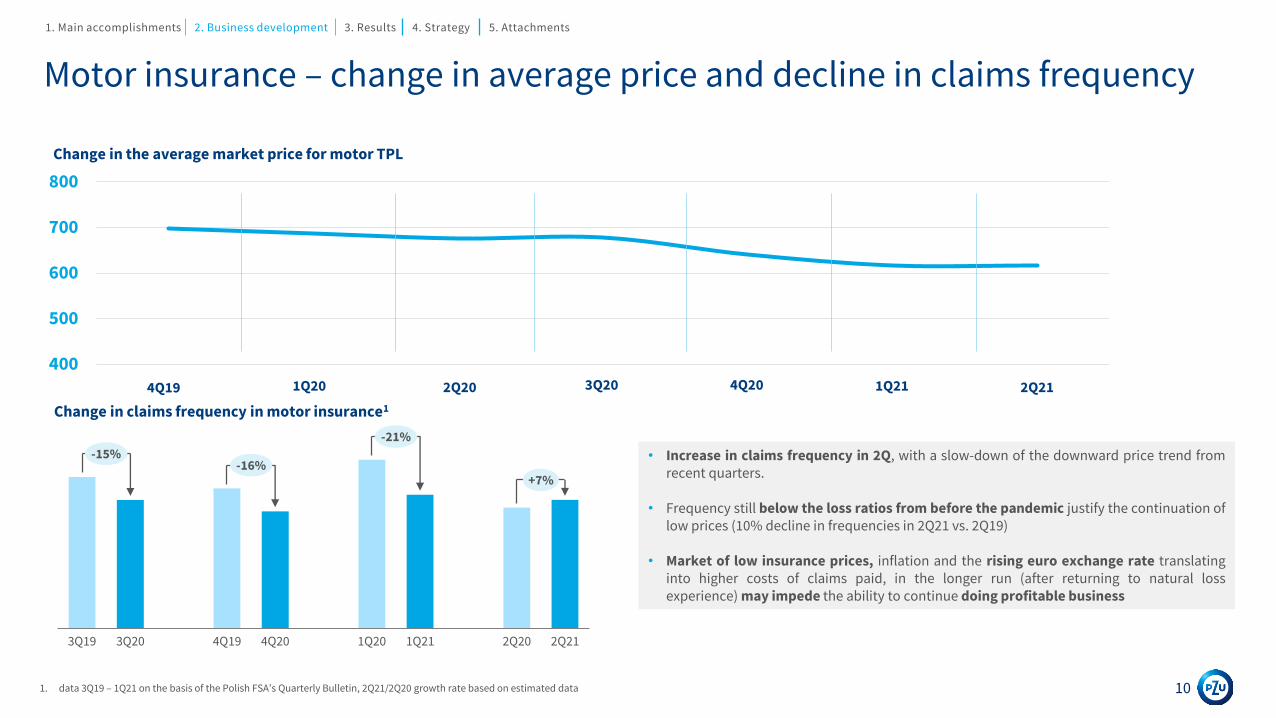
Motor insurance – change in average price and decline in claims frequency
• Increase in claims frequency in 2Q, with a slow-down of the downward price trend fromrecent quarters.
• Frequency still below the loss ratios from before the pandemic justify the continuation oflow prices (10% decline in frequencies in 2Q21 vs. 2Q19)
• Market of low insurance prices, inflation and the rising euro exchange rate translatinginto higher costs of claims paid, in the longer run (after returning to natural lossexperience) may impede the ability to continue doing profitable business
Change in the average market price for motor TPL
Change in claims frequency in motor insurance1
1. data 3Q19 – 1Q21 on the basis of the Polish FSA’s Quarterly Bulletin, 2Q21/2Q20 growth rate based on estimated data 10
400
500
600
700
800
4Q19 1Q20 2Q20 3Q20 4Q20 1Q21 2Q21
3Q19 1Q214Q203Q20 4Q19 2Q211Q20 2Q20
-15%-16%
-21%
+7%
1. Main accomplishments 2. Business development 3. Results 4. Strategy 5. Attachments

Non-life insurance
• Growth in the premium on corporate non-motor insurance of86%, mainly in insurance of other property damages, with asignificant impact of a long-term contract renewal
• In mass non-motor insurance: growth mainly as a result of thegrowing sales of insurance offered in cooperation with theGroup’s banks for cash loans and mortgage loans, an increase ininsurance premiums from small and medium enterprises,continuation of the growth in the sales of residential insurance,declines in ADD insurance
• Persistently high level of competitiveness and price pressure,visible especially in motor insurance
PZU Group’s gross written premium in 2Q21, amount (bn PLN) and growth rate
0.86
0.25
1.90
2Q20 2Q21
2.00
3.47
1.00
0.47
3.02
+15.2%
Motor
Non-motor corpo
Non-motor mass
11
+5% r/r
+86% r/r
+17% r/r
1. Main accomplishments 2. Business development 3. Results 4. Strategy 5. Attachments
1.501.551.601.651.701.751.801.851.901.952.00
0.0
1.0
2.0
3.0
4.0
5.0
Market (LHS) PZU Życie (RHS)
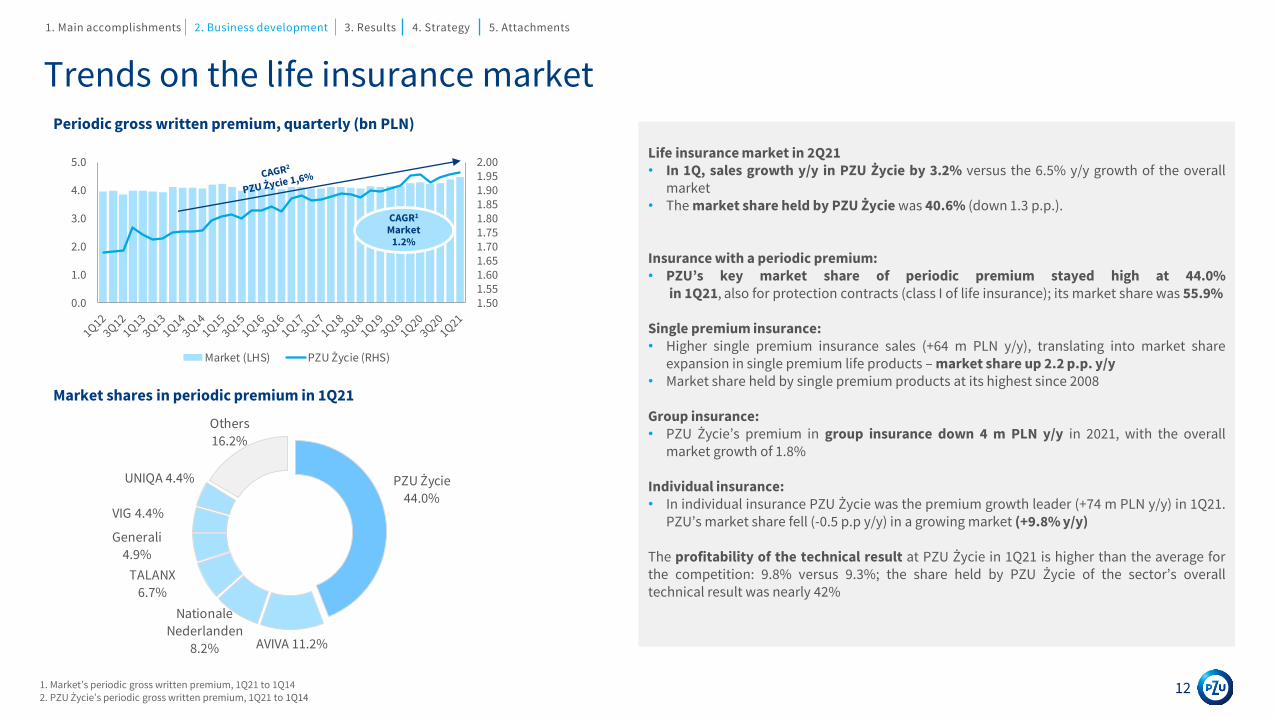
Trends on the life insurance market
Life insurance market in 2Q21• In 1Q, sales growth y/y in PZU Życie by 3.2% versus the 6.5% y/y growth of the overall
market• The market share held by PZU Życie was 40.6% (down 1.3 p.p.).
Insurance with a periodic premium:• PZU’s key market share of periodic premium stayed high at 44.0%
in 1Q21, also for protection contracts (class I of life insurance); its market share was 55.9%
Single premium insurance:• Higher single premium insurance sales (+64 m PLN y/y), translating into market share
expansion in single premium life products – market share up 2.2 p.p. y/y• Market share held by single premium products at its highest since 2008
Group insurance:• PZU Życie’s premium in group insurance down 4 m PLN y/y in 2021, with the overall
market growth of 1.8%
Individual insurance:• In individual insurance PZU Życie was the premium growth leader (+74 m PLN y/y) in 1Q21.
PZU’s market share fell (-0.5 p.p y/y) in a growing market (+9.8% y/y)
The profitability of the technical result at PZU Życie in 1Q21 is higher than the average forthe competition: 9.8% versus 9.3%; the share held by PZU Życie of the sector’s overalltechnical result was nearly 42%
Periodic gross written premium, quarterly (bn PLN)
1. Market’s periodic gross written premium, 1Q21 to 1Q142. PZU Życie’s periodic gross written premium, 1Q21 to 1Q14
Market shares in periodic premium in 1Q21
CAGR1
Market1.2%
12
PZU Życie
44.0%
AVIVA 11.2%
Nationale Nederlanden
8.2%
TALANX
6.7%
Generali
4.9%
VIG 4.4%
UNIQA 4.4%
Others
16.2%
1. Main accomplishments 2. Business development 3. Results 4. Strategy 5. Attachments

• PZU Group’s stable premium in group and individually continued life insurance in 2Q21y/y in Poland despite the negative effects of the pandemic
• Expanding portfolio of health insurance, which has posted record-breaking resultsmeasured by collected premium, especially for ambulatory contracts. At the end of 2Q21,PZU Życie had nearly 2.4 million health insurance contracts in force in its portfolio.
• Steadily rising revenue generated by riders to continued insurance and by adding amalignant neoplasm rider in that insurance group in 2Q of this year
• High level of sales of individual protection products in 2Q driven by the development ofcooperation with Alior Bank to offer single premium individual life insurance to clientstaking out mortgage loans
• Lower level of single contributions in 2Q21 to unit-linked accounts in insurance offeredjointly with banks
Life insurancePZU Życie’s gross written premium on group and individually continuedinsurance (m PLN)
1. 2Q16 - 2Q21
PZU Życie’s gross written premium on individual insurance (m PLN)
13
166
1
167
7
167
2
167
9
168
9
170
1
168
8
169
7
171
4
171
5
171
6
171
0
172
2
172
2
171
9
172
8
173
3
173
8
174
1
175
4
175
9
175
4
174
6
174
8
175
7
175
3
2Q202Q15 2Q16 2Q17 2Q18 2Q19 2Q21
78 82 80 86 82 88 85 91 87 90 90 98 93 97 103 139 117 133 141 145 137 153 188 196 179 20556 48 41 48 48 51 45 68 69 55 57 59 65 59 5455 57 58 64 68 78 55
76 71 74 69204 212154 146 116
153 182 165252 239 257
311188 187 161
145 153176
216 253 201138
212 207 234 170339 341
274 280246
292 312 324
408 384 404468
346 343 318 339 327367
421466
416
346
476 474 487444
Protection products Periodic premium investment products
Single premium investment products
1. Main accomplishments 2. Business development 3. Results 4. Strategy 5. Attachments

Development of the scale of operations in health
• High growth rate of revenue (mainly on ambulatory contracts and riders to continuedinsurance)
• Steady increase in the number of health product agreements in 2021 driven by the salesof more health riders to protection products (offering among others access to specialistphysicians, ambulatory rehabilitation, selected tests and procedures)
• Dynamic construction of the subscription portfolio through PZU Zdrowie’s own salesnetwork
• Further growth in the revenue of medical centers based on organic growth
Revenues (m PLN)
Number of contracts at the end of the period (m)
~2 200 cooperating medical partners~130 proprietary
locations
48 hospitals 2 200 physicians>50
specializations
~8 700 pharmacies
CAGR 29%
CAGR 7%
14* Data presented for the centers for the period from the beginning of the year regardless of the time of acquisition
2.5
2.7
2.9
06.2019 06.2020 06.2021
157 197274
207242
290364
439
564
06.2019 06.2020 06.2021
Medical centers * Insurance / subscription plans
1. Main accomplishments 2. Business development 3. Results 4. Strategy 5. Attachments

Assets under management
• Significant increase in assets under management –up 26% y/y to 36.5 bn PLN2
• Increase in assets under management at TFI PZU of 25% y/y, including a four-fold growth in Employee Capital Schemes (ECS)
• PZU TFI among the leading fund management companies in terms of the inflow of funds and the leader among non-bank TFIs
• Net sales of TFI PZU at 1.1 bn PLN in 1H (including 390.5 m PLN of net inflows under the ECS product)
• Favorable mix of assets under management in TFI PZU – percentage of assets linked to the third pension pillar (EPS and ECS) prevalent
• TFI PZU’s market share in ECS measured by the number of firms at 36%, including the net asset value of 822.1 m PLN (>95 thousand companies acquired)
• Further dynamic growth of the Employee Pension Scheme offering (a 22% y/y increase in assets) resulting from co-payments of existing members and acquisition of new schemes
Assets of third party clients of TFI andPTE PZU clients1 (bn PLN)
Assets of third party clients of the TFIs of thePZU Group’s banks (bn PLN)
15
13.5
24.7
10.8
06.2021
18.3
06.2020
29.0
38.2
+25%21.4
06.2021
17.4
0.7
06.2020
1.6
18.1
23.0
+27%
TFI PZU PTE PZU TFI Pekao Alior TFI
1. Assets managed by PTE PZU are not recognized as a objective in the new PZU Group’s strategy for 2021-20242. According to the PZU Group strategy’s new strategy in 2021-2024, third party assets under management in TFI PZU, Pekao TFI and Alior TFI
1. Main accomplishments 2. Business development 3. Results 4. Strategy 5. Attachments
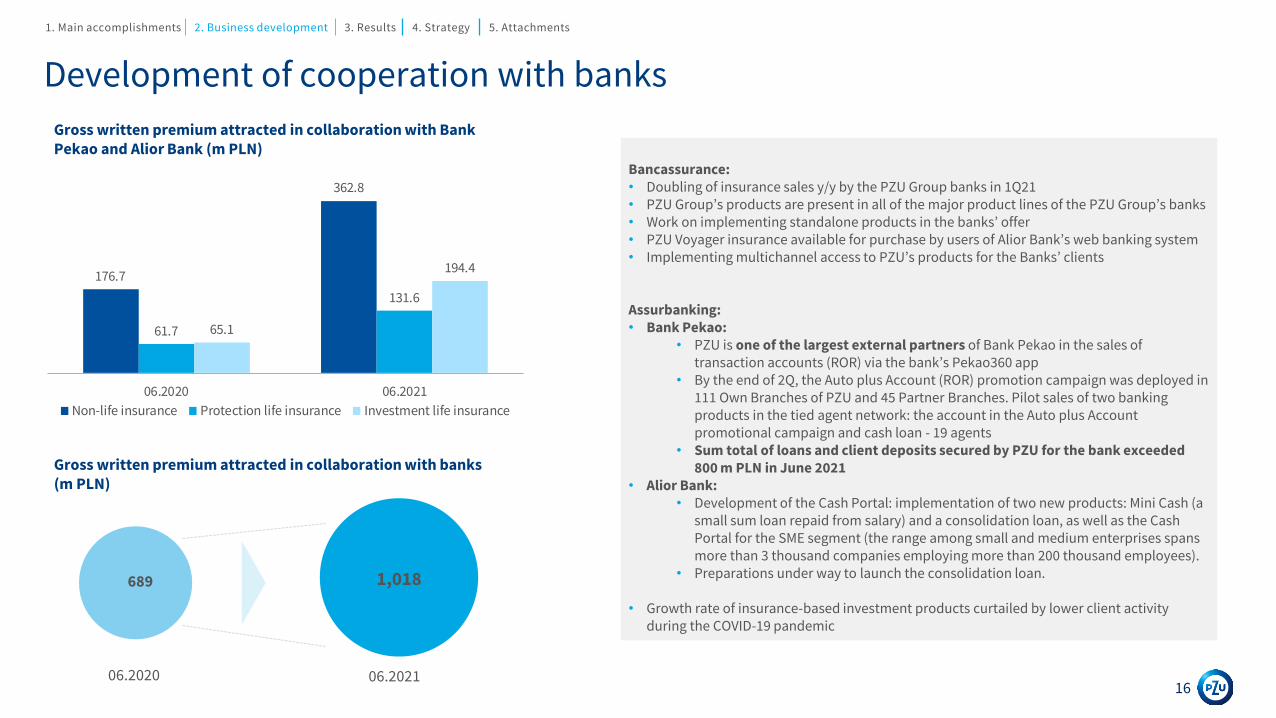
Development of cooperation with banks
Gross written premium attracted in collaboration with BankPekao and Alior Bank (m PLN)
16
Gross written premium attracted in collaboration with banks(m PLN)
06.2020 06.2021
689 1,018
Bancassurance: • Doubling of insurance sales y/y by the PZU Group banks in 1Q21• PZU Group’s products are present in all of the major product lines of the PZU Group’s banks • Work on implementing standalone products in the banks’ offer• PZU Voyager insurance available for purchase by users of Alior Bank’s web banking system• Implementing multichannel access to PZU’s products for the Banks’ clients
Assurbanking: • Bank Pekao:
• PZU is one of the largest external partners of Bank Pekao in the sales of transaction accounts (ROR) via the bank’s Pekao360 app
• By the end of 2Q, the Auto plus Account (ROR) promotion campaign was deployed in 111 Own Branches of PZU and 45 Partner Branches. Pilot sales of two banking products in the tied agent network: the account in the Auto plus Account promotional campaign and cash loan - 19 agents
• Sum total of loans and client deposits secured by PZU for the bank exceeded 800 m PLN in June 2021
• Alior Bank:• Development of the Cash Portal: implementation of two new products: Mini Cash (a
small sum loan repaid from salary) and a consolidation loan, as well as the Cash Portal for the SME segment (the range among small and medium enterprises spans more than 3 thousand companies employing more than 200 thousand employees).
• Preparations under way to launch the consolidation loan.
• Growth rate of insurance-based investment products curtailed by lower client activity during the COVID-19 pandemic
176.7
362.8
61.7
131.6
65.1
194.4
06.2020 06.2021
Non-life insurance Protection life insurance Investment life insurance
1. Main accomplishments 2. Business development 3. Results 4. Strategy 5. Attachments

3. Financial results

PZU Group’s results contribution of activity to date and banking activity
1. PZU Group net of data from Pekao and Alior Bank
2. Annualized ratio, attributable to equity holders of the parent company
3. Only for non-life insurance in the PZU Group in Poland
4. Margin for the group and individually continued insurance segment
18
m PLN 2Q21 1Q21 2Q21 change y/y change q/q
PZU GROUP EXCL. ALIOR BANK AND BANK PEKAO
Gross written premium1 5,594 6,148 6,194 10.7% 0.7%
Net insurance claims and benefits paid (4,010) (3,926) (4,144) 3.3% 5.6%
Net investment result (ex banking activities) 1,106 720 597 (46.0%) (17.2%)
Administrative expenses1 (457) (460) (442) (3.2%) (3.8%)
Acquisition expenses1 (812) (798) (825) 1.6% 3.4%
Operating profit (loss) 1,438 1,052 771 (46.4%) (26.7%)
Net profit (loss) attributable to equity holders of the parent company 1,111 811 609 (45.2%) (24.9%)
BANKS: ALIOR AND PEKAO
Net profit (loss) attributable to equity holders of the parent company (99) 86 165 x 91.8%
Impairment of godwill (827) 0 0 x x
NET RESULT ATTRIBUTABLE TO EQUITY HOLDERS OF THE PARENT COMPANY 185 897 774 318.4% -13.7%
MAIN FINANCIAL RATIOS
ROE2 4.5% 18.8% 17.1% 12.6p.p. (1.7)p.p.
Combined ratio3 86.8% 89.1% 87.1% 0.3p.p. (2.0)p.p.
Margin4 29.9% 10.2% 10.0% (19.9)p.p. (0.2)p.p.
Administrative expense ratio of PZU, PZU Życie 7.2% 7.2% 6.8% (0.4)p.p. (0.4)p.p.
Acquisition expense ratio of PZU, PZU Życie 14.2% 14.2% 14.9% 0.7p.p. 0.7p.p.
1. Main accomplishments 2. Business development 3. Results 4. Strategy 5. Attachments

Profitability by operating segments
19
Insurance segments Gross written premium
m PLN, local GAAP 2Q20 2Q21
Change
y/y 2Q20 2Q21
Change
y/y 2Q20 2Q21
Total non-life insurance – Poland 3,023 3,454 14.3% 476 427 (10.3%) 86.8% 87.1%
Mass insurance – Poland 2,470 2,655 7.5% 408 359 (12.0%) 86.0% 86.9%
Motor TPL 1,026 1,038 1.2% 175 81 (53.9%) 84.3% 92.9%
MOD 578 635 9.9% 93 59 (36.6%) 84.4% 90.5%
Other products 866 982 13.4% 87 190 119.7% 89.3% 76.9%
Impact of allocation to the investment segment x x x 53 29 (45.0%) x x0 0 0 x 0 0 x 0.0% 0.0%
Corporate insurance – Poland 553 799 44.5% 68 68 x 90.4% 87.8%
Motor TPL 153 152 (0.7%) 24 15 (40.0%) 90.5% 94.3%
MOD 147 179 21.8% 13 14 6.0% 93.5% 92.7%
Other products 253 468 85.0% 23 42 78.1% 87.7% 80.1%
Impact of allocation to the investment segment x x x 7 (2) x x x
Total life insurance – Poland 2,100 2,197 4.6% 573 204 (64.4%) 27.3% 9.3%
Group and individually continued insurance - Poland 1,754 1,753 (0.1%) 525 176 (66.5%) 29.9% 10.0%
Individual insurance – Poland 346 444 28.3% 48 28 (41.7%) 13.9% 6.3%Conversion effect x x x 2 (5) x x x
Total non-life insurance – Ukraine and Baltic States 442 482 9.0% 83 70 (15.7%) 82.8% 86.4%
Baltic States 392 424 8.2% 65 61 (6.2%) 85.2% 86.8%
Ukraine 50 58 16.0% 18 9 (50.0%) 50.0% 81.3%
Total life insurance – Ukraine and Baltic States 35 44 25.7% 4 0 x 11.4% 0.0%
Lithuania 20 23 15.0% 0 (2) x 0.0% -8.7%
Ukraine 15 21 40.0% 4 2 (50.0%) 26.7% 9.5%0 0 0 x 0 0 x 0.0% 0.0%
Banks x x x (946) 984 x x x
Insurance result /
operating result
Combined ratio /
Margin
1. Main accomplishments 2. Business development 3. Results 4. Strategy 5. Attachments
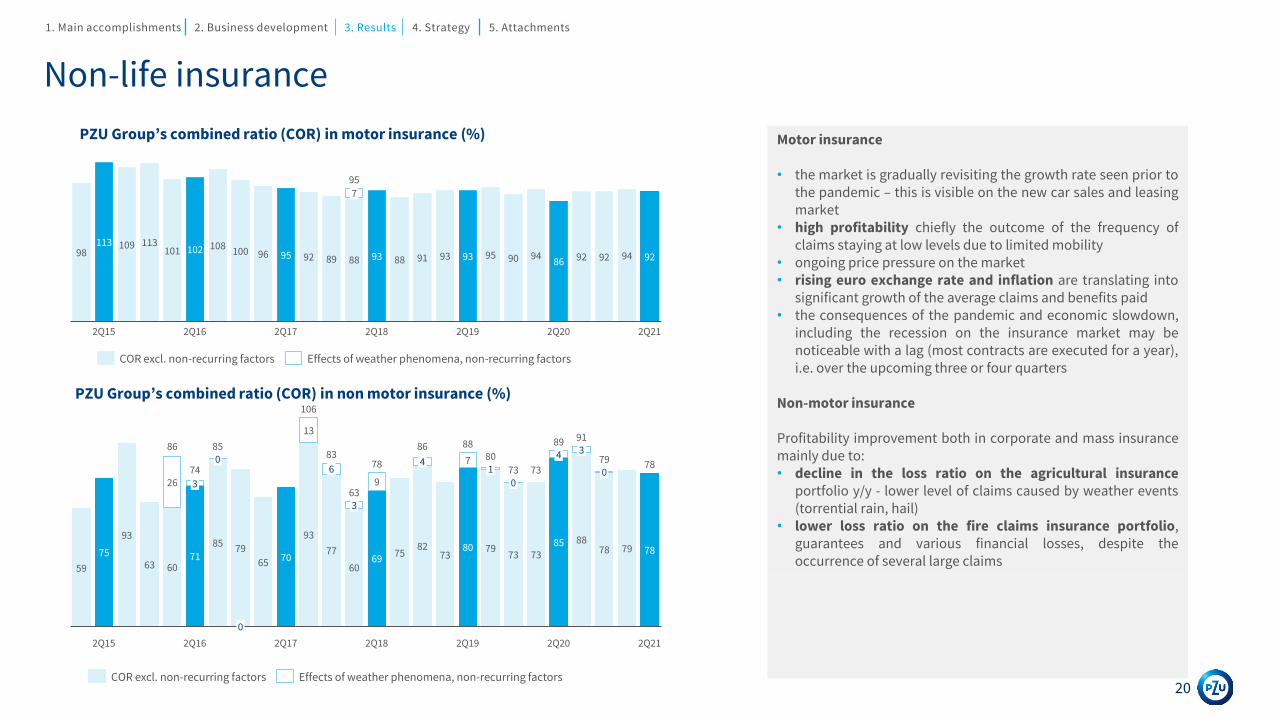
Non-life insurance
Motor insurance
• the market is gradually revisiting the growth rate seen prior tothe pandemic – this is visible on the new car sales and leasingmarket
• high profitability chiefly the outcome of the frequency ofclaims staying at low levels due to limited mobility
• ongoing price pressure on the market• rising euro exchange rate and inflation are translating into
significant growth of the average claims and benefits paid• the consequences of the pandemic and economic slowdown,
including the recession on the insurance market may benoticeable with a lag (most contracts are executed for a year),i.e. over the upcoming three or four quarters
Non-motor insurance
Profitability improvement both in corporate and mass insurancemainly due to:• decline in the loss ratio on the agricultural insurance
portfolio y/y - lower level of claims caused by weather events(torrential rain, hail)
• lower loss ratio on the fire claims insurance portfolio,guarantees and various financial losses, despite theoccurrence of several large claims
PZU Group’s combined ratio (COR) in non motor insurance (%)
PZU Group’s combined ratio (COR) in motor insurance (%)
98113 109 113
101 102 108100 96 95 92 89 88 93 88 91 93 93 95 90 94
86 92 92 94 92
7
2Q15 2Q182Q16 2Q17 2Q19 2Q20 2Q21
95
COR excl. non-recurring factors Effects of weather phenomena, non-recurring factors
59
75
93
63 6071
8579
65 70
93
77
6069
7582
7380 79
73 7385 88
78 79 78
26
13
9
7
2Q17 2Q21
0
2Q15
4
3
30
2Q16
91
6
3
2Q202Q18
4
2Q19
1
00
63
86
74
85
106
8378
86 8880
73 73
89
79 78
COR excl. non-recurring factors Effects of weather phenomena, non-recurring factors20
1. Main accomplishments 2. Business development 3. Results 4. Strategy 5. Attachments
Life insurance
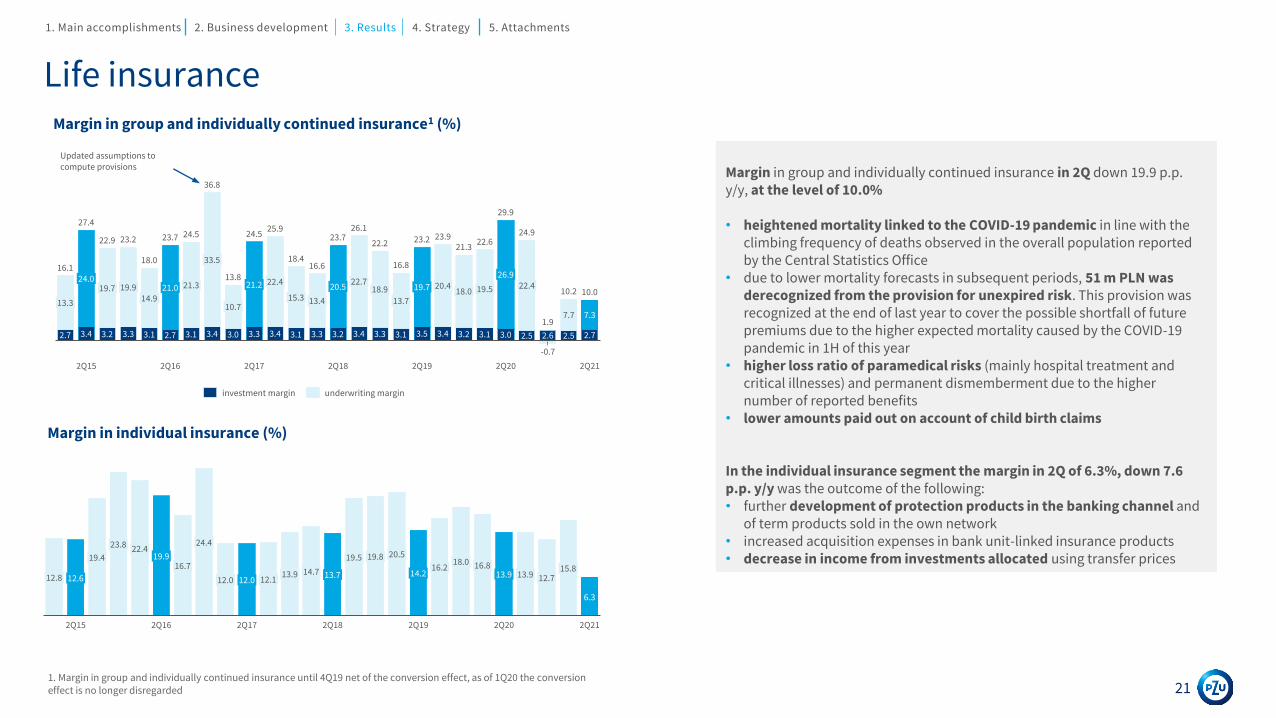
Margin in group and individually continued insurance in 2Q down 19.9 p.p. y/y, at the level of 10.0%
• heightened mortality linked to the COVID-19 pandemic in line with the climbing frequency of deaths observed in the overall population reported by the Central Statistics Office
• due to lower mortality forecasts in subsequent periods, 51 m PLN was derecognized from the provision for unexpired risk. This provision was recognized at the end of last year to cover the possible shortfall of future premiums due to the higher expected mortality caused by the COVID-19 pandemic in 1H of this year
• higher loss ratio of paramedical risks (mainly hospital treatment and critical illnesses) and permanent dismemberment due to the higher number of reported benefits
• lower amounts paid out on account of child birth claims
In the individual insurance segment the margin in 2Q of 6.3%, down 7.6 p.p. y/y was the outcome of the following:• further development of protection products in the banking channel and
of term products sold in the own network• increased acquisition expenses in bank unit-linked insurance products• decrease in income from investments allocated using transfer prices
Margin in individual insurance (%)
Margin in group and individually continued insurance1 (%)
Updated assumptions to compute provisions
211. Margin in group and individually continued insurance until 4Q19 net of the conversion effect, as of 1Q20 the conversion effect is no longer disregarded
2.73.3
10.7
2.7 3.33.13.2
24.0
13.3
3.1
19.7
2.5
2Q19
3.4
18.9
22.9
19.9
3.1
14.918.021.0
2Q16
3.23.1
22.710.0
21.3
3.33.4
33.5
3.43.4
20.5
3.0
19.5
3.3
2Q17
22.421.2
3.4
27.4
15.3
7.3
13.4
3.2
-0.7
36.8
2Q18
22.4
13.7
3.5
19.7 20.4
3.1 2.63.0
26.9
25.9
2Q20
2.5
2Q15
7.7
2Q21
16.1
2.7
18.0
23.7 24.5
13.8
24.5
18.416.6
23.726.1
23.2
16.8
23.2 23.921.3
22.6
29.9
24.9
1.9
10.2
22.2
investment margin underwriting margin
19.916.8
2Q16
22.4
12.8
23.8
12.6
2Q15
15.8
19.819.4
2Q21
13.716.7
24.4
12.0 12.0
2Q17
12.113.9 14.7
2Q18
19.5
6.3
20.5
13.914.2
2Q19
16.218.0
2Q20
13.9 12.7
1. Main accomplishments 2. Business development 3. Results 4. Strategy 5. Attachments
Pandemic and the loss ratio in the group and individually continued segment in 2Q21
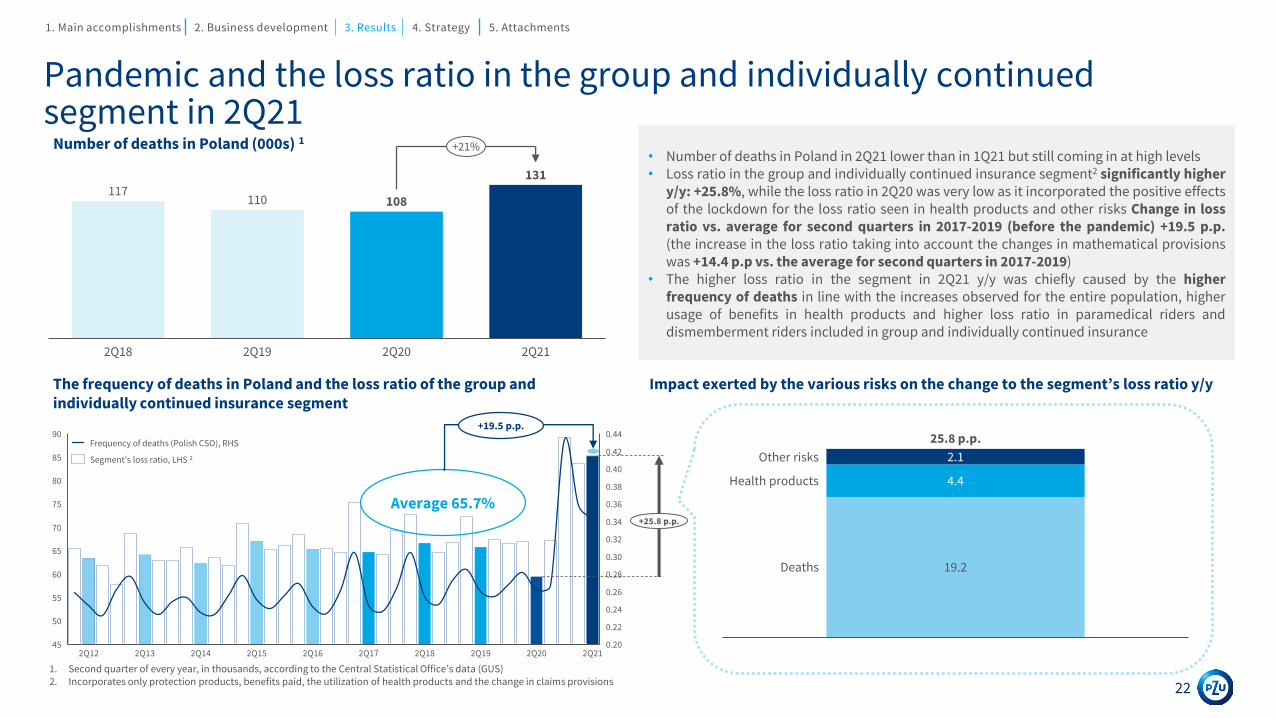
• Number of deaths in Poland in 2Q21 lower than in 1Q21 but still coming in at high levels• Loss ratio in the group and individually continued insurance segment2 significantly higher
y/y: +25.8%, while the loss ratio in 2Q20 was very low as it incorporated the positive effectsof the lockdown for the loss ratio seen in health products and other risks Change in lossratio vs. average for second quarters in 2017-2019 (before the pandemic) +19.5 p.p.(the increase in the loss ratio taking into account the changes in mathematical provisionswas +14.4 p.p vs. the average for second quarters in 2017-2019)
• The higher loss ratio in the segment in 2Q21 y/y was chiefly caused by the higherfrequency of deaths in line with the increases observed for the entire population, higherusage of benefits in health products and higher loss ratio in paramedical riders anddismemberment riders included in group and individually continued insurance
The frequency of deaths in Poland and the loss ratio of the group andindividually continued insurance segment
Number of deaths in Poland (000s) 1
1. Second quarter of every year, in thousands, according to the Central Statistical Office’s data (GUS)2. Incorporates only protection products, benefits paid, the utilization of health products and the change in claims provisions
Impact exerted by the various risks on the change to the segment’s loss ratio y/y
117110 108
131
2Q18 2Q19 2Q20 2Q21
+21%
25.8 p.p.
Other risks 2.1
19.2
4.4Health products
Deaths
0.34
0.26
75
0.20
500.22
0.44
45
60
55
0.42
0.40
0.38
70
65
0.36
0.32
0.30
80
85
0.24
90
0.28
2Q18 2Q192Q17 2Q202Q152Q132Q12 2Q14 2Q212Q16
+25.8 p.p.
Frequency of deaths (Polish CSO), RHS
Segment’s loss ratio, LHS 2
22
Average 65.7%
+19.5 p.p.
1. Main accomplishments 2. Business development 3. Results 4. Strategy 5. Attachments
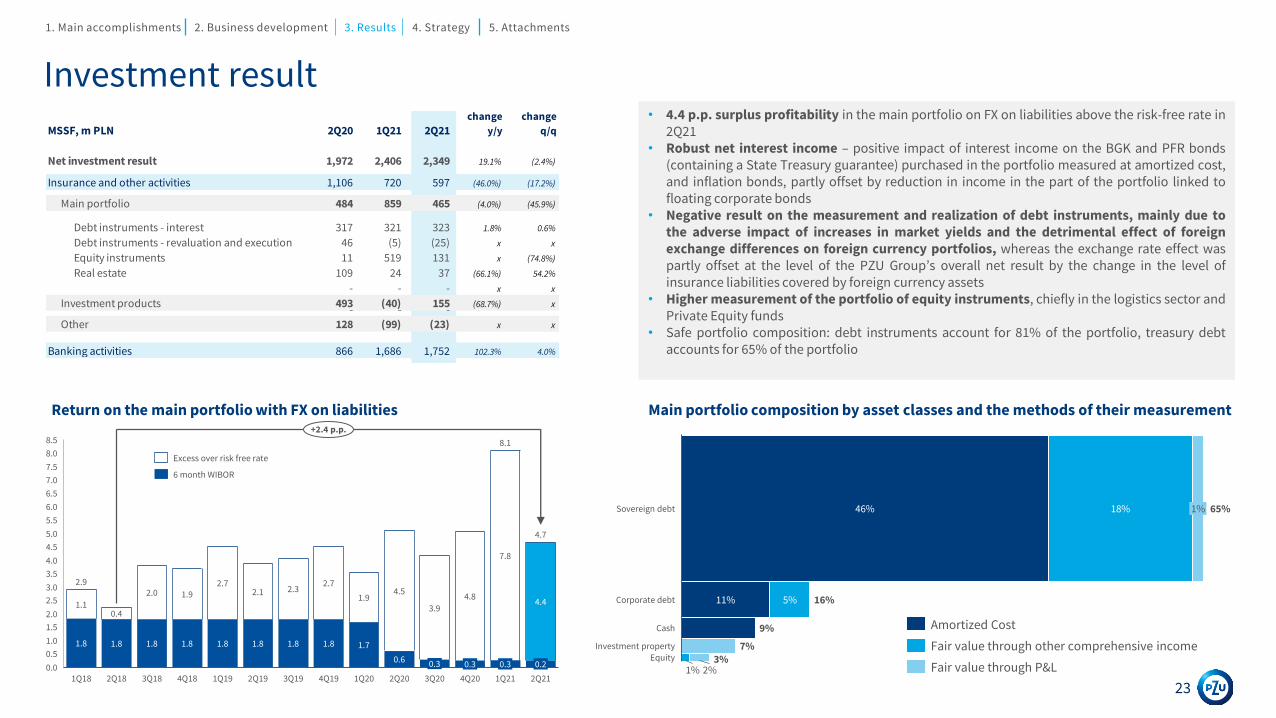
Investment result• 4.4 p.p. surplus profitability in the main portfolio on FX on liabilities above the risk-free rate in
2Q21• Robust net interest income – positive impact of interest income on the BGK and PFR bonds
(containing a State Treasury guarantee) purchased in the portfolio measured at amortized cost,and inflation bonds, partly offset by reduction in income in the part of the portfolio linked tofloating corporate bonds
• Negative result on the measurement and realization of debt instruments, mainly due tothe adverse impact of increases in market yields and the detrimental effect of foreignexchange differences on foreign currency portfolios, whereas the exchange rate effect waspartly offset at the level of the PZU Group’s overall net result by the change in the level ofinsurance liabilities covered by foreign currency assets
• Higher measurement of the portfolio of equity instruments, chiefly in the logistics sector andPrivate Equity funds
• Safe portfolio composition: debt instruments account for 81% of the portfolio, treasury debtaccounts for 65% of the portfolio
Return on the main portfolio with FX on liabilities Main portfolio composition by asset classes and the methods of their measurement
1.5
3.0
3.5
4.0
1.0
2.5
0.0
2.0
0.5
7.0
8.5
4.5
5.0
5.5
7.5
6.0
6.5
8.0
4Q183Q18
0.3
3Q20
4.5
2Q212Q19
0.3
4Q20
0.3
4.4
1Q19 1Q212Q203Q19
3.9
0.2
2.7
1Q18 1Q204Q19
2.9
8.1
4.7
1.1
1.8
0.4
1.8
2.0
1.8
1.9
1.8
2Q18
1.8
2.1
1.8
2.3
1.8
2.7
1.8
1.9
1.7
0.6
4.8
7.8
+2.4 p.p.
6 month WIBOR
Excess over risk free rate
1%
46%
3%
Sovereign debt 65%
Cash
1%18%
5%11%Corporate debt
Investment property 7%
9%
2%Equity
16%
Amortized Cost
Fair value through other comprehensive income
Fair value through P&L
23
MSSF, m PLN 2Q20 1Q21 2Q21
change
y/y
change
q/q
Net investment result 1,972 2,406 2,349 19.1% (2.4%)
Insurance and other activities 1,106 720 597 (46.0%) (17.2%)- - -
Main portfolio 484 859 465 (4.0%) (45.9%)
Debt instruments - interest 317 321 323 1.8% 0.6%
Debt instruments - revaluation and execution 46 (5) (25) x x
Equity instruments 11 519 131 x (74.8%)
Real estate 109 24 37 (66.1%) 54.2%
- - - x x
Investment products 493 (40) 155 (68.7%) x- - -
Other 128 (99) (23) x x
Banking activities 866 1,686 1,752 102.3% 4.0%
1. Main accomplishments 2. Business development 3. Results 4. Strategy 5. Attachments
Cost effectiveness
Administrative expense ratio (%)
Administrative expense ratio calculated using the equation:administrative expenses in PZU and PZU Życie in the quarter / net earned premium in PZU and PZU Życie in the quarter
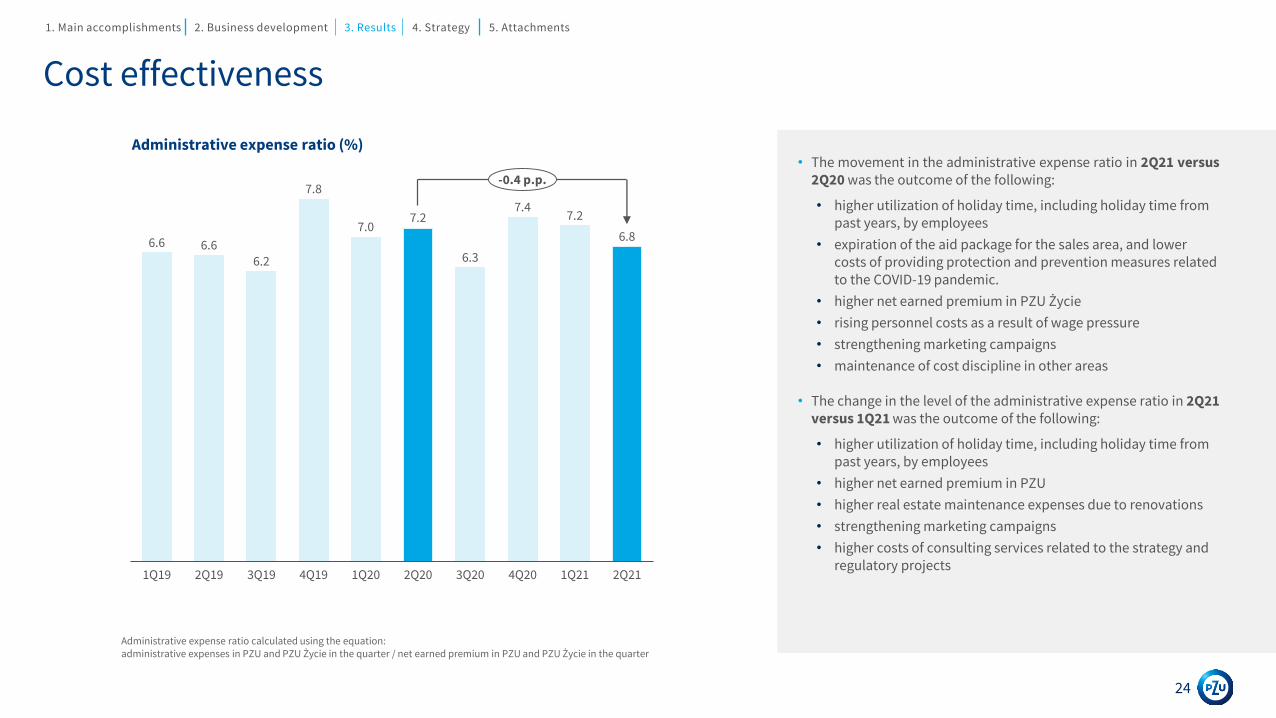
• The movement in the administrative expense ratio in 2Q21 versus2Q20 was the outcome of the following:
• higher utilization of holiday time, including holiday time from past years, by employees
• expiration of the aid package for the sales area, and lower costs of providing protection and prevention measures related to the COVID-19 pandemic.
• higher net earned premium in PZU Życie
• rising personnel costs as a result of wage pressure
• strengthening marketing campaigns
• maintenance of cost discipline in other areas
• The change in the level of the administrative expense ratio in 2Q21versus 1Q21 was the outcome of the following:
• higher utilization of holiday time, including holiday time from past years, by employees
• higher net earned premium in PZU
• higher real estate maintenance expenses due to renovations
• strengthening marketing campaigns
• higher costs of consulting services related to the strategy and regulatory projects
2Q201Q19 3Q19 3Q202Q19 4Q19 1Q20 4Q20 1Q21 2Q21
6.86.6 6.66.2
7.8
7.07.2
6.3
7.47.2
-0.4 p.p.
24
1. Main accomplishments 2. Business development 3. Results 4. Strategy 5. Attachments

Group’s high level of solvency
Solvency II ratio, 31 March 2021
Solvency ratio calculated using the equation:Own funds / solvency requirement.
Annual data based on the audited standalone and consolidated solvency and financial condition reports (SFCR) available on the following website https://www.pzu.pl/relacje-inwestorskie. Other unaudited data.
1. Calculation based on the methods used to date. Does not take into account rules set out in the circular letter of Polish FSA to insurance companies, dated 16.04.2021, based on which starting from 1Q21 the adjustment by the entire amount of the anticipated dividend from 2021 profit becomes the new element of solvency calculations of the company and the group in interim periods.
25
• Increase in own funds of 0.3 bn PLN in 1Q21. Major
reasons:
• accounting for the anticipated dividends: - PZU
reduced its own funds by 80% of 1Q21 net profit, i.e.
0.7 bn PLN1
• decline in technical provisions and higher reinsurance
assets (+1.0 bn PLN)
• operating and investing cash flows (+0.3 bn PLN).
• SCR growth in 1Q21 by +0.2 bn PLN.
Major growth drivers q/q:
• increased market equity risk, counterparty insolvency
risk and non-life insurance risk
• reduced risk of life insurance
22.9 23.524.8
22.8 23.5 23.9 23.025.5
26.7 27.1 26.925.3 25.6
10.1 10.3 10.1 10.2 10.4 10.8 10.5 10.4 10.5 10.5 10.5 10.7 10.9
227% 227%245%
222% 225% 222% 220%
245%256% 258% 257%
236% 235%
0
5
10
15
20
25
30
35
40
45
03.2018 06.2018 09.2018 12.2018 03.2019 06.2019 09.2019 12.2019 03.2020 06.2020 09.2020 12.2020 03.2021
Own funds Solvency Capital Requirement (SCR) Solvency ratio
1. Main accomplishments 2. Business development 3. Results 4. Strategy 5. Attachments
1

4. Strategy

Strategic objectives in 2021-2024 and execution after H1 2021Gross written premium1 (bn PLN)
PZU Zdrowie’s revenues (bn PLN)
PZU Group ’s net profit2 (bn PLN) Solvency II ratio (%)
Banks’ contribution to PZU Group’s net result2 (bn PLN) Assets under management4 (bn PLN)
Return on Equity (ROE)
1. PZU Group’s gross written premium2. Net profit attributable to equity holders of the parent
company
3. Preliminary data - not audited or reviewed by a statutory auditor, calculation based on methods used to date. Does not take into account rules set out in the circular letter of Polish FSA to insurance companies, dated 16.04.2021
4. Third party assets under management TFI PZU, Pekao TFI and Alior TFI
5. Net of the impairment loss for goodwill on the acquisition of Bank Pekao and Alior Bank 27
20242020
3.6
1H 2021
18.7
10.9
17.4
+15.1 p.p.
+6.5 p.p.
11.7
1H 20212020 2024
23.9
12.3
26.2
+5.4%
+9.9%
1H data
0.3
2020 1H 2021 2024
1.9 1.7
3.4
+ 455,1%
+78.8%
236 235
2020 20241Q213
≥ 200%
-1 p.p.
H1 2021
0.4
2020 2024
0.90.6
1.7
+28.5%
+79.8%
20205
(0.1)
1H 2021 2024
0.1 0.3
0.8
+647.6%
29
36
60
2020 1H 2021 2024
33+26.3%
+81.8%
1. Main accomplishments 2. Business development 3. Results 4. Strategy 5. Attachments

Key ESG metrics of the Strategy for 2021-2024
28
55%
500 m
70%
70%
Assessment from the ESG perspective of 55 percent of the biggest corporate insurance clients from sectors sensitive to ESG risksWe set the objective of supporting the development
of low-emission economy, caring for sustainable transformation
Reaching climate neutrality of own operations thanks to reduction of emissions, purchase of green energy and compensation of CO2 emissions
scope1 and 2
emissions
10-15m
ESG targets in
SMobjectives
Increase of the current exposureto investments supporting climate and energy transition by 500 m PLNin 2021-2024
We want to encourage our clients and local communities to lead a sustainableand safe lifestyle
Number of recipients of social activities in the area of safetyand sustainable lifestyle during the year
Percentage of employees covered by the #Well-being program
Giving consideration to ESG targets in the Company’s strategic objectives and handing them over for execution by Senior Management
We will take care of responsible management giving consideration to ESG factors
Percentage of key procurement processes which give consideration to ESG criteria
1. Main accomplishments 2. Business development 3. Results 4. Strategy 5. Attachments

We will develop business ecosystems for new and current clients (1/2)
29
ECOSYSTEM BENEFITS
Convenient space to managebenefits unrelated to salary
• Set of advanced digital tools facilitating employers’ comprehensive management of benefits
Building a community
• An ecosystem offers new opportunities to build relations with clients in daily life
New to the market and attractive products
• PZU Sport – sport and recreation subscription
• CASH – loans with attractive terms involving direct salary-based repayment
• Combined sport, recreation and medical packages and other packaged solutions involving insurance, physical activity and health blended with the services of external partners
Extensive offering of the PZU Group’s benefits
• Many benefits in one venue – ranging from cafeterias and sport cards to insurance and financial products and all the way to health products
• Contact with a single supplier of multiple services for employees: time savings, unifying processes, convenience and lower administrative expenses
Institutional clients obtain a comprehensive offering consisting of various types of benefits unrelated to salary for their employees
Individual clients have accessible services and tools enhancing their comfort in life, activity, lifestyle, etc.
1. Main accomplishments 2. Business development 3. Results 4. Strategy 5. Attachments

30
We will develop business ecosystems for new and current clients (2/2)
30
ECOSYSTEM FOR DRIVERS
...in which the driver is at the center of attention. We provide comfort and safety of use to...
We will prepare an ecosystem addressing clients’ various needs...
... widespread access to services and the usage of the relevant digital technologies.
• We will help buy and sell a car• We will provide support in financing
purchases• We will provide insurance products
Services accessible in a single venue without leaving home, 100% online
The ecosystem will be accessible for everyone, even if he or she does not have insurance
• We will check the vehicle’s state of repair• We will organize its repair• We will provide legal support
Hotline accessible24 hours a day, 7 days a week
• We will organize road assistanceand a replacement vehicle
• We will propose a repair workshop
Jointly with our clients we will develop our services and constantly improve their quality• We will remind clients of important dates
• We will made the history of repairs available
We will furnish safe and user-friendly digital tools
• We will prepare a loyalty program• We will offer additional discounts
on our partners’ services
Not every driver is an expert in vehicle maintenance and that is why we want to provide support to him or her and act as a partner to care about comfort and safety
1. Main accomplishments 2. Business development 3. Results 4. Strategy 5. Attachments

5. Attachments

PZU Group’s gross written premium
32
Insurance segments
m PLN, local GAAP 2Q21 1Q21 2Q21 Change y/y Change q/q
External gross written premium 5,594 6,148 6,194 10.7% 0.7%
Total non-life insurance – Poland 3,015 3,374 3,472 15.2% 2.9%
Mass insurance – Poland 2,465 2,707 2,677 8.6% (1.1%)
Motor TPL 1,026 1,049 1,039 1.3% (1.0%)
MOD 578 675 635 9.9% (5.9%)
Other products 861 983 1,003 16.5% 2.0%
Corporate insurance – Poland 550 667 795 44.5% 19.2%
Motor TPL 152 162 151 (0.7%) (6.8%)
MOD 147 170 178 21.1% 4.7%
Other products 251 335 466 85.7% 39.1%
Total life insurance – Poland 2,100 2,244 2,197 4.6% (2.1%)
Group and individually continued insurance - Poland 1,754 1,757 1,753 (0.1%) (0.2%)
Individual insurance – Poland 346 487 444 28.3% (8.8%)
Premium on protection products 153 179 205 34.0% 14.5%
Premium on periodic investment products 55 74 69 25.5% (6.8%)
Premium on single investment products 138 234 170 23.2% (27.4%)
Total non-life insurance – Ukraine and Baltic States 442 488 482 9.0% (1.2%)
Baltic States 392 441 424 8.2% (3.9%)
Ukraine 50 47 58 16.0% 23.4%
Total life insurance – Ukraine and Baltic States 35 41 44 25.7% 7.3%
Lithuania 20 21 23 15.0% 9.5%
Ukraine 15 20 21 40.0% 5.0%
1. Main accomplishments 2. Business development 3. Results 4. Strategy 5. Attachments

Non-life insuranceMotor insurance under the price pressure in Poland
Mass segment
Corporate segment
86.4% 87.7%
06.2020 06.2021
90.2% 89.3%
06.2020 06.2021
Gross written premium (m PLN) Combined ratio (%) Insurance result (m PLN)
Gross written premium (m PLN) Combined ratio (%) Insurance result (m PLN)
33
3,357 3,393
1,875 1,984
5,232 5,377
538 558
06.2020 06.2021Non-motor insurance Motor insurance
of which LINK4 + TUW PZUW
660 665
566 810
1,2261,475
205 372
06.2020 06.2021Non-motor insurance Motor insurance
of which LINK4 + TUW PZUW
369 259
296343
16483
829685
06.2020 06.2021Motor insurance Non-motor insuranceAllocation of inv. result
6940
6275
43
14
174
129
06.2020 06.2021Motor insurance Non-motor insuranceAllocation of inv. result
1. Main accomplishments 2. Business development 3. Results 4. Strategy 5. Attachments

Life insuranceHigh rate of premium growth on protection products and single premium investment products. Profitability in the group andindividually continued insurance segment affected by the COVID-19 pandemic
Group and individually continued insurance
Individual insurance
Gross written premium (m PLN) Margin (%) Insurance result (m PLN)
Gross written premium (m PLN) Margin (%) Annual premium equivalent (m PLN)
3,513 3,510
06.2020 06.2021
15.5%11.3%
06.2020 06.2021
34
290 384133
143339
404
762931
06.2020 06.2021Single investment products
Periodic investment products
Protection products
23.2%
7.6%
3.1%
2.6%
26.3%
10.1%
06.2020 06.2021
Underwriting margin Investment margin
815
264
108
92
923
356
06.2020 06.2021
Insurance result Investment result
42 58
6273
104131
06.2020 06.2021
bancassurance own sales
1. Main accomplishments 2. Business development 3. Results 4. Strategy 5. Attachments
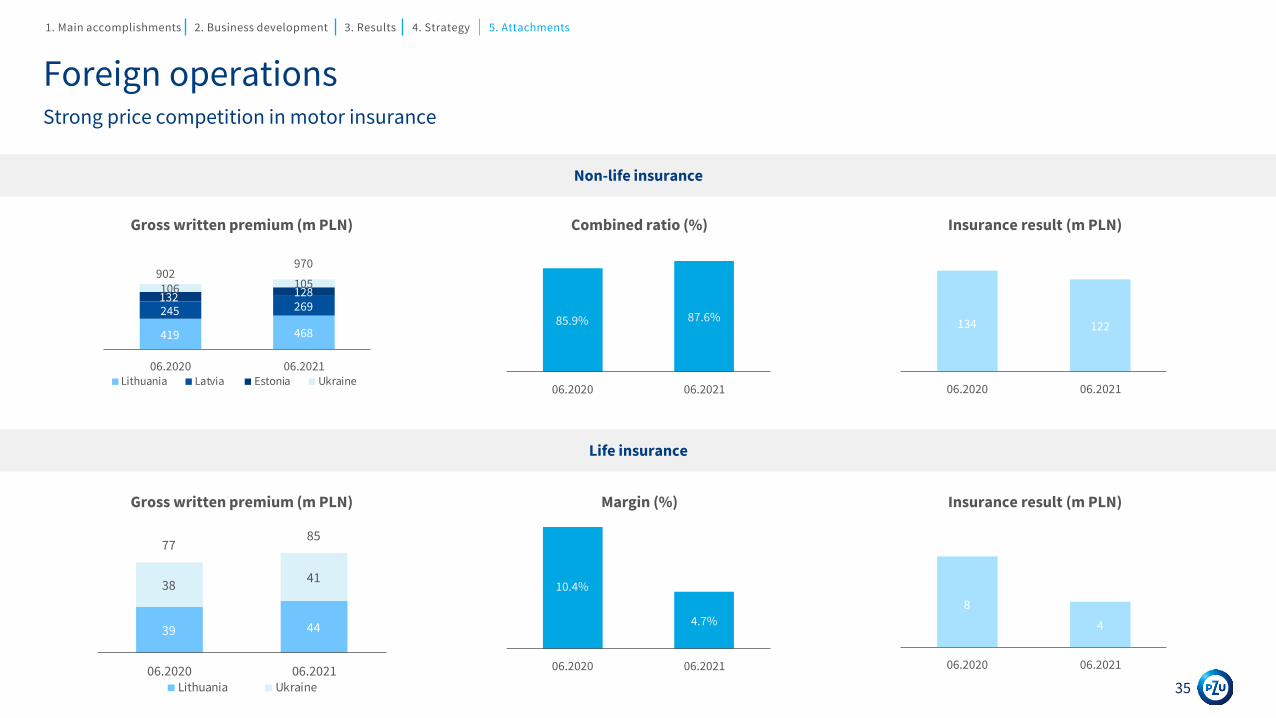
Foreign operationsStrong price competition in motor insurance
Non-life insurance
Life insurance
85.9% 87.6%
06.2020 06.2021
10.4%
4.7%
06.2020 06.2021
134 122
06.2020 06.2021
8
4
06.2020 06.2021
35
419 468
245 269132 128106 105
902970
06.2020 06.2021Lithuania Latvia Estonia Ukraine
39 44
3841
7785
06.2020 06.2021Lithuania Ukraine
Gross written premium (m PLN)
Gross written premium (m PLN)
Combined ratio (%)
Margin (%)
Insurance result (m PLN)
Insurance result (m PLN)
1. Main accomplishments 2. Business development 3. Results 4. Strategy 5. Attachments

-547
360841
1,195
06.2020 06.2021
Alior Bank Bank Pekao
17.2% 17.2%
215% 215%
06.2020 06.2021
TCR Solvency II
43%44%
06.2020 06.2021
BankingSignificant growth in the banks’ operating result
Volumes
Results / ratios
Capital adequacy3
Loans (bn PLN) Deposits (bn PLN)1
Operating result1 (m PLN) Cost / Income 2 (%)
1. Data in accordance with Bank Pekao and Alior Bank’s financial statements2. Data in accordance with PZU’s financial statements, net of the impairment for goodwill and intangible assets3. Data jointly for Bank Pekao and Alior Bank pro rata to the equity stakes held
36
46 46
100 115
1921
67 6016 17
248 259
06.2020 06.2021
Retail deposits Alior Bank Retail deposits Bank Pekao
Corporate deposits Alior Bank Corporate deposits Bank Pekao
Budget Bank Pekao
32 35
76 77
23 22
66 75
197209
06.2020 06.2021
Retail loans Alior Bank Retail loans Bank Pekao
Corporate loans Alior Bank Corporate loans Bank Pekao
1. Main accomplishments 2. Business development 3. Results 4. Strategy 5. Attachments

64.5%
16.6%
9.2%
1.9%
1.1%
6.7%Treasury debt
Corporate debt
Cash
Listed equities
Unlisted equities
Investment property
InvestmentsQuarterly results and portfolio composition
Net investment result (m PLN)
66.1%
17.1%
7.4%
0.8%1.2%
7.4%
Investment products 6.6 bn PLNInvestment products 6.4 bn PLN
43.6 bn PLN 45.6 bn PLN
December 2020 main portfolio investment composition June 2021 main portfolio investment composition
37
(143) (15) (85)662
9051,324
( 50)
23
Result of the main portfolio
according to IFRS
6M2020
Equity instruments Debt instruments -
revaluation and execution
Debt instruments - interest Investment property Result of the main portfolio
according to IFRS 6M2021
Main portfolio FX on insurance liabilities
1. Main accomplishments 2. Business development 3. Results 4. Strategy 5. Attachments

19.4
2.4
10.7
3.8(0.6)
(2.4)
(3.6)
(4.1)
17.5
0.5
7.6
25.6
PZU Group’s
capital attributed to equity holders
of the parent company
according to IFRS
PZU’s
subordinated debt
Measurement oftechnical
provisions(BEL+RM)
Measurement ofassets and
liabilities at fairvalue
Valuation of banks Deferred tax Write off ofintangible assets
and DAC
Anticipateddividends and
asset levy
Own fundsof the PZU Groupaccording to SII
Insurance group Other financial institutions Banks
Own fundsPZU Group’s data in Solvency II as at 31 March 2021 (bn PLN, unaudited data)
Comparison of own funds and consolidated equity according to IFRS
1. The exception pertains to intangible assets and deferred acquisition costs whose value for the purposes of SII is zero2. Calculation based on methods used to date. Does not take into account rules set out in the circular letter of Polish FSA to insurance companies, dated 16.04.2021
32%
38
Own funds according to SII minus:• dividend amount for the previous year (if not
included in liabilities)
• the dividend in the amount of 80% of netprofit for 1Q212
• the forecasts of the asset levy to be paid byinsurance undertakings in the 12 monthsafter the balance sheet date (according to theletter from the Polish FSA)
1. Main accomplishments 2. Business development 3. Results 4. Strategy 5. Attachments

Solvency capital requirement (SCR)PZU Group’s data in Solvency II as at 31 March 2021 (bn PLN, unaudited data)
Solvency requirement moved up in 1Q21 by 0.2 bn PLN. The mainreasons for the movement in SCR:• increased catastrophic risk in non-life insurance caused by the
higher exposure to the risk of flooding (+0.11 bn PLN2) andhigher premiums and provisions
• decrease in the life insurance requirement triggered byupdating the mortality assumptions and the assumed costs ofhandling insurance contracts (-0.09 bn PLN2).
• increase in counterparty insolvency risk in connection with theincrease in the balance of receivables and cash (+0.08 bn PLN2)
• increase in market risk as an outcome of higher equity risk(higher symmetric adjustment after the upward drive ofcapital markets) lower requirements on account of the interestrate and currency through better matching of positions (+0.05bn PLN2)
Basic solvency capitalrequirement (BSCR)
1. Difference between SCR and the total of the following: BSCR, operational risk, the requirement of the banking sector and other financialinstitutions ensues from a tax adjustment (LAC DT).
2. Prior to the effects of diversification.
Solvency capitalrequirement (SCR)
Effect of diversification
-34%
10,91
39
4.8
2.7
3.4
0.4
Non-life and health insurance
Life insurance
Market risk
Counterparty Default Risk (CDR)
7.4
0.8
3.5
0.3
BSCR
Operational risk
Banks
Other (TFI, PTE)
1. Main accomplishments 2. Business development 3. Results 4. Strategy 5. Attachments

Disclaimer
This Presentation has been prepared by PZU SA (“PZU”) and is purely informational in nature. Its purpose is to present selected data concerning the PZU Group (“PZU Group”), including its growth prospects.
PZU does not undertake to publish any updates, changes or adjustments to information, data or statements set forth in this PZU Presentation in the event of modifying PZU’s strategy or intentions or the occurrence of facts or events that will exert an impact on PZU’s strategy or intentions unless such a reporting duty stems from the prevailing legal regulations.
The PZU Group is not liable for the consequences of decisions made after reading this Presentation.
At the same time, this Presentation cannot be treated as part of an invitation or an offer to acquire securities or to make an investment. Nor does it constitute an offer or an invitation to execute other securities-related transactions.

Thank you
Contact: Magdalena Komaracka, CFA +48 22 582 22 93 [email protected] .pzu.pl/ir
Contact: Piotr Wiśniewski +48 22 582 26 23 [email protected] .pzu.pl/ir