Pyrolysis of Household Plastic Wastes - Journal … of Household Plastic Wastes Nasrollah Hamidi 1*,...
23
____________________________________________________________________________________________ *Corresponding author: E-mail: [email protected]; British Journal of Applied Science & Technology 3(3): 417-439, 2013 SCIENCEDOMAIN international www.sciencedomain.org Pyrolysis of Household Plastic Wastes Nasrollah Hamidi 1* , Fariba Tebyanian 2 , Ruhullah Massoudi 1 and Louis Whitesides 3 1 Department of Biological and Physical Sciences, South Carolina State University, Orangeburg, SC 29117, USA. 2 Department of Civil and Mechanical Engineering, South Carolina State University, Orangeburg, SC 29117, USA. 3 1890–Researcha, South Carolina State University, Orangeburg, SC 29117, USA. Authors’ contributions This work was carried out in collaboration between all authors. Author NH designed the study, set-up the experiment, selected the materials, performed GC-MS analysis, wrote the first draft and finalized the manuscript. Author FT performed the experiments, collected the data, performed the statistical analysis of GC-MS data, and participated in writing the first draft. Author RM provided GC-MS expertise, wrote the introduction and worked on the revision of the manuscript. Author LW had the original idea and supported the work in all steps. Author LW did English revision of final draft. All authors read and approved the final manuscript. Received 6 th August 2012 Accepted 8 th February 2013 Published 17 th March 2013 ABSTRACT Aims: Thermal cracking of waste plastic (without catalyst) to useful chemicals. Study Design: To design the experimental procedure, we primarily concentrated on the thermal stability of the materials by bearing in mind the results of thermogravimetric analysis (TGA). Based on the thermogravimetric results the appropriate set-up for the decomposition of the plastic wastes was designed. Three common household plastic wastes – styrofoam dining plates (SDP), shipping protection styrofoam boxes (SPFB), and carrying plastic shopping bags (CPB) – were pyrolized into liquids. GC-MS was used to characterize the sample of the obtained liquids. Place and Duration of Study: The study was done in the Department of Biological and Physical Sciences at South Carolina State University (SCSU), Orangeburg, SC, USA, during the summer of 2012. Methodology: The thermal cracking process without catalyst was used to convert Research Article
Transcript of Pyrolysis of Household Plastic Wastes - Journal … of Household Plastic Wastes Nasrollah Hamidi 1*,...

____________________________________________________________________________________________ *Corresponding author: E-mail: [email protected];
British Journal of Applied Science & Technology 3(3): 417-439, 2013
SCIENCEDOMAIN international
www.sciencedomain.org
Pyrolysis of Household Plastic Wastes
Nasrollah Hamidi 1*, Fariba Tebyanian 2, Ruhullah Massoudi 1 and Louis Whitesides 3
1Department of Biological and Physical Sciences, South Carolina State University,
Orangeburg, SC 29117, USA. 2Department of Civil and Mechanical Engineering, South Carolina State University,
Orangeburg, SC 29117, USA. 31890–Researcha, South Carolina State University, Orangeburg, SC 29117, USA.
Authors’ contributions
This work was carried out in collaboration between all authors. Author NH designed the
study, set-up the experiment, selected the materials, performed GC-MS analysis, wrote the first draft and finalized the manuscript. Author FT performed the experiments, collected the
data, performed the statistical analysis of GC-MS data, and participated in writing the first draft. Author RM provided GC-MS expertise, wrote the introduction and worked on the
revision of the manuscript. Author LW had the original idea and supported the work in all steps. Author LW did English revision of final draft. All authors read and approved the final
manuscript.
Received 6 th August 2012 Accepted 8 th February 2013 Published 17 th March 2013
ABSTRACT Aims: Thermal cracking of waste plastic (without catalyst) to useful chemicals. Study Design: To design the experimental procedure, we primarily concentrated on the thermal stability of the materials by bearing in mind the results of thermogravimetric analysis (TGA). Based on the thermogravimetric results the appropriate set-up for the decomposition of the plastic wastes was designed. Three common household plastic wastes – styrofoam dining plates (SDP), shipping protection styrofoam boxes (SPFB), and carrying plastic shopping bags (CPB) – were pyrolized into liquids. GC-MS was used to characterize the sample of the obtained liquids. Place and Duration of Study: The study was done in the Department of Biological and Physical Sciences at South Carolina State University (SCSU), Orangeburg, SC, USA, during the summer of 2012. Methodology: The thermal cracking process without catalyst was used to convert
Research Article
British Journal of Applied Science & Technology, 3(3): 417-439, 2013
household waste plastics into liquids. Three types of waste plastics, SDP, SPFB and CPB were used for these studies. The waste plastics were cut into small slices suitable to fill the reactor. Prior to pyrolysis, the thermal stability of materials were determined by thermogravimetric analysis (from 70ºC to 650ºC) with a heating rate of 10ºC/min while the samples were purged with 10 mL/min argon. The condensed liquids were analyzed by a Shimadzu GC-MS model GCMS-QP 2010s using helium as the mobile phase. Results: The thermal stability of waste plastics depended on the nature of constituent polymers from which the plastic originated, as was expected. Polystyrene derivatives, SDP and SPFB, both physically soft and hard, had similar thermal stability. The highest decomposition rates were observed at temperatures 418ºC and 423ºC for soft and hard SPFB respectively. No leftover was observed by thermogravimetric analysis. SDP were thermally more stable than SPFB; the decomposition began around 400ºC. The highest weight loss rate was observed at 440ºC. The TGA leftover was about 3% of total mass of SDP. The bulk pyrolysis of SDP and SPFB had 20% to 30% leftover. The GC-MS chromatogram indicated that over 350 chemicals resulted from decomposition of polystyrene based materials; the most abundant compound of pyrolysis was styrene and styrene derivatives as expected. The pyrolysis of CPB yielded hydrocarbons C4 to C24 being both alkanes and alkenes as expected. The TIC picks of CPB were geminals; first being alkene and the next was alkane with the same number of carbons (Figure 9). Conclusion: The chemical composition of the liquids obtained and the yields depended on the original polymer, quality of the waste, and the engineering of thermolysis procedure. The refinement of liquids resulting from pyrolysis is necessary to obtain a quality fuel. The condensed liquids produced from pyrolysis contained highly reactive chemicals such as vinyl, alkene, and three- and four-member cyclic hydrocarbons, which make the storage life of these materials short. For long time storage, however, these liquids must be stabilized either by stabilizers or hydrogenation of the product promptly after collection.
Keywords: Environment; plastic waste; thermolysis of plastic wastes; styrofoam; shopping
bags; dining plate styrofoam; fuel from plastic wastes. Terms : SPFB: shipping protection styrofoam box; SDP: Styrofoam dining plate; CPB: Caring plastic bag, or plastic carrying bag; PVC: Poly(vinyl chloride); PMMA: Poly(methyl methacrylate); PS: Poly(styrene); PE: Poly(ethylene); PET: Poly(ethyleneterephthalate); RT: Retention time. 1. INTRODUCTION Many varieties of materials used on a daily basis are made from petroleum derivatives called plastics. Plastics have unique properties because of strong chemical bonds which make them adequate for many applications; however, these bonds are not biodegradable. Plastics have revolutionized quality of life and more and more many new life-saving devices are and will be made of them. We are so dependent on them that it seems without plastics we would have a hard time managing normal living. Therefore, enormous volumes of plastics composed of bags, dishes, packing materials, etc., after daily use, generate billions of tons of non-degradable wastes. These commodities quickly become pollutants; they pollute the environment (air, land and water), exhaust the landfills, and endanger wild and civil life. On the other hand, petroleum resources are decreasing day by day while demands for petrochemicals increases by hours for both industrial uses and energy production. The
418

British Journal of Applied Science & Technology, 3(3): 417-439, 2013
419
portion of petroleum used to fabricate household materials could be recovered by thermal decomposition of the plastic wastes. The decomposition of polymeric materials has been of scientists’ interests since the applied knowledge of polymeric materials gained relevance [1,2,3]. The decomposition kinetics of polymeric materials [4,5] and the mechanism of decomposition have been studied by many researchers [6,7]. Researchers have discovered that some widely used polymeric materials such as poly(methyl methacrylate) (PMMA), upon heating, decomposed to original monomers [8] and polystyrene (PS) to styrene [9,10]. However, most of the polymeric materials decomposed to smaller stable molecules that were not original constituents of the polymers. For example, poly(vinyl chloride) (PVC), upon heating, first decomposed to hydrogen chloride and unsaturated polymers which decomposed later to other chemicals [11,12,13]. It is noteworthy that most of the well documented researches were done on pure polymers with known molar mass distribution. Therefore, the knowledge of decomposition of waste plastics gained relevance. The decomposition of polymeric materials is also relevant and of interest to industries since plastic is used in many of today’s commodities [14,15]. The wide use of polymeric materials or plastics resulted in the accumulations of untraditional wastes not native to the mother earth life cycle [16,17]. Therefore, wastes of modern materials are accumulated without effective decomposition and recycling routes in the landfills. The increase of petroleum and petrochemical prices opened the ways for industries to invest in decomposition of plastic wastes to petrochemicals [18,19,20]. Today, plastic landfills are as valuable as petroleum mines. Models for reaction’s kinetics for optimal pyrolysis conditions of plastic waste mixtures have been proposed by researchers [6]. Literature abounds on the recycling of these traditional wastes to petrochemicals [21,22,23] and many industries are sustained and developed based on decomposition of natural and synthetic polymers [24,25]. From a scientific-engineering point of view, non-degradability of plastics is no longer an environmental issue in landfills since the plastics can be recycled [26]. However, run-away plastic wastes are continuing to be a huge hazard on the surface and surface water such as waterways, seas and oceans, endangering safe life for both animals and humans [27]. Therefore, the conversion of waste plastics to fuel has several benefits. First, it steps up a new cycle of consumption to nonrenewable energy sources. Second, it provides a considerable source of petrochemicals that reduces the expenditure of nonrenewable energy resources. Third, it establishes an effective, innovative, and alternative solution for eliminating waste plastics, consequently, preventing them from polluting the environment either through incineration or filling up landfills and waterways [18]. Plastics in different forms are one of the most widely used materials due to their diverse benefits and many applications to daily life [28]. Plastic production in the United States during 2010 accounted for almost 14 million tons as containers and packaging, 11 million tons as sturdy goods such as domestic devices, and 7 million tons as insubstantial goods such as plates and cups. However, only 8 percent of total waste plastics in 2010 were recycled [16,29]. Carrying plastic bags (CPB) is the main mode of transportation of goods in daily shopping in the United States. Consumers and retailers have accepted the CBP for their benefits such as light-weight, strength, inexpensiveness, practical, and as a sanitary way of transporting goods and foods. The bags used in grocery stores to carry foods and goods are made of high density polyethylene (HDPE), and the bags usually used in department and fashion
British Journal of Applied Science & Technology, 3(3): 417-439, 2013
stores are made of low density polyethylene (LDPE). Polyethylene is a product of petroleum, a non-renewable resource [28] which takes many centuries to break down when put in a landfill. The composition of products from the pyrolysis of pure polyethylene in a closed batch reactor and the effects of temperature and residence time was studied by several researchers [30,31,4]. Co-pyrolysis of waste plastic with other natural wastes has been studied. For example, the co-pyrolysis of pine cone with synthetic polymers [32] and characterization of products from the pyrolysis of municipal solid waste [33] and isothermal co-pyrolysis of hazelnut shell and ultra-high molecular weight polyethylene [34] are indicative of the fact that wastes are also useful materials. To avoid the landfill problem and plastic wastes hazards, various techniques for the treatment of waste plastics have been investigated to complement existing landfill and mechanical recycling technologies. The objectives of these investigations were to convert the waste into valuable products such as fuel, synthetic lubricants, and tar for asphalt pavement before the waste headed to a landfill. At the present time, pyrolysis is used as an effective recycling method. It has been employed to convert waste plastic into useful products such as fine chemicals, transportation fuels, and lubricant oils. Pyrolysis is also classified as the chemical and energy recovery system known as cracking, gasification, and chemolysis methods. There are various forms of the thermolysis methods including thermal cracking (pyrolysis), catalytic cracking, and hydro-cracking [13]. The pyrolysis process uses elevated temperatures to crack down high molar mass materials into smaller molecules. The plastics in this process decompose into three phases of matter: gas (condensable and non-condensable mixture), liquid, and solid. In this manner, chemical recycling of the stored energies within plastic wastes take place with the environmental advantage of minimizing plastic pollution [35]. Styrofoam is a non-sustainable, non-photo-degradable, non-biodegradable, hard to recycle, and heavily pollutant petroleum product [36]. It is made by blowing gases into heated polystyrene. Depending on the type of foam 80 to 97% percent of the volume of products is air, making it very light, flexible, shock absorbent, and a poor conductor of heat. It is very useful for insulation, transportation, and food containers such as beverage cups. Some type of foamed polystyrene such as packaging peanuts is reused, the other products, such as boxes to protect a shipment, are one-time use materials [37]. This study reports the results of non-catalytic conversion of expanded polystyrene derivatives (shipping protection materials and dining plates) and polyethylene products (shopping bags) to liquids using a non-catalytic pyrolysis method. The materials used were waste plastics not freshly prepared polymers, nor clean products supplied by manufacturers. 2. MATERIALS, INSTRUMENTATION AND METHODS 2.1 Materials The materials used were waste plastics. They were not supplied by manufacturers. Three types of waste plastics were selected for this particular study. (1) Shipping protection styrofoam boxes (SPFB) recovered from shipping containers (Figure 2a); they were cut to small pieces suitable to fill the reactor. (2) Styrofoam dining plates (SDP) were collected after a dinner meeting; they were rinsed with tap-water, air dried and stored in the laboratory for 30 days (Figure 3a). They were cut into small slices suitable to fill the reactor. (3)
420
British Journal of Applied Science & Technology, 3(3): 417-439, 2013
Common carrying plastic shopping bags (CPB) which were collected after shopping from many stores during 2011 by one family household; these bags were stored after shopping in an air-conditioned room and used as they were collected (Figure 4a). 2.2 Instrumentation 2.2.1 The thermogravimetric analyzer A Perkin-Elmer TGA-7 was used to study the thermal stability of the plastic wastes from 70ºC to 600ºC with a heating rate of 10ºC/min while the sample was purged with 10 mL/min argon. The TGA was calibrated before use. 2.2.2 Gas Chromatographer-Mass Spectrometer A Shimadzu GC-MS model GCMS-QP 2010s was used to analyze the liquid samples using helium as the mobile phase. The oven program was set on 4 min at 45ºC, followed by a 10ºC/min temperature increase to 220ºC and then an isothermal on the final temperature for 15 min. One microliter of each sample was injected into GC-MS by AOC-20i auto-sampler. The autosampler was set for three rinses before and after injection with acetone and two rinses with the sample before injection. The plunger speed and syringe speed were set at high. The MS program consisted of the followings: scanning masses 25 < M/z < 350; scanning time began from zero and ended after 35 minutes. The identities of chemicals were established by the aid of the automatic NIST library search. Among the suggested structures, the one that was better matched to the fragmentations pattern with the boiling point consistent with the retention time of the compound was selected. 2.2.3 The reactor The reactor (Scheme 1) consisted of a five liter three-necked round-bottom flask (reaction vessel) in a heating mantle equipped with a regulator to control the intensity of heating current. One inlet of the flask was reserved for supplying an inert gas into the reactor, the other for a thermometer, and the third outlined to a 30 cm air-cooling condenser inletted to a three way connector. The three-way connector was inlet into a graduated funnel and outlet to another three-necked round-bottom flask equipped with a vertical water-cooling condenser with open-end to the atmosphere. One of the thermometers was able to give account of the temperature inside of the reaction vessel, another thermometer measured the temperature of the vapor coming out of the reactor, and the third thermometer measured the temperature of vapor condensing in the second receiver.
421

British Journal of Applied Science & Technology, 3(3): 417-439, 2013
Scheme 1. The representation of the reactor
2.3 Pyrolysis Procedures 2.3.1 Styrofoam - white styrofoam dining plates (SDP ) Used plates (214.12g, Figure 1a) described as white styrofoam dining plates (SDP) were shredded into small pieces and placed into the reactor (Figure 1b). About 20 mL of water was added to the flask; vaporization of water pushed air out of the reaction vessel and slowed the process of re-polymerization of the newly produced styrene. A glass thermometer was placed into the three-way receiver where the gases were directed to the condenser to record the temperature of gases that left the reactor, and another thermometer was placed at the exit of the first receiver to record the temperature of volatiles that condensed into the next receiver (Figure 1b). After heating for 10 minutes, the temperature of vapor inside the flask reached 91ºC. Water vapor occupied the entire volume of the vessel. The heating was suspended after all SDP was melted and 15 mL of condensed liquid were collected. The collected liquid had two phases, water and ~60% organics insoluble in water. When the reactor reached room temperature another load of 287.10 g of shredded SDP were added to the reactor (Figure 1c). Once most of the materials melted a glass thermometer was placed inside the flask to record the reaction temperature (Figure 1d). The first drop of condensate was collected into the recipient after 120 minutes when the melt temperature reached 290ºC. The collected liquid was transparent and clear as shown in Figure 1e. The reaction was stopped after 330 minutes. The un-pyrolyzed materials, leftover at the end of the pyrolysis process (Figure 1f), had a consistency and color similar to asphalt materials.
Shredded Styrofoam
Condensates
Condensates
Remaining
Fuel Oil
Condensation
Heating up to 600oC
Fuel Oil
Condensation
Gasification
422

British Journal of Applied Science & Technology, 3(3): 417-439, 2013
Figure 1. Step-by-step illustration of decomposition process of SDP: (a) SDP and utensils; (b) the reactor loaded with the first load of shredded SDP; (c) reactor
charged with the second load of SDP; (d) inserted thermometer into melted SDP; (e) condensed liquid; and (f) end leftover
2.3.2 Styrofoam: SPFB–pyrolysis at normal heating 100 grams of SPFB (Figure 2a) was cut into small pieces and placed into the reactor (Figure 2b). The heater’s current intensity was set on medium. After 10 minutes, the SPFB started to melt down. The temperature of the heating mantle was measured with a glass thermometer to be 250ºC. After 15 minutes, the SPFB started to evaporate when the heating mantel thermometer was at 330ºC. Five minutes later, the mantle temperature was 360ºC, and the first drop of condensed vapor was collected at 60ºC. The temperature of condensing vapors increased quickly from 60ºC to 131ºC. The pyrolysis process continued for 80 minutes and it stopped when the temperature of the condensing vapors dropped to 70ºC while the heating mantle showed a temperature above 450ºC. The liquid obtained from this pyrolysis process was 70g, which was a 70% yield to liquid. The volatile materials that were not condensing by a water-cooling condenser at room pressure were not collected. The leftover was 20 g of a high viscous dark material in the bottom of the container (Figure 2g). 2.3.3 Styrofoam: SPFB – fast heating pyrolysis The reactor was filled with 100 grams of SPFB pieces as described in section 2.3.2; the current intensity of the heater was set on high. The vapors were directed to a 100 mL graduated cylindrical separatory funnel connected to another flask with a tap water cooling condenser. The first drop of condensed liquids was collected at 60°C. The first sample of liquid was collected between 60ºC and 100ºC. The second fraction was collected above 150ºC. The vaporization process stopped after 40 minutes when the temperature of the condensing vapors dropped to below 80ºC. The condensed liquid obtained from this pyrolysis process was 80g, which means at least 80% of polystyrene was yielded into liquid fuel. The color of the last fraction was dark-red (Figure 3a) with traces of dark materials whirling inside the liquid. Those solid dark particles were pushed out of the reactor by overheated vapor. The remains at the end of decomposition process (Figure 3b) were dark hard solid and difficult to remove from the reaction vessel.
(a) (b) (c)
(d) (e) (f)
423

British Journal of Applied Science & Technology, 3(3): 417-439, 2013
Figure 2. Steps of pyrolysis for SPFB: (a) SPF; (b) SPFB inside the reactor; (c) SPFB melted at 250ºC; (d) liquid SPFB began to evaporate; (e) condensed vapors; (f) the
liquid obtained from pyrolysis process; and (g) the leftover of the SPFB at the end of the pyrolysis process
Figure 3. Product of fast heating SPFB: (a) distillates; and (b) the leftover residue. 2.3.4 Bags: CPB A mixture of 780g of CPB consisting of various sizes and shapes collected from different stores (Figure 4a) during 2011, one by one were pushed into the reactor; the current intensity of the heater was set on high. The reaction vessel was covered with two layers of aluminum foil to conserve and transfer the heating energy to the reactor. A stream of nitrogen gas (10 mL/min) was introduced to the reactor to create and maintain an oxygen-free environment while pushing any trace of air and vapor out of the reaction vessel. The distillates were directed to a graduated separatory funnel (Figure 4c). The CPB started to melt down after 13 minutes at 300ºC. The first 30 minutes of vaporization continued without condensation. A complete melt down of plastic bags was observed at 400ºC. The liquid started to boil around 500ºC; the starting vapors were condensate at 60ºC. The temperature of condensing vapor gradually increased to 175ºC during 90 minutes of the collection process. Then the temperature dropped to 90ºC and the condensation gradually halted.
(a) (b)
424

British Journal of Applied Science & Technology, 3(3): 417-439, 2013
Finally, the pyrolysis process was stopped after 240 minutes. Twenty samples (Figure 4d) were collected at different temperatures of the pyrolysis process. At the end of the process there was some condensed material in the second flask as well. Six samples were selected for chemical analyses. The powder shaped residue was not uniform; it had several gray tones of color. The top of it looked similar to over-dried fragmented-dirt (Figure 4e).
Figure 4. The process of pyrolysis of CPB: (a) CPB wastes; (b) initial heating of CPB generated non-condensing gases; (c) the vapors air cooled into the graduated funnel
and the volatiles left the funnel to be water condensed in the next flask; (d) the samples collected at various temperatures; and (e) the leftover at the end of the
pyrolysis process 3. RESULTS AND DISCUSSION 3.1 Thermogravimetric Analysis Figure 5 compares the results of thermal stabilities of some household plastics. The points of interests of thermograms are summarized in Table 1. Randomly, a gray Orangeburg Wal-Mart CPB was selected for thermal decomposition studies. The thermal decomposition of the shopping bag was in the range of 485ºC to 520ºC with the highest volatilization rate at 498ºC. Also, the thermogram showed 30% residues above 540ºC.
Figure 5. Thermogram of four types of household plastic waste materials.
425
British Journal of Applied Science & Technology, 3(3): 417-439, 2013
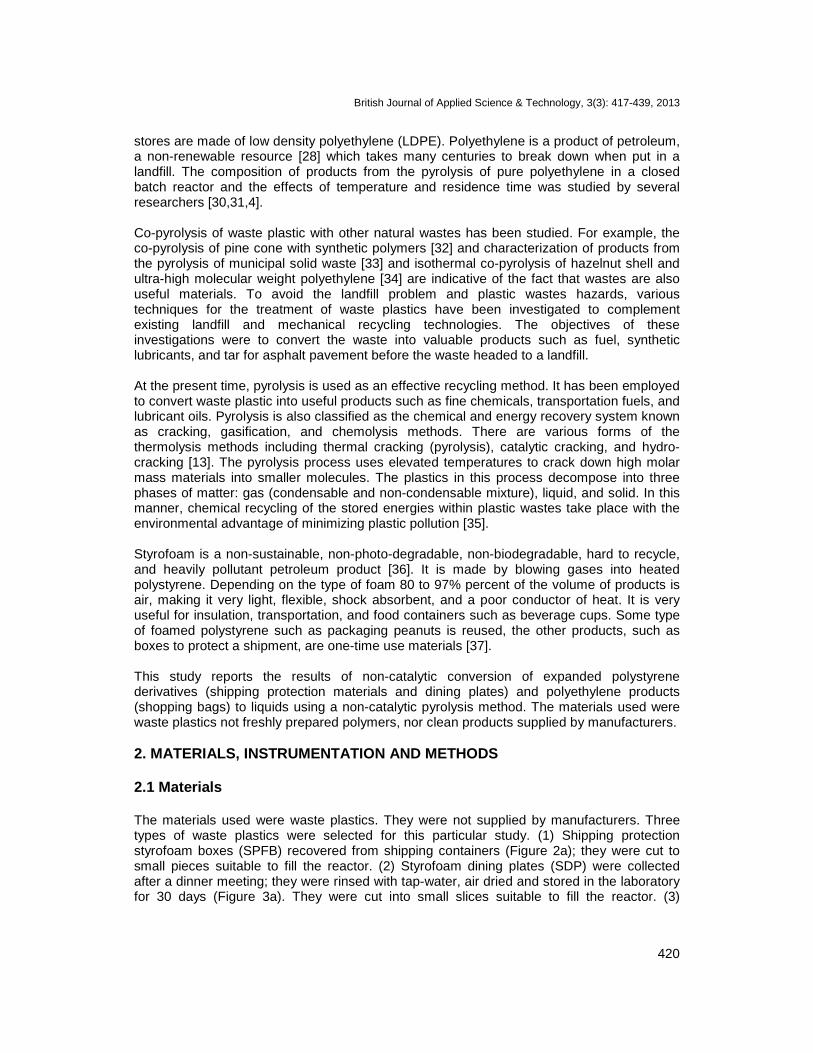
Table 1. Points of interests depicted from thermogram (Figure 5)
%
Rem
ains
t ºC CPB gray
Soft SPFB
Hard SPFB
SDP
95 482 368 351 398 90 488 385 371 417 80 495 398 390 429 70 498 405 401 435 60 502 410 409 440 50 509 415 415 443 40 515 418 421 446 30 543 422 426 449 20 425 431 451 10 430 436 457 <5 446 441 462
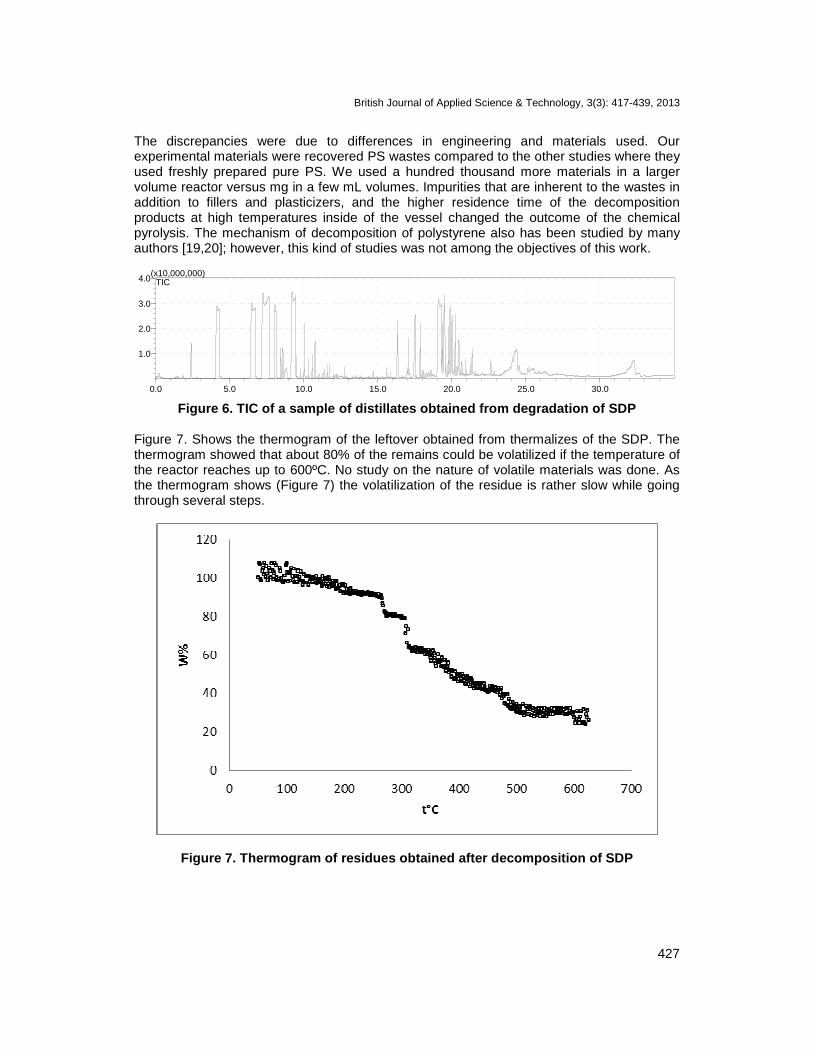
Thermal stabilities of two kinds of SPFB, one physically soft and the other hard were tested. As Figure 5 shows both kinds had very similar thermal stability as was the expectation since the main ingredient of both foams was polystyrene. The highest decomposition rates were observed at temperatures of 418ºC and 423ºC for soft and hard foams respectively. The differences in thermal properties were due to packing effects and nature of the fillers. No leftover residue was observed. The thermal stability of the SPBF was lower than SDP. The SDP’s decomposition-vaporization began around 400ºC then at 440ºC the highest weight loss rate was observed. The decomposition process stopped at 462ºC where the leftover was about 1% of total mass of SDP. Thermal stability of the CPB was higher than SDP. The weight loss began around 482ºC; the highest weight loss rate was observed at 492ºC. The leftover was about 30% of total mass of CPB at 543ºC. Therefore, the thermal stability of household plastic increases in the following order: soft SPFB~ hard SPFB< SDP< < gray CPB. This behavior is due to the thermal stabilities of original constituents: PE is more thermally stable than PS. 3.2 Thermalizes of SDP As the TIC of SDP showed (Figure 6) there were over 350 chemicals in each sample. The chromatogram showed two types of abundances of chemicals: the more volatile which were eluted at RT < 12 min, were compounds with lower boiling points similar to gasoline and the other group eluted at RT > 16 min. These were compounds with higher boiling points similar to diesel fuel. The doublet of some peaks in the chromatogram resulted from super-saturation of the analytical column in the GC-MS system. Table 2 lists the 50 most abundant chemicals identified by the NIST-MS library. The most abundant compound resulting from pyrolysis was styrene (~10%) as expected. Other products were derivatives of styrene and vinyl derivatives (Table 2). Eight styrene isomers composed nearly 50% of the products. The results were not within expectations since the pyrolysis of pure polystyrene produced more than 90% styrene as reported by Williams and Williams [19] and Cooley and Williams [10].
426
British Journal of Applied Science & Technology, 3(3): 417-439, 2013
The discrepancies were due to differences in engineering and materials used. Our experimental materials were recovered PS wastes compared to the other studies where they used freshly prepared pure PS. We used a hundred thousand more materials in a larger volume reactor versus mg in a few mL volumes. Impurities that are inherent to the wastes in addition to fillers and plasticizers, and the higher residence time of the decomposition products at high temperatures inside of the vessel changed the outcome of the chemical pyrolysis. The mechanism of decomposition of polystyrene also has been studied by many authors [19,20]; however, this kind of studies was not among the objectives of this work.
0.0 5.0 10.0 15.0 20.0 25.0 30.0
1.0
2.0
3.0
4.0(x10,000,000)
TIC
Figure 6. TIC of a sample of distillates obtained from degradation of SDP
Figure 7. Shows the thermogram of the leftover obtained from thermalizes of the SDP. The thermogram showed that about 80% of the remains could be volatilized if the temperature of the reactor reaches up to 600ºC. No study on the nature of volatile materials was done. As the thermogram shows (Figure 7) the volatilization of the residue is rather slow while going through several steps.
Figure 7. Thermogram of residues obtained after decomposition of SDP
427

British Journal of Applied Science & Technology, 3(3): 417-439, 2013
Table 2. 50 major chemicals outcome of the SDP pyrolysis
No Component name Formula RT (Min)
Start T (Min)
End T (Min)
Area%
1 Benzene C6H6 2.40 2.36 3.08 0.45 2 Toluene C7H8 4.14 4.00 4.22 4.14 3 Benzylcyclopentane C12H16 4.25 4.22 4.27 1.38 4 1,5-Hexadien-3-yne, 2-methyl-, C7H8 4.32 4.27 6.30 1.92 5 Benzene, 1,3-dimethyl-, C8H10 6.50 6.36 6.60 5.23 6 Cyclopentene,1-ethenyl-3-methylene- C8H10 6.74 6.60 7.09 4.04 7 1,3,5,7-Cyclooctatetraene, C8H8 7.24 7.09 7.37 6.36 8 Styrene C8H8 7.67 7.37 7.78 9.87 9 Benzene, (1-methylethyl)-, C9H12 8.07 7.98 8.38 3.48 10 Benzene, 2-propenyl-, C9H10 8.45 8.38 8.55 0.41 11 Benzene, propyl- , C9H12 8.60 8.55 8.68 0.44 12 Acetophenone , C8H8O 8.85 8.68 9.08 0.68 13 Benzene, 1-ethenyl-3-methyl- C9H10 9.22 9.08 9.31 5.22 14 alpha.-Methylstyrene, C9H10 9.46 9.31 9.48 5.13 15 Benzene, 1-ethenyl-2-methyl- C9H10 9.51 9.48 9.73 0.19 16 Benzene, 1-ethenyl-4-methyl-, C9H10 10.05 9.99 10.12 0.84 17 Benzene, 3-butenyl-, C10H12 10.34 10.29 10.52 0.24 18 Benzene, (1-methylenepropyl)- C10H12 10.59 10.52 10.64 0.37 19 Acetophenone C8H8O 10.76 10.70 10.82 0.55 20 Benzene, 2-butenyl- C10H12 11.59 11.50 11.65 0.15 21 Benzene, (1-methyl-1-propenyl)-, (E), C10H12 11.74 11.71 11.78 0.14 22 Naphthalene C10H8 12.76 12.70 12.80 0.14 23 Diphenylmethane C13H12 16.35 16.25 16.39 1.20 24 Benzene, 1,1'-ethylidenebis-, C14H14 17.08 17.02 17.11 0.57 25 Sulfoxide, methyl phenethyl, C9H12OS 17.52 17.32 17.56 1.95 26 Benzene, 1,1'-(1-methyl-1,2-
ethanediyl)bis, C15H16 17.88 17.81 17.93 0.91
27 Benzene, 1,1'-(1,3-propanediyl)bis-, C15H16 19.09 18.98 19.20 5.46 28 1-Propanone, 1-phenyl-3-, C22H20O2 19.22 19.20 19.23 0.96 29 Benzene, 1,1'-(1,3-propanediyl)bis-, C15H16 19.29 19.23 19.33 2.31 30 1,2-Diphenylcyclopropane, C15H14 19.36 19.33 19.38 0.61 31 Benzene, 1,1'-(1-methyl-1,3-
propanediyl)bis, C16H18 19.50 19.38 19.57 3.13
32 1,3-Bis(4-methylphenyl)propane C17H20 19.59 19.57 19.69 0.19 33 Benzene, 1,1'-(1,2-ethenediyl)bis-,
(Z)-, C14H12 19.77 19.69 19.82 0.90
34 Ethanedioic acid, mono(phenylmethyl) ester,
C9H8O4 19.90 19.82 19.93 1.82
35 Benzene, 1,1'-cyclopropylidenebis- , C15H14 20.04 19.93 20.13 2.16 36 Benzene, 1,1'-(1,4-butanediyl)bis-, C16H18 20.24 20.18 20.31 0.99 37 Benzene, 1,1'-(1,1,2,2-tetramethyl-
1,2-ethanediyl)bis- , C18H22 20.34 20.31 20.38 0.16
38 Benzene, 1,1'-(3-methyl-1-propene-1,3-diyl)bis-,
C16H16 20.44 20.38 20.45 0.22
39 Benzene, 1,1'-(1,2-dimethyl-1,2-ethanediyl)bis-
C16H18 20.48 20.45 20.52 0.47
428

British Journal of Applied Science & Technology, 3(3): 417-439, 2013
Table 2 continues… 40 Benzene, 1,1'-(2-methyl-1-
propenylidene)bis-, 20.68 20.63 20.73 0.27
41 Benzene, 1,1'-(1,5-hexadiene-1,6-diyl)bis- ,
C18H18 20.91 20.87 20.95 0.24
42 Benzoic acid, (4-benzoyloxy-2-chlorophenyl)
C20H13ClO4
21.25 21.21 21.31 0.24
43 1H-Indene, 1-(phenylmethylene)- , 21.38 21.31 21.42 0.58 44 2-Phenylnaphthalene, C16H12 22.63 22.57 22.70 0.37 45 Heptadecane C17H36 23.94 23.78 23.99 0.76 46 Eicosane C20H42 24.09 23.99 24.14 0.93 47 Heneicosane C21H44 24.26 24.14 24.32 1.61 48 Tetracosane C24H50 24.39 24.32 24.47 1.33 49 9-Hexacosene C26H52 24.53 24.47 24.75 0.75 50 Octacosane C28H58 32.31 31.98 32.42 2.04
3.3 Foam - SPFB–Pyrolysis at Normal Heating Figure 8 shows the TIC of a sample of distillates obtained from degradation of SPFB. In this experiment, 70% of the foam was converted to liquid materials. The obtained liquid was a mixture of over 300 compounds based on TIC (Figure 8). In summary, five fine chemicals constituted more than 50% of the mixture. About 19% of the chemicals were styrene followed by p-toluene sulfonic acid phenyl ethyl ester being about 9%. It will be of more value if a mixture such as this is separated into fine chemicals before being used as fuel. Table 3 lists the name, retention time, area under chromatogram, and the percent abundances of the 50 highest chemicals in the liquid. About 20% residue after pyrolysis remained in the bottom of the flask at temperatures above 500°C; therefore, 10% of the SPFB were converted to noncondensing gases at room temperature. The futures of TIC in Figure 8 are similar to TIC in Figure 6 which was within expectations since the main ingredient of both wastes was PS.
0.0 5.0 10.0 15.0 20.0 25.0 30.0
1.0
2.0
3.0
(x10,000,000)TIC
Figure 8. TIC of a sample of distillates obtained from degradation of SPFB
429

British Journal of Applied Science & Technology, 3(3): 417-439, 2013
Table 3. 50 major chemicals identified in the liquid obtained by the pyrolysis of SPFB at medium heating rate
No Component Name Formula RT
(Min) Start T (Min)
End T (Min)
Area%
1 Formaldehyde CH2O 1.33 1.27 1.36 0.09 2 Benzene C6H6 2.39 2.36 3.94 0.49 3 Toluene C7H8 4.14 3.94 4.23 5.91 4 1,5-Hexadien-3-yne, 2-methyl- C7H8 4.27 4.23 6.36 1.57 5 Benzene, 1,3-dimethyl- C8H10 6.50 6.36 6.55 5.09 6 Cyclopentene, 1-ethenyl-3-
methylene- C8H10 6.64 6.55 7.06 7.30
7 1,3,5,7-Cyclooctatetraene C8H8 7.21 7.06 7.34 8.46 8 Styrene C8H8 7.80 7.34 7.86 18.85 9 Benzene, 2-butenyl- C10H12 7.89 7.86 8.03 0.14 10 Benzene, (1-methylethyl)- CvH12 8.12 8.03 8.42 2.60 11 Benzene, 2-propenyl- C9H10 8.47 8.42 8.54 0.60 12 Benzene, propyl- C9H12 8.62 8.54 8.68 0.36 13 Benzaldehyde C7H6O 8.75 8.68 8.77 0.56 14 Benzaldehyde C7H6O 8.84 8.77 8.97 1.55 15 .alpha.-Methylstyrene, C9H10 9.23 9.09 9.32 6.40 16 Benzene, 1-ethenyl-4-methyl- C9H10 9.34 9.32 9.36 1.67 17 Benzene, (1-methylethenyl)- C9H10 9.41 9.36 9.44 2.70 18 Benzene, 2-propenyl- C9H10 9.47 9.44 9.52 0.21 19 Benzene, 1-propenyl- C9H10 10.05 9.98 10.12 1.07 20 Benzeneacetaldehyde C8H8O 10.34 10.29 10.42 0.40 21 Benzene, (1-methylenepropyl)- C10H12 10.58 10.49 10.63 0.32 22 Acetophenone C10H12 10.77 10.69 10.82 0.77 23 Benzeneacetaldehyde, .alpha.-
methyl- C9H10O 11.37 11.32 11.43 0.12
24 Butyrolactone C4H6O2 11.59 11.53 11.64 0.14 25 Naphthalene C10H8 12.75 12.68 12.79 0.33 26 Tridecane C13H28 12.87 12.83 12.93 0.19 27 Diphenylmethane C13H12 16.31 16.25 16.36 0.34 28 Benzene, 1,1'-(1-methyl-1,2-
ethanediyl)bis- C15H16 17.38 17.33 17.42 0.17
29 Sulfoxide, methyl phenethyl C9H12OS 17.46 17.42 17.54 0.45 30 Ethylene, 1,1-diphenyl- C14H12 17.84 17.80 17.90 0.17 31 Benzene, 1,1'-(1,3-propanediyl)bis- C15H16 19.09 18.97 19.18 5.32 32 1,2-Diphenylcyclopropane C15H14 19.24 19.18 19.29 0.27 33 Benzene, 1,1'-(3-methyl-1-propene-
1,3-diyl)bis- C16H16 19.35 19.29 19.37 0.64
34 Benzene, 1,1'-(1-methyl-1,3-propanediyl)bis-
C16H18 19.41 19.37 19.44 0.94
35 Ethanedioic acid, mono(phenylmethyl) ester
C9H8O4 19.87 19.76 19.93 4.37
36 Benzeneacetic acid, .alpha.-methyl- C9H10O2 19.99 19.93 20.03 1.71 37 Benzene, 1,1'-(1,5-hexadiene-1,6-
diyl)bis- C18H18 20.19 20.16 20.23 0.24
38 Benzene, 1,1'-(2-methyl-1-propenylidene)bis-
C16H16 20.41 20.36 20.44 0.41
430

British Journal of Applied Science & Technology, 3(3): 417-439, 2013
Table 3 continues…. 39 Benzene, 1,1'-(1-butenylidene)bis- C16H16 20.69 20.62 20.72 0.90 40 Naphthalene, 3-benzyl-1,2-dihydro- C17H16 20.75 20.72 20.78 0.11 41 Benzene, 1,1'-(1,4-butanediyl)bis- C16H18 20.90 20.86 20.94 0.24 42 Ethanone, 2-(formyloxy)-1-phenyl- C9H8O3 21.23 21.19 21.29 0.22 43 p-Toluenesulfonic acid phenethyl
ester C15H16O3S 22.05 22.02 22.12 0.25
44 Furane, 2,5-diphenyl- 22.72 22.65 22.75 0.29 45 Eicosane C20H42 22.84 22.75 22.93 0.50 46 Pentadecane, 8-hexyl- C21H44 25.59 25.44 25.70 0.83 47 Heptadecane, 2,6,10,15-
tetramethyl- C21H44 25.79 25.70 25.80 0.42
48 Tricosane C23H48 25.83 25.80 25.92 0.59 49 Sulfoxide, benzyl methyl C8H10OS 33.12 32.83 33.23 0.97
3.4 Foam – SPFB – fast heating pyrolysis The TGA thermogram (Figure 5) showed SPFB had no leftover at temperatures over 450ºC with a heating rate of 10ºC/min. The researchers attempted to reproduce a decomposition procedure similar to TGA using a heating mantle and a large amount of SPFB. This experiment had the same feedstock as the previous one (section 3.3); however, the heating process was faster, the temperature of reactants was higher and stayed high until the end of the experiment. The liquid collected (Figure 3a) was dark red with small carbonized particles spinning in the liquid. The condensation of vapors started at 60ºC, similar to the previous case (section 3.3); however, in the fast-heating process the temperature of condensing vapors passed over 150ºC due to overheated vapors. Also, the color of the vapors resulting from decompositions of foams inside of the reactor was brown to black. In contrast to the medium heating experiment (section 3.3), the condensing vapor temperature did not rise above 130ºC and the vapors inside the flask were pale-yellow in color. Styrene and methyl-styrene produced was the result of PS chain break-down to the original constituents units as expected. A chemical reaction illustrated below better explains the results of pyrolysis:
[ ]n
+ + ....++ +
The products, other than styrene and styrene derivatives, mostly resulted from secondary reactions during the residence time of the vapors in the reactor, and some others resulted from decompositions of additives and impurities that are inherent to processed and waste materials. Table 4 provides a list of 50 major chemicals identified in the resulting liquid. Only 4.6% of the chemicals were identified as styrene. Therefore, overheating resulted in reducing the amount of styrene in the liquid produced. Lehmann and Brauer [1] studied the micro-decomposition of freshly prepared pure PS by inserting a few mg of PS directly into a pyrolysing chamber of a GC-MS system. The pyrolysis at temperatures around 825ºC to 1125ºC produced limited numbers of chemicals: styrene/ethyl-benzene, toluene, benzene, acetylene, ethylene and carbon dioxide. They achieved the maximal amount of styrene (84%) at a pyrolysis temperature of 725ºC. However, results were considerably different than the above report due to several factors.
431

British Journal of Applied Science & Technology, 3(3): 417-439, 2013
The temperature of the system was below 650ºC, the amount of materials was considerably higher, and the materials used were wastes, not pure freshly prepared PS. Also, the new GC-MS systems are more sensitive than the ones in 1960s. The pyrolysis chamber was quite larger (5 L compared to few mL). Consequently, the primary products were kept at the elevated temperature for a considerably longer time period, during which they underwent secondary relations.
Table 4. 50 major chemicals resulting from decomposition of SPFB (fast heating)
No Component Name Formula RT (Min)
Start T (Min)
End T (Min)
Area%
1 Toluene C7H8 4.172 4.042 5.642 3.21 2 o-Xylene C7H8 6.53 6.383 6.575 2.64 3 Ethylbenzene C8H10 6.634 6.575 7.092 2.68 4 Styrene C8H8 7.274 7.092 7.392 4.57 5 Indan, epoxide C8H8O 7.431 7.392 7.45 1.11 6 2-Methylbenzyl benzoate C15H14O2 7.579 7.45 7.592 2.77 7 Bicyclo[4.2.0]octa-1,3,5-triene, C8H8 7.729 7.592 7.767 3 8 Benzene, (1-methylethyl)- C9H12 8.088 8.017 8.167 0.96 9 Benzene 1-ethenyl-4-methyl- C9H10 8.466 8.392 8.542 0.32 10 Benzene propyl- C9H12 8.614 8.542 8.683 0.2 11 Benzaldehyde, C7H6O 8.81 8.683 9.092 0.99 12 .alpha.-Methylstyrene C9H10 9.249 9.092 9.317 2.72 13 Benzene (1-methylethenyl)- C9H10 9.352 9.317 9.4 0.85 14 Benzene 1-ethenyl-2-methyl- C9H10 10.047 9.975 10.13 0.52 15 Benzeneacetaldehyde C8H8O 10.349 10.3 10.42 0.31 16 Acetophenone C8H8O 10.773 10.708 10.99 0.29 17 Benzene 1 1'-(1 3-propanediyl)bis- C15H16 16.298 15.767 16.37 7.06 18 Benzene 1 1'-(1-methyl-1 3-
propanediyl)bis- C16H18 16.915 16.708 16.98 1.75
19 Bibenzyl C14H14 17.481 17.442 17.53 0.32 20 Unknown 17.873 17.583 17.95 4.37 21 Unknown 17.97 17.95 17.99 0.57 22 Benzene (1 3-dimethyl-3-butenyl)- C12H16 18.131 17.992 18.17 2.25 23 1 2-Diphenylcyclopropane C15H14 18.193 18.167 18.23 0.5 24 Benzene 1,1'-(1 4-butanediyl)bis- C16H18 18.478 18.383 18.53 0.7 25 Naphthalene, 1,2,3,4-tetrahydro-1-
phenyl- C16H16 18.784 18.708 18.82 0.47
26 Benzene 1 1'-(1 3-propanediyl)bis- C15H16 19.121 18.975 19.24 3.59 27 Benzene1'-(3-methyl-1-propene-1
3-diyl)bis- C16H16 19.297 19.242 19.34 0.69
28 Benzene 1 1'-(1-methyl-1 3-propanediyl)bis-
C16H18 19.472 19.342 19.5 1.39
29 Benzene 1 1'-(1-butene-1 4-diyl)bis- (Z)-
C16H16 19.649 19.583 19.68 0.59
30 Benzene 1-methyl-4-(4-methyl-4-pentenyl)-
C13H18 19.744 19.675 19.79 0.59
31 Unknown 19.933 19.792 20.02 3.04 32 3-Buten-1-one 1 4-diphenyl- C15H14O2 20.074 20.017 20.12 1.42 33 Unknown 20.177 20.117 20.22 0.63 34 Unknown 20.263 20.217 20.35 0.88
432

British Journal of Applied Science & Technology, 3(3): 417-439, 2013
Table 4 continues… 35 Benzene, 1 1'-(2-methyl-1-
propenylidene)bis- C16H16 20.472 20.408 20.54 0.88
36 Unknown 20.579 20.542 20.63 0.4 37 Benzene11'-(3-methyl-1-propene-
13-diyl)bis- C16H16 20.724 20.675 20.77 0.66
38 Benzene 1 1'-(1-butene-1 4-diyl)bis- (Z)-
C16H16 20.96 20.875 20.99 0.7
39 Hex-1-ene 2 5-diphenyl- C18H20 21.019 20.992 21.09 0.47 40 Unknown 21.229 21.15 21.25 0.58 41 beta-Phenylpropiophenone C15H14O 21.291 21.25 21.35 0.63 42 Unknown 21.383 21.35 21.44 0.55 43 Benzene 1 1'-(1 4-pentadiene-1 5-
diyl)bis- C17H16 22.021 21.9 22.06 0.66
44 Unknown 22.108 22.058 22.18 0.71 45 Naphthalene 3-benzyl-1,2-dihydro- C17H16 22.785 22.717 22.83 0.42 46 Unknown 32.953 32.5 32.97 1.82 47 Unknown 33.553 32.967 33.6 6.63 48 Tetrahydro-6-[phenylmethyl] -
tetrazine-3-thio C9H12N4S 33.676 33.6 33.69 1.16
49 Unknown 33.756 33.692 33.78 1.08 50 Unknown 33.882 33.775 33.97 1.95
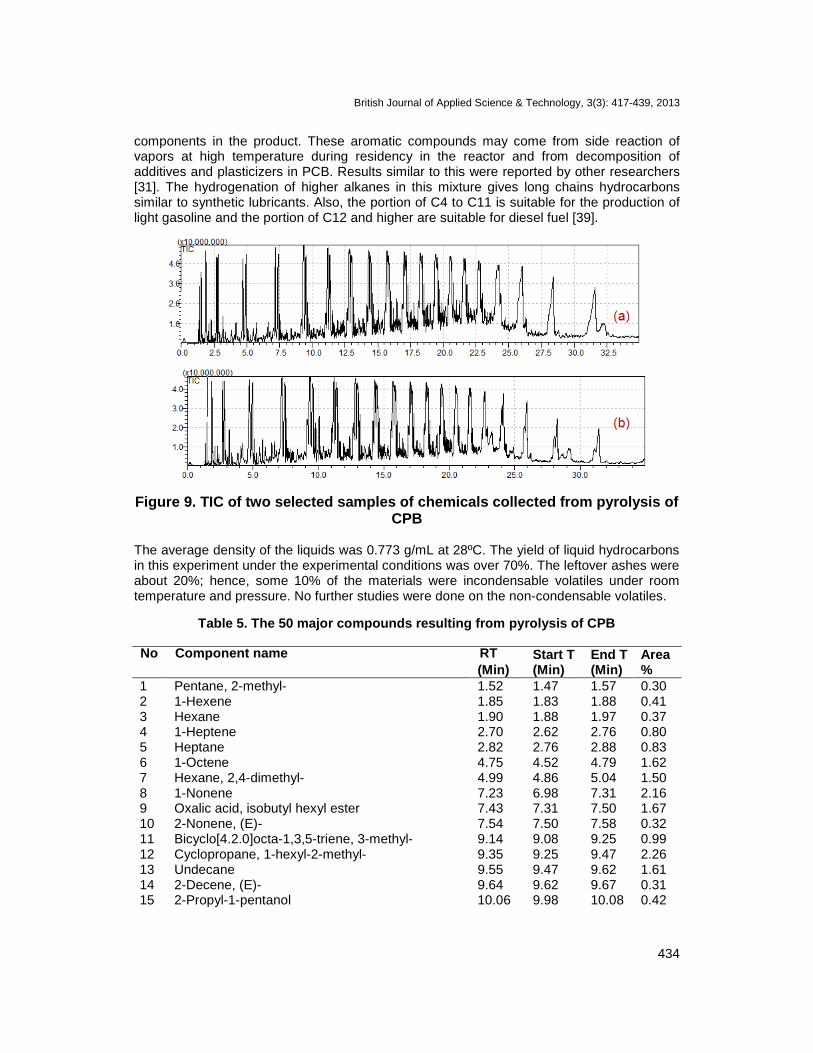
3.5 Carrying Plastic Bags (CPB) The CBP used here was a random mixture of many kinds of used bags. Nineteen samples were collected by air-cooling condenser; five of them were selected for GC-MS analysis based on the temperatures that they were collected. The TICs of these five samples were similar to each other; therefore, only one of them is shown here (Figure 9b). Sample (a) contained the chemicals that did not condense by the air cooling condenser, which was collected in a flask with a tap-water cooling condenser. Most of the signals of the chromatogram of sample (a) are similar to sample (b) which was collected from air condensing with the exception of a higher amount of chemical below a four minute retention time were observed in sample (a). The produced hydrocarbons covered a wide range of compounds from C4 to C24 consisting of alkene and alkane. The highest TIC picks (Figure 9 (a) and (b)) looked like gemials; the first was alkene and the peak immediately after it was the alkane with the same number of carbons. These hydrocarbons resulted from break down of the C-C bonds in poly(ethylene), PE, chains at random positions. The chemical reaction illustrated below could explain the break-down the PE chain, CH3(CH2)mCH3: CH3(CH2)mCH3 � CH3(CH2)(n-2)CH=CH2 +CH3(CH2)(n-1)CH3; where m is a large number, and 0 < n < 24 Where m is the number of carbons in the polymeric chains and n is the number of carbons in the pyrolysis products. Results similar to these have been reported by other researchers [14,38]. The similarities of chromatograms in Figures 9 (a) and (b) indicated that the differences in temperatures of condensing vapors were not related to the chemical nature of the vapors, but rather to overheated vapors coming out of the reactor. In addition to alkanes and alkenes, the GC-MS analysis (Table 5) showed a very small amount of aromatic
433
British Journal of Applied Science & Technology, 3(3): 417-439, 2013
components in the product. These aromatic compounds may come from side reaction of vapors at high temperature during residency in the reactor and from decomposition of additives and plasticizers in PCB. Results similar to this were reported by other researchers [31]. The hydrogenation of higher alkanes in this mixture gives long chains hydrocarbons similar to synthetic lubricants. Also, the portion of C4 to C11 is suitable for the production of light gasoline and the portion of C12 and higher are suitable for diesel fuel [39].
Figure 9. TIC of two selected samples of chemicals collected from pyrolysis of CPB
The average density of the liquids was 0.773 g/mL at 28ºC. The yield of liquid hydrocarbons in this experiment under the experimental conditions was over 70%. The leftover ashes were about 20%; hence, some 10% of the materials were incondensable volatiles under room temperature and pressure. No further studies were done on the non-condensable volatiles.
Table 5. The 50 major compounds resulting from pyrolysis of CPB
No Component name RT (Min)
Start T (Min)
End T (Min)
Area%
1 Pentane, 2-methyl- 1.52 1.47 1.57 0.30 2 1-Hexene 1.85 1.83 1.88 0.41 3 Hexane 1.90 1.88 1.97 0.37 4 1-Heptene 2.70 2.62 2.76 0.80 5 Heptane 2.82 2.76 2.88 0.83 6 1-Octene 4.75 4.52 4.79 1.62 7 Hexane, 2,4-dimethyl- 4.99 4.86 5.04 1.50 8 1-Nonene 7.23 6.98 7.31 2.16 9 Oxalic acid, isobutyl hexyl ester 7.43 7.31 7.50 1.67 10 2-Nonene, (E)- 7.54 7.50 7.58 0.32 11 Bicyclo[4.2.0]octa-1,3,5-triene, 3-methyl- 9.14 9.08 9.25 0.99 12 Cyclopropane, 1-hexyl-2-methyl- 9.35 9.25 9.47 2.26 13 Undecane 9.55 9.47 9.62 1.61 14 2-Decene, (E)- 9.64 9.62 9.67 0.31 15 2-Propyl-1-pentanol 10.06 9.98 10.08 0.42
434
British Journal of Applied Science & Technology, 3(3): 417-439, 2013
Table 5 continues…. 16 Cyclopropane, nonyl- 11.19 11.10 11.24 1.68 17 Cyclopropane, nonyl- 11.25 11.24 11.28 0.30 18 Undecane 11.35 11.28 11.44 1.82 19 2-Undecene, (E)- 11.46 11.44 11.48 0.28 20 Cyclopropane, nonyl- 12.82 12.74 12.91 1.81 21 Decane, 3,6-dimethyl- 12.97 12.91 13.03 1.38 22 Acetonitrile, amino- 13.06 13.03 13.12 0.55 23 7-Tetradecene, (Z)- 13.17 13.12 13.20 0.28 24 9-Octadecene, (E)- 14.32 14.24 14.39 1.71 25 Pentadecane 14.45 14.39 14.61 1.93 26 3-Tetradecene, (Z)- 14.64 14.61 14.67 0.25 27 1-Tetradecene 15.70 15.63 15.78 1.74 28 Hexadecane 15.82 15.78 15.98 1.82 29 1-Tetradecene 17.00 16.93 17.04 1.37 30 Borane, diethyl(decyloxy)- 17.11 17.04 17.24 2.06 31 5-Octadecene, (E)- 17.29 17.24 17.32 0.35 32 1,2-Octadecanediol 18.23 18.14 18.24 1.09 33 Cyclobutaneethanol, .beta.-methylene- 18.27 18.24 18.29 0.66 34 Borane, diethyl(decyloxy)- 18.32 18.29 18.39 1.24 35 Acetonitrile, amino- 18.40 18.39 18.43 0.29 36 Cyclotetracosane 19.39 19.31 19.40 0.98 37 Cyclobutaneethanol, .beta.-methylene- 19.42 19.40 19.44 0.53 38 Borane, diethyl(decyloxy)- 19.47 19.44 19.58 1.40 39 1,2-Octadecanediol 20.49 20.41 20.50 1.01 40 Cyclohexanecarboxylic acid, 4-formylphenyl
ester 20.51 20.50 20.54 0.54
41 Trisulfide, bis(1,1-dimethylethyl) 20.56 20.54 20.62 0.91 42 2-Propanesulfinic acid, 2-methyl-, methyl ester 20.63 20.62 20.71 0.53 43 Diazene, 1-cyclohexyl-2-ethoxy-, 1-oxide 21.55 21.45 21.58 1.32 44 Borane, diethyl(decyloxy)- 21.60 21.58 21.69 1.17 45 Diazene, 1-cyclohexyl-2-ethoxy-, 1-oxide 22.66 22.55 22.69 1.38 46 Trisulfide, bis(1,1-dimethylethyl) 22.73 22.69 22.82 1.34 47 Cyclopentane, 1-pentyl-2-propyl- 24.01 23.90 24.05 1.13 48 Heptadecane 24.16 24.05 24.26 1.65 49 Heneicosane 25.95 25.81 26.03 1.49 50 Heneicosane 28.26 28.11 28.30 1.02
4. SUMMARY Overall we analyzed the liquids collected from three different types of household wastes. Table 6 compares the pyrolysis results of these wastes. The nature of the liquids obtained depended on the engineering of the pyrolysis system and the nature of the original polymer used to fabricate the goods. PE derivative materials yielded basically straight hydrocarbon chains both saturated and unsaturated which resulted from chain scissoring of the PE polymeric chain. The liquids resulting from the wastes based on PS were a mixture of styrene, styrene derivatives, and materials that emerged from breakdown of the PS chain by pyrolysis. Also, we noted chemicals that were the results of secondary chemical reactions during the residential time of the gases in the reactor.
435

British Journal of Applied Science & Technology, 3(3): 417-439, 2013
Table 6. Comparison of pyrolysis of wastes
Com
mod
ity
Pol
ymer
t H
ighe
st
Dec
ompo
sitio
n R
ate
(°C
)
% L
iqui
d Y
iel
d
% S
tyre
ne
% S
olid
Yie
ld
Maj
or C
hem
ical
SDP PS 440 70 10 22 Aromatic hydrocarbons
SPFB (medium Heating)
PS 418 70 19 20 Aromatic hydrocarbons
SPFB (fast heating) PS 423 80 5 12 Aromatic hydrocarbons
CPB PE 498 70 - 20 Alkanes and alkenes
5. CONCLUSION AND REMARKS The nature, yields, and the chemical compositions of the liquids produced by pyrolysis of the waste plastics depended on the engineering of the process and the kind of waste being used. In general, the products of pyrolysis contained highly reactive chemicals such as vinyl, alkene, and three- and four-member cyclic hydrocarbons. These materials are not chemically stable which make the storage life of these liquids rather short. In a relatively short time they condensed back to polymers and precipitated as solid in the container at room temperature. Therefore, the products must be stabilized either by chemical stabilizers or hydrogenation for long time storage promptly after collection. Also, the liquids produced needed further refinements in order to be suitable for use as fuel or fine chemicals. The compositions of the remaining materials at the end of the process also depended on the kind of wastes that underwent pyrolysis. Liquid resulting from pyrolysis of CPB was a mixture of alkanes and alkenes up to 24 carbon chains. The hydrogenation of higher alkanes in this mixture produced long chains hydrocarbons similar to synthetic lubricants. Also, the portion of C4 to C11 was suitable for the production of light gasoline and the portion of C12 and higher was found to be suitable for diesel fuel. Pyrolysis of foams produced a mixture of more than 350 chemicals. The most abundant compounds were styrene, styrene derivatives and their isomers, vinyl compounds and other highly reactive substances. This mixture was polymerized while it was stored in the dark for two months at room temperature in the lab. Refinement of these materials resulted in styrene and its derivatives that are valuable fine chemicals. There was inconsistency between the thermogravimetric results and the pyrolysis outcome. The thermogram (Figure 5) showed no-leftover of pyrolysis for styrene derivative materials. The published studies showed that non-catalytic pyrolysis of pure polystyrene yielded more than 90% styrene with no-remains. However, the actual pyrolysis reported here had a 70-80% yield of liquids with max 20% styrene and more than 20% leftover. These discrepancies were explained based on the nature of the reactant materials and the engineering of
436

British Journal of Applied Science & Technology, 3(3): 417-439, 2013
pyrolysis reactors. Table 6 compares the pyrolysis process of the three kinds of wastes we studied. ACKNOWLEDGEMENTS Many thank to 1890-Research Project SCX-311-15-12 at South Carolina State University for financial support, and the Department of Biological and Physical Sciences for laboratory space and research materials, and to Mrs. Pamela Laursen for proofreading. COMPETING INTERESTS Authors have declared that no competing interests exist. REFERENCES 1. Lehmann FA, Brauer GM. Analysis of pyrolyzates of polystyrene and poly(methyl
methacrylate) by gas chromatography. Analyatical Chemistry. 1961;33(6):679-676. 2. Gargallo L, Hamidi N, Radic D, Tagles LH. Thermogravimetric analysis of
poly(dialkylphenyl methacrylate)s, Thermochimica Acta. 1989;143:75-84. 3. Gumula T, Paluszkiewicz C, lazewicz S. Study on thermal decomposition processes of
polysiloxane polymers—from polymer to nanosized silicon carbide. Journal of Analytical and Applied Pyrolysis. 2009;86(2):375–380.
4. Insura N, Onwudili JA, Williams PT. Catalytic pyrolysis of low-density polyethylene over alumina-supported noble metal catalysts. Energy & Fuels. 2010;24(8):4231-4240.
5. Faravelli T, Bozzano G, Colombo M, Ranzi E, Dente M. Kinetic modeling of the thermal degradation of polyethylene and polystyrene mixtures. Journal of Analytical and Applied Pyrolysis. 2003;70(2):761–777.
6. Koo JK, Kim SW, Reaction Kinetic model for optimal pyrolysis of plastic waste mixtures. Management & Research. 1993;11(6):515-529.
7. Costa P, Pinto F, Ramos AM, Gulyurtlu I, Cabrita I, Bernardo, MS. Study of the pyrolysis kinetics of a mixture of polyethylene, polypropylene, and polystyrene. Energy & Fuels. 2010;24(12):6239-47.
8. Smolders K, Baeyens J. Thermal degradation of PMMA in fluidized beds. Waste Management. 2004;24(8):849-57.
9. Straus S, Madorsky SL. Pyrolysis of styrene, acrylate, and isoprene polymers in a vacuum. Journal of Research of the Notional Bureau of Standards. 1953;50(3):2405.
10. Cooley J H, Williams RV. The pyrolysis of polystyrene. Chem. Educator. (Year) 8, 309-311.
11. Huggett C, Levin BC. Toxicity of the Pyrolysis and combustion products of poly (vinyl chlorides): a literature assessment. Fire and Materials, 1987;II:131-142.
12. Miranda R, Pakdel H, Roy C, Vasile C. Vacuum pyrolysis of commingled plastics containing PVC II. Product analysis. Polymer Degradation and Stability. 2001;73(1):47-67.
13. Lee KH. Pyrolysis of waste polystyrene and high-density polyethylene. Korea Institute of Energy Research. South Korea. 2011.
14. Achilias DS, Roupakias C, Megalokonomos P, Lappas AA, Antonakou ΕV. Chemical recycling of plastic wastes made from polyethylene (LDPE and HDPE) and polypropylene (PP). Journal of Hazardous Materials. 2007;149(3):536-42.
15. Mastellone ML, Arena U. Bed Defluidisation during the fluidised bed pyrolysis of plastic waste mixtures. Polymer Degradation and Stability. 2004;85(3):1051-58.
437
007
Rectangle
007
Rectangle
007
Rectangle
British Journal of Applied Science & Technology, 3(3): 417-439, 2013
17. Environmental Protection Agency (EPA), (2010). Cycling: Frequent Questions. Retrieved July 2012, from http://www.epa.gov/epawaste/conserve/materials/ecycling/faq.htm and; http://www.epa.gov/epawaste/conserve/materials/plastics.htm.
18. Sarker M, Rashid MM, Rahman R, Molla M. Conversion of low density polyethylene (LDPE) and polypropylene (PP) waste plastics into liquid fuel using thermal tracking process. British Journal of Environment & Climate Change. 2012;2(1):1-11.
19. Williams EA, Williams PT. Analysis of products derived from the fast pyrolysis of plastic waste. Journal of Analytical and Applied Pyrolysis. 1997;40-41:347-363.
20. Williams PT, Williams EA. Fluidised bed pyrolysis of low density polyethylene to produce petrochemical feedstock. J of Analytical and Applied Pyrolysis. 1999;51(1):107–26.
21. Lee KH. Thermal degradation of heavy pyrolytic oil in a batch and continuous reaction system. J of Analytical and Applied Pyrolysis. 86(2):348–353.
22. Kaminsky W, Predel M, Sadiki A. Feedstock Recycling of Polymers by Pyrolysis in a Fluidised Bed. Polymer Degradation and Stability, 2004;85(3):1045-50.
23. Schmidt H, Kaminsky W. Pyrolysis of oil sludge in a fluidised bed reactor. Chemosphere 2001;45(3):285-290.
24. For examples look at Envion (http://www.envion.com) or Agilyx (http://green.blogs.nytimes. com/tag/diesel) or Polymer Energy® (http://www.polymerenergy.com/technology) Accessed May 2012.
25. 4R Sustainability, Inc., Conversion Technology: A Complement to Plastic Recycling, Portland, OR 97203; 2011.
26. Pinto F, Costa P, Gulyurtlu I, Cabrita I. Pyrolysis of plastic wastes. 1. Effect of plastic waste composition on product yield. Journal of Analytical and Applied Pyrolysis, 1999;51(1):39-55.
27. Bushnell K. Plastic bags: what about recycling them? The Sierra Club. 2012; Retrieved June 2010 from http://www.sierraclub.org/sustainable_consumption/articles/bags2.asp.
28. Schuler K. Smart plastic guide healthier food uses of plastics. Institute for Agriculture and Trade Policy, Food and Health Program; 2008.
29. U.S. Department of Commerce, National Oceanic and Atmospheric Administration, Office of Public and Constituent Affairs, (1999) “Turning to the sea: america’s ocean future;” United Nations Environment Programme (1995) “Global programme of action for the protection of the marine environment from land-based activities.” Note by the secretariat. UNEP (OCA) /LBA/IG. Available: http://www.resources.ca.gov/copc/docs/0811copc_03_ocean_litter_strategy.pdf
30. Onwudili JA, Insura N, Williams PT. Composition of products from the pyrolysis of polyethylene and polystyrene in a closed batch reactor: Effects of temperature and residence time. Journal of Analytical and Applied Pyrolysis. 2009;86(2):293-303.
31. Koo JK, Kim SW, Seo YH. Characterization of aromatic hydrocarbon formation from pyrolysis of polyethylene-polystyrene mixtures. Resources, Conservation & Recycling. 1991;5(4):365-382.
32. Brebu M, Ucar S, Vasile C, Yanik J. Co-pyrolysis of pine cone with synthetic polymers. Fuel. 2010;89(8):1911-18.
438
16. Plastic Waste Management Institute. Plastic Wastes: Resource Recovery and
Recycling in Japan. Tokyo; 1985.
007
Rectangle
007
Rectangle
007
Rectangle

British Journal of Applied Science & Technology, 3(3): 417-439, 2013
34. Caglar A, Aydinli A. Isothermal co-pyrolysis of hazelnut shell and ultra-high molecular weight polyethylene: the effect of temperature and composition on the amount of pyrolysis products. J of Analytical and Applied Pyrolysis. 2009;86(2):304–309.
35. Behzadi S, Farid M. Feedstock recycling and pyrolysis of waste plastics: converting waste plastics into diesel and other fuels. Edited by J. Scheirs and W. Kaminsky, John Wiley & Sons, Ltd ISBN: 0-470-02152-7;2006;P531.
36. Bandyopadhyay A, Basak GC. Studies on photocatalytic degradation of polystyrene, Materials Science & Technology. 2007;23(3):307-314.
37. Friend D. Conserving natural resources in illinois. University of Illinois extension, College of Agricultural, Consumer and Environmental Sciences; 2005.
38. Bagri R, Williams PT. Catalytic pyrolysis of polyethylene. J of Analytical and Applied Pyrolysisvol. 2002;63(1):29-41.
39. Andras A, Norbert M, Laszlo B. Petrochemical feedstock by thermal cracking of plastic waste. Journal of Analytical and Applied Pyrolysisvol. 2007;79:409-414.
_________________________________________________________________________ © 2013 Hamidi et al.; This is an Open Access article distributed under the terms of the Creative Commons Attribution License (http://creativecommons.org/licenses/by/3.0), which permits unrestricted use, distribution, and reproduction in any medium, provided the original work is properly cited.
Peer-review history: The peer review history for this paper can be accessed here:
http://www.sciencedomain.org/review-history.php?iid=210&id=5&aid=1111
439
33. Buah WK, Cunliffe AM, Williams PT. Characterization of products from the pyrolysis of
municipal solid waste. Process Safety and Environmental Protection. 2007;85(5):450-57.
007
Rectangle