Pygmalion's Long Shadow - COnnecting REpositories · But no one should fall victim to the illusion...
350
Transcript of Pygmalion's Long Shadow - COnnecting REpositories · But no one should fall victim to the illusion...
Pygmalion's Long Shadow
Determinants and Outcomes of Teachers' Evaluations
Inauguraldissertation
zur
Erlangung des Doktorgrades
der
Wirtschafts- und Sozialwissenschaftlichen Fakultät
der
Universität zu Köln
2012
vorgelegt
von
Dominik Becker, M.A.
aus
Köln

Referent: Prof. Dr. Heiner Meulemann
Korreferent: Prof. Dr. Rolf Becker
Tag der Promotion: 14.12.2012
Preface
The volume at hand comprises four papers � preceded by a comprehensive introduc-tion � that are intended to obtain the doctoral degree to be awarded by the Faculty ofManagement, Economics and Social Sciences of the University of Cologne. This prefaceaims to clarify the publication status of the four papers.
The �rst paper, Teachers' Evaluations and the Social Situation in the Classroom (co-authored by Klaus Birkelbach) was submitted to Sociology of Education.
An earlier version of the second paper, Intelligence and Academic Achievement as
Contextual-Level Predictors of Teachers' Evaluations: Big-Fish-Little-Pond or Re�ected-
Glory E�ect? (co-authored by Klaus Birkelbach) appeared as a book chapter (Intelligenzund Schulleistung als Kontextmerkmale: Big-Fish- Little-Pond- oder Re�ected-Glory-
E�ekt? Eine Mehrebenen- analyse von Lehrerurteilen) in Komparative Sozialforschung
(ed. by T. Beckers, K. Birkelbach, J. Hagenah and U. Rosar; Wiesbaden 2010: Springer).Although the contributions to that edited volume have already been peer-reviewed, thepaper at hand extends its German predecessor both theoretically and empirically.
An earlier draft of the third paper was accepted for presentation as a full conferencepaper at both the conference �Higher education and beyond � Inequalities regardingentrance to higher education and educational credentials�, July 5-9, 2010, Monte Verita,and at a RC04 (Research Committee of the International Sociological Association onSociology of Education) poster session at the XVII ISA World Congress of Sociology,July 11-17, 2010, Gothenburg. A revised version was recently accepted at Rationalityand Society. Comments by two anonymous referees of that journal are already consideredin the version at hand.
The fourth paper, Does the E�ect of Teachers' Expectations on Students' Educational
Opportunities Decrease over Educational transitions? A Statistical Matching Approach,was accepted for presentation as a full conference paper both at the RC28 (ResearchCommittee of the International Sociological Association on Social Strati�cation andMobility) Spring Meeting, April 13-16, 2011, Essex, and at the fourth Conference of theEuropean Survey Research Association (ESRA), July 18-22, 2011, Lausanne. Commentsby participants of both conferences as well as of two anonymous ESRA reviewers havebeen considered.
In both co-authored papers, I am �rst and corresponding author.
i

Acknowledgements First and foremost, I am grateful to my co-author and mentorat the Cologne Graduate School in Management, Economics and Social Sciences, KlausBirkelbach, to my two supervisors Heiner Meulemann and Rolf Becker, and to my col-leagues Wiebke Breustedt, Pascal Siegers and Christina Zuber for their outstandingacademic inspiration and support.And �nally, I would like to thank all members of the Cologne Graduate School in
Management, Economics and Social Sciences, all members of the SOCLIFE graduateschool, all participants in the colloquium of the Chair of Sociology of the Universityof Cologne, and all participants and reviewers of the above-mentioned conferences andjournals for their valuable comments on earlier versions of the papers.
Cologne, August 2013
ii
Table of Contents
I Introduction: Causes and E�ects of Teachers' Evaluations: A Theoretical Primer.
(pp. 1-110)
II Paper 1: Teachers' Evaluation and the De�nition of the Social Situation in The
Classroom.
(pp. 111-148)
III Paper 2: Intelligence and Academic Achievement as Contextual-Level Predictors of
Teachers' Evaluations: Big-Fish-Little-Pond or Re�ected-Glory E�ect?
(pp. 149-213)
IV Paper 3: The Impact of Teachers' Expectations on Students' Educational Opportu-
nities in the Life Course.
(pp. 215-267)
V Paper 4: Does the E�ect of Teachers' Expectations on Students' Educational Oppor-
tunities Decrease over Educational Transitions? A Statistical Matching Approach.
(pp. 269-333)
Appendix: Curriculum Vitae
iii

I. Causes and E�ects of Teachers'
Evaluations: A Theoretical Primer
1 Introduction
�This theory design pushes the presentation to unusually high levels of abstraction.Our �ight must take place above the clouds, and we must reckon with a rather thick cloudcover. We must rely on our instruments. Occasionally, we may catch glimpses below ofa land with roads, towns, rivers, and coastlines that remind us of something familiar, orglimpses of a larger stretch of landscape with the extinct volcanoes of Marxism. But noone should fall victim to the illusion that these few points of reference are su�cient toguide our �ight� (Luhmann, 1995 [1984], foreword to the German edition, p. l).
Since more than half a century, and in both public debates and scienti�c discourses,the idea of meritocracy (Young, 1958) more or less serves as a benchmark according towhich an educational system's justice and e�ectiveness were to be judged. However,since several decades, educational sociology unveils both theoretically and empiricallythat educational systems are neither perfectly fair (Coleman, 1966; Jencks, 1972; Bloss-feld and Shavit, 1993), nor the idea of meritocracy is incontestable regarding its moralimplications (Bell, 1972; Goldthorpe, 1996b; Solga, 2005; Becker and Hadjar, 2011).While in the beginning of educational sociology, inequalities in educational opportu-
nities (IEO) were typically explained by the postulate that the value of education perse varies by social strata (Hyman, 1953), more recent (and also more parsimonious)theoretical accounts discard this demanding hypothesis in favor of only assuming theunderlying cost-bene�t considerations of an educational transition decision to be class-variant � while parents' appraisement of education per se (i.e. in an absolute ratherthan in a relative sense) could remain constant (Keller and Zavalloni, 1964; Boudon,1974; Meulemann, 1979; Goldthorpe, 1996a; Erikson and Jonsson, 1996a; Breen andGoldthorpe, 1997; Esser, 1999).On the other hand, Wisconsin status attainment theorists (Sewell et al., 1969, 1970)
have already brought up students' signi�cant others as an important variable a�ectingtheir educational outcomes including their aspirations (also see Morgan, 2006). Oneprominent example of these signi�cant others are teachers whose expectations wereshown to a�ect both student academic self-concept and achievement in various Pyg-malion and self-ful�lling prophecy studies (Rosenthal and Jacobson, 1968; Raudenbush,1984; Jussim, 1986; Madon et al., 1997; Jussim and Harber, 2005).
1
1 Introduction
Yet, Wisconsin status attainment theorists have been seriously criticized for confound-ing the correlations obtained in their path models with causality (Freedman, 1987; Hed-ström and Swedberg, 1996; Hedström, 2005; Hedström and Ylikoski, 2010). Furthermore,I see still need for a more thorough theoretical speci�cation concerning the generativeprocesses (Goldthorpe, 2001) of teacher expectancy e�ects. This is the gap I intend toclose with the volume at hand in general, and by means of its introduction in particular.This volume comprises two papers analyzing the predictors of teachers' evaluations,
and another two with the latter's outcomes as the crucial objective. Concretely, in thedata at hand (the Cologne High School Panel), teachers had been asked whom of their10th class students they consider to be able to start academic studies, and whom ofthem not. The �rst paper models these evaluations as an outcome of students' cognitiveability in terms of intelligence scores, their average grades, their parents' social class,and their aspirations. Using structural equation modeling as the method of analysis, thepaper's proximity to the Wisconsin status attainment tradition and thus the need for asolid theoretical foundation is evident.The second paper adds another level of analysis by investigating to what extent teach-
ers' evaluations depend on reference-group e�ects in the classroom. While the techniquesof multilevel analysis provide a sophisticated statistical framework for testing contextual-level hypotheses (Bryk and Raudenbush, 1992; Snijders and Bosker, 1999; Gelman andHill, 2007; Hox, 2010), multilevel theory was quite prominent in the early 1970s, thenslowly abated until entirely stagnating since the early 1990s (Hauser, 1970a; Barton,1970; Hauser, 1970b; Farkas, 1974; Hauser, 1974; Blalock, 1984; Van den Eeden, 1992).Therefore, I aim to discuss how these theoretical consideration can be connected tocontemporary reference-group e�ect research on teachers' evaluations.The third paper asks how self-ful�lling prophecy e�ects of teachers' expectations �
measured by their evaluations � relate to cost-bene�t-based theories about social in-equality in educational opportunities. As mentioned above, in my view, self-ful�llingprophecy research still stands in the duty of a more �ne-grained speci�cation of how theimplied teacher treatment e�ect can be assumed to a�ect student achievement. Below,I will argue that this e�ect should be understood as operating via students' subjectiveexpected probability of educational success, as it is referred to in IEO research (Breen andGoldthorpe, 1997; Esser, 1999).And �nally, the fourth paper analyzes to what extent the above self-ful�lling prophecy
e�ect might vary over a sequence of educational transitions. More precisely, this questioncondenses to the problem of how students' beliefs in terms of their subjective expectedprobability of educational success change via a mechanism of Bayesian updating con-ditional on having successfully passed a preceding transition (Breen, 1999; Breen andGarcía-Peñalosa, 2002).While the title of this volume merely addresses the Determinants and Outcomes of
Teachers' Evaluations, in this introduction, I intend to get closer to the underlyingcauses and e�ects. The theoretical framework whereby this should be accomplished isthe one of social mechanisms (Elster, 1985, 1989; Hedström and Swedberg, 1996, 1998b;Gambetta, 1998; Hedström, 2005). The crucial objective of this theoretical accountis to get close to an understanding explanation in the Weberian sense by opening the
2
I. Causes and E�ects of Teachers' Evaluations: A Theoretical Primer
black box and showing the cogs and wheels of the machinery (Elster, 1985, 1989). It isargued that both the covering-law tradition (Hempel, 1942; Hempel and Oppenheim,1948; Hempel, 1965; see Opp, 2005b for a still prominent textbook example) and whathas been referred to as variable sociology (Esser, 1999) or as the robust dependencetradition (Goldthorpe, 2001) in sociology fall behind this demand: �rst, by overhastypostulating the existence of general laws in the social sciences without trying to under-stand actors' motives, beliefs and means; and second, by confounding correlations withcausality without providing a su�cient theoretical justi�cation for the implied causalstructure. In contrast, mechanism-based explanations build on what Popper (1945a,1994) called the analysis of actors' social situation, i.e., the reconstruction of both ac-tors' external restrictions and their motives and beliefs by means of a suitable theory ofaction. As I will argue below, there is a surprisingly consistent line of reasoning fromWeber's demand for an understanding explanation (and his concept of Richtigkeits-rationalität) over Popper's situational logic combined with its rationality principle onto contemporary mechanism-based explanations distinguishing between desire-mediated,belief-mediated, and opportunity-mediated social mechanisms (Hedström and Swedberg,1996, 1998b; Hedström, 2005; Hedström and Ylikoski, 2010). These latter dimensionscan also be used as a starting point for a comparatively weak rational action theory.Hence, this introductory chapter provides a theoretical foundation of the underlying
social mechanisms regarding both IEO research and the determinants and outcomes ofteachers' evaluations analyzed in the four papers of the volume at hand. I will argue thatfollowing the Keller and Zavalloni (1964) and Boudon (1974) tradition of discarding theassumption of a class-dependent absolute value of education, di�erences in educationalaspirations due to di�erences in cost-bene�t considerations can mainly be accounted forby belief-mediated mechanisms. The same holds for both teachers' action scripts thatshape their evaluations (cf. paper 1) and teacher expectancy e�ects (in sense of a self-ful�lling prophecy) that a�ect students' subjective expected probability of educationalsuccess (cf. papers 3 and 4). In case of reference-group e�ects on teachers' evaluations,supplemental opportunity-mediated mechanisms will come into play (cf. paper 2).The remainder of this introduction will be structured as follows:In section 2, I will begin with Max Weber's well-known de�nition of sociology in order
to use it for a more profound elaboration on the debate on the consecutive prevalence ofeither Erklären (explanation) or Verstehen (understanding) as the methodological prin-ciple in the �eld which is denoted as humanities today. After that, I will outline how thisdebate connects to the concept of social mechanisms (Elster, 1985, 1989; Hedström andSwedberg, 1996, 1998a; Hedström, 2005; Hedström and Ylikoski, 2010, but also see Opp,2005a) that tries to bridge the gap between Erklären and Verstehen by the use of middle-range theories (Merton, 1957; also see Boudon, 1991). It is shown that mechanism-basedexplanations do not fall behind the conceptual rigor of deductive-nomological explana-tions (Hempel, 1942; Hempel and Oppenheim, 1948) � but are superior to them inunderstanding actors' particular desires and beliefs (Hedström, 2005) in the context oftheir situational opportunities (ibid., also see Coleman, 1990, ch. 1; Esser, 1993a, ch.6).In section 3, I will use another statement by Max Weber about individuals' life chances
3
2 Historical and Analytical Foundations of Social Action Theory
as a starting point for �rst sketching the enduring debate about the demand for meri-tocracy in the educational system; and second, to relate that discourse to �ndings aboutinequalities in educational opportunities and the social mechanisms behind them. AsI will show, the latter elaborations cast a shadow on theoretical accounts that over-hasty defend the prevalence of 'merit' (in terms of achievement) over individuals' socialbackgrounds in explaining their actual life chances.In section 4, I will �rst provide a brief summary of the four papers at hand; and
second, I will reconstruct the underlying social mechanisms in all four studies while alsoreferring to the implied action-theoretical assumptions. Finally, the conclusion in section5 will o�er an outlook for all four papers in particular and for social sciences theory ingeneral.
2 Historical and Analytical Foundations of Social
Action Theory
At the beginning of his seminal monograph Economy and Society, Max Weber de�nessociology as follows:
Sociology (in the sense in which this highly ambiguous word is used here) isa science which attempts the interpretive understanding of social action in orderthereby to arrive at a causal explanation of its course and e�ects (Weber, 1964, p.88).
What is translated here as �interpretive understanding� and �causal explanation� is whatreads �deutend verstehen� and �ursächlich erklären� in the German original.1
By referring to both explanation and understanding as two equally important aimsof sociology, Weber bridges an important gap between two schools of thought that havebeen concurrent to each other since the 19th century. In the next subsection, I aim tosketch the historical conditions that set the stage for Max Weber's de�nition of sociology(and that might also account for the occasionally huge gap between quantitative andqualitative methodology in the social sciences; e.g. Adorno et al., 1976).
2.1 Historical Developments: �Erklären� vs. �Verstehen�
As natural sciences matured to becoming the dominant scienti�c discipline in the 19th
century, the humanistic studies had to deal with the issue that now an empiristicparadigm in favor of practices such as experiment and observation became the goldstandard of scienti�c methodology.2 Roughly speaking, this development divided hu-manities into two camps (von Wright, 1971, p. 3�.): one holding the view that the1�Soziologie soll heiÿen: eine Wissenschaft, welche soziales Handeln deutend verstehen und dadurch inseinem Ablauf und seinen Wirkungen ursächlich erklären will� (Weber, 1985, p. 1). Where possible,I will try to cite available English editions of the German classics, but in some cases � such as theone here �, additional quotations in German are inevitable, or an English edition was not available.
2�Positivism has gradually taken possession of the preliminary sciences of Physics and Biology, and inthese the old system no longer prevails� (Comte, 1865, p. 12).
4
I. Causes and E�ects of Teachers' Evaluations: A Theoretical Primer
methodological standard of exact natural sciences should also be applied to humanities� an approach referred to as positivism, � and another, genuinely anti-positivist standthat rejects positivists' methodological monism and advocates a contrast between natu-ral sciences and disciplines such as history (for which many of the following argumentswere developed; see Dilthey, 1927) that aim �to grasp the individual and unique featuresof their objects� (von Wright, 1971, p. 5) � usually denoted as hermeneutics.Historically, sociology was founded as a positivist discipline. Comte (1865) summarizes
the intention of positivist sociology as follows: �The primary object, then, of positivism istwofold: to generalize our scienti�c conceptions, and to systematize the art of social life�(p. 3). The latter can be understood as consisting of �Thoughts, Feelings, and Action�(p. 8)3, and in his emphasis on invariable laws that he assumes to underlie humanaction (p. 10), Comte already anticipates the deductive-nomological paradigm as it willbe later set up by Hempel (1942) and Hempel and Oppenheim (1948).4 Consequently,Comte denotes Sociology as a �physique sociale� (Comte, 1839, 46e Leçon) that shouldfollow the positivist principles developed by the natural sciences.5
However, as a reaction to the methodological adoption of positivism, the hermeneuticapproach engaged in postulating a methodological uniqueness of the humanities. As bothvon Wright (1971) and Apel (1979) note, Droysen (1857, p. 11) appears to be the �rstscholar using the dichotomy of Erklären vs. Verstehen: �Nach den Objekten und nachder Natur des menschlichen Denkens sind die drei möglichen wissenschaftlichen Meth-oden: die (philosophisch oder theologisch) spekulative, die mathematisch-physikalische,die historische. Ihr Wesen ist: zu erkennen, zu erklären, zu verstehen� (emphasis added).While the methodological trias proposed by Droysen is less known today, Dilthey's
dichotomy separating the Geisteswissenschaften from the natural sciences became moreprominent. It has been argued elsewhere (von Wright, 1971, p. 173; Apel, 1979, p. 17)that the term Geisteswissenschaften �rst � i.e. in the plural form � appeared in Jacob H.W. Schiel's translation of John Stuart Mill's term �moral sciences� in his System of Logic(Mill, 1843, 1863). Dilthey might have adopted it from this monograph, but also Hume(1913) has to be named in this context: Actually, he already uses the terms �moral phi-losophy�, �the science of human nature�, and �the moral sciences� (Hume, 1913, section I;section VII, part I) to refer to what is called Geisteswissenschaften today.6 Interestingly,and although Hume considers mathematics to be far more clear and determinate than themore ambigue moral sciences, he �nally arrives at the conclusion that �their advantagesand disadvantages nearly compensate each other� (ibid). This, of course, is an elemen-
3At this point, one could argue that Comte's emphasis on thoughts and feelings also anticipates the�rst two concepts of the Desires, Belifes, and Opportunities (DBO) action model by Hedström(2005) that will be described in more detail in section 2.2.
4�The importance that we attach to theories which teach the laws of phenomena, and give us the powerof prevision, is chie�y due to the fact that they alone can regulate our otherwise blind action uponthe world� (Comte, 1865, p. 11). I will come back to the particular epistemological importance ofthe term 'blind' in footnote 12.
5After Quetelet (1835, 21�.) used the term �physique sociale� to denote the statistical analysis ofsocial phenomena, Comte switched to the term �sociologie� (e.g. Comte, 1865, p. 27).
6Ayer (1952) notes that �the best part of John Stuart Mill's work consists in a development of theanalyses carried out by Hume� (p. 55).
5
2 Historical and Analytical Foundations of Social Action Theory
tary prerequisite for the Kantian uni�cation of empiricism and rationalism7, and it alsoanticipates Weber's later uni�cation of the Erklären and Verstehen camps. Before, how-ever, beginning with Dilthey's Einleitung in die Geisteswissenschaften (Dilthey, 1883,1984), the triumphant procession of the latter term as a self-reference of the Germanhumanities was unstoppable.Whereas the early Dilthey (1880 and earlier; see Dilthey, 1984) did not make use of
Droysen's (1957) distinction between explanation and understanding when already argu-ing against Comte's positivism, he later sharpens it even more: �We explain nature, butwe understand psychic life� (as cited in Makreel, 1992, p. 134; original (German) citationin Dilthey, 1924, p. 144), and �We explain through purely intellectual processes, but weunderstand through the cooperation of all our psychic powers� (as cited in Makreel, 1992,p. 134; original (German) citation in Dilthey, 1924, p. 172).8 With this distinction,Dilthey initiates a position that became dominant for the school of Neo-Kantianism inthe late 19th/early 20th century.9
Regarded in this context, it is indeed notable that Weber's de�nition of sociologyre-integrates both methodological paradigms again. In doing so, it comes close to therecent line of arguing of analytical sociology in terms of social mechanisms (see nextsubsection). Moreover, becoming aware of the fact that the state-of-the-art methodol-ogy for the next decade established to be one of (quite mechanistic; cf. Esser, 1996b;Machamer et al., 2000) universal laws (Hempel, 1942), it is even astonishing (see Apel,1979, p. 40 for a similar line of arguing).
In his essay On some categories of interpretative sociology, Weber (1922, 1981) speci-�es the demand for a synthesis of explanation and understanding more concretely. Onethe one hand, Weber clearly argues in favor of rationality as an interpretative and bythat means explanatory principle � being the response of sociology in a more and morerationalized world.10 But on the other hand, Weber explicitly stresses that �the 'under-standing' (Verstehen) of the context must always be veri�ed, as far as possible, withthe usual methods of causal attribution, before any interpretation, however plausible,becomes a valid 'intelligible explanation'� (Weber, 1981, p. 151). It is characteristicof such an 'intelligible explanation' that by relying on the principle of instrumentalrationality, even 'irrational' processes such as stock market panics can be explained ad-equately: In that case, the rational ideal type of action would serve as a benchmark
7In his Prolegomena to any future metaphysics, Kant acknowledges Hume for having interrupted hisown �dogmatic slumber� (Kant, 1902, Introduction).
8As Giuliani (2003, p. 10) has observed, Apel (1979, p. 18) erroneously attributes the �rst of the twoabove-quoted statements by Dilthey to his Einleitung in die Geisteswissenschaften (Dilthey, 1883)� where, however, the latter author does not elaborate on the dichotomy between explanation andunderstanding.
9The Neo-Kantians such as Rickert (1899, 1902) or Windelband (1894) on the one hand built onDilthey's distinction between explanation and understanding, but on the other hand, they rejectedhis psychologism, as they called it (Apel, 1979, p. 36). For a further discussion of Dilthey's relationto the Neo-Kantian tradition see Jalbert (2008) and �uber (2010).
10For a discussion of the notion of rationalization see Weber's chapter on bureaucracy in his Economyand Society (Weber, 1978, ch. XI.)
6
I. Causes and E�ects of Teachers' Evaluations: A Theoretical Primer
to determine what would have happened, had actors behaved rationally (p. 154).11 Itbecomes evident that for Weber, both concepts appear to be intertwined: �Sociologymust reject the assumption that 'understanding' (Verstehen) and causal 'explanation'have no relationship to one another� (p. 157). When Bourdieu (1988, p. 774f.) laterwrites, �Theory without empirical research is empty, empirical research without theoryis blind�12, then he advances an integrative view that suits both the Weberian de�nitionof sociology and the mechanism-based stream of research in analytical sociology. Butbefore I come to Hedström and his (and others') plea for (social) mechanisms (Elster,1998), I �rst aim to outline the still dominant (e.g. Opp, 2005b) theoretical frameworkagainst which Hedström and his coevals are arguing.
In 1942, Hempel published his seminal paper The function of general laws in history(Hempel, 1942). The main �punchline� of this article is the thesis that what has laterbeen called deductive-nomological explanations have to serve as a methodological prin-ciple for both the natural and the social sciences. His de�nition of such a general lawreads as follows:
�By a general law, we shall here understand a statement of universal conditionalform which is capable of being con�rmed or discon�rmed by suitable empirical�ndings. [...] In every case where an event of a speci�ed kind C occurs at a certainplace and time, an event of a speci�ed kind E will occur at a place and time whichis related in a speci�ed manner to the place and time of the occurrence of the �rstevent� (Hempel, 1942, p. 35).
Practically, that means that each explanation consists of a phenomenon to be explained� the explanandum �, a general law from which the conclusion can be derived, andthe actual initial conditions. Opp (2005a, p. 174) provides the following illustrativeexample:
Law : If political discontent and perceived personal in�uence are relativelyintense, the frequency of participation in demonstrations is high.Initial conditions : In October 1989 discontent and perceived in�uence of
the population of Leipzig increased.
Explanandum: The participation in the demonstrations in Leipzig in-creased in October 1989.
In deterministic explanations, the event will always occur once the initial conditionsare met and the general law holds. But in contrast to the natural sciences, such a view11I will come back to the prospects of counterfactual explanations in social sciences in the conclusion
section of this introduction (section 5).12This, of course, is borrowed by Kant's famous uni�cation of empiricism and rationalism: �Thoughts
without content are empty, intuitions without concepts are blind. It is, therefore, just as necessary tomake our concepts sensible, that is, to add the object to them in intuition, as to make our intuitionsintelligible, that is, to bring them under concepts� (Kant, 1850, p. 46). Note that already Hume(1913) used similar epistemological metaphors � while presumably both authors are in�uenced byPlato's Allegory of the Cave.
7
2 Historical and Analytical Foundations of Social Action Theory
evidently is too restrictive for the social sciences where general laws are usually notfound. Consequently, Hempel (1942) relaxes the assumption of general laws towards thetype of probability hypotheses (p. 41) � meaning that the prediction of an event can beasserted only with a high probability.Nonetheless, and in spite of this limitation, Hempel sticks to the claim that �general
laws have quite analogous functions in history and in the natural sciences� (Hempel,1942, p. 35), and that �history can 'grasp the unique individuality' of its objects ofstudy no more and no less than can physics or chemistry� (p. 37, orig. emph.).With this view, Hempel evidently opposes the paradigm of hermeneutics, but also falls
somewhat back behind Max Weber's early synthesis of an understanding explanation13
� especially when claiming together with his co-author, Paul Oppenheim:
�But the existence of empathy on the part of the scientist is neither a necessary
nor a su�cient condition for the explanation, or the scienti�c understanding, ofany human action. It is not necessary, for the behavior of psychotics or of peoplebelonging to a culture very di�erent from that of the scientist may sometimes beexplainable and predictable in terms of general principles even though the scien-tist who established or applied those principles may not be able to understandhis subjects emphatically. And empathy is not su�cient to guarantee a soundexplanation, for a strong feeling of empathy may exist even in cases where wecompletely misjudge a given personality� (Hempel and Oppenheim, 1948, p. 146,emph. added).
While for Weber, understanding is a necessary part of a scienti�c theory in order toreconstruct individual actors' motives, believes, and means (Balog, 2008, p. 79), thisview is clearly rejected by Hempel. Unfortunately, this 'raw' version of the covering-lawmodel still prevails in in�uential textbooks (e.g. Opp, 2005b).
The early Popper is not only more or less singing from the same hymn sheet as Hempeland Oppenheim � but even claims to be the originator of the above-described theory(Popper, 1945a, ch. 25, note 3). In his later writings, however, he only incidentallyrefers to the methodological unity of both human and natural sciences (cf. Böhm, 2008,p. 366; Riedel, 1978, p. 163). Even more, he appears to be quite skeptic about thereception of the deductive-nomological model (while still claiming ownership for it); andinstead, he sets the ground for later sociological theory by introducing a logic of thesituation that is connected to a rationality principle as the underlying theory of action:
�A voluminous literature, which in my opinion has contributed little to the prob-lem, has sprung from a mistaken criticism of my ideas on historical explanation. Insection 12 of Logik der Forschung I discussed what I called 'causal explanation', ordeductive explanation, a discussion which had been anticipated, without my beingaware of it, by J.S. Mill, though perhaps a bit vaguely (because of his lack of dis-tinction between an initial condition and a universal law) [...] I did not, however,
13Von Wright (1971, p. 7) describes Weber's approach in the following way: A �positivist coloring iscombined with an emphasis on teleology ('zweckrationales Handeln') and empathic understanding('verstehende Soziologie')�.
8
I. Causes and E�ects of Teachers' Evaluations: A Theoretical Primer
regard this particular analysis as especially important for historical explanation,and what I did regard as important needed some further years in which to ma-ture. It was the problem of rationality (or the 'rationality principle' or the 'zeromethod' or the 'logic of the situation'). But for years the unimportant thesis � ina misinterpreted form � has, under the same name 'the deductive model', helpedto generate a voluminous literature� (Popper, 1974, p. 117).14
The latter concepts that Popper here, interestingly, juxtaposes are already introducedin The Open Society and its Enemies wherein Popper (1945a, ch. 14) sketches a situ-ational logic which actually comes close to approaches by Coleman (1990) and Esser(1993a) � models well-known in theoretical sociology today. Similarly to the Neo-Kantians such as Rickert or Windelband (though Popper would surely be very unhappywith that comparison), he argues against psychologism that he contrasts with a logicof the situation that is, in turn, �the method of economic analysis� (Popper, 1945a, p.290). In his later writing The Rationality Principle (Popper, 1994 [�rst published inFrench 1967; also appeared as Popper, 1985]), the details of this approach are workedout more concretely. As Nadeau (1993, p. 450) points out, the logic of the situation isan explanatory scheme that is adequate for the social social sciences as is the deductive-nomological scheme for the natural sciences. Where in the latter �eld, a natural eventis explained by the coincidence of an initial condition and a general law, in the socialsciences, we have the explanandum of a social event-type that is explained by a scienti�cmodel or theory conditioning on the rationality principle. By the term 'zero method',Popper (1994) addresses that he does not claim that every actor at every time acts in arational way � but that she acts in a manner which is adequate to the social situation asshe herself sees it (which equals the subjective interpretation of the rationality principle;see Nadeau, 1993, p. 456). In The Poverty of Historicism III, Popper (1945b) writes:
�I refer to the possibility of adopting, in the social sciences, what may be calledthe method of logical or rational construction, or perhaps the 'zero method'. Bythis I mean the method of constructing a model on the assumption of completerationality (and perhaps also on the assumption of the complete possession of in-formation) on the part of all individuals concerned, and of estimating the deviationof the actual behavior of people from the model behavior, using the latter as a kindof zero co-ordinate� (Popper, 1945b, p. 82).
Since �in most, if not all, social situations there is an element of rationality� (ibid.), it ispossible to refer to a kind of ideal type of human behavior as the benchmark for sociolog-ical analysis. Note that this position remarkably resembles what already Weber (1922,1981) has put forward in his Gesammelte Aufsätze zur Wissenschaftslehre wherein heintroduces the concept of an �objectively correct rationality [Richtigkeitsrationalität ]�(Weber, 1981, p. 154) as an instrument in order to draw inferences about human be-havior. As mentioned, it distinguishes Weber from Hempel that the former refers to the
14Note, however, that already in the third part of his Poverty of Historicism (Popper, 1944a,b, 1945a),he wrote: �I do not intend to assert that there are no di�erences whatever between the methods ofthe theoretical natural and the social sciences; such di�erences clearly exist� (Popper, 1945b, p. 78).
9
2 Historical and Analytical Foundations of Social Action Theory
principle of rationality as an instrument to understand human action; and when Popperincorporates this approach, he approximates the methodology of social sciences again tothis endeavor.Koertge (1979) proposed how Popper's situational logic can be quasi-formalized in
analogy to Hempel's covering-law principle. While the latter takes the form (Hempel,1965, p. 471)
�A was in a situation of type C.A was a rational agent.In a situation of type C, any rational agent will do x.
Therefore, A did x �,
for Popper, she would propose something like
1. Description of the situation: Agent A was in a situation of type C.
2. Analysis of the situation: In a situation of type C, the appropriate thing to do isx.
3. Rationality principle: Agents always act appropriately to their situations.
4. Explanandum: (Therefore) A did x (Koertge, 1979, p. 87).
Comparing both statements, a striking di�erence is immediately evident: While Hempel(1965) speaks of a A as a rational agent, in the Popperian re-formulation as formal-ized by Koertge (1979), such a strong notion of rationality is replaced with A acting�appropriately� to her situation. This is not only coming close to Weber's notion ofRichtigkeitsrationalität again, but due to the broader concept of rationality, it is alsoin accordance with the well-known Thomas Theorem reading �If men de�ne situationsas real, they are real in their consequences� (Thomas and Thomas, 1928, p. 572) �meaning that it is the actor's subjective de�nition of the situation that will create socialreality.15 Note that Popper himself doesn't become tired of highlighting the demandfor an understanding of the actors' motives and beliefs � perhaps most pointed in hisrationality essay: �The fundamental problem of both the theoretical and the historicalsocial sciences is to explain and understand events in terms of human actions and socialsituations. The key term here is 'social situation'� (Popper, 1994, p. 166; orig. emph.).Since by this line of reasoning, the methodological principle of social sciences is linked tothe Verstehen tradition again (also see Hedström and Swedberg, 1998a, p. 350), Böhm(2008, p. 384) explicitly draws a parallel between Popper's situational logic and 18th
century hermeneutics. Thus, on the one hand, in Popper's situational logic, not all peo-ple are equally rational in terms of a simple behaviorist input-output machinery given a
15I will come back to the Thomas-Theorem when discussing the social mechanisms to be unveiled in aself-ful�lling prophecy explanation.
10
I. Causes and E�ects of Teachers' Evaluations: A Theoretical Primer
particular social situation.16 On the other hand, however, the method of interpretativesociology should not be simpli�ed to psychologism; this is what would stand in con�ictwith Popper's demand for an objective situational logic coinciding with the method ofeconomics (Hedström and Swedberg, 1998a, p. 347).Because of the conceptual wideness of his approach, Hedström and Swedberg (1998a,
p. 340) note that Popper �argued for a rationality-based analysis long before scholarssuch as James Coleman and Gary Becker, who usually are considered to be the intel-lectual forefathers of contemporary rational choice sociology�.17 However, it should notbe ignored that also several authors objected against several statements in Popper's sit-uation logic. For instance, Nadeau (1993) criticized that the status of the rationalityprinciple which Popper (1994, p. 169) denotes as being both �almost empty� as well as�actually false, though a good approximation to truth� (p. 177) does not ful�ll the re-quirements of falsi�cationism as demanded in his Logic of Scienti�c Discovery (Popper,1959 [1935]).18 Furthermore, Hedström et al. (1998, p. 354) note that Popper's socialsituations appears to be limited to one actor who �nds herself confronted with some'obstacles' she has to cope with. That is, Popper's social situation does neither reallycover social interaction � nor does it consider actors' interests (Hedström et al., 1998,p. 354f.).In order to solve these problems, Hedström et al. (1998, p. 357) propose an extension
of Koertge's (1979) re-formalization of Popper's situational logic:
1. Description of the situation: Agent A was in a situation of type C characterizedby a speci�c array of action alternatives, x1 to xn.
2. Description of interests : Agent A wants to attain end E.
16What can be noted for rational action theory in particular also holds for causal mechanisms in general:�[O]ne should not think of mechanisms as exclusively mechanical (push-pull) systems� (Machameret al., 2000, p. 2).
17As Hedström and Swedberg (1998a, p. 340) point out, the fact that Popper's thoughts on situationallogic and rationality were more or less ignored by sociologists can be explained by the hostilityof sociology towards the notion of rationality during the 1970s and 1980s. A prominent examplemight be the following statement from the Dialectic of Enlightenment : �With the spread of thebourgeois commodity economy the dark horizon of myth is illuminated by the sun of calculatingreason, beneath whose icy rays the seeds of the new barbarism are germinating� (Horkheimer andAdorno, 2002, p. 25). Critics of Critical Theory might counter with Mario Bunge's bon mot : �[W]hyis academia destructing itself by producing and di�using 'postmodern' gobbledygook?� (Bunge,1997, p. 413).
18The argument against Popper's rationality principle appears to end up in what is known as theMünchhausen Trilemma, i.e. the inescapability between a circular argument, an in�nite regress,and an axiomatic argument (cf. Albert, 1985, ch. 1). Despite this, I hold the thesis that forPopper's notion of rationality as a principle that is �almost empty� (Popper, 1994, p. 169), astatus applies similar to what Ingeborg Maus denoted as �the presuppositionlessness of modernity�when defending John Rawls' (equally criticized) concept of the original position in his Theory ofJustice (Rawls, 1971): �Die 'gegenseitige Stützung vieler Erwägungen' nähert sich dem Grundmustermoderner Begründungen an: diese sind notwendig zirkulär, ohne dass es ihnen erlaubt wäre, in einemtautologischen Sinn selbstreferentiell zu sein� (Maus, 2006, p. 86; orig. emph.). Unfortunately, spaceconstraints prevent me to elaborate more intensely on this issue.
11
2 Historical and Analytical Foundations of Social Action Theory
3. Description of beliefs : Agent A has reasons to believe that action x1 is the bestway to attain E in situation C.
4. Rationality principle: Agents always act rationally; that is, they choose the courseof action that they believe to be the best way of realizing their interests.
5. Explanandum: (Therefore) A did x1.
Note that this enumeration is not only an extension of Popper's original conceptionbut already moving a good deal away from it. For instance, apart from consideringactors' interests and beliefs, the form of the rationality principle formulated here has notmuch to do anymore with Popper's �empty principle� which is �actually false, though agood approximation to truth�. While Popper did not claim that every actor always actsrational, according to the fourth principle in the notation by Hedström et al. (1998),this is evidently the case (though the type of rationality is one of the weak sort).Summing up their intention, Hedström et al. (1998) attempt to overcome some short-
comings of Popper's situational logic by providing an extended formalization also con-sidering actors' interests and beliefs. However, the reader should be aware of the factthat the authors tend to use Popper's situational logic merely as a 'springboard' for theirown action theory consisting of Desires, Beliefs and Opportunities (cf. Hedström, 2005,ch. 3; also see section 2.2 below). Having arrived at a suitable working de�nition ofsocial mechanisms, this very basic action model will indeed prove useful in illustratingvarious types of social mechanisms (cf. section 2.2). Luckily, there are theorists whonote that actors' beliefs and motives are implicitly part of the Popperian social situa-tion (Nadeau, 1993; Böhm, 2008). Therefore, we are not entirely on the wrong trackin following Hedström et al. (1998) in the above step, but particularly regarding theupcoming discussion of di�erent notions of rational choice theory, we should keep inmind that Popper (1994) himself might not subscribe to every item in the enumerationabove. Nonetheless, building on the extended deductive-nomological framework on theone hand ensures the capability of sociology of being both an understanding and anexplaining academic discipline, and on the other hand, it is a valuable starting point forthe following subsection on analytical sociology.
Interim conclusion This subsection has shown how Max Weber's (1964/1985) def-inition of sociology is deep-rooted in the German Erklären-Verstehen debate of the19th century. While the deductive-nomological explanation (or covering-law model) byHempel and Oppenheim (1948) falls too short for an entire understanding of human ac-tion in the Weberian sense, Popper's situational logic (Popper, 1944a,b, 1945b) togetherwith his rationality principle (Popper, 1994) provides a good starting point for an an-alytical theory of action that lives up to the demand for an understanding explanationby pointing to more �ne-grained social mechanisms (Hedström et al., 1998; Hedström,2005).
12
I. Causes and E�ects of Teachers' Evaluations: A Theoretical Primer
2.2 Analytical Sociology and Social Mechanisms
Although Popper's situational logic already sets the ground for later rational-actionbased reconstructions of individuals' social situation, for a long time after Popper, awhole stream of social science tended to reduce causal explanations on detecting signif-icant correlations without providing a su�cient understanding explanation for them.To given an illustrative example, Popper reports that when another distinguished
scholar (of whom he does not tell us the name) once uttered at a scienti�c conference thatscience was just measuring and correlating results, he himself replied: �I suggested weshould ask for a grant for a project of measuring the length, width, thickness, and weightof the books in the British Museum � in order to study possible correlations between thesemeasurements. I predicted that we should be able to �nd strong positive correlationsbetween the product of the �rst three measurements and the fourth� (Popper, 1994, p.155).As pointed out by Hedström and Swedberg (1996), a good starting point for the
relevance of this kind of argument for the social sciences is provided by the contro-versy emerging from Boudon's monograph Education, Opportunity, and Social Inequality(Boudon, 1974), its review by Hauser (1976), and a rejoinder by Boudon (1976) again.Hauser (1976) particularly criticizes Boudon's (1974) distinction between statistical
and theoretical models and the idea that the latter should be used in order to explainwhat has been computed in the former. Boudon, however, replies that �we must gobeyond the statistical relationships to explore the generative mechanisms responsiblefor them. This direction has a name: theory. And a goal: understanding� (Boudon,1976, p. 1187). In a later writing, he adds that �causal analysis does not explain thechart. It simply summarizes it [...] Understanding a statistical structure means in manycases building a generating theory or model [...] that includes the observed empiricalstructure as one of its consequences� (Boudon, 1979, p. 51f., orig. emph.; also seeHedström and Swedberg, 1996, p. 292). As the observant reader might have noticed,the notion of Verstehen is explicitly brought up again in order to overcome a crucialshortcoming of merely correlational statistical analysis. Referring to von Wright (1971),Hedström and Swedberg (1996) hold the view that especially covering-law explanationsare nothing more than �black-box explanations� (p. 297); and one may (and at least I do)regard the combination of a reductionist covering-law approach followed by short-sightedstatistical analysis (i.e. �variable sociology�; also see Esser, 1996b) to be a particularlyunholy alliance.Consequently, Hedström (2005, p. 16) follows early critics of covering-law type ex-
planations (such as Salmon, 1971) when conceding that the former neither go very far,nor are they generally considered to be acceptable scienti�c explanations. Thus, let usask with Esser (1996b): �What's wrong with variable sociology?� As Goldthorpe (2001)points out, it has something to do with the implied notion of causality. Goldthorpe dis-tinguishes three traditions of causal modeling in the social sciences: robust dependence,consequential manipulation, and the generative process account. The 'robust depen-dence' tradition became most prominent with the Wisconsin model of status attainmentprocess (Blau and Duncan, 1967) wherein social strati�cation was modeled as a complex
13
2 Historical and Analytical Foundations of Social Action Theory
path structure focusing on the statistical correlations between the variables in the model.The 'consequential manipulation' tradition can be related to the Holland-Rosenbaum-Rubin model of a methodological19 counterfactualist treatment-e�ect approach that eval-uates the e�cacy of a treatment � e.g. a job-training program � against an arti�cialsituation wherein individuals had not received the treatment (see Gangl, 2010, for anexcellent review of both the seminal econometric papers and numerous applications ofthe relevant methods in both economics and the social sciences). Both traditions may besubsumed beneath what Esser (1996b) called variable sociology � because in both cases,statistical techniques are regarded to be a su�cient approximation of (if not identicalto) the implied idea of causality. To be precise, both traditions are not explanatorysince the necessary explanatory link between the independent and the dependent vari-ables is lacking; they are incomplete since the often-applied strategy of adding morecovariates to overcome conceptual shortage will by no means ever be exhaustive; andthey are meaningless since in most cases, a �general theory of decision making betweengiven situational alternatives� (Esser, 1996b, p. 163) � entailing additional covariatesthat may mediate individual decision-making � is missing.20 The third tradition, andlucky for us, the tradition that Goldthorpe (2001) regards to be suitable to overcome theabove-described shortcomings is the generative process tradition. The latter, nota bene,is equivalent to the idea that the association between two variables X and Y is createdby some 'mechanism' � i.e. that the concept of causation is tied �to some process existingin time and space, even if not perhaps directly observable, that actually generates thecausal e�ect of X on Y and, in so doing, produces the statistical relationship that isempirically in evidence� (Goldthorpe, 2001, p. 9).Goldthorpe argues that a sociological explanation standing in accordance with the
generative process model should proceed along a three-phase sequence (Goldthorpe,2001, p. 10):
1. establishing the phenomena that form the explananda
2. hypothesizing generative processes at the level of social action
3. testing the hypotheses.
In the �rst of the three phases (which Goldthorpe borrows from Merton, 1987), theresearcher should unveil the social regularities that she aims to explain (e.g. variationin individuals' educational transition probabilities). Critique of a naïve use of statisticalcausal-modeling techniques should not be equated with a prohibition of inductive andexplorative techniques such as scaling or clustering in order to establish what should beexplained and tested thereafter.
19I denote this approach 'methodological counterfactualism' because it should be distinguished from anontological counterfactualism as prominently held by Lewis (1973, 1977, 1979, 1981, also see section5).
20Note that also Esser uses the term verständlich in this context (Esser, 1996b, p. 163) � unfortunatelywithout further elaboration.
14
I. Causes and E�ects of Teachers' Evaluations: A Theoretical Primer
In the second phase, the causes for the social regularities have to be unfolded. Con-sistent with the paradigm of methodological individualism21 before any statistical causalmodeling, actors' reasons within speci�c social situations have to be captured. Antici-pating what will be discussed more precisely in the next paragraph, this step can alsobe described with Elster's (1985, 1989) metaphor of opening the black box and show-ing the cogs and wheels of the machinery. Thus, the second phase is closely related tomechanism-based explanations.Finally, the third phase involves the actual test of what has been merely hypothesized
in the second phase. Importantly, this stage is subordinated to the preferably �ne-grained theoretical explanation since it is conceptualized as an empirical examinationof the former stage. Sophisticated statistical techniques as applied in the consequential-manipulation framework are admitted in this stage, but not as attempts to derive causalrelations directly from data analysis (Goldthorpe, 2001, p. 11).The focus of this introduction will lay on the second phase described by Goldthorpe
(2001) in terms of unveiling potential causes for both regularities already observed inpreceding studies (e.g. reference-group and teacher expectancy e�ects) and new hy-potheses that were deduced from the phenomena already established. To a certainextent, this endeavor is in line with Coleman's (1990) metatheoretical plea for unveilingmacro-micro hypotheses, action-theoretical assumptions on the micro-level, and micro-macro hypotheses in order to account for observed macro-level regularities (such as theWeberian 'Spirit of Capitalism'). However, the understanding of a social mechanism asdefended here goes beyond both Coleman's (1990, p. 5) 'methodological pragmatism'and his action-theoretical restrictions (p. 18). Also to show this, a suitable workingde�nition of a social mechanism will prove particularly helpful � which will be the focusof the next paragraph.
De�nitions of social mechanisms While the term 'social mechanisms ' evidentlyrefers to mechanism-based explanations in the social sciences, the more general notioncausal mechanism reveals the crucial demand of this stream of research: getting closer tothe actual causal structure than it is possible merely by means of correlational analysis.De�nitions of causal mechanisms have been proposed numerously, and therefore, re-
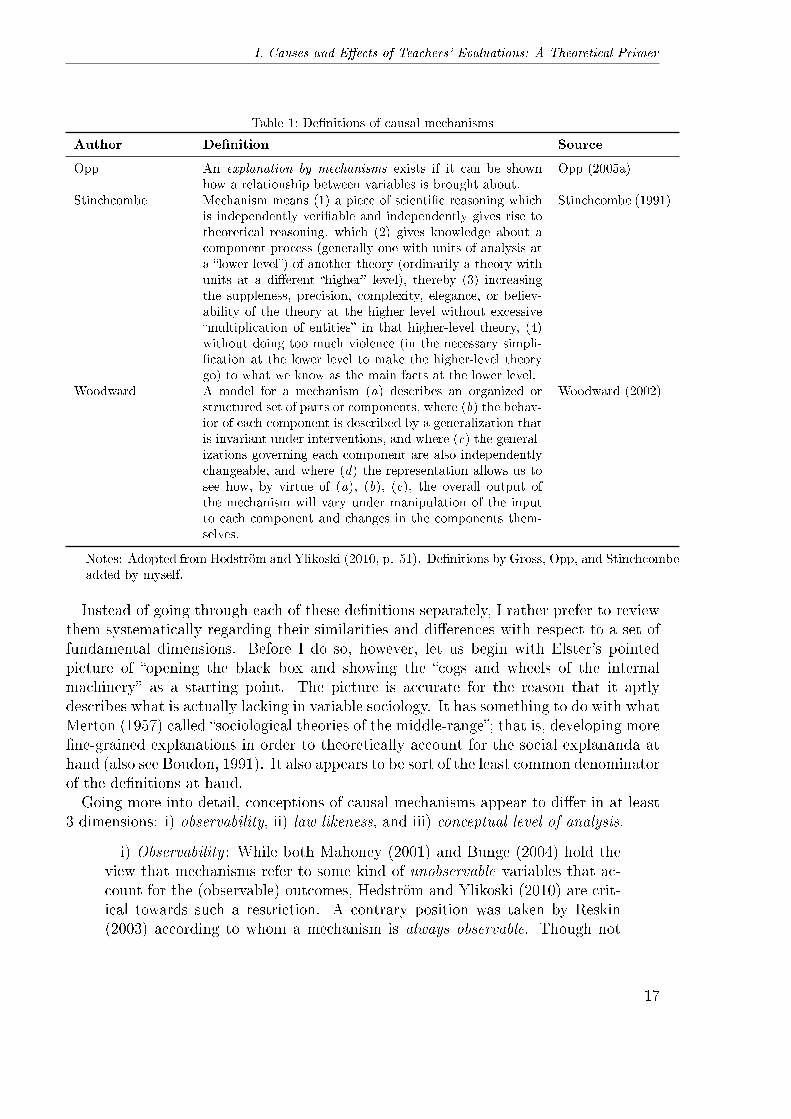
views of these de�nitions are necessarily incomplete. Below, I supplement the summariesof the most important de�nitions provided by Gross (2009) as well as Hedström andYlikoski (2010).22
21Yet, I tend to follow Hedström and Ylikoski (2010, p. 60) in linking social mechanisms to the slightlyweaker concept of structural individualism. For a review of various approaches towards the notionof individualism see Udehn (2002).
22When Bunge (2004, p. 191) writes that �there are nearly as many systems theories as systemstheorists�, one could say the same about de�nitions of causal mechanisms � so the (supplemented)overview below is still not intended to be an exhaustive enumeration.
15

2 Historical and Analytical Foundations of Social Action Theory
Table 1: De�nitions of causal mechanisms
Author De�nition Source
Bechtel & Abra-hamsen
A mechanism is a structure performing a function by virtueof its component operations and their organization. Theorchestrated functioning of the mechanism is responsiblefor one ore more phenomena.
Bechtel and Abra-hamsen (2005);Bechtel (2006,2008)
Bunge A mechanism is a process in a concrete system that is ca-pable of bringing about or preventing some change in thesystem.
Bunge (1997, 2004)
Glennan A mechanism for a behavior is a complex system that pro-duces that behavior by the interaction of several parts,where the interactions between parts can be characterizedby direct, invariant, change-relating generalizations.
Glennan (2002)
Machamer, Dardenand Craver
Mechanisms are entities and activities organized such thatthey produce regular changes from start to �nish.
Machamer et al.(2000); Darden(2006); Craver(2007)
Elster I A mechanism explains by opening the black box and show-ing the cogs and wheels of the internal machinery. Amechanism provides a continuous and contiguous chain ofcausal or intentional links between the explanans and theexplanandum.
Elster (1985, 1989)
Elster II Mechanisms are frequently occurring and easily recogniz-able causal patterns that are triggered under generally un-known conditions.
Elster (1999)
Gambetta Mechanisms have the form, 'Given certain conditions K,an agent will do x because of M with probability p.' Mrefers either to forms of reasoning governing decision mak-ing (of which rational choice models are a subset) or tosubintentional processes that a�ect action both directly (asimpulsiveness) or by shaping preferences or beliefs.
Gambetta (1998)
Gross A social mechanism is a more or less general sequence orset of social events or processes analyzed at a lower orderof complexity or aggregation by which � in certain circum-stances � some cause X tends to bring about some e�ect Yin the realm of human social relations. This sequence or setmay or may not be analytically reducible to the actions ofindividuals who enact it, may underwrite formal or substan-tive causal processes, and may be observed, unobserved, orin principle be unobservable.
Gross (2009)
Hedström Mechanisms consist of entities (with their properties) andthe activities that these entities engage in, either by them-selves or in concert with other entities. These activitiesbring about change, and the type of change brought aboutdepends on the properties of the entities and how the enti-ties are organized spatially and temporally.
Hedström (2005)
Little A causal mechanism is a series of events governed by law-like regularities that lead from the explanans to the ex-planandum.
Little (1991)
continued
16
I. Causes and E�ects of Teachers' Evaluations: A Theoretical Primer
Table 1: De�nitions of causal mechanisms
Author De�nition Source
Opp An explanation by mechanisms exists if it can be shownhow a relationship between variables is brought about.
Opp (2005a)
Stinchcombe Mechanism means (1) a piece of scienti�c reasoning whichis independently veri�able and independently gives rise totheoretical reasoning, which (2) gives knowledge about acomponent process (generally one with units of analysis ata �lower level�) of another theory (ordinarily a theory withunits at a di�erent �higher� level), thereby (3) increasingthe suppleness, precision, complexity, elegance, or believ-ability of the theory at the higher level without excessive�multiplication of entities� in that higher-level theory, (4)without doing too much violence (in the necessary simpli-�cation at the lower level to make the higher-level theorygo) to what we know as the main facts at the lower level.
Stinchcombe (1991)
Woodward A model for a mechanism (a) describes an organized orstructured set of parts or components, where (b) the behav-ior of each component is described by a generalization thatis invariant under interventions, and where (c) the general-izations governing each component are also independentlychangeable, and where (d) the representation allows us tosee how, by virtue of (a), (b), (c), the overall output ofthe mechanism will vary under manipulation of the inputto each component and changes in the components them-selves.
Woodward (2002)
Notes: Adopted from Hedström and Ylikoski (2010, p. 51). De�nitions by Gross, Opp, and Stinchcombeadded by myself.
Instead of going through each of these de�nitions separately, I rather prefer to reviewthem systematically regarding their similarities and di�erences with respect to a set offundamental dimensions. Before I do so, however, let us begin with Elster's pointedpicture of �opening the black box and showing the �cogs and wheels of the internalmachinery� as a starting point. The picture is accurate for the reason that it aptlydescribes what is actually lacking in variable sociology. It has something to do with whatMerton (1957) called �sociological theories of the middle-range�; that is, developing more�ne-grained explanations in order to theoretically account for the social explananda athand (also see Boudon, 1991). It also appears to be sort of the least common denominatorof the de�nitions at hand.Going more into detail, conceptions of causal mechanisms appear to di�er in at least
3 dimensions: i) observability, ii) law-likeness, and iii) conceptual level of analysis.
i) Observability : While both Mahoney (2001) and Bunge (2004) hold theview that mechanisms refer to some kind of unobservable variables that ac-count for the (observable) outcomes, Hedström and Ylikoski (2010) are crit-ical towards such a restriction. A contrary position was taken by Reskin(2003) according to whom a mechanism is always observable. Though not
17
2 Historical and Analytical Foundations of Social Action Theory
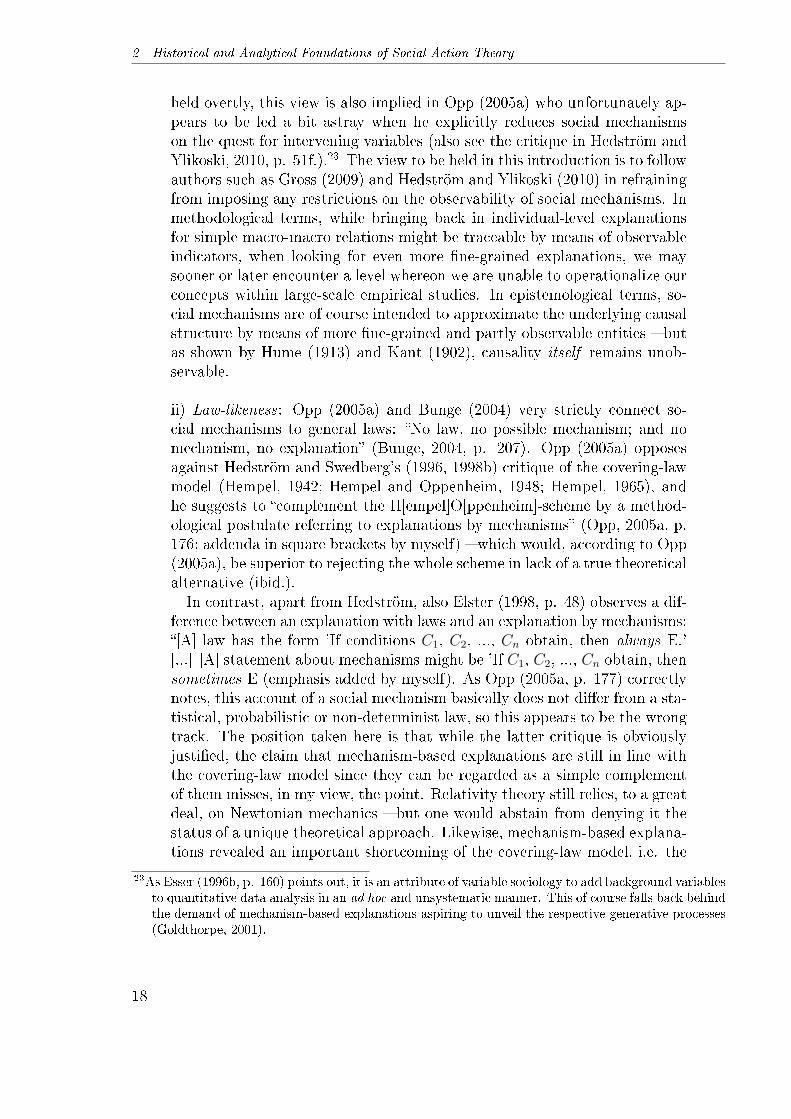
held overtly, this view is also implied in Opp (2005a) who unfortunately ap-pears to be led a bit astray when he explicitly reduces social mechanismson the quest for intervening variables (also see the critique in Hedström andYlikoski, 2010, p. 51f.).23 The view to be held in this introduction is to followauthors such as Gross (2009) and Hedström and Ylikoski (2010) in refrainingfrom imposing any restrictions on the observability of social mechanisms. Inmethodological terms, while bringing back in individual-level explanationsfor simple macro-macro relations might be traceable by means of observableindicators, when looking for even more �ne-grained explanations, we maysooner or later encounter a level whereon we are unable to operationalize ourconcepts within large-scale empirical studies. In epistemological terms, so-cial mechanisms are of course intended to approximate the underlying causalstructure by means of more �ne-grained and partly observable entities � butas shown by Hume (1913) and Kant (1902), causality itself remains unob-servable.
ii) Law-likeness : Opp (2005a) and Bunge (2004) very strictly connect so-cial mechanisms to general laws: �No law, no possible mechanism; and nomechanism, no explanation� (Bunge, 2004, p. 207). Opp (2005a) opposesagainst Hedström and Swedberg's (1996, 1998b) critique of the covering-lawmodel (Hempel, 1942; Hempel and Oppenheim, 1948; Hempel, 1965), andhe suggests to �complement the H[empel]O[ppenheim]-scheme by a method-ological postulate referring to explanations by mechanisms� (Opp, 2005a, p.176; addenda in square brackets by myself) � which would, according to Opp(2005a), be superior to rejecting the whole scheme in lack of a true theoreticalalternative (ibid.).In contrast, apart from Hedström, also Elster (1998, p. 48) observes a dif-
ference between an explanation with laws and an explanation by mechanisms:�[A] law has the form 'If conditions C1, C2, ..., Cn obtain, then always E.'[...] [A] statement about mechanisms might be 'If C1, C2, ..., Cn obtain, thensometimes E (emphasis added by myself). As Opp (2005a, p. 177) correctlynotes, this account of a social mechanism basically does not di�er from a sta-tistical, probabilistic or non-determinist law, so this appears to be the wrongtrack. The position taken here is that while the latter critique is obviouslyjusti�ed, the claim that mechanism-based explanations are still in line withthe covering-law model since they can be regarded as a simple complementof them misses, in my view, the point. Relativity theory still relies, to a greatdeal, on Newtonian mechanics � but one would abstain from denying it thestatus of a unique theoretical approach. Likewise, mechanism-based explana-tions revealed an important shortcoming of the covering-law model, i.e. the
23As Esser (1996b, p. 160) points out, it is an attribute of variable sociology to add background variablesto quantitative data analysis in an ad hoc and unsystematic manner. This of course falls back behindthe demand of mechanism-based explanations aspiring to unveil the respective generative processes(Goldthorpe, 2001).
18
I. Causes and E�ects of Teachers' Evaluations: A Theoretical Primer
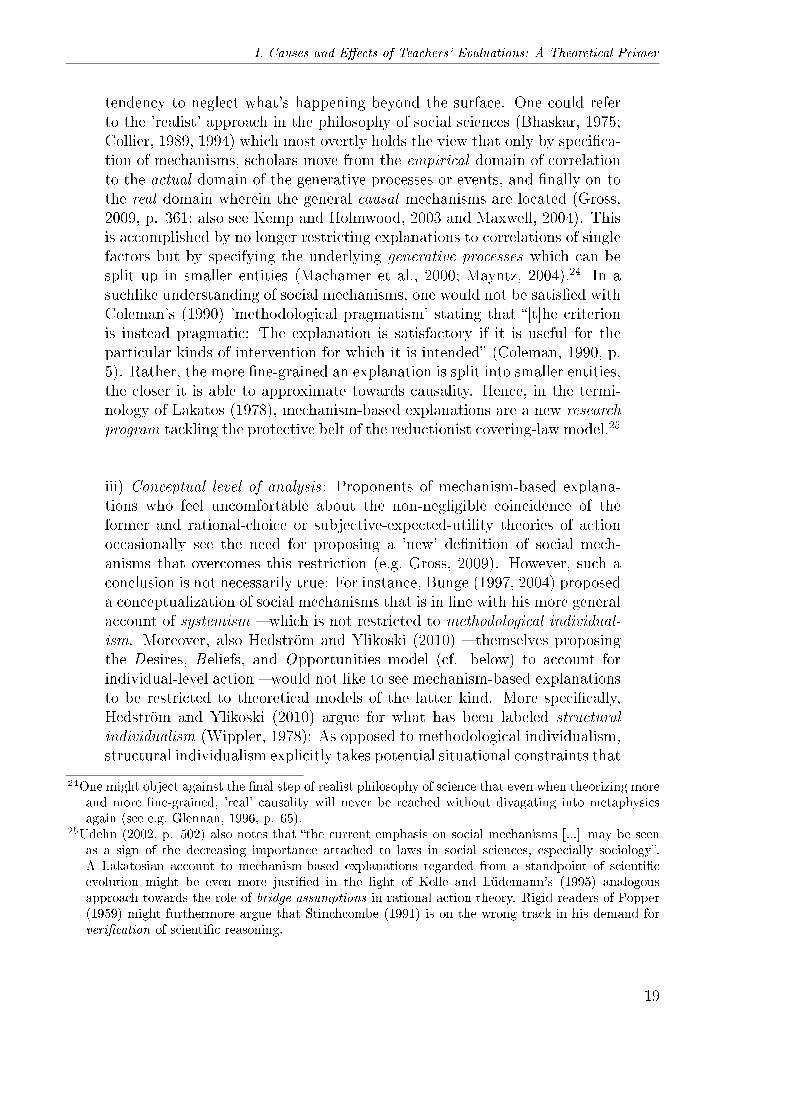
tendency to neglect what's happening beyond the surface. One could referto the 'realist' approach in the philosophy of social sciences (Bhaskar, 1975;Collier, 1989, 1994) which most overtly holds the view that only by speci�ca-tion of mechanisms, scholars move from the empirical domain of correlationto the actual domain of the generative processes or events, and �nally on tothe real domain wherein the general causal mechanisms are located (Gross,2009, p. 361; also see Kemp and Holmwood, 2003 and Maxwell, 2004). Thisis accomplished by no longer restricting explanations to correlations of singlefactors but by specifying the underlying generative processes which can besplit up in smaller entities (Machamer et al., 2000; Mayntz, 2004).24 In asuchlike understanding of social mechanisms, one would not be satis�ed withColeman's (1990) 'methodological pragmatism' stating that �[t]he criterionis instead pragmatic: The explanation is satisfactory if it is useful for theparticular kinds of intervention for which it is intended� (Coleman, 1990, p.5). Rather, the more �ne-grained an explanation is split into smaller entities,the closer it is able to approximate towards causality. Hence, in the termi-nology of Lakatos (1978), mechanism-based explanations are a new researchprogram tackling the protective belt of the reductionist covering-law model.25
iii) Conceptual level of analysis : Proponents of mechanism-based explana-tions who feel uncomfortable about the non-negligible coincidence of theformer and rational-choice or subjective-expected-utility theories of actionoccasionally see the need for proposing a 'new' de�nition of social mech-anisms that overcomes this restriction (e.g. Gross, 2009). However, such aconclusion is not necessarily true: For instance, Bunge (1997, 2004) proposeda conceptualization of social mechanisms that is in line with his more generalaccount of systemism � which is not restricted to methodological individual-ism. Moreover, also Hedström and Ylikoski (2010) � themselves proposingthe Desires, Beliefs, and Opportunities model (cf. below) to account forindividual-level action � would not like to see mechanism-based explanationsto be restricted to theoretical models of the latter kind. More speci�cally,Hedström and Ylikoski (2010) argue for what has been labeled structuralindividualism (Wippler, 1978): As opposed to methodological individualism,structural individualism explicitly takes potential situational constraints that
24One might object against the �nal step of realist philosophy of science that even when theorizing moreand more �ne-grained, 'real' causality will never be reached without divagating into metaphysicsagain (see e.g. Glennan, 1996, p. 65).
25Udehn (2002, p. 502) also notes that �the current emphasis on social mechanisms [...] may be seenas a sign of the decreasing importance attached to laws in social sciences, especially sociology�.A Lakatosian account to mechanism-based explanations regarded from a standpoint of scienti�cevolution might be even more justi�ed in the light of Kelle and Lüdemann's (1995) analogousapproach towards the role of bridge assumptions in rational action theory. Rigid readers of Popper(1959) might furthermore argue that Stinchcombe (1991) is on the wrong track in his demand forveri�cation of scienti�c reasoning.
19
2 Historical and Analytical Foundations of Social Action Theory
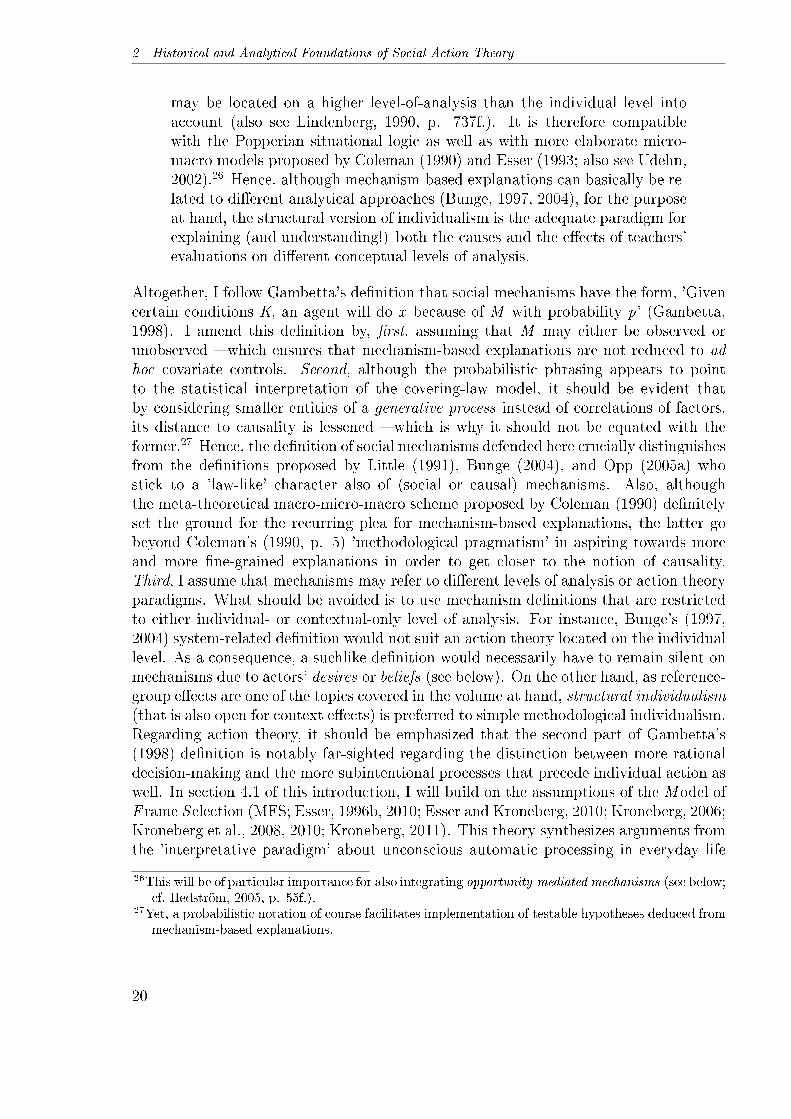
may be located on a higher level-of-analysis than the individual level intoaccount (also see Lindenberg, 1990, p. 737f.). It is therefore compatiblewith the Popperian situational logic as well as with more elaborate micro-macro models proposed by Coleman (1990) and Esser (1993; also see Udehn,2002).26 Hence, although mechanism-based explanations can basically be re-lated to di�erent analytical approaches (Bunge, 1997, 2004), for the purposeat hand, the structural version of individualism is the adequate paradigm forexplaining (and understanding!) both the causes and the e�ects of teachers'evaluations on di�erent conceptual levels of analysis.
Altogether, I follow Gambetta's de�nition that social mechanisms have the form, 'Givencertain conditions K, an agent will do x because of M with probability p' (Gambetta,1998). I amend this de�nition by, �rst, assuming that M may either be observed orunobserved � which ensures that mechanism-based explanations are not reduced to adhoc covariate controls. Second, although the probabilistic phrasing appears to pointto the statistical interpretation of the covering-law model, it should be evident thatby considering smaller entities of a generative process instead of correlations of factors,its distance to causality is lessened � which is why it should not be equated with theformer.27 Hence, the de�nition of social mechanisms defended here crucially distinguishesfrom the de�nitions proposed by Little (1991), Bunge (2004), and Opp (2005a) whostick to a 'law-like' character also of (social or causal) mechanisms. Also, althoughthe meta-theoretical macro-micro-macro scheme proposed by Coleman (1990) de�nitelyset the ground for the recurring plea for mechanism-based explanations, the latter gobeyond Coleman's (1990, p. 5) 'methodological pragmatism' in aspiring towards moreand more �ne-grained explanations in order to get closer to the notion of causality.Third, I assume that mechanisms may refer to di�erent levels of analysis or action theoryparadigms. What should be avoided is to use mechanism de�nitions that are restrictedto either individual- or contextual-only level of analysis. For instance, Bunge's (1997,2004) system-related de�nition would not suit an action theory located on the individuallevel. As a consequence, a suchlike de�nition would necessarily have to remain silent onmechanisms due to actors' desires or beliefs (see below). On the other hand, as reference-group e�ects are one of the topics covered in the volume at hand, structural individualism(that is also open for context e�ects) is preferred to simple methodological individualism.Regarding action theory, it should be emphasized that the second part of Gambetta's(1998) de�nition is notably far-sighted regarding the distinction between more rationaldecision-making and the more subintentional processes that precede individual action aswell. In section 4.1 of this introduction, I will build on the assumptions of the M odel ofF rame Selection (MFS; Esser, 1996b, 2010; Esser and Kroneberg, 2010; Kroneberg, 2006;Kroneberg et al., 2008, 2010; Kroneberg, 2011). This theory synthesizes arguments fromthe 'interpretative paradigm' about unconscious automatic processing in everyday life
26This will be of particular importance for also integrating opportunity-mediated mechanisms (see below;cf. Hedström, 2005, p. 55f.).
27Yet, a probabilistic notation of course facilitates implementation of testable hypotheses deduced frommechanism-based explanations.
20
I. Causes and E�ects of Teachers' Evaluations: A Theoretical Primer
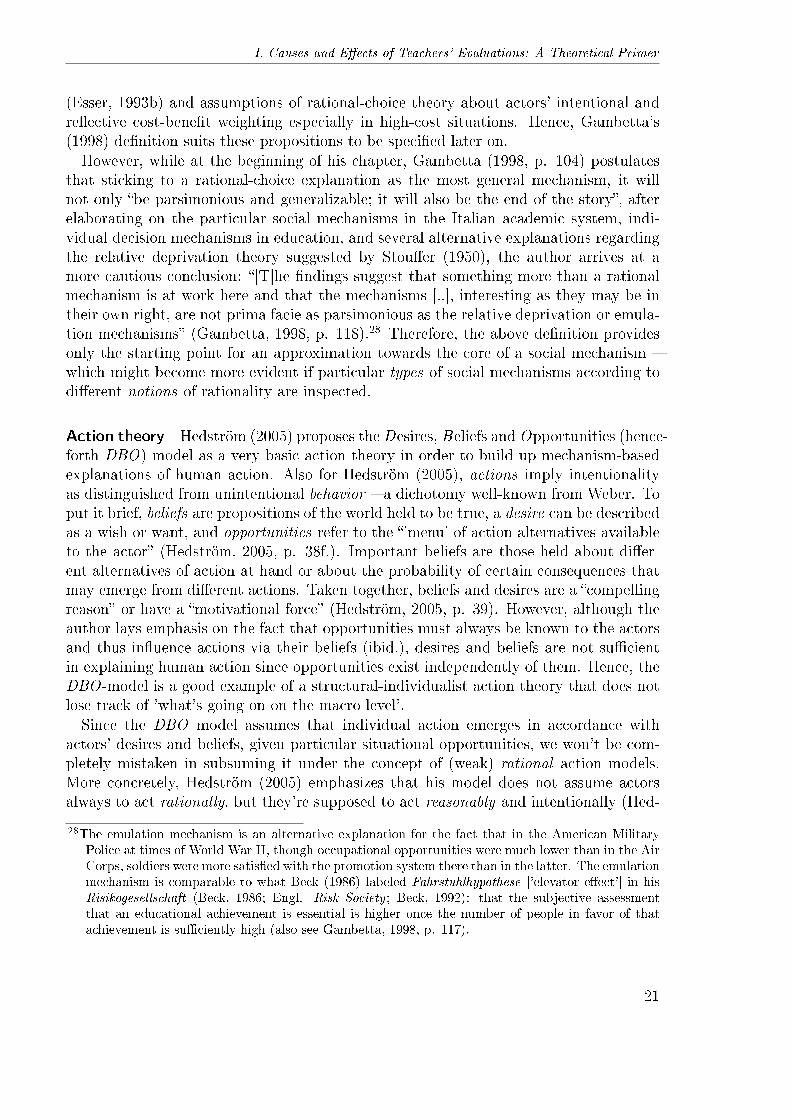
(Esser, 1993b) and assumptions of rational-choice theory about actors' intentional andre�ective cost-bene�t weighting especially in high-cost situations. Hence, Gambetta's(1998) de�nition suits these propositions to be speci�ed later on.However, while at the beginning of his chapter, Gambetta (1998, p. 104) postulates
that sticking to a rational-choice explanation as the most general mechanism, it willnot only �be parsimonious and generalizable; it will also be the end of the story�, afterelaborating on the particular social mechanisms in the Italian academic system, indi-vidual decision mechanisms in education, and several alternative explanations regardingthe relative deprivation theory suggested by Stou�er (1950), the author arrives at amore cautious conclusion: �[T]he �ndings suggest that something more than a rationalmechanism is at work here and that the mechanisms [..], interesting as they may be intheir own right, are not prima facie as parsimonious as the relative deprivation or emula-tion mechanisms� (Gambetta, 1998, p. 118).28 Therefore, the above de�nition providesonly the starting point for an approximation towards the core of a social mechanism �which might become more evident if particular types of social mechanisms according todi�erent notions of rationality are inspected.
Action theory Hedström (2005) proposes theDesires, Beliefs andOpportunities (hence-forth DBO) model as a very basic action theory in order to build up mechanism-basedexplanations of human action. Also for Hedström (2005), actions imply intentionalityas distinguished from unintentional behavior � a dichotomy well-known from Weber. Toput it brief, beliefs are propositions of the world held to be true, a desire can be describedas a wish or want, and opportunities refer to the �'menu' of action alternatives availableto the actor� (Hedström, 2005, p. 38f.). Important beliefs are those held about di�er-ent alternatives of action at hand or about the probability of certain consequences thatmay emerge from di�erent actions. Taken together, beliefs and desires are a �compellingreason� or have a �motivational force� (Hedström, 2005, p. 39). However, although theauthor lays emphasis on the fact that opportunities must always be known to the actorsand thus in�uence actions via their beliefs (ibid.), desires and beliefs are not su�cientin explaining human action since opportunities exist independently of them. Hence, theDBO-model is a good example of a structural-individualist action theory that does notlose track of 'what's going on on the macro level'.Since the DBO model assumes that individual action emerges in accordance with
actors' desires and beliefs, given particular situational opportunities, we won't be com-pletely mistaken in subsuming it under the concept of (weak) rational action models.More concretely, Hedström (2005) emphasizes that his model does not assume actorsalways to act rationally, but they're supposed to act reasonably and intentionally (Hed-
28The emulation mechanism is an alternative explanation for the fact that in the American MilitaryPolice at times of World War II, though occupational opportunities were much lower than in the AirCorps, soldiers were more satis�ed with the promotion system there than in the latter. The emulationmechanism is comparable to what Beck (1986) labeled Fahrstuhlhypothese ['elevator e�ect'] in hisRisikogesellschaft (Beck, 1986; Engl. Risk Society ; Beck, 1992): that the subjective assessmentthat an educational achievement is essential is higher once the number of people in favor of thatachievement is su�ciently high (also see Gambetta, 1998, p. 117).
21
2 Historical and Analytical Foundations of Social Action Theory
ström, 2005, p. 60f.). This matches Boudon's critique of instrumental rationality andhis plea for a model of cognitive or axiological rationality (Boudon, 1996, 1998, 2003).Concretely, cognitive rationality confers an observation that Boudon has noted for his-tory of science in general on the fundamental prerequisites of action theory: that it hasalso to deal with evidently false beliefs of individuals29; and that this purpose can beresolved by assuming that the former can be reasonably reconstructed (Boudon, 2003, p.12). Complementary to cognitivist rationality, axiological rationality can be understoodin sense of Weber's Wertrationalität � which means, following Boudon (2003, p. 14),that �prescriptive beliefs are grounded in the mind of social actors on systems of reasonsperceived by them as strong� (emph. added).The line of attack of these pleadings are aimed at a too narrow notion of rationality
that can be traced back to neoclassical economics. As Goldthorpe (1998, p. 169) nicelypoints out, rational action theories can be distinguished �according to whether they
(i) have strong rather than weak rationality requirements;
(ii) focus on situational rather than procedural rationality; and
(iii) claim to provide a general rather [than] a special theory of action.�
First, while neoclassical economics holds a very strong notion of rationality assumingevidently unrealistic axioms such as individuals' perfect information or their strict maxi-mization of utility (Becker, 1976), less restricted approaches lay emphasis on individuals'bounded rationality (Simon, 1955, 1957) and consequently demand from sociological ex-planations also to rationally reconstruct false beliefs (Boudon, 1996, 1998).Second, in mainstream economics, human action is situationally constrained to such an
extreme degree that in a given market situation, and given individuals' set of preferences,an actor will always maximize her utility � implying that choice is a result of ratherautomatic computation.30 While also Popper's situational logic can be subsumed amongthe type of theories imposing strict external constraints on human action (though holdinga much weaker concept of rationality), Simon (1955, 1957), Lindenberg (1985, 1990) andLindenberg and Frey (1993) uncouple action from situational constraints by deducingthe idea of subjective rationality from more psychological foundations. The same schemeapplies to Boudon's cognitivist action theory (Boudon, 1996).Third, some theories such as Gary Becker's �economic imperialism� (Goldthorpe, 1998,
p. 175) claim that rational action theory (and, in Becker's version, even in a verystrong and mechanistic form) suits for explaining various aspects of social life by meansof consumption theory. In contrast, social science theorists like Coleman (1990) andBoudon (1996, 1998) are more skeptical in this regard � or, to phrase it di�erently, theyare more aware of social science theories' explanatory limits.
29This will be of particular importance concerning a mechanism-based explanation of self-ful�llingprophecies in terms of a teacher treatment e�ect (cf. section 4.3).
30As Goldthorpe (1998, p. 175) observes in accordance to several other authors, �the paradox arisesthat the theory of 'rational choice' par excellence turns out to imply that little real choice in factexists.�
22
I. Causes and E�ects of Teachers' Evaluations: A Theoretical Primer
Goldthorpe (1998) himself pleads for a notion of subjective rationality of intermediatestrength within strong bonds to situational restrictions. He regards rational actiontheory to be a privileged theory, �[...] that is, not just one theory of action amongothers but rather the theory with which attempts at explaining social action shouldstart and with which they should remain for as long as possible� (Goldthorpe, 1998, p.184). Notably, he does not become tired of stressing that exactly this is the demandfor any verstehende sociology in the sense of Weber: By applying rational action theoryof intermediate strength in order to rationally reconstruct actors' desires and beliefswithin a given situational context, social scientists are neither led astray by simple input-output types of black box explanations that may empty into causally de�cient variablesociology, nor are they confronted by too restricted psychologism or a too sloppy notionof rationality that may end up in the tautologism of approving every human behavioras rational per se.Not to soften the core of rationality too much is also defended by Lindenberg (1990):
According to his method of decreasing abstraction, theorists should actually start with acomparably tight notion of rationality that is subsequently amended by bridge assump-tions in order to account for explanatory blind spots of simple rational choice theorymodels (�as simple as possible and as complex as necessary�; see Lindenberg, 1990, p.738). To be precise, maintaining a relatively simple core of rational choice theory isdesirable according to the premise of parsimoniousness well-known as Occam's Razor(Thorburn, 1918; Feuer, 1957; Popper, 1959, ch. 7) � but if the simplicity assumption istoo unrealistic, the (empty) core of rationality can be cautiously widened by more real-istic auxiliary assumptions. Since it was argued above that the model of man defendedby what has been called �economic imperialism� is hardly suited even to come close toan understanding of individual action, a notable extension of the former model will beinevitable. Concretely, the notion of rationality defended here is one of the broadertype that also strives to reconstruct actors' false beliefs by discarding untenable action-theoretic axioms (such as the postulate of individuals' perfect information); and it isfurther argued that this aim can be achieved best by reasonably reconstructing actors'beliefs in line with Weber's concept of Wertrationalität. In contrast, we should not loosesight of the premise of parsimony that will prevent us from becoming too sloppy inrelaxing our rationality assumption.Having argued for a rational action model that neither defends unrealistic assump-
tions nor stands at risk of getting cut down by Occam's razor, we have of course toask how the preceding elaborations relate to the above-de�ned notion of social mecha-nisms. At the end of the last paragraph, we ended up in a discussion about whether theassumption of actors' rational choice would already be the end of a mechanism-basedexplanation. What we may conclude now is that at least a too tight notion of rationalitywill not su�ce, but the precise form of rational-choice approach is still not su�cientlyspeci�ed. The solution to this problem is that following Lindenberg's (1990) method ofdecreasing abstraction, we may introduce di�erent auxiliary assumptions that approxi-mate individual behavior depending on the type of social situation. For instance, if notonly the subjective values of some decision alternatives at hand, but also their relativeprobabilities are known, maximizing their expected value by weighting the subjective
23
2 Historical and Analytical Foundations of Social Action Theory
value of each alternative by its probability may be a reasonable strategy. If, however,these probabilities are not known, several decision heuristics � potentially yielding quitedi�erent results � have been proposed (Coombs et al., 1970, ch. 5; Lave and March,1975, pp. 140-143; Thorngate, 1980): There may be optimistic decision rules such asmaximax (�Maximize the maximum possible value!�), pessimistic decision rules such asmaximin (�Maximize the lowest possible value!�), minimum-variation decision rules suchas minirange (�Minimize surprise!�), or minimum-regret decision rules such as minimaxregret (�Minimize the maximum regret!�). All of them might be very rational in a par-ticular social situation.31 Hence, without additional auxiliary assumptions that amendthe empty principle of rationality, mechanism-based explanations would stand at risk ofbeing either theoretically underspeci�ed and tautological, or unrealistic.Getting back to Hedström's (2005) very basic DBO model outlined above, the author
lays emphasis on the fact that rational choice theory can be regarded as �a speci�c typeof DBO theory� (Hedström, 2005, p. 41). Hence, I will �rst summarize the author'spresentation of di�erent types of social mechanisms along the basic entities of DBOtheory. Where required, however, I will then add the necessary bridge assumptionsin order to reconstruct the implied social mechanisms in the four papers at hand (seesection 4).
Types of social mechanisms While behavioral patterns (to be accounted for by so-ciological theory) can be split up in environmental e�ects, selection e�ects, and socialinteraction e�ects (Hedström, 2005, p. 47), cautious readers of Weber might think ofhis famous umbrella example32 whereby he illustratively distinguishes uniform humanbehavior from uniform social action and therefore accompany the author in his con-clusion that only the latter type of pattern will be the one to be accounted for bysocial mechanisms.33 Within the pattern of social interaction e�ects, desire-mediated,belief-mediated, and opportunity-mediated interaction can be distinguished and form thedimensions wherein di�erent types of social mechanisms can be classi�ed.
1. The seminal case of a belief-mediated mechanism is Merton's idea of a self-ful�llingprophecy (Merton, 1948) according to which initially false beliefs lead to an out-come that makes the false beliefs come true. In the example Merton (1948) uses,he asks the reader to think of a bank that is untruly said to be bankrupt. Oncethe rumor is in the world, the bank's clients will all but hurry up to withdraw theirsavings � which might then unexpectedly lead to the bank's actual insolvency.
31Below I will brie�y discuss how rational-choice-based theories on social inequality in educationalopportunities (Breen and Goldthorpe, 1997; Esser, 1999) relate to particular decision heuristics (cf.section 3).
32�Thus, if at a beginning of a shower a number of people on the street put up their umbrella at thesame time, this would not ordinarily be a case of action mutually oriented to that of each other, butrather of all reacting in the same way to the like need of protection from the rain� (Weber, 1968, p.23).
33I am not satis�ed with Hedström's (2005) conclusion to exclude selection e�ects from mechanism-based explanations. In the applied part of this introductory chapter (section 4), I will come back toa mechanism-based reconstruction of potential selection e�ects in two of the four papers at hand.
24
I. Causes and E�ects of Teachers' Evaluations: A Theoretical Primer
In course of the self-ful�lling prophecy, the bank crash might be ampli�ed byan additional mechanism of rational imitation: The higher the number of othersperceived by an individual who withdraw their savings, the higher the individual'sown probability to do likewise (cf. Hedström, 2005, p. 48f.). It is evident that themechanism of rational imitation strongly hinges on the distribution of individualthresholds (Granovetter, 1978; Granovetter and Soong, 1983) in that for a more'jumpy' person, the observation of only a few others withdrawing their savings maysu�ce to make her join, while a more 'relaxed' coeval might only react if alreadya majority of persons participated in the bank run.34
Another very-well known example of a belief-mediated mechanism is Festinger's(1957) theory of cognitive dissonance.35 The crucial idea behind that particulartype of social mechanism is that if an individual is exposed to two cognitive ele-ments opposing each other, a mental state of cognitive dissonance occurs. Sincestates of cognitive dissonance are costly in psychological terms, the individualstrives to avoid them (also see Hedström, 2005, p. 51). For instance, a personholding a liberal political position might change her opinion (or at least modifyit) if a signi�cant other she interacts with, or the media she is exposed to, hold aconservative view � and reversely (see e.g. Beck, 1991; Mutz, 2002; Feldman andPrice, 2008). Another option would be to persuade others of one's own opinion(Hedström, 2005, p. 51) � which might of course be more challenging dependingon the number of people one interacts with.36
2. The second type of social mechanisms are desire-mediated mechanisms. Othersdoing A may increase my probability of doing A if i) their doing A in�uenceshow strongly I desire A; ii) I desire to be like (or unlike) them; or iii) I believethat doing the same as they do increases (or decreases) my chances of getting B,which I desire (Hedström, 2005, p. 52). While subtypes i) and ii) � di�ering fromeach other in that in i), actions are causes, and in ii), actions are objects of egosdesires � the actor has a primary desire to act in accordance with others, in iii),the desire is of a secondary type (ibid). Examples for the di�erent subtypes mightbe i) the choice of a mobile phone network contract given that same-network callsare cheaper than others; ii) adoption of fashion (or other) trends from celebrities;iii) joining a political party in order to increase one's chances to obtain a particularoccupational position.
3. Finally, opportunity-mediated mechanisms occur if individuals' opportunity struc-ture is the essential cause of their action. In contrast to simple environmentale�ects (such as rainfall), opportunity-mediated mechanisms are also the outcome
34Granovetter's threshold model is also a useful tool for specifying the mechanism of imitation regardingthe emergence of social movements (Opp, 1991; Braun, 1995).
35See Heider (1946) for a similar idea published before Festinger (1957).36Note that the mechanism of dissonance reduction may also be subsumed beneath the concept of a
desire-mediated mechanism when ego does not adjust her beliefs, but her wishes or wants accordingto those of her signi�cant others.
25

2 Historical and Analytical Foundations of Social Action Theory
of social interaction. For instance, considering the example of rational imitationgiven before, in the model of individual thresholds, the number of other peoplewho have already acted (e.g. withdrawn their earnings, joined a social movement,etc.) are of course part of ego's opportunity structure � but further exogenousparameters may in�uence both ego's and alter's individual threshold (e.g. global�nancial crises, or a nation's level of repression).37
Figure 1 is taken from Hedström (2005, p. 59) and summarizes several types of socialmechanisms. The upper half of the �gure has a more illustrative intention in introducingdi�erent belief- and desire-mediated mechanisms for a single actor's states of mind. Forinstance, in case of wishful thinking, the actor tends to desire what she beliefs. A soccerfan desperately believing her team to win the next match would be an example. Anexample for adaptive desire formation is given by Elster (2007, p. 176): �If beautifulwomen reject my advances, I may console myself by the thought that by virtue of theirnarcissism they are actually the least desirable partners.�The lower half of �gure 1 will provide more useful for the following reconstruction of the
social mechanisms in the four papers of this volume (section 4) in that social mechanismsinvoked by both actors' states of mind and opportunities during social interaction areaddressed. For instance, the mechanism of dissonance reduction takes e�ect via alter's Aj
in�uencing ego's wanting of Ai (while ego's beliefs remain constant). Regarding rationalimitation, Hedström et al. (1998) provides the example of restaurant visitors using thefact whether a restaurant is crowded as an indicator of the menu quality � which iswhy crowded restaurants are desired more. And �nally, the self-ful�lling prophecy ischaracterized by a concatenation of at least two distinct belief-mediated mechanismswith constant desires.
Interim conclusion Whereas in variable sociology (cf. Esser, 1996b), causation is con-founded with signi�cant correlations between variables, the generative-process traditionin sociology strives to approximate causation by uncovering some process that producescorrelations between variables (Goldthorpe, 2001). Proponents of mechanism-based ex-planations refer to this procedure by invoking the image of �opening the black box andshowing the cogs and wheels of the internal machinery� (Elster, 1985, p. 5). Morespeci�c de�nitions of social mechanisms di�er according to the dimensions of i) observ-ability; ii) law-likeness; and iii) conceptual level of analysis. Promising (though notnecessary) action theories to be used for mechanism-based explanations are models ofrational action theory which can be distinguished according to whether they i) havestrong rather than weak rationality requirements; ii) focus on situational rather thanprocedural rationality; and iii) claim to provide a general rather than a special theoryof action (Goldthorpe, 1998). Social mechanisms as understood here may consist of
37One example given by Hedström (2005, p. 55) concerns the explanation of di�erences in socialmobility rates (between nations, or over time) by recurring to di�erences in mobility opportunitiesin terms of di�ering occupational or class distributions. I will come back to this issue in the nextsection.
26
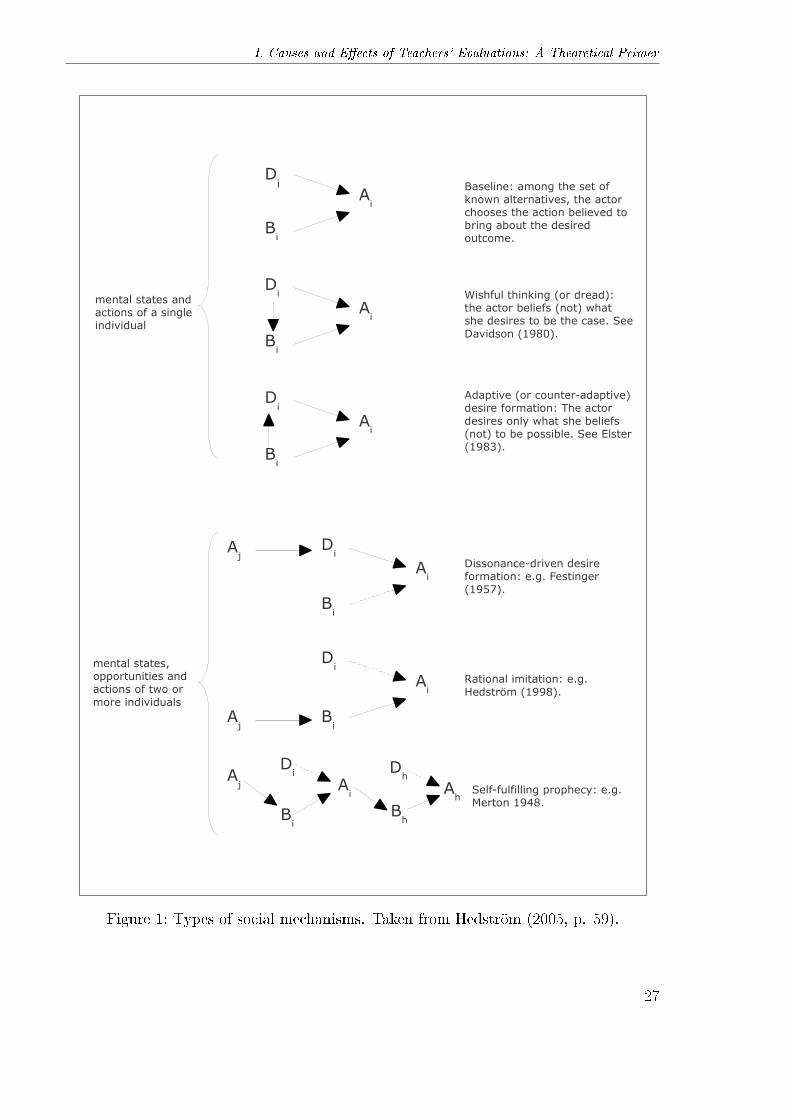
I. Causes and E�ects of Teachers' Evaluations: A Theoretical Primer
Bi
Di
Ai
Di
Bi
Ai
Di
Bi
Ai
mental states and actions of a single individual
Baseline: among the set of known alternatives, the actor chooses the action believed to bring about the desired outcome.
Wishful thinking (or dread): the actor beliefs (not) what she desires to be the case. See Davidson (1980).
Adaptive (or counter-adaptive) desire formation: The actor desires only what she beliefs (not) to be possible. See Elster (1983).
Di
Bi
Ai
Aj
Di
Bi
Ai
Aj
Di
Bi
Ai
Aj
Bh
Dh
Ah
Rational imitation: e.g. Hedström (1998).
Self-fulfilling prophecy: e.g. Merton 1948.
Dissonance-driven desire formation: e.g. Festinger (1957).
mental states, opportunities and actions of two or more individuals
Figure 1: Types of social mechanisms. Taken from Hedström (2005, p. 59).
27
3 Life Chances, Meritocracy, and Inequality in Educational Opportunities
smaller entities (with decreasing chance of observability the more �ne-grained the mech-anism; see Machamer et al., 2000; Mayntz, 2004), should therefore not be equated withthe covering-law model but �t within the model of structural individualism (Wippler,1978; Lindenberg, 1990). The action theory of choice is one of intermediate strengthwith strong bonds to situational restrictions (Goldthorpe, 1998). The gold standardof Occam's Razor suggests to start with a simpli�ed version that may be extended bybridge assumptions where found to be unrealistic (Lindenberg, 1990). A very basic de-sires, beliefs and opportunities model su�ces to classify the most general types of socialmechanisms such as self-ful�lling prophecies, rational imitation or cognitive dissonance(Hedström, 2005). Before belief- and opportunity-mediated mechanisms will prove use-ful for approximating the causes and e�ects of teachers' evaluations in the four papersof this volume, I will �rst summarize the discourse of whether educational systems areor should be meritocratic, and I will then contrast this discourse with contemporarytheories of inequality in educational opportunities and their implied social mechanisms.
3 Life Chances, Meritocracy, and Inequality in
Educational Opportunities
Having outlined the above foundations in the philosophy of science, in this section, I willbegin with Max Weber's de�nition of social class as shaping individuals' life chances,and I will then discuss the notion of meritocracy that is still thought to be a justi�edmechanism for the allocation of societal positions. Quite contrarily, theories of socialinequalities in educational opportunities (IEO) keep laying emphasis on the fact thattheoretical accounts simply reducing status attainment processes on individuals' meritfall too short in neglecting considerable social background e�ects. This sets the groundfor the subsequent reconstruction of the social mechanisms approximating the causesand e�ects of teachers' evaluations as one of students' signi�cant others in their statusattainment process (measured here in terms of educational transitions; see section 4).
Life chances Just as in the case of the theoretical foundations of social sciences ingeneral, let us begin with a well-known quotation of Max Weber. His de�nition of socialclass reads as follows:
�We may speak of a �class� when (1) a number of people have in common aspeci�c causal component of their life chance, insofar as (2) this component is rep-resented exclusively by economic interests in the possession of goods and opportu-nities for income, and (3) is represented under the conditions of the commodity oflabor markets. This is �class situation�. It is the most elemental economic fact thatthe way in which the disposition over material property is distributed among a plu-rality of people, meeting competitively in the market for the purpose of exchange,in itself creates speci�c life chances� (Weber, 2002, p. 33f., orig. quotations, myitalics).
28
I. Causes and E�ects of Teachers' Evaluations: A Theoretical Primer
What becomes evident from this quotation is that Weber regards class situation asbeing determined by market situation; that is, people's position in the market itself(determined by their disposition over property) is the crucial factor for class positionswith their respective life chances. From a methodological point of view, a pleasantimplication of this classi�cation is that the analysis of individuals' life chances can beaccomplished by means of economic instruments such as rational action theory, whichwill be discussed below. From a normative point of view, the question that of coursearises from Weber's de�nition is how society should equip individuals with particularlife chances.As Davis and Moore (1945, p. 242) have argued, it is inevitable for each society to deal
with two problems: 1) Why do di�erent positions carry di�erent degrees of prestige, and2) how do certain individuals get into these positions? Regarding the �rst question, theanswer is that some positions are more agreeable, functionally more important and/orrequire more talent than others; and society keeps these positions attractive by di�erentkinds of rewards (sustenance and comfort; humor and diversi�cation; self-respect andego expansion).Regarding the second question, the answer to the �rst question already revealed that
individuals' talent is an issue; and therefore, former ascriptive selection mechanisms aremore and more replaced by others that are based on individuals merits :Already in Plato's Meno (Plato, 2009) we come to know that even a slave who has not
received any form of geometric education before can solve a relatively complex geometrictask38, and also in his Republic, Plato (1991) shows a comparable line of arguing in thateach social position should be �lled by talent and not by social origin (Riesman, 1967).39
Similarly, also Weber (1968, p. 241) observes (also see Becker and Hadjar, 2011, p. 55f.):
Today, the certi�cate of education becomes what the test for ancestors has beenin the past, at least where the nobility has remained powerful: a prerequisite forequality of birth, a quali�cation for a canonship, and for state o�ce. The devel-opment of the diploma from universities, and business and engineering colleges,and the universal clamor for the creation of educational certi�cates in all �eldsmake for the formation of a privileged stratum in bureaus and in o�ces (...) Whenwe hear from all sides the demand for an introduction of regular curricula andspecial examinations, the reason behind it is, of course, not a suddenly awakened`thirst for education' but the desire for restricting the supply for these positionsand their monopolization by the owners of educational certi�cates. Today, the`examination' is the universal means of this monopolization, and therefore, exam-inations irresistibly advance. As the education prerequisite to the acquisition of
38The task consists of taking a triangle of given size and using it to construct a triangle of double size.With a little help by Socrates, the slave �nally accomplishes the task (Meno, ch. 16, 17, 19).
39In contrast, the probably most prominent criticism of this line of reasoning in contemporary practicalphilosophy is held by Rawls (1971) who understands his second principle of justice � social andeconomic inequalities should be of the greatest bene�t to the least-advantaged members of society;and o�ces and social positions should be open according to conditions of fair equality of opportunity� as an explicit restriction of o�ces and social positions merely distributed based on individuals'merit (also see Rawls, 1974; Daniels, 1978).
29
3 Life Chances, Meritocracy, and Inequality in Educational Opportunities
the educational certi�cate requires considerable expense and a period of waitingfor, full remuneration, this striving, means a setback for talent (charisma) in favorof property. For the `intellectual' costs of educational certi�cates are always low,and with the increasing volume of such certi�cates, their intellectual costs do notincrease, but rather decrease.
A selection mechanism that is based on individuals' educational certi�cates is denotedas a meritocratic selection. While Weber's analysis of modern credentialism did not ob-scure its monopolistic implication, until quite recently, the notion of meritocracy usuallyhad a positive connotation � serving as the benchmark according to which an educa-tional system were to be judged. However, as the next section may show, the demandfor meritocracy is itself a highly ambiguous concept.
Meritocracy In 1958, the sociologist Michael Young published his satirical novel TheRise of the Meritocracy, 1870-2033. An Essay on Education and Inequality (Young,1958). This �manuscript� pretending to be written in 2033, reports the �nal victoryof the principle of achievement over the principle of ascription. While before individu-als obtained their positions in society by assignment or inheritance, now positions aredistributed according to individuals' I.Q. and e�ort. However, while before, talent wasdistributed almost equally among di�erent groups of society, in the meritocracy, on theone hand, an 'elite caste' of the talented is created, and on the other hand, the untalentedform an underclass of known inferiors (cf. Bell, 1972, p. 29f.).Although Young's meritocracy is reported to have broken down in 2034, Bell (1972,
p. 30f.) rightly observes that the post-industrial society is, in its self-conception, ameritocracy: Educational certi�cates as �human capital� (Becker, 1962) serve as pass-ports into the most prestigious positions, while ascriptive factors such as heritage areonly an imperfect proxy for an applicant's talent. In this respect, individuals' merit isconceptualized by their tested competence and ability � which is usually operationalizedas individuals' IQ or their achievement test results (Ho�er, 2001). The crucial assump-tion of meritocratic selection is that there is �a close relation between achievement andintelligence and between intelligence and its measurement on the Intelligence Quotientscale� (Bell, 1972, p. 31). To be precise, talent (I.Q.) and merit (achievement) are re-quired to be examined together since �[t]he lazy genius is not one� (Goldthorpe, 1996b,p. 258), while both concepts are supposed to be measurable by standardized tests. TheI.Q., in turn, is assumed to follow a bell-shaped distribution, and the top achievers in aparticular age category are suspected to be actually the most talented (ibid.).For about one and a half century, psychometricians have investigated how intelligence
could best be measured. Sir Francis Galton (1869) is said to be the �rst scholar who pos-tulated a construct of general mental ability; and thanks to progress in the developmentof factor analysis, Spearman (1904) was able to extract a general factor called psycho-metric g. While Spearman followed a more narrow conception of general ability, Galtonunderstood the general factor more broadly in essentially biological and evolutionaryterms (Jensen, 1986). Jensen himself can be denoted to be a follower of the latter tradi-tion, believing in a distinct 'reality' of g apart from its psychometric relevance (Jensen,
30
I. Causes and E�ects of Teachers' Evaluations: A Theoretical Primer
1987), and also believing in both the heredity of g and a priori di�erences (i.e. that can-not be explained by environmental factors such as socialization) in intelligence betweenethnicities (Jensen, 1969, 1974; Jensen and Reynolds, 1982; Rushton and Jensen, 2005).Although the question of test fairness has been an issue discussed for decades (cf.
Thorndike, 1971; Linn, 1973), Jensen's position culminated in a monograph titled TheBell Curve: Intelligence and Class Structure in America (Herrnstein and Murray, 1994)that addressed the heredity thesis to a broader audience. The book gained a lot ofpublicity in the US (and still casts its shadow onto public debates in Germany40) � butit was also exposed to systematic critique by educational sociologists. While Herrnsteinand Murray (1994) aimed to show that intelligence is a far more important predictorof occupational success as environmental factors such as parental socioeconomic status(SES), several authors objected against this conclusion due to several reasons. First,Daniels et al. (1997) provide critique at the thesis that intelligence is predominantlydetermined by genes. As the authors elaborately discuss, the genes that potentiallya�ect IQ are inherited, while IQ itself is not (p. 47).41 Likewise, the argument implicitlydefended by Herrnstein and Murray (1994) that ethnic di�erences in IQ test scores weredue to genetic di�erences and not to environmental factors is also revealed as beinguntenable (ibid., p. 62f.; also see Loehlin et al., 1973; Tizard, 1974; Scarr et al., 1977).42
Second, Heckman (1995) notes that the g factor was completely overestimated in af-fecting respondents' social outcomes, and that the view of Herrnstein and Murray (1994)that intelligence could not be manipulated by educational interventions is erroneous sinceintelligence increases with additional years of schooling (Neal and Johnson, 1996). Re-garding the relative importance of intelligence and social backgrounds, respectively, onlater social outcomes, both Fischer et al. (1996) and Korenman and Winship (2000)provide extensive re-analyses of the data used by Herrnstein and Murray (1994) andshow that if a more realistic (i.e. richer) set of social background variables is considered,intelligence is far from being a more important predictor of later social outcomes thansocial backgrounds.Blowing in the same horn as Herrnstein and Murray (1994), Saunders (1997) pos-
tulates that individuals' e�ort and ability outweigh (social) environmental factors inpredicting National Child Development Study (NCDS) participants' occupational classat age 33. Furthermore, the fact that in Saunders' (1997) analyses the correlation be-tween ability and class of destination is higher than the one of ability and the class oforigin is interpreted as �that the occupational class system is to some extent selecting
40In 2010, the former state �nance minister of Berlin, Thilo Sarrazin, published a controversial bookwherein he sketches a pessimistic picture of the potential consequences of demographic change, agrowing underclass and increasing migration to Germany from Muslim countries (Sarrazin, 2010).His discussion about the heredity of intelligence (Sarrazin, 2010, ch. 3) mainly stems from The BellCurve (cf. Sarrazin, 2010, p. 419).
41Note that the meta-analysis by Daniels et al. (1997) estimates IQ heritability e�ects of .34 (in astricter test) to .48 by maximum (in a weaker test) � which is a far cry from the values of .5 to .8as declared by Herrnstein and Murray (1994, and naïvely parroted by Sarrazin, 2010).
42Goldberger and Manski (1995, p. 771) pointedly summarize the discussion in The Bell Curve: �Tous, HM's [i.e. Herrnstein & Murray's; DB ] treatment of genetics and race is akin to standing up ina crowded theater and shouting, 'Let's consider the possibility that there is a FIRE!� '
31
3 Life Chances, Meritocracy, and Inequality in Educational Opportunities
by ability irrespective of social class origins� (Saunders, 1997, p. 281).In contrast, Breen and Goldthorpe (1999) provide a re-analysis of the NCDS data
used by Saunders (1997) and get to the conclusion that �while merit certainly counts inmobility processes, children of disadvantaged class origins have to display far more meritthan do children of more advantaged origins in order to attain similar class positions�(Breen and Goldthorpe, 1999, p. 21). Controlling for several covariates, to get the samescore on the Hope-Goldthorpe scale of occupational desirability, working-class childrenwould need to outperform middle-class children by approximately one standard deviationin their score in the General Ability Test. Hence, just as in case of the Bell Curvedebate, this little discussion also ended in a rejection of the attempt of overemphasizingthe impact of 'merit' in educational mobility.43
In sum, and in the words of Goldthorpe (1996b), the �sociological fantasy� (p. 255)of meritocracy, as introduced by Young (1958), �has engendered both fears and hopes�(p. 280), but �its satirical and critical quality was in fact largely overlooked, or at allevents, discounted� (ibid.). From a more critical point of view, one can also call it�philosophically problematic and morally questionable� (Goldthorpe and Jackson, 2005,p. 17).Solga (2005) characterizes meritocracy as a normative self-de�nition of modern soci-
eties in order to legitimize social inequalities � which is accomplished via �ve di�erentmeans (also see Becker and Hadjar, 2011, p. 52-54): i) the 'natural' foundation of socialinequalities on biological di�erences in intelligence or talent (e.g. Jensen, 1969; Herrn-stein and Murray, 1994); ii) the depiction of inequality as a functional prerequisite ofsociety (e.g. Davis and Moore, 1945); iii) the necessity of organized educational processeswith certi�cates as signals of individuals' talent; iv) an understanding of social inequalityas a problem of individual optimization; and v) an emphasis on the objective characterof achievement.While the �rst point has been extensively discussed above, and items ii) and iii) would
more lead into the �eld of political philosophy, the next section on the social mechanismsbehind the concept of inequality in educational opportunities (IEO) will provide a criticalassessment of the last two points.
Inequality in educational opportunities On the one hand, without considering envi-ronmental factors, the heritability e�ect on IQ would be overestimated; and on the otherhand, even heritability itself is environment-dependent (Daniels et al., 1997). Hence, inthis section I will discuss the most in�uential theories about e�ects of individuals' socialenvironment on their educational opportunities. In the terminology introduced by Mer-ton (1987) and Goldthorpe (2001), the generative processes of the phenomenon of IEOhave to be outlined.The Coleman Report (Coleman, 1966) is one of the �rst and still one of the most
important large-scale studies of social inequality in educational opportunities. While
43For additional empirical analyses of the education-based meritocracy hypothesis see Goldthorpe (2003)and Goldthorpe and Jackson (2008).
32
I. Causes and E�ects of Teachers' Evaluations: A Theoretical Primer
its crucial hypothesis that student socioeconomic status has a higher impact on studentachievement than school di�erences � resulting from di�erences in resource allocation �has fostered a viral debate (Cain and Watts, 1968; Bowles and Levin, 1968; Coleman,1968; Moynihan, 1968; Aigner, 1970; Cain andWatts, 1970; Coleman, 1970; Carver, 1975;Eysenck, 1975), the fact that students' social backgrounds are an important factor in de-termining achievement di�erences also build a main argument in the Wisconsin model ofstatus attainment (Sewell et al., 1969, 1970). Its crucial outcome is respondents' occupa-tional attainment in adulthood, and its explananda are i) respondents' prior educationalattainment, ii) their prior aspirations regarding the prospective occupation in the fu-ture, iii) their educational aspirations (measured by the intention to attend college), iv)the in�uence of signi�cant others such as parents, teachers and friends, v) the qualityof academic performance measured by students' rank in high school class, vi) parentalSES, and vii) respondents' mental ability measured by results of a Henmon-Nelson test(Sewell et al., 1969, p. 85). In their path model � which was later exposed to consid-erable critique since it was accused to reduce causality to correlations (Freedman, 1987;Hedström and Swedberg, 1996) � based on a sample of farm-reared men from Wisconsin�rst studied in 1957 and re-sampled in 1964, the standardized beta coe�cients revealthat the strongest path is leading from mental ability to educational performance (.62),but the next two highest coe�cients are signi�cant others' in�uence on both respon-dents' educational and occupational aspirations (.45 and .42, respectively). Next in sizecomes a direct e�ect of signi�cant others' impact on academic performance (.39), a pathof prior educational attainment on later occupational attainment, and a direct e�ect ofeducational aspirations on educational attainment (cf. Sewell et al., 1969, table 3).Shortly later, Sewell et al. (1970) were able to replicate the main �ndings of their
1969 model based on a more general sample of the Wisconsin data since they had justto add a few more arrows (e.g. from mental ability to signi�cant others' in�uence) toadapt the model to the extended sample. Following this revised version of the Wisconsinmodel, students' aspirations and expectations became the central mediating variable instatus attainment research (Morgan, 2006, p. 1529). While the spread of Bourdieu'stheory of cultural capital (Bourdieu, 1973) in a way counterbalanced the stream of re-search presuming a direct association between students' aspirations and their educationalattainment (Morgan, 2006), another theory still casts its shadow onto contemporary re-search on inequality in educational opportunities: Boudon's distinction between primaryand secondary e�ects of social inequality.In 1974, Boudon published his monograph about Education, Opportunity, and Social
Inequality: Changing Prospects in a Western Society (Boudon, 1974). While some ofits conclusions regarding the relationship between inequality of educational opportuni-ties (IEO) and inequality of social opportunities (ISO) were exposed to various criticalremarks (Hauser, 1976; also see Boudon's (1976) reply), Boudon's distinction betweenprimary and secondary e�ects of social inequality became one of the most in�uential con-cepts in contemporary quantitatively-oriented IEO research (see e.g. Meulemann, 1979;Breen and Rottman, 1995; Erikson and Jonsson, 1996a,b; Goldthorpe, 1996a; Breen andGoldthorpe, 1997; Müller-Benedict, 1999; Becker, 2000; Breen and Jonsson, 2000; Needand De Jong, 2001; Solga, 2002; Becker, 2003; Erikson et al., 2005; Becker and Schubert,
33
3 Life Chances, Meritocracy, and Inequality in Educational Opportunities
2006; Jaeger, 2007; Müller-Benedict, 2007; Pietsch and Stubbe, 2007; Stocké, 2007; VanDe Werfhorst and Van Tubergen, 2007; Maaz et al., 2008; Schneider, 2008; Becker andHecken, 2009a,b; Breen et al., 2009; Kloosterman et al., 2009; Erikson and Rudolphi,2010; Glaesser and Cooper, 2011; Hillmert and Jacob, 2010; Neugebauer, 2010; Schubertand Becker, 2010; Tolsma et al., 2010; Karlson and Holm, 2011; Morgan, 2011; Modinet al., 2013; Morgan and Winship, 2012; Hillmert, 2013).44
The primary e�ect of educational inequality states that the lower educational successof lower-SES children may be due to their lower capabilities � be they de�ned as edu-cational interests, intellectual skills, e�ort or motivation (Müller-Benedict, 2007). Partof the primary e�ect may indeed be genetic in the sense of Jensen (1969) and Herrn-stein and Murray (1994), but another, presumably greater part of the above-mentionedcharacteristics is acquired during socialization (Erikson and Jonsson, 1996a, p. 10f.).45
The secondary e�ect, contrarily, operates via stratum-speci�c di�erences in educa-tional decision making due to di�erential opportunity-cost structures, and Boudon'scrucial assumption is that secondary e�ects still take place once primary e�ects havebeen controlled for (Nash, 2005). In Boudon's (1981, p. 191) words:
�The subject's class of origin (or the class to which a family now belongs) willcrucially a�ect his choices of one or the other option. If their current success ismediocre, the family unit will consider itself 'satis�ed' if the child has reached anacademic level enabling him to aspire to a social status equal or higher than hisown, even if this status is not especially high. A well-placed family unit will onthe other hand strive (I ought to add: more often than not) to 'push' the child sothat he doesn't fail (even if he doesn't enjoy a greater success).�
As mentioned, the idea that aspirations may vary by social class has not been inventedby Boudon. Actually, already Hyman (1953) postulated that lower-class individuals as-pire lower aims than higher-class individuals (which he attributes to class-speci�c valuesystems), and Keller and Zavalloni (1964) respeci�ed his approach by introducing theidea of class-speci�c relative distances towards particular values. However, while Kellerand Zavalloni (1964, p. 60) on the one hand understand social class as an �interveningvariable between individual ambition and social achievement�, and on the other handdo not entirely discard the value-relatedness of aspirations, Boudon (1974) overcomesthis shortcoming by �rst modeling aspirations as a social mechanism that is located be-tween social class and (educational) achievement; and second, by relating class-speci�cdi�erences in aspirations to di�erences in utility considerations (Erikson and Jonsson,1996a, p. 13f.).46 Hence, Boudon not only argues against both reductionist covering-law44For further reviews of the literature see Kristen (1999); Stocké (2010); Becker (2012); Solga and
Becker (2012).45In contrast, see Lucchini et al. (2013) for a recent contribution that once again strives to take up
the cudgels for a genetic explanation of IEO. Note, however, that their variance decompositionapproach provides nothing more than a black-box explanation (which the authors themselves partlyacknowledge; cf. Lucchini et al., 2013, p. 5) without revealing the particular mechanisms behind.
46Note, however, that Erikson and Jonsson (1996a, p. 28f.) still observe a value assumption in Boudon'stheory, �namely that, given the social distance traveled, the negative e�ect of social demotion onbene�ts is higher than the corresponding positive e�ect on social ascent�.
34
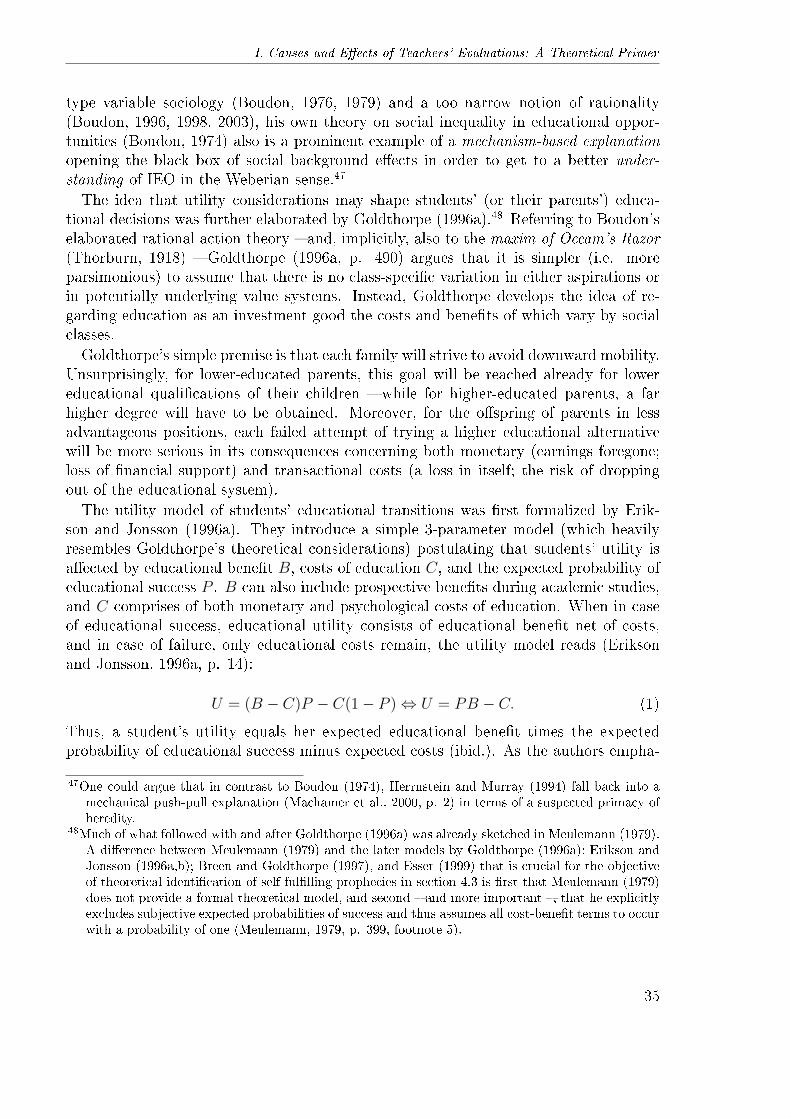
I. Causes and E�ects of Teachers' Evaluations: A Theoretical Primer
type variable sociology (Boudon, 1976, 1979) and a too narrow notion of rationality(Boudon, 1996, 1998, 2003), his own theory on social inequality in educational oppor-tunities (Boudon, 1974) also is a prominent example of a mechanism-based explanationopening the black box of social background e�ects in order to get to a better under-standing of IEO in the Weberian sense.47
The idea that utility considerations may shape students' (or their parents') educa-tional decisions was further elaborated by Goldthorpe (1996a).48 Referring to Boudon'selaborated rational action theory � and, implicitly, also to the maxim of Occam's Razor(Thorburn, 1918) � Goldthorpe (1996a, p. 490) argues that it is simpler (i.e. moreparsimonious) to assume that there is no class-speci�c variation in either aspirations orin potentially underlying value systems. Instead, Goldthorpe develops the idea of re-garding education as an investment good the costs and bene�ts of which vary by socialclasses.Goldthorpe's simple premise is that each family will strive to avoid downward mobility.
Unsurprisingly, for lower-educated parents, this goal will be reached already for lowereducational quali�cations of their children � while for higher-educated parents, a farhigher degree will have to be obtained. Moreover, for the o�spring of parents in lessadvantageous positions, each failed attempt of trying a higher educational alternativewill be more serious in its consequences concerning both monetary (earnings foregone;loss of �nancial support) and transactional costs (a loss in itself; the risk of droppingout of the educational system).The utility model of students' educational transitions was �rst formalized by Erik-
son and Jonsson (1996a). They introduce a simple 3-parameter model (which heavilyresembles Goldthorpe's theoretical considerations) postulating that students' utility isa�ected by educational bene�t B, costs of education C, and the expected probability ofeducational success P . B can also include prospective bene�ts during academic studies,and C comprises of both monetary and psychological costs of education. When in caseof educational success, educational utility consists of educational bene�t net of costs,and in case of failure, only educational costs remain, the utility model reads (Eriksonand Jonsson, 1996a, p. 14):
U = (B − C)P − C(1− P )⇔ U = PB − C. (1)
Thus, a student's utility equals her expected educational bene�t times the expectedprobability of educational success minus expected costs (ibid.). As the authors empha-
47One could argue that in contrast to Boudon (1974), Herrnstein and Murray (1994) fall back into amechanical push-pull explanation (Machamer et al., 2000, p. 2) in terms of a suspected primacy ofheredity.
48Much of what followed with and after Goldthorpe (1996a) was already sketched in Meulemann (1979).A di�erence between Meulemann (1979) and the later models by Goldthorpe (1996a); Erikson andJonsson (1996a,b); Breen and Goldthorpe (1997), and Esser (1999) that is crucial for the objectiveof theoretical identi�cation of self-ful�lling prophecies in section 4.3 is �rst that Meulemann (1979)does not provide a formal theoretical model, and second � and more important �, that he explicitlyexcludes subjective expected probabilities of success and thus assumes all cost-bene�t terms to occurwith a probability of one (Meulemann, 1979, p. 399, footnote 5).
35

3 Life Chances, Meritocracy, and Inequality in Educational Opportunities
size, two educational alternatives i and j can yield the same expected educational utility(PiBi = PjBJ) if Pi < Pj and Bi > Bj. However, a more risk averse person wouldalways opt for alternative i, notwithstanding the higher expected bene�t of alternativej.Breen and Goldthorpe (1997) specify the model by Erikson and Jonsson (1996a) more
precisely by introducing three educational outcomes on the one hand and class-speci�cstatus destinies on the other hand. While a presentation of the exact mathematics oftheir model is beyond the scope of this introduction, their main idea should be capturedthough: Even if continuing in education was not dependent on the costs of remaining atschool, and if there were no class-speci�c ability di�erences, service-class students wouldstill be more likely to continue a high level of education than working-class students.However, since evidence on primary e�ects of social inequality reveals class-speci�c
di�erences in both academic ability and resources, and students' subjective expectedprobability of successfully continuing the chosen school track can be assumed to be en-dogenously in�uenced by their academic ability, di�erences in transition propensitiesbetween the social classes will be further broadened than a more parsimonious explana-tion based on simple status-maintaining utility consideration would suggest.Hartmut Esser (1999) basically builds on several elements of both Erikson and Jon-
sson's (1996a) as well as Breen and Goldthorpe's (1997) respective models, but onethe one hand, he introduces additional parameters (such as the impact of the expectedstatus decline, once a chosen school track was not �nished with success, on parentaldecisions), and on the other hand, he splits up the extended model into two smallercomponents, which allows him to get to the following conclusion: A student opts for thehigher educational track if the expected educational motivation � consisting of the ex-pected educational bene�t and the expected status decline (times its impact on parentaldecisions) � exceeds the estimated investment risk � de�ned as the expected costs ofeducation weighted by the inverse of the subjective probability of educational success.Whether one favors a more parsimonious model, such as the initial proposition by Erik-
son and Jonsson (1996a), or a more complex explanation as the one by Esser (1999): Thecrucial point to be made here is that all of the above theoretical transition models openthe black box by introducing simple utility-based assumptions as the underlying socialmechanisms in order to obtain a better understanding of social inequality in educationalopportunities. In contrast to critique as it had been put forward against the early Wis-consin status attainment model (Hedström and Swedberg, 1996), signi�cant correlationsor regression estimates cannot be confounded with causality since the respective indica-tors will always have to be linked back to the underlying utility assumptions that shouldaccount for the empirical results.Dissecting the assumptions of the rational choice (or subjective expected uility =
SEU) model of parental educational decisions according to the terminology introducedby Hedström (2005) nicely illustrates its advantage regarding parsimoniousness: Whileparents' desires, i.e. their absolute educational and occupational aspirations are assumedto be constant among classes (Keller and Zavalloni, 1964; also see Meulemann, 1979,398, footnote 4), it is their beliefs about the expected bene�t of education, the perceivedamount of status decline, or the subjective expected probability of educational success
36
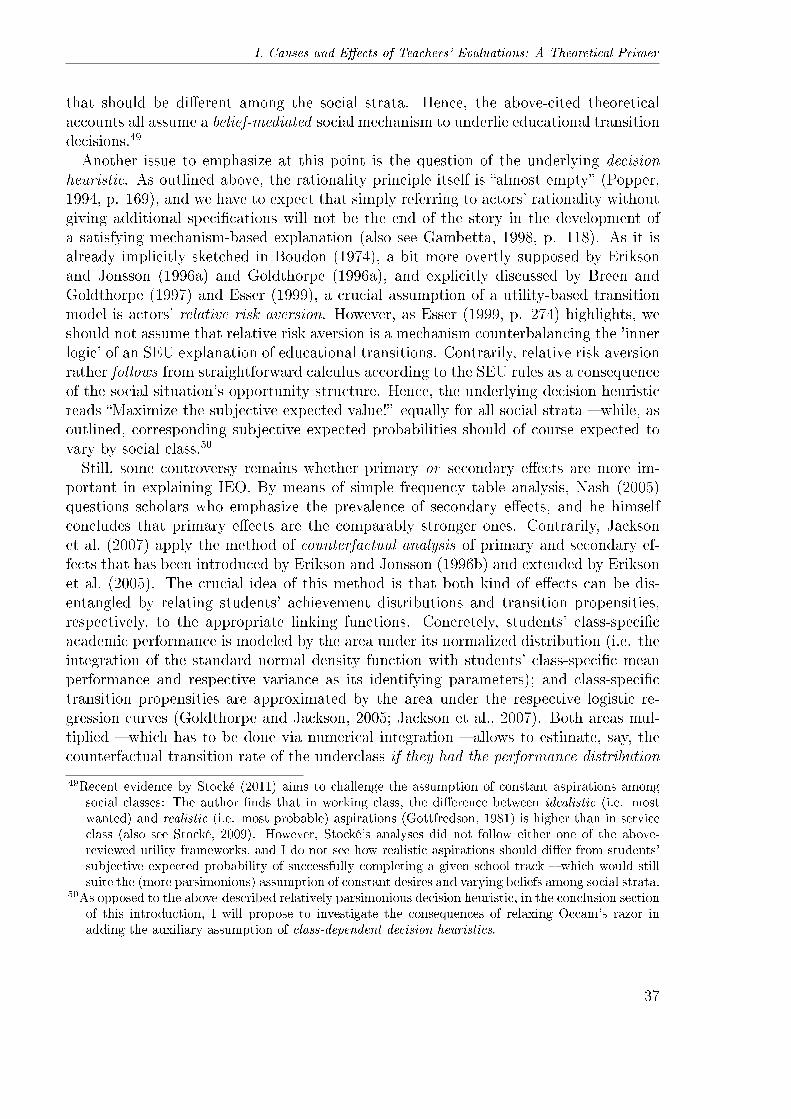
I. Causes and E�ects of Teachers' Evaluations: A Theoretical Primer
that should be di�erent among the social strata. Hence, the above-cited theoreticalaccounts all assume a belief-mediated social mechanism to underlie educational transitiondecisions.49
Another issue to emphasize at this point is the question of the underlying decisionheuristic. As outlined above, the rationality principle itself is �almost empty� (Popper,1994, p. 169), and we have to expect that simply referring to actors' rationality withoutgiving additional speci�cations will not be the end of the story in the development ofa satisfying mechanism-based explanation (also see Gambetta, 1998, p. 118). As it isalready implicitly sketched in Boudon (1974), a bit more overtly supposed by Eriksonand Jonsson (1996a) and Goldthorpe (1996a), and explicitly discussed by Breen andGoldthorpe (1997) and Esser (1999), a crucial assumption of a utility-based transitionmodel is actors' relative risk aversion. However, as Esser (1999, p. 274) highlights, weshould not assume that relative risk aversion is a mechanism counterbalancing the 'innerlogic' of an SEU explanation of educational transitions. Contrarily, relative risk aversionrather follows from straightforward calculus according to the SEU rules as a consequenceof the social situation's opportunity structure. Hence, the underlying decision heuristicreads �Maximize the subjective expected value!� equally for all social strata � while, asoutlined, corresponding subjective expected probabilities should of course expected tovary by social class.50
Still, some controversy remains whether primary or secondary e�ects are more im-portant in explaining IEO. By means of simple frequency table analysis, Nash (2005)questions scholars who emphasize the prevalence of secondary e�ects, and he himselfconcludes that primary e�ects are the comparably stronger ones. Contrarily, Jacksonet al. (2007) apply the method of counterfactual analysis of primary and secondary ef-fects that has been introduced by Erikson and Jonsson (1996b) and extended by Eriksonet al. (2005). The crucial idea of this method is that both kind of e�ects can be dis-entangled by relating students' achievement distributions and transition propensities,respectively, to the appropriate linking functions. Concretely, students' class-speci�cacademic performance is modeled by the area under its normalized distribution (i.e. theintegration of the standard normal density function with students' class-speci�c meanperformance and respective variance as its identifying parameters); and class-speci�ctransition propensities are approximated by the area under the respective logistic re-gression curves (Goldthorpe and Jackson, 2005; Jackson et al., 2007). Both areas mul-tiplied � which has to be done via numerical integration � allows to estimate, say, thecounterfactual transition rate of the underclass if they had the performance distribution
49Recent evidence by Stocké (2011) aims to challenge the assumption of constant aspirations amongsocial classes: The author �nds that in working class, the di�erence between idealistic (i.e. mostwanted) and realistic (i.e. most probable) aspirations (Gottfredson, 1981) is higher than in serviceclass (also see Stocké, 2009). However, Stocké's analyses did not follow either one of the above-reviewed utility frameworks, and I do not see how realistic aspirations should di�er from students'subjective expected probability of successfully completing a given school track � which would stillsuite the (more parsimonious) assumption of constant desires and varying beliefs among social strata.
50As opposed to the above-described relatively parsimonious decision heuristic, in the conclusion sectionof this introduction, I will propose to investigate the consequences of relaxing Occam's razor inadding the auxiliary assumption of class-dependent decision heuristics.
37
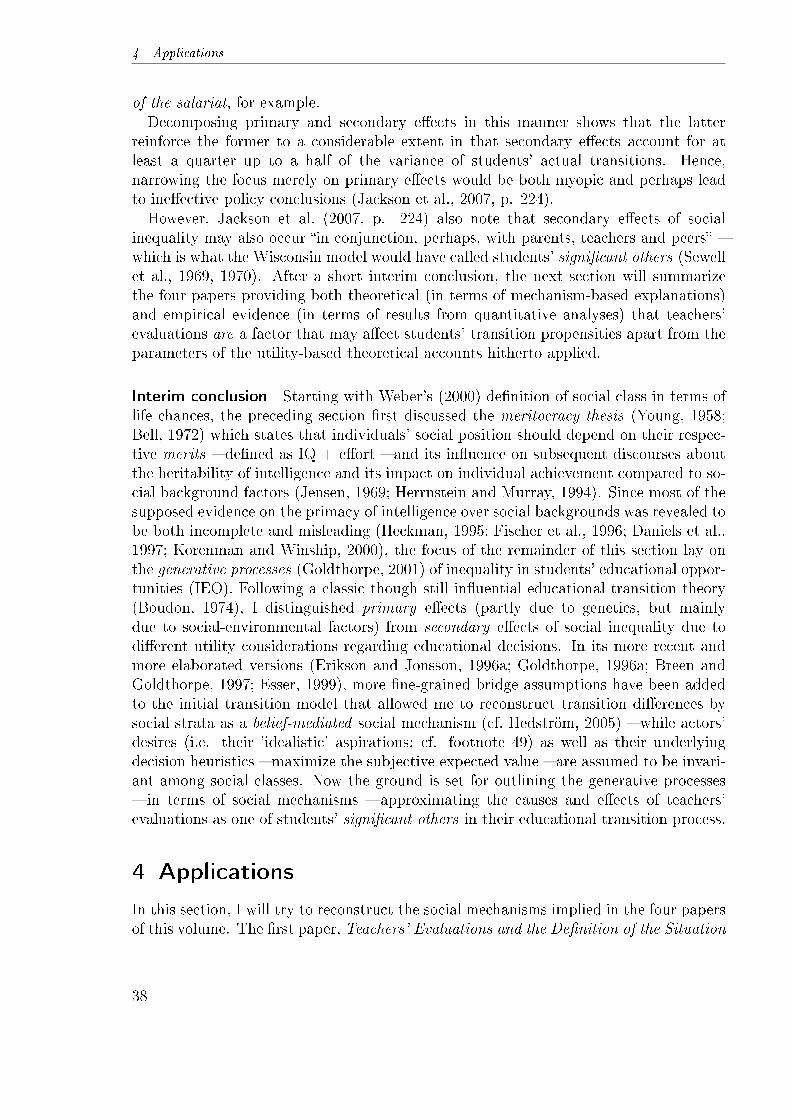
4 Applications
of the salariat, for example.Decomposing primary and secondary e�ects in this manner shows that the latter
reinforce the former to a considerable extent in that secondary e�ects account for atleast a quarter up to a half of the variance of students' actual transitions. Hence,narrowing the focus merely on primary e�ects would be both myopic and perhaps leadto ine�ective policy conclusions (Jackson et al., 2007, p. 224).However, Jackson et al. (2007, p. 224) also note that secondary e�ects of social
inequality may also occur �in conjunction, perhaps, with parents, teachers and peers� �which is what the Wisconsin model would have called students' signi�cant others (Sewellet al., 1969, 1970). After a short interim conclusion, the next section will summarizethe four papers providing both theoretical (in terms of mechanism-based explanations)and empirical evidence (in terms of results from quantitative analyses) that teachers'evaluations are a factor that may a�ect students' transition propensities apart from theparameters of the utility-based theoretical accounts hitherto applied.
Interim conclusion Starting with Weber's (2000) de�nition of social class in terms oflife chances, the preceding section �rst discussed the meritocracy thesis (Young, 1958;Bell, 1972) which states that individuals' social position should depend on their respec-tive merits � de�ned as IQ + e�ort � and its in�uence on subsequent discourses aboutthe heritability of intelligence and its impact on individual achievement compared to so-cial background factors (Jensen, 1969; Herrnstein and Murray, 1994). Since most of thesupposed evidence on the primacy of intelligence over social backgrounds was revealed tobe both incomplete and misleading (Heckman, 1995; Fischer et al., 1996; Daniels et al.,1997; Korenman and Winship, 2000), the focus of the remainder of this section lay onthe generative processes (Goldthorpe, 2001) of inequality in students' educational oppor-tunities (IEO). Following a classic though still in�uential educational transition theory(Boudon, 1974), I distinguished primary e�ects (partly due to genetics, but mainlydue to social-environmental factors) from secondary e�ects of social inequality due todi�erent utility considerations regarding educational decisions. In its more recent andmore elaborated versions (Erikson and Jonsson, 1996a; Goldthorpe, 1996a; Breen andGoldthorpe, 1997; Esser, 1999), more �ne-grained bridge assumptions have been addedto the initial transition model that allowed me to reconstruct transition di�erences bysocial strata as a belief-mediated social mechanism (cf. Hedström, 2005) � while actors'desires (i.e. their 'idealistic' aspirations; cf. footnote 49) as well as their underlyingdecision heuristics � maximize the subjective expected value � are assumed to be invari-ant among social classes. Now the ground is set for outlining the generative processes� in terms of social mechanisms � approximating the causes and e�ects of teachers'evaluations as one of students' signi�cant others in their educational transition process.
4 Applications
In this section, I will try to reconstruct the social mechanisms implied in the four papersof this volume. The �rst paper, Teachers' Evaluations and the De�nition of the Situation
38
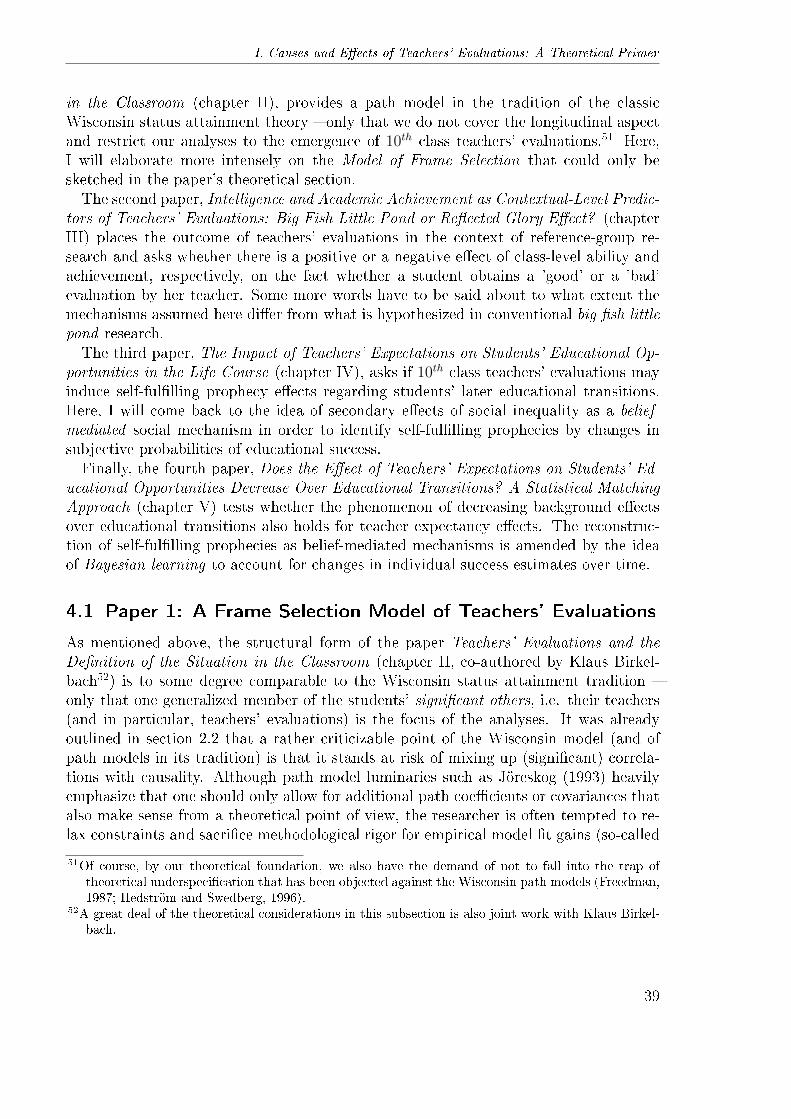
I. Causes and E�ects of Teachers' Evaluations: A Theoretical Primer
in the Classroom (chapter II), provides a path model in the tradition of the classicWisconsin status attainment theory � only that we do not cover the longitudinal aspectand restrict our analyses to the emergence of 10th class teachers' evaluations.51 Here,I will elaborate more intensely on the Model of Frame Selection that could only besketched in the paper's theoretical section.The second paper, Intelligence and Academic Achievement as Contextual-Level Predic-
tors of Teachers' Evaluations: Big Fish Little Pond or Re�ected Glory E�ect? (chapterIII) places the outcome of teachers' evaluations in the context of reference-group re-search and asks whether there is a positive or a negative e�ect of class-level ability andachievement, respectively, on the fact whether a student obtains a 'good' or a 'bad'evaluation by her teacher. Some more words have to be said about to what extent themechanisms assumed here di�er from what is hypothesized in conventional big �sh littlepond research.The third paper, The Impact of Teachers' Expectations on Students' Educational Op-
portunities in the Life Course (chapter IV), asks if 10th class teachers' evaluations mayinduce self-ful�lling prophecy e�ects regarding students' later educational transitions.Here, I will come back to the idea of secondary e�ects of social inequality as a belief-mediated social mechanism in order to identify self-ful�lling prophecies by changes insubjective probabilities of educational success.Finally, the fourth paper, Does the E�ect of Teachers' Expectations on Students' Ed-
ucational Opportunities Decrease Over Educational Transitions? A Statistical MatchingApproach (chapter V) tests whether the phenomenon of decreasing background e�ectsover educational transitions also holds for teacher expectancy e�ects. The reconstruc-tion of self-ful�lling prophecies as belief-mediated mechanisms is amended by the ideaof Bayesian learning to account for changes in individual success estimates over time.
4.1 Paper 1: A Frame Selection Model of Teachers' Evaluations
As mentioned above, the structural form of the paper Teachers' Evaluations and theDe�nition of the Situation in the Classroom (chapter II, co-authored by Klaus Birkel-bach52) is to some degree comparable to the Wisconsin status attainment tradition �only that one generalized member of the students' signi�cant others, i.e. their teachers(and in particular, teachers' evaluations) is the focus of the analyses. It was alreadyoutlined in section 2.2 that a rather criticizable point of the Wisconsin model (and ofpath models in its tradition) is that it stands at risk of mixing up (signi�cant) correla-tions with causality. Although path model luminaries such as Jöreskog (1993) heavilyemphasize that one should only allow for additional path coe�cients or covariances thatalso make sense from a theoretical point of view, the researcher is often tempted to re-lax constraints and sacri�ce methodological rigor for empirical model �t gains (so-called
51Of course, by our theoretical foundation, we also have the demand of not to fall into the trap oftheoretical underspeci�cation that has been objected against the Wisconsin path models (Freedman,1987; Hedström and Swedberg, 1996).
52A great deal of the theoretical considerations in this subsection is also joint work with Klaus Birkel-bach.
39

4 Applications
post-hoc model �tting; also see Byrne et al., 1989).53 Hence, it will be necessary tooutline some more �ne-grained explanations of the suspected causal structure than itwas possible in the paper.The dependent variable of interest are 10th class teachers' evaluations whom of their
students they consider to be able for academic studies � and whom of them not. Teacherswere asked to evaluate their students in the teacher survey of the Cologne High SchoolPanel (1969), and we make use of additional student and parent questionnaires to explainhow teachers might arrive at a positive or negative judgment of their students.54
In the paper, we argue that in order to arrive at a more systematic action-theoreticalmodel of teachers' evaluations, it is useful to start with the general model of sociologicalexplanations (Coleman, 1990; Esser, 1993a) that links the conditions and alternatives ofa social situation on the macro level (the logic of situation) to actors' expectations andevaluations on the micro level. The latter, in turn, shape individuals' action (which isreferred to as the logic of selection). In a third step, individual actions are aggregatedto a new social situation via transformation rules (the logic of aggregation).55 Thecrucial assumption of the logic of selection is that this step operates via a mechanism offrame selection (Esser, 1993a, 1996b) which assumes that an actor sequentially de�nes asocial situation by selecting a particular frame, while she arrives at a concrete action byrecurring to a more speci�c script. Whereas Boudon (2003) is critical of the usefulness ofexplanations by frame selection theories � regarding them even as equal to �introducinga black box� (p. 7) �, we here follow Opp (2011, p. 218) who tends to agree that theMFS might be applicable to explain actors' preferences as well as their beliefs � wherebyit would suit the general framework of mechanism-based explanations (Hedström, 2005).A second argument for this step comes from the pragmatist theory of mechanisms byGross (2009) who virtually aims to oppose against rational choice theory in generalwhich is too narrow from his point of view. Instead, Gross emphasizes that humanaction �(...) involves an alternation between habit and creativity. (...) Only whenpreexisting habits fail to solve a problem at hand does an action-situation rise to theforefront of consciousness as problematic� (Gross, 2009, p. 366). Grounding on theseconsiderations, a pragmatist theory of social mechanisms is given �as composed of chainsor aggregations of actors confronting problem situations and mobilizing more or lesshabitual responses� (Gross, 2009, p. 368; orig. emph.). While apart from the use ofanalytically imprecise phrasings such as 'chains or aggregations', I would in generalagree that the processes of action they describe are suitable to be subsumed beneaththe concept of social mechanisms, the exempli�cations below might show that the idea
53A caveat against path analysis is also held by Freedman (1987) who objects that i) path analysisusually assumes a linear relationship between the variables of interest � which may be violated �; ii)the causal ordering of the variables has to be thoroughly deduced from theory before model �tting;and iii) even in the most complex models, omitted variable bias may still distort the estimates sincespeci�cation of an exhaustive empirical model will hardly be possible.
54For more detailed information on the data see the respective sections in the four papers.55See Hedström (2005, ch. 6) as well as Bornmann (2010) for a more elaborate discussion of the
possibilities of agent-based modeling in order to get an intuition about the consequences of di�erentmechanisms of aggregation.
40

I. Causes and E�ects of Teachers' Evaluations: A Theoretical Primer
of an 'alternation between habit and creativity' should not be viewed as standing inopposition to rational choice theory in general. Instead, it suits the assumption ofvariable rationality as hold by the Model of Frame Selection (see below).In accordance with the literature, we deduce three distinct dimensions that could a�ect
teachers in shaping their evaluations regarding 10th class students' prospective aptitudefor academic studies: students' academic performance, their cognitive ability, and theirsocial backgrounds (which are later split up into socioeconomic status and aspirations).The question is now how these theoretical concepts can be linked to teachers' evaluationsunder the assumption that the latter emerge by means of a more or less rational selectionprocess.In order to answer that question, it is fruitful to refer to Esser's and Kroneberg's
enhancement of Kahneman and Tversky's (1984) early version of the framing approachtowards a general theory of action (Esser, 1996a, 2010; Esser and Kroneberg, 2010;Kroneberg, 2005, 2006; Kroneberg et al., 2008, 2010; Kroneberg, 2011; Kroneberg andKalter, 2012). TheM odel of F rame Selection (MFS) �rst separates individual action an-alytically into frame selection, script selection, and action selection. Second, it assumesthat on each level, the selection process may vary between an unconscious automatic-spontaneous processing, and a 'rational' penetration of the respective selection stage.By doing so, the MFS synthesizes arguments from both the interpretative paradigm andrational choice theory to account for what is referred to as actors' variable rationality(Kroneberg, 2006).The frame selection refers to actors' individual de�nition of the situation. Before
action may take place, an actor has to answer the question, �What is going on here?�(Go�man, 1974, p. 8). By explicitly considering actors' individual de�nition of thesituation, the MFS also builds on assumptions of symbolic interactionism and actors'Lebenswelt (also see Esser, 1993b) and thus holds the demand to arrive at an understand-ing explanation (Kroneberg, 2011, p. 120). According to that theory, in most cases, theactual situation is de�ned in an automatic-spontaneous mode (as-mode), depending onthe match of the actor's perceptions with internally stored mental models. The match isdetermined by (1) the frame's general availability (determined by socialization and lifecourse experiences) (2) the perceivability of unique situational objects (such as culturalsymbols and gestures), and (3) the mental link between situational objects and a speci�cframe (e.g., Do 20 seconds of silence count for 'communication breakdown'? � whichmay be subject to cross-cultural variance; see Kroneberg, 2011, p. 131). Only in caseswithout such a match, a re�ecting-calculating de�nition of the situation (rc-mode) isrequired.Once a particular situation has been de�ned, more concrete scripts of action reduce the
complexity of possible alternatives of actions. Same as frame-selection, script-selectionvaries between an automatic activation of available scripts � acquired through the processof socialization and depending on both the internalization of norms and the habitual-ization of routines (as-mode) � and a rational re�ection about the alternatives at hand(rc-mode) as well.And �nally, individuals' concrete actions may vary between as-mode and rc-mode pro-
cessing as well � depending on whether a particular script exactly demands a subsequent
41
4 Applications
action, or if the consequences of di�erent alternatives are explicitly considered. In thelatter case, SEU theory would be an adequate speci�cation.56
On each level, the match between the social situation and its mental frame determineswhich form of processing is intuitively chosen. If the actor's de�nition of a social situationis without any doubts, and a chosen frame is strongly linked to a particular script,and this script requires certain action(s), then the as-mode is the adequate since moste�cient coping strategy. However, if there is 'de�nitional complexity', a more rationalpenetration of the social situation as well as a more conscious selection of scripts andindividual actions might be more conducive. Exactly this is meant with the notion ofactors' variable rationality (Kroneberg, 2005, 2006).57
As regards teachers' evaluations as they had been surveyed in the Cologne HighSchool Panel (CHiSP), the frame of the underlying social situation should be ratherunambiguous: the demand of an anonymous, non-binding assessment of students' futureacademic potential. Thus, teachers should recognize the demands of this situation moreor less automatically (as-mode).Now the question arises which scripts are at the teachers' disposal in this situation of
a non-binding assessment. The answer given in the paper is that this particular framerequires a script of professional pedagogic diagnostics. As already sketched above, weassume that as long as teachers' evaluations are grounded on meritocratic criteria likestudents' academic performance; they follow occupational standards that are deeply-rooted in every teacher's mind. Thus, evaluations which are based on meritocraticcriteria will emerge rather automatically in line with the as-mode. However, thoughprobably most legitimate, these criteria will be not the only ones determining teachers'actual evaluations. In total, it is possible to enumerate three di�erent types of processingthat might come into play besides meritocracy.58
First, Bourdieu (1986) developed a theory on di�erent forms of capital in which upper-class students' habitus � de�ned as a system of dispositions (socially acquired schemesof perception, thought and action that are stable over time) � almost perfectly matcheswith the habitus of their teachers who usually originate from the same social stratumand thus have incorporated a similar system of social dispositions. This positive socialdiscrimination of upper-class students is twofold: On the one hand, upper-class studentsare usually more familiar with codes (or routines) that are necessary to acquire thecultural goods that are taught in class. On the other hand, these �rst-order codesdepend, in turn, on second-order codes of perception, communication and self-control
56Chess is a good example why it is useful to introduce an analytical separation between script selectionand selection of action: The frame of a chess game should be unambiguously clear (as-mode), so isthe required script of chess rules (as-mode). However, this script still allows a multitude of permittedmaneuvers � which is why the selection of action will take place in rc-mode.
57The mode-selection that decides about the mode of each analytical level is assumed to be a precon-scious process but uses SEU theory as a heuristic (Esser, 2010; Kroneberg, 2011, p. 144f.).
58In section 3, I critically discussed the �fears and hopes� (Goldthorpe, 1996b, p. 255) that have beenassociated with the idea of meritocracy. Consequently, the idea of the meritocracy-as-mode is notthat the authors of the underlying paper personally favor this mode in normative terms, but thatthe idea of a meritocratic evaluation might be regarded as most legitimate by educational decision-makers (including teachers).
42
I. Causes and E�ects of Teachers' Evaluations: A Theoretical Primer
strategies acquired in socialization that may a�ect even factors like students' motivationand aspirations (Bourdieu, 1986; Bourdieu and Passeron, 1990; also see Kroneberg,2011, p. 105f.). Thus, upper-class students with higher cultural capital will not onlydispose of more knowledge of school-relevant contents, but they will also be more ableto perceive and to communicate according to norms and via symbols that come up tothe expectations of their teachers (also see Dumais, 2006, p. 85f.).59
We do not follow all implications of the habitus concept in the sense of Bourdieu'soriginal idea. On the one hand, as Lareau and Weininger (2003) have pointed out,much of the usage of cultural capital as a concept in educational research can be tracedback to an early DiMaggio (1982) paper. As a result of the reception of this paper, anarrowing of cultural capital operationalization by 'highbrow' culture as well as a distincttreatment of cultural capital and 'achievement' can be noted � of which both was beyondBourdieu's intention. Second, and more important, Goldthorpe (2007) highlights thatBourdieu's habitus concept cannot be separated from his con�ict-theoretical approachtowards schooling in general. According to this view, cultural capital per se is arbitraryand only 'used' by teachers in school in order to maintain the current social structureby means of a social closing mechanism. Furthermore, a habitus once acquired in familyhas to be regarded as stable and cannot be changed by means of schooling interventions(which would, according to Bourdieu's con�ict-theoretical approach, not even be aspiredby teachers at all).Therefore, in the following, the idea of a habitus e�ect should be understood rather
metaphorically to refer to comparably unconscious, but habitual social status e�ectsand without the ideological burden initially intended by Bourdieu. While at a �rstglance, one might ask which conceptual gain would be arrived at compared to Weber'sdictum of class- and status-related conduct of life (ständische Lebensführung) in hisde�nition of social class (Weber, 1978, p. 306f.), our argument is that the idea of variablerationality (Kroneberg, 2005, 2006) is a more general concept that also subsumes status-related conduct of life. Also to show this, both acquisition and e�cacy of potentiallyunconscious status-related 'dispositions' should be analyzed within the framework ofthe MFS.60 As Kroneberg (2011, p. 104-108) remarks, Bourdieu's thesis that actionappearing to be rational from an observant's point of view can be rooted in unconscious,long-time dispositions suits the assumption of variable rationality when a 'disposition' inBourdieu's sense is detached from action-theoretical determinism. Instead, Kroneberg(2011, p. 107) argues in line with several other authors (Elster, 1983; Hedström, 2005;Yaish and Katz-Gerro, 2012) who o�er a reading of Bourdieu's habitus that can bereferred to as 'brushed against the grain' (Benjamin, 1968, p. 257) in allowing also more
59Also Erikson and Jonsson (1996a, p. 24) highlight that evidence on the impact of (parental) culturalresources on (students') di�erences in educational transition probabilities between the social stratais often indirect � which legitimizes the use of habitus-alike processes as an unobserved mechanism.That is, even if indicators for primary and secondary e�ects of social inequality are controlled for,parental socioeconomic status might still re�ect habitus-related attributes also a�ecting teachers'evaluations.
60For an MFS-related account to the above-mentioned 'highbrow' cultural practices of individual actorssee Weingartner (2013).
43
4 Applications
conscious re�exions given certain status-related action constraints. Kroneberg quotesBourdieu's assertion that habitus o�ers a �conditioned and conditional freedom� that is�as remote from a creation of unpredictable novelty as it is from a simple mechanicalreproduction of the initial conditionings� (Bourdieu, 1977, p. 95).Transferring this on the emergence of teachers' evaluations, as long as the above-
mentioned match of symbolic codes unconsciously in�uences teachers in their evaluations(as in common-sense habitus reception), this, too, is in line with the as-mode of automaticprocessing. As Kroneberg (2006, p. 18) points out (also see Kroneberg, 2011, p. 132f.),there will be greater activation of an as-mode script
• the higher its general availability,
• the higher its accessibility given the selection of frame, and
• the higher the match of the selected frame.
The availability of a script describes how strongly it is mentally anchored, and itsaccessibility represents the degree of mental association between frames and scripts.In our case, the as-mode prevalence of students' social background criteria in a sense
conventionally referred to as habitus e�ects will particularly depend on the script's avail-ability, i.e. �how strongly an actor has internalized certain norms or become[s] accus-tomed to certain routines� (Kroneberg, 2006, p. 18). The main point here is that inaccordance with the mode of automatic processing, actors do not have the opportunityto select between di�erent as-mode scripts deliberately; instead, there is always only onedominant as-mode script � whether it approximates more to the ideal type of meritoc-racy or more to teachers' habitual recurrence of students' social backgrounds. In sum,the �rst possible deviance from the as-mode meritocracy model would be a more orless pronounced (but still unconscious) shift towards teachers' habitual consideration ofstudents' social backgrounds which presumably anchor the shaping process of teachers'evaluations as well. To keep a well-established label, but without buying Bourdieu'scon�ict theory, we refer to this particular script as habitus-as-mode.61Second, however,and in line with the assumption of actors' variable rationality, the extent to whichteachers' recurrence on student social background criteria merely follows a habitual, i.e.unconscious automatic selection process (as-mode) may vary as well. Teachers' mightconsciously take into account that apart from their current academic achievement, somestudents might be more able to both start and successfully complete academic stud-ies due to their more favourable social backgrounds: On the one hand, teachers mightsuppose that students from the higher social strata dispose of characteristics makingthem more 'suitable' to higher education. This could be habitus-alike socially acquired
61Another theoretical account that conjoins the e�cacy of symbolic codes with models of situationalframing is the one proposed by Bernstein (1971, 1981) � who himself notes a certain theoreticalproximity to Bourdieu's concept of habitus (Bernstein, 1990, p. 3). For a more elaborate discussionon the similarities and di�erences between Bernstein and Bourdieu see Bourdieu (1991, p. 53),Harker and May (1993) as well as Bernstein's (1995) reply to Harker and May. For an empiricaltest of Bernstein's theory see Meulemann (1976).
44
I. Causes and E�ects of Teachers' Evaluations: A Theoretical Primer
schemes of perception, thought and action that match those of their university teachers� but in contrast to the habitus-as-mode, school teachers more or less consciously re-�ect on this potential later match/mismatch. On the other hand, school teachers mightsimply expect that upper-class parents, let's say having an academic background them-selves, would be more able to support them. Thus, in that case, the dominant scriptthat follows the as-mode framing of the social situation would be a mixture of an as-mode assessment of students' academic performance and of a rc-mode evaluation of theestimated impact of students' social backgrounds on their potential academic success atuniversity.Having allowed for variable rationality with regard to the e�cacy of social back-
grounds, the question of the acquisition of status-related dispositions � whether takinge�ect consciously or unconsciously � remains unanswered. Above, I already followedGoldthorpe (2007) in criticizing Bourdieu's rather mechanistic understanding of social-ization. Whereas even the most detailed elaboration of the MFS (Kroneberg, 2011)remains silent on this issue62, my proposition is to allow for variable rationality also con-cerning the learning of habits. While early behaviorist learning theories mainly assumeda simple stimulus-response model of social learning, Bandura (1969) introduced an ideaof social learning that could also be described in terms of the mechanism of rationalimitation (Hedström et al., 1998; for an overview on socialization theories see Maccoby,1992).
Excursus: Variable rationality of habit learning
As Bandura (1969, p. 220) points out, conditioning theories cannot explain �how new re-sponse patterns are acquired observationally, particularly under conditions where an observerdoes not overtly perform the model's responses during the acquisition phase�, i.e. the behaviorlearned by observing is performed much later. Therefore, he postulates that learning involvesboth an imaginal and a verbal representational system that are mentally stored and mediatefuture behavior. As these kind of retention processes are, amongst others, reinforced by therole model's social status, the applicability of Bandura's account on socially acquired schemesof perception, thought and action such as Bourdieu's habitus is straightforward. Even more,Bandura (1969) opens the black box of simple conditioning in specifying several mediatingmechanisms of this long-term acquisition process in terms of punishment/reward, peer-groupin�uence, social mobility, institutions (e.g., the school system) or even media consumption.
Furthermore, Bandura (1969) objects against simple mimicry learning models in favor ofthose open for development of novel patterns of behavior. While doing so, children may keepthose forms of behavior that have proven useful in order to achieve certain goals, and discardother forms that have not (also see Becker, 2012, p. 56f.). My argument is that Bandura'sspeci�cation of intervening mechanisms and his demand to account for cost-bene�t-relatedmaintenance of novel forms of behavior transcends simple as-mode socialization theories (asthe one by Bourdieu, 1986) and approximates towards rc-mode forms of rational imitation.
A recent model combining both as- and rc-mode learning was proposed by Sun et al. (2005):The authors separate the cognitive structure into a 'bottom level' consisting of implicit knowl-
62Although some passages in Esser (1999, ch. 9) touch on the idea of learning by both conditioningand rational re�ection, this was before the idea of variable rationality was further elaborated on �which is why I still see the need for a more thorough speci�cation.
45
4 Applications
edge responsible for automatic memory-based processing, and a 'top level' consisting of explicitknowledge responsible for explicit hypothesis testing. Sun et al. (2005) develop a complex for-mal model on the conditions of implicit and explicit learning that cannot be reviewed here, butits main idea is straightforward: Analogous to human action, also learning in general (and so-cialization in particular) may take e�ect via both unconscious, implicit conditioning (as-mode),and via conscious, explicit rational imitation or hypothesis testing (rc-mode).
Hence, providing an MFS-related explanation of how students' social backgroundsmight a�ect teachers in shaping evaluations on their students requires to introducevariable rationality also in socialization theories. Status-related perceptual schemesmay be acquired both automatic-spontaneously (as-mode) and by means of rationalimitation (rc-mode). In either case, these dispositions may in�uence both unconsciously(habitus-as-mode) and by means of rational re�ection (habitus-rc-mode) later individualaction.Apart from social backgrounds, supplemental to an as-mode assessment of students'
academic performance, third, teachers might refer to additional criteria of students'general academic ability like their (estimated) intelligence or motivation. Apart fromthe most visible academic performance of the students (usually operationalized by theirschool grades), teachers could �nd rational reasons for di�erences in ability that mighta�ect students' success probabilities but are not re�ected in grades. Students withthe same grade might di�er in cognitive abilities or in the motivation they invested toachieve this grade, and these di�erences might also lead to di�erences in their (estimated)probabilities of university success. Our main point here is that in contrast to the as-mode assessments of students' academic performance, we assume teachers' additionalconsiderations about students' ability to be the result of rational reasoning (rc-mode).These theoretical considerations can be summed up as follows: Teachers' evaluations
as measured in the CHiSP data emerge in a social situation that is framed more or lessautomatically (as-mode) by the teachers. In a second step, teachers' actual decisions,i.e. in DBO terminology their beliefs about certain students, will be formed accordingto a speci�c script of action which may vary between an automatic (as-mode) and arational (rc-mode) pole of information processing. In the most probable script of action,teachers intuitively ground their evaluations on students' actual academic performance(meritocracy-as-mode). However, besides this meritocratic criterion, the dominant scriptmay gradually contain three other types of information: i) an automatic consideration ofstudents' backgrounds (habitus-as-mode), ii) a more rational consideration of students'backgrounds (habitus-rc-mode), and iii) a rational consideration of additional criteria ofstudents' academic success apart from their actual performance (meritocracy-rc-mode).Our main point is that on the individual level there is always one dominant script, butaccording to our multidimensional and gradual explanation of the emergence of teachers'evaluations, the conditions under which these evaluations are shaped may vary. Hence,according to the MFS, teachers' script selection can be understood as a belief-mediatedmechanism in order to explain di�erent determinants of teachers' evaluations.63
63In other contexts, one could object that the concept of habitus might also be understood as a desire-mediated mechanism: e.g. in sense of the desire for certain aesthetic standards (but also see Stigler
46
I. Causes and E�ects of Teachers' Evaluations: A Theoretical Primer
Results The question in the CHiSP data asking teachers to evaluate their students'prospective academic aptitude was phrased open-ended. Thus, teachers could eitherreport a certain student to be able for academic studies, or to be not able from herpoint of view. This also means that we are confronted with a third category of studentswho were neither reported in one of the two other categories. Before the more com-plex structural model was estimated, we had to clarify whether this 'neutral' categorycould be regarded as an implicit 'middle' category � which was done via a conventionalmultinomial regression comparing the e�ect sizes of the predictors of interest for eachof the two possible pairs. Since results indicated that the parameter estimates for thecontrast able vs. not able are indeed remarkably larger than for the contrast able vs.not mentioned, we �nally computed an ordered outcome variable with three categories(1 'not able'; 2 'not mentioned'; 3 'able').In the structural model estimated based on a matrix of polychoric correlations (Ols-
son, 1979; Muthén, 1984; Aish and Jöreskog, 1990; Jöreskog, 1994) to account for thecategorical measurement level of both our predictor variables and the outcome, we �ndsigni�cant e�ects on teachers' evaluations for each of the predictors deduced from theframe-selection model proposed above. However, e�ects for the indicators that hadbeen linked to the idea of meritocracy (intelligence and average grade) are by far largerthan for students' social backgrounds � which indicates that teachers' evaluations arelargely accurate. Nonetheless, perfect accuracy would be realized only if the e�ects ofstudents' social backgrounds were partialed out once analyses provide comprehensivecontrols for students' ability and achievement. One could argue that this is not thecase in the model below, and that the teachers dispose of private information re�ectingactual achievement and/or ability di�erences that correlate with the social backgroundvariables in our model. However, in survey data, comprehensive control for all possibleindicators of a concept is hardly possible, which is why the alternative interpretationof remaining social background e�ects even having controlled for measures of both stu-dents' ability and achievement as a hint of residual inaccuracy of teachers' evaluationscannot be rejected, too.One interesting result of our structural model deserving attention is that cognizant of
all concerns for post-hoc model �tting, we could improve our model by endorsing separateregression paths for the analogy sub-score of intelligence64 on both average grade andteachers' evaluations. This could either re�ect a particular form of meritocracy-rc-modeprocessing in a sense that teachers consider students' aptitude for drawing analogy-
and Becker, 1977), or even for the (absolute) value of education per se. Indeed, cultural capitaltheory expects students' aspirations to vary among the social strata (Bourdieu, 1986; Bourdieu andPasseron, 1990; also see Dumais, 2006). This is another major di�culty of Bourdieu's theory asthe assumption of class-invariant 'absolute' or 'idealistic' aspirations (Keller and Zavalloni, 1964;Boudon, 1974; but also see Stocké, 2011) would be violated. However, in our frame-theoreticalaccount presented above, we understand students' knowledge of the symbolic codes demanded inthe classroom as one anchor potentially shaping teachers' evaluations in terms of their beliefs abouttheir students � which is why both the assumption of invariant desires and the interpretation of theimpact of habitus as a belief-mediated mechanism can be defended.
64Intelligence was measured by an intelligence structure test (Amthauer, 1957) consisting of four dif-ferent dimensions: i) analogy test, ii) word test, iii) number test, and iv) cube test.
47
4 Applications
based inferences as particularly relevant to arrive at well-founded both current (averagegrade) and prospective evaluations. However, as we argue in our conclusion, due tomeasurement error, it could well be that distinct e�ects of the verbal dimension ofintelligence on both teachers' evaluations and students' average grade � being itself anaggregate of various teacher assessments � could imply a dimension of students' habitusthat is not re�ected in one of the indicators used in our structural model. In the outlookof this introduction (section 5), I again discuss the proposition made in the paper howthis ambiguity could be addressed empirically.
4.2 Reference-Group E�ects
The second paper is an example of applied reference-group research � but in contrast towhat is conveniently known under the label of Big Fish Little Pond E�ects (BFLPE ;Marsh and Parker, 1984; Trautwein and Lüdtke, 2005; Dai and Rinn, 2008; Dijkstraet al., 2008; Marsh et al., 2008) or Re�ected-Glory E�ects (RGE ; Cialdini et al., 1976;Marsh, 1987), respectively, the study in the volume at hand does not aim to explainstudents' self-concept as an outcome. Instead, the focus here is, as in the study pre-viously described, on 10th class teachers' evaluations. In the theoretical section of thepaper, we deduce both class-average achievement and socioeconomic status as potentialcontextual-level determinants of teachers' evaluations, and we hypothesize that their ef-fects � whatever sign their coe�cient may obtain (which will be clari�ed below) � couldvary by individual student achievement or teachers' grading concepts.Since most of the research on reference-group e�ects in general and on BFLPE and
RGE in particular has been invested by social psychologists, little e�ort has been madeto link the respective theoretical assumptions to the underlying social mechanisms. How-ever, classic multilevel theory provides a useful starting point for this endeavor.In general, while multilevel techniques have made a lot of progress during the last
decades (Bryk and Raudenbush, 1992; Goldstein, 1995; Snijders and Bosker, 1999; Gel-man and Hill, 2007; Hox, 2010), I do not see that many of the critical theoretical remarksthat have been opposed towards contextual e�ect research already beginning from the1970s were addressed with similar e�ort.Beginning with Davis (1966), reference-group e�ect research broadened the focus of
educational sociology and its explanations of students' educational outcomes. While abrief summary of this and the following studies is given in section 2.1 of the paper, thecrucial point to be made here is that about at the same time, a critical discussion emergedabout how contextual-level e�ects can be thought to operate in terms of underlyingmechanisms (Hauser, 1970a; Barton, 1970; Hauser, 1970b; Farkas, 1974; Hauser, 1974;Blalock, 1984; Van den Eeden, 1992). Following what had been called ecological fallacy(Robinson, 1950) regarding pure macro-level models, Hauser (1970a) introduced theterm �contextual fallacy� in order to address theoretical identi�cation problems in testingmacro-to-micro hypotheses:
�The contextual fallacy occurs when residual di�erences among a set of so-cial groups, which remain after the e�ects of one or more individual attributes
48
I. Causes and E�ects of Teachers' Evaluations: A Theoretical Primer
have been partialed out, are interpreted in terms of social or psychologicalmechanisms correlated with group levels of one of the individual attributes�(Hauser, 1970a, p. 659).
Precisely, aforehand to carrying out applied contextual-level analyses, it is of utmostimportance (and probably even more important than in 'straightforward' individual-levelmodels) that �[t]he exact meaning of 'group e�ect' needs speci�cation in each researchsituation� (Hauser, 1970a, p. 661). Otherwise, the researcher can never rule out thatindividual (e.g. student-level) composition e�ects could be responsible for the suspectedcontextual-level e�ect. Therefore, after it has been ensured that a complete and correctindividual-level model that is satisfying in both theoretical and empirical terms has beenformulated, speci�cation of convincing macro-to-micro mechanisms is inevitable:
�Indeed, the greatest weakness of contextual analysis is the vagueness withwhich its causal mechanisms are usually speci�ed. This vagueness seems tobe the reason that many of its proponents slip into the contextual fallacy�(Farkas, 1974, p. 357).
Since the interpretation of contextual-level e�ects stands at risk of invalid social psy-chological assumptions for the former may represent a variety of mechanisms (Hauser,1974; Blalock, 1984), major concern of contextual e�ect research in educational set-tings should be to isolate e�ects of, say, an intellectual climate in the classroom thatis not mediated by or represents something more than interpersonal processes amongstudents (Rigsby and McDill, 1972, p. 315), and that is �susceptible to unambiguousand distinctively sociological interpretation� (Hauser, 1974, p. 369).Apart from what is usually denoted as 'main e�ects' (although this term is somehow
misleading; see Friedrich, 1982; Brambor et al., 2006), special concern should also bedevoted to cross-level interaction e�ects since already Kendall (1951, 189) noted that�[s]igni�cant interactions do not necessarily imply interaction in any real sense. Theymay arise from heterogeneity in the data�. Therefore, it is even more important to controlfor individual-level heterogeneity as much as possible before interpreting interactione�ects.Regarding reference-group e�ect research analyzing the impact of class-level achieve-
ment on students' self-concept, it has already been noted by Blalock (1984) that (neg-ative) frog-pond e�ects (i.e. the BFLPE ) and positive normative or climate e�ects (i.e.the RGE ) may be additive, and in that case, they could not be separated. However,building on the preceding considerations, given a more elaborate understanding (in termsof social mechanisms) of the comparison processes involved, and given an adequate op-erationalization of indicators on both levels, it should be possible to approximate thesocial situation in the classroom.A useful starting point for a mechanism-based explanation of contextual e�ects could
again be the DBO model by Hedström (2005).65 In that framework, it should conse-quently be the opportunity structure that forms the crucial link between social context65For sure, other theoretical approaches to social mechanisms would be equally suitable to explicitly
49
4 Applications
in the classroom and social action on the individual level. Concretely, interaction shouldbe understood as a form of social contact with a 'generalized other' (cf. Hedström, 2005,p. 44) that may in�uence ego's action as could every single-person alter.The original BFLP hypothesis postulates that independently of a student's individual
ability, she will dispose of a worse academic self-concept when she �nds herself in a high-ability class compared to being surrounded by classmates with lower ability on average.While the explanation suggested for this phenomenon � which yielded a great deal ofsupporting studies (Marsh and Parker, 1984; Marsh, 1987; McFarland and Buehler, 1995;Zeidner and Schleyer, 1998; Lüdtke et al., 2005; Rindermann and Heller, 2005; Trautweinet al., 2006; Seaton et al., 2010; Thijs et al., 2010) � usually refers to contrast e�ectsresulting from upward comparisons (Collins, 1996), the implied social mechanism is oneof relative deprivation (Davis, 1966): In DBO terminology, the opportunity structurein the classroom in terms of average ability alters students' beliefs in terms of theiracademic self-concept. Importantly, we should not assume this to be the result of �socialtelepathy�, but of an endogenous feedback structure among students (Erbring and Young,1979).On the other hand, some studies found empirical support for a RGE that is de�ned
as a positive impact of school- or class-level achievement on students' academic self-concept. While in the name-giving study by Cialdini et al. (1976), the study focuslay on players' identi�cation with more successful football teams, simply denoting theempirical observation found in educational settings by the term 'assimilation' e�ect maybe criticized to be a theoretical underspeci�cation � particularly since school status wasalso found to exert positive e�ects on students' aspirations.The latter e�ect may be reconstructed as a mechanism of rational imitation (Hed-
ström, 2005, p. 49): In high status and/or ability environments, it is reasonable for astudent to upward-adjust both aspirations and educational e�ort since otherwise, e�ectsof deprivation would be even more disappointing.66 A positive e�ect of school statusor school achievement on students' academic self-concept could then be the result ofrealistic assessments regarding the increase in e�ort exerted (even apart from studentGPA, as this variable is occasionally controlled for).Although Marsh et al. (2000) were able to empirically juxtapose a positive e�ect of
school status and a negative e�ect of class-level achievement on student academic self-concept, respectively, the theoretical question why both e�ects should be expected (andcan be observed) to operate simultaneously still remains unresolved in BFLPE research.Clari�cation in that respect is provided in terms of the analytical distinction proposed byManski (1993, p. 31; orig. emph.) who separates four di�erent types of contextual-levele�ects (in a broader sense) from each other:
incorporate contextual e�ects. Particularly, Mario Bunge's integration of social mechanisms into hismore abstract theory of systemism aims to bridge the gap between pure macro-level (i.e. holistic)and pure micro-level (i.e. individualistic) explanations (Bunge, 1997, 2004). However, since the DBOmodel is more close � though not necessarily glued � to rational-choice or subjective-expected-utilityrelated action theories, it is the preferred conceptual framework also for the second paper.
66This mechanism corresponds to one possible explanation for the self-ful�lling prophecy to come true(Biggs, 2009, p. 309).
50
I. Causes and E�ects of Teachers' Evaluations: A Theoretical Primer
�Endogenous e�ects, wherein the propensity of an individual to behave in someway varies with the prevalence of that behavior in some reference group.Contextual e�ects, wherein the propensity of an individual to behave in someway varies with the distribution of background characteristics in the referencegroup.Ecological e�ects, wherein individuals in the same reference group tend to behavesimilarly because they face similar institutional environments.Correlated individual e�ects, wherein individuals in the same reference grouptend to behave similarly because they have similar individual characteristics.�
While the term �endogenous e�ects� is used to refer to endogenous feedback e�ects inthe sense of Erbring and Young (1979), contextual and ecological e�ects are exogenousin terms of a distinct impact on individual behavior apart from individual-level char-acteristics or interaction. The four di�erent types can be illustrated by the example ofschool achievement e�ects (Manski, 1993, p. 31f.; emph. added):
�There is an endogenous e�ect if, all else being equal, individual achievementtends to vary with the average achievement of the students in the youth's highschool or ethnic group, or in another reference group. There is a contextual e�ectif achievement tends to vary with, say, the socioeconomic composition of the ref-erence group. There is an ecological e�ect if students in the same school tend toachieve similarly because they are taught by the same teachers. There are corre-
lated individual e�ects if students in the same school tend to have similar familybackgrounds and these background characteristics tend to a�ect achievement.�
Now it becomes understandable why the empirically observable negative BFLPE isone net of the RGE, and how it is analytically possible that both e�ects may operatesimultaneously: The negative BFLPE is an endogenous feedback e�ect as a result ofbetween-student interaction � inducing the belief-mediated mechanism of relative de-privation. The positive RGE, contrarily, is an exogenous contextual e�ect in terms ofa school's student composition � inducing the belief-mediated mechanism of rationalimitation.But how can these considerations be related to teachers' evaluations? To be sure,
naïvely transferring exactly the same mechanisms on a di�erent outcome, even if thecontextual-level variables are the same, would lead us astray. Instead, in case of (sim-ple) reference-group (main) e�ects, we hypothesize an opportunity-mediated mechanismsince it is the social situation in the classroom that is supposed to mediate teachers'evaluation practices.Similarly to conventional BFLPE and RGE research, in the paper we use evidence
from preceding analyses to deduce 'main e�ect' hypotheses opposing to each other: Anegative e�ect of class-level achievement on a teacher's evaluation net of all individual-level covariates could be expected if she simply adjusts her reference standards accordingto the achievement level she observes in the classroom. In that case, teachers' beliefs anddesires would remain constant while a 'pure' opportunity-mediated mechanism directlyalters teachers' action in terms of assigning a speci�c evaluation to a student.
51
4 Applications
Contrarily, we also �nd arguments supporting a positive relationship between class-level achievement and teachers' evaluations: First, teachers' might adjust their evalua-tions according to a mechanism of regression to the mean (Galton, 1886; also see Healyand Goldstein, 1978) � which would also be a pure opportunity-based mechanism.67
Furthermore, this e�ect might be ampli�ed by a concatenation of an opportunity- and abelief-mediated mechanism: For instance, the belief-mediated mechanism of dissonancereduction could come into play in that teachers follow an implicit decision rule of thetype, �a member of that bright class can't be that dull� (and reversely). This is whatis conveniently denoted as a Halo e�ect (Thorndike, 1920).68 Similarly, a comparablebelief-mediated mechanism can be expected to hold for the implied e�ect of class-levelsocioeconomic status on teachers' evaluations in that teachers suspect parents in high-SES classes to be equipped with comparably higher educational aspirations which theyalso project onto students with comparably lower social backgrounds.Having outlined the social mechanisms of our 'main e�ect' hypotheses, the former,
however, are silent about teachers' action scripts as they have been described in thepreceding section.While one can assume that simple reference-group e�ects do not a�ect the operating
mode of teachers' action scripts, this is not the case in the event of interaction e�ects.Given that student-level heterogeneity has been su�ciently controlled for (cf. Kendall,1951), we hypothesize a negative interaction e�ect between class-level achievement andstudent achievement both as predictors of teachers' evaluations.As commonly known, an interaction e�ect of the type y = β0+β1x1+β2x2+β3x1 ∗x2
can be interpreted in two substantial ways: as an e�ect of x1 on y varying with levelsof x2, or as an e�ect of x2 on y varying with levels of x1 (Friedrich, 1982; Bramboret al., 2006). For the interaction e�ect speci�ed above, on the one hand, it is possible toassume the contextual-level e�ect of class-level achievement on teachers' evaluations tovary with levels of student ability � but on the other hand, it would be equally imaginableto hypothesize the e�ect of student-level achievement on teachers' evaluations to varywith levels of class-level achievement.Providing a mechanism-based explanation for both readings, concerning the former,
the 'pure' opportunity-mediated mechanisms of reference-standard adjustment (in caseof a negative contextual-level e�ect) or regression to the mean (in case of a positive
67I should loose some more words on this. While Galton (1886) by origin referred to changes in aparticular measurement from one generation to the next (such as body size), the psychologicalliterature is usually talking about the fact that an observation with an extreme value in the �rstmeasurement can be expected to show a less extreme value in the second measurement (Tverskyand Kahneman, 1974; Healy and Goldstein, 1978). Here, however, the idea is that teachers adjusttheir reference standards according to an observable mean (i.e. class-average achievement).
68Whereas the mechanism of dissonance reduction is usually applied to in-group member selection (e.g.Rigsby and McDill, 1972), its application onto the Halo e�ect is straightforward: One standardinterpretation of the latter is the one of a discrepancy between a rater's observed and the truecorrelation of two characteristics (Murphy et al., 1993), in our case between classroom achievement� or social status � and a student's achievement nested in the respective classroom. This (positive)di�erence is due to a mechanism of dissonance reduction in order to minimize cognitive transactioncosts in terms of unbalanced cognitive structures (Heider, 1946; Festinger, 1957).
52
I. Causes and E�ects of Teachers' Evaluations: A Theoretical Primer
contextual-level e�ect; see Galton, 1886; Healy and Goldstein, 1978) taken alone couldbe responsible for lower-achievement students to be more a�ected by the respectivee�ect since in both cases, the high-achievers would serve as the foil all lower groups arecompared to.69
Regarding the latter, a mechanism-based reconstruction can easily be incorporatedin the frame-selection approach as outlined in the preceding subsection: If an attributeis all too common, it might forfeit its nimbus of distinctiveness. Hence, teachers inhigh-achievement environments could tend to leave their meritocracy script routine (inwhatever mode operating) and switch to alternative (e.g. status-based) criteria in orderto arrive at an evaluation. Hence, the opportunity-mediated mechanism of a reference-group e�ect would itself mediate the belief-mediated mechanism of script selection atthe teacher level.Finally, we hypothesize that the relationship between class-level achievement and
teachers' evaluations varies by teachers' reported grade concepts. Concretely, we havein mind that teachers who report to follow more individualist grading concepts mightbe less a�ectable for reference standard adjustments due to contextual-level e�ects interms of class-level achievement than teachers who report more relational grading con-cepts. In terms of social mechanisms, an opportunity-based mechanism would in turnbe mediated by teachers' beliefs.
Results By means of a series of cross-classi�ed multilevel models wherein the outcomeof teachers' evaluations70 is nested in both student and teacher contexts with schoolclasses as the highest unit of analysis, we found that in contrast to both conventionalBFLPE research and reference-group studies with German primary school teachers'transition recommendations as an outcome, teachers' evaluations are positively a�ectedby both class-mean intelligence and class-mean grade point average (GPA). This is inter-preted in sense of a Halo e�ect (Thorndike, 1920) � which I have just reconstructed as aconcatenation of an opportunity- and a belief-mediated mechanism. To be sure, the al-ternative interpretation of a regression to the mean (Galton, 1886; Healy and Goldstein,1978) � a pure opportunity-based mechanism � cannot be rejected either. The particu-lar social composition of our sample (Gymnasium, i.e. German highest-track secondaryschool students only), the lower extent of obligation associated with non-binding, anony-mous assessments, and their comparably later point in time of measurement may explainwhy our results also di�er from reference-group e�ect studies based on primary schoolteachers' recommendations. Still, model �t criteria (in terms of pseudo R-squared) re-veal that individual-level achievement is a much more important predictor of teachers'evaluations than respective contextual-level indicators.
69It has been observed that halo e�ects seem to be stronger for ratees less familiar to the rater (Kozlowskiand Kirsch, 1987). Low-achievement students might be less noticeable in the classroom due to theirlesser class contribution.
70Here we only analyzed whether a teacher assessed her student to be 'able' vs. to be 'not able'. For amultilevel analysis of the contrast 'able' vs. 'not mentioned' based on the same data see Becker andBirkelbach (2010).
53
4 Applications
While a signi�cant interaction e�ect between class-average and student-level intel-ligence could not be detected, it was noted that the e�ect of class-average GPA onteachers' evaluations signi�cantly increases with better student marks. This contradictsour hypothesis which expected this e�ect to be negative. Also, comparing the marginale�ects of both readings of this interaction term suggests that the e�ect of class-level GPAon teachers' evaluations does vary more strongly with student-level GPA than does thee�ect of student-level GPA with class-level GPA. Hence, results suggest that the sig-ni�cant interaction term is indeed due to an opportunity-mediated mechanism that isitself mediated by a belief-mediated mechanism on the teacher level rather than due toa belief-mediated mechanism of script selection mediated by the opportunity-mediatedmechanism of a reference-group e�ect.What we did not �nd is statistically solid evidence of class-average achievement e�ects
to vary by teachers' grading concepts. Although simple graphical insight in the respectivemarginal e�ects tends in the direction of weaker contextual-level e�ects for teacherswith more individualist grading concepts, and stronger e�ects for teachers with morerelational grading concepts � which would challenge both our theoretical explanationgiven in terms of a concatenation of an opportunity- and a belief-mediated mechanismas well as assumptions in already existing studies (Rheinberg, 1980; McFarland andBuehler, 1995; Marsh et al., 2001; Lüdtke et al., 2005; Seaton et al., 2009) � we cautionagainst overhasty accepting this result since conventional statistical signi�cance levelswere not reached.
4.3 A Formal Model of Self-Ful�lling Teacher Expectancy E�ects
The idea of a self-ful�lling prophecy can be said to be one of the most prominent examplesof a social mechanism. The original idea is ascribed to Robert Merton (1948)71 whoillustrates how a potentially mislead rumor of a bank's illiquidity might nonethelesscause the bank's bankruptcy: Alienated by the rumor, the �rst customers will withdrawtheir savings � which will in a second step move other costumers to follow suit. In theend, panicky withdrawals might in fact lead to the bank's breakdown � although theinitial rumor did not necessarily correspond to the bank's initial �nancial situation.This seminal description of a self-ful�lling prophecy was convincingly reconstructed
by Hedström (2005, p. 48) as a belief-mediated mechanism: The beliefs of the �rstdepositors who withdraw their savings a�ect the beliefs of the remainders who now havegood reasons to assume that there might actually be something wrong with the bankand thus also withdraw their savings. Or phrased more analytically (Biggs, 2009, p.
71Actually, before also Popper (1944a, p. 89) referred to �[t]he idea that predictions may in�uencepredicted events�. In the monograph The Poverty of Historicism, he labeled this idea �Oedipuse�ect� (Popper, 1957, p. 11). However, Popper might have got familiar with the idea by Merton's(1936) paper wherein he just brie�y sketched the idea of how a prediction might change a course ofdevelopment by altering an actor's social situation (also see Birkelbach, 2011, p. 134). Even earlier,Thomas and Thomas (1928, p. 572) accurately verbalized, �If men de�ne situations as real, they arereal in their consequences� � a statement well-known as the Thomas Theorem which Merton (1948,p. 193) also discusses at the beginning of his more famous paper.
54
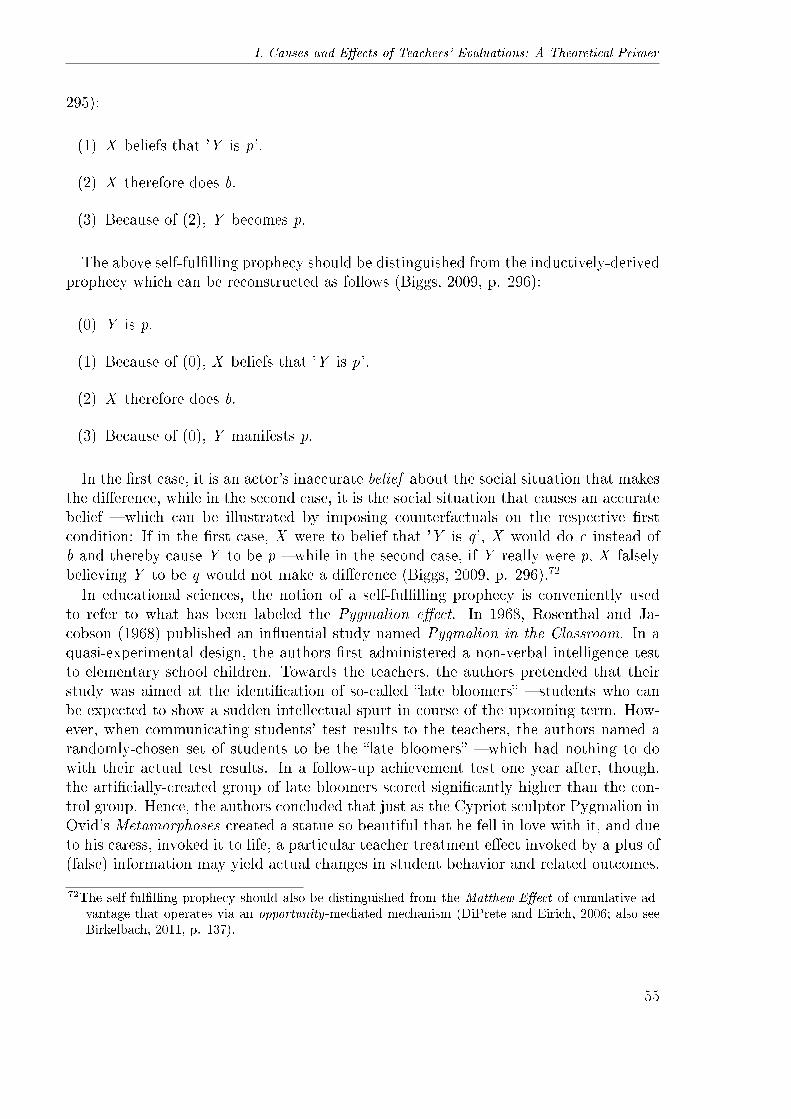
I. Causes and E�ects of Teachers' Evaluations: A Theoretical Primer
295):
(1) X beliefs that 'Y is p'.
(2) X therefore does b.
(3) Because of (2), Y becomes p.
The above self-ful�lling prophecy should be distinguished from the inductively-derivedprophecy which can be reconstructed as follows (Biggs, 2009, p. 296):
(0) Y is p.
(1) Because of (0), X beliefs that 'Y is p'.
(2) X therefore does b.
(3) Because of (0), Y manifests p.
In the �rst case, it is an actor's inaccurate belief about the social situation that makesthe di�erence, while in the second case, it is the social situation that causes an accuratebelief � which can be illustrated by imposing counterfactuals on the respective �rstcondition: If in the �rst case, X were to belief that 'Y is q ', X would do c instead ofb and thereby cause Y to be p � while in the second case, if Y really were p, X falselybelieving Y to be q would not make a di�erence (Biggs, 2009, p. 296).72
In educational sciences, the notion of a self-ful�lling prophecy is conveniently usedto refer to what has been labeled the Pygmalion e�ect. In 1968, Rosenthal and Ja-cobson (1968) published an in�uential study named Pygmalion in the Classroom. In aquasi-experimental design, the authors �rst administered a non-verbal intelligence testto elementary school children. Towards the teachers, the authors pretended that theirstudy was aimed at the identi�cation of so-called �late bloomers� � students who canbe expected to show a sudden intellectual spurt in course of the upcoming term. How-ever, when communicating students' test results to the teachers, the authors named arandomly-chosen set of students to be the �late bloomers� � which had nothing to dowith their actual test results. In a follow-up achievement test one year after, though,the arti�cially-created group of late bloomers scored signi�cantly higher than the con-trol group. Hence, the authors concluded that just as the Cypriot sculptor Pygmalion inOvid's Metamorphoses created a statue so beautiful that he fell in love with it, and dueto his caress, invoked it to life, a particular teacher treatment e�ect invoked by a plus of(false) information may yield actual changes in student behavior and related outcomes.
72The self-ful�lling prophecy should also be distinguished from the Matthew-E�ect of cumulative ad-vantage that operates via an opportunity-mediated mechanism (DiPrete and Eirich, 2006; also seeBirkelbach, 2011, p. 137).
55
4 Applications
Theoretical identi�cation of SFP's While the initial Pygmalion in the Classroom wasset up in a quasi-experimental design, most of what followed in teacher expectancy e�ectsresearch relied on survey data (see overviews by Jussim, 1986; Jussim et al., 1996; Jussimand Harber, 2005). Regarding isolation of a causal e�ect, survey data are always inferiorto a true experimental design (Biggs, 2009) � though econometricians have developedsophisticated methods to get rid of a great deal of heterogeneity in the data that wouldnot be equally problematic in an experimental setting (Gangl, 2010, also see below).What survey research can do, though, is to approximate the social mechanisms thatstand behind the causal e�ect � leading to a better understanding of the phenomenonto be isolated by means of methods. In other words, a crucial prerequisite of empiricalidenti�cation of a teacher treatment e�ect is a thoroughly-speci�ed theoretical modelwith preferably �ne-grained bridge assumptions.To be precise, survey data research faces both the burden and the bene�t of a par-
ticular speci�cation problem � which in the case of self-ful�lling prophecies translatesinto the following questions: 1) To what extent are teachers' initial beliefs about theirstudents accurate; 2) how are initial teacher perceptions a�ected by subsequent stu-dent behavior; and 3) in what manner do inaccurate teacher perceptions a�ect students'educational outcomes? The bene�cial part of that requirement lies in the chance toget closer to the social mechanisms that operate beneath the surface of a self-ful�llingprophecy. So let's now treat all three questions systematically.To what extent are teachers' initial beliefs about their students accurate? A major
objection against self-ful�lling prophecy research from the very beginning is the argu-ment that teacher expectancy e�ects on student achievement re�ect accurate beliefs ofteachers that correspond to unobserved student characteristics. Jussim (1986) distin-guishes between a strong and a weak form of the accuracy argument. The strong formof the argument claims that teachers' expectations based on stereotyping will always beinaccurate, but teachers' expectations based on direct observation of their students willalways and necessarily be accurate. In its weak form, the argument does not make theclaim of absoluteness but only postulates that direct observation of student behaviorwill be more accurate than expectancy formation based on stereotyping.Following Jussim (1986, p. 431), it is hard to test the accuracy of teachers' expecta-
tions just because they may invoke self-ful�lling prophecy e�ects. However, as Jussimet al. (1996, p. 288) summarize the existing research up to that point, a large degree ofteacher expectancy e�ects can be attributed to the fact that they are accurate � a conclu-sion that is maintained in a more recent review by Jussim and Harber (2005).73 However,a current study by Ready and Wright (2011) could show that holding between-groupachievement di�erences constant, teachers are especially error-prone in lower socioeco-nomic and lower achievement classroom contexts. Regarding teachers' expectations asmeasured by teachers' evaluations in the data at hand, the �rst two papers in this vol-ume demonstrate their vulnerability from both social background and reference-groupe�ects apart from students' intelligence and grade point average � which might be a hintof inaccuracy to some extent.
73�Prediction without causation is exactly how we de�ne accuracy� (Jussim and Harber, 2005, p. 141).
56

I. Causes and E�ects of Teachers' Evaluations: A Theoretical Primer
How are initial teacher perceptions a�ected by subsequent student behavior? Jussim(1986) summarizes evidence that teachers may maintain their expectations even thoughthey are biased and teachers are confronted with contradicting information. In contrastto teachers with more �exible expectations, it's the teachers with rigid expectationsthat are suspected to generate self-ful�lling prophecy e�ects since the former can beexpected to change their opinion when confronted with discon�rming evidence. A socialmechanism that may explain rigid expectations is the belief-mediated mechanism ofdissonance theory (Jussim, 1986, p. 430): When expectancy-consistent information ismore likely to be remembered, evidence about a good performance of a presumablybad student has less chance to change teachers' beliefs than a good performance of apresumably good student to maintain teachers' beliefs. Moreover, teachers may perceivestudents' behavior as consistent with their expectations because of perceptual biases(Jussim et al., 1996, p. 286).74
In what manner do inaccurate teacher perceptions a�ect students' educational out-comes? Unsurprisingly, the answer to that question is closely related to the argument ofaccuracy. Only if inaccurate teacher expectations can be identi�ed, it can be ruled outthat teacher perceptions are valid predictions of unobserved characteristics that actuallycause student achievement.But even if inaccurate teacher expectations can be identi�ed empirically (see below),
it has still to be clari�ed how di�erent teacher expectations cause di�erent student out-comes. As Jussim (1986, p. 435) notes, teacher treatment e�ects are supposed to occurwhen teachers provide more emotional support, clearer and more favorable feedback tohigh expectancy students, pay more attention, and teach more (and also more di�cult)material to the highs.75 While most (if not all) self-ful�lling prophecy studies tested forteacher expectancy e�ects of subsequent student achievement, in the paper, I develop atheoretical model to explain how teachers' expectations may a�ect students' educationaltransitions. It is beyond the scope of this introduction to replicate the mathematicsagain, but the model's crucial idea should be elaborated on notwithstanding: As de-scribed above, the model of relative risk aversion by Breen and Goldthorpe (1997) anda conceptual similar model by Esser (1999) explain students' educational transitions bya multiple parameter model covering both subjective costs as well as expected bene�tsof education. In both models � as well as in a theoretical predecessor proposed by Erik-son and Jonsson (1996a) �, the subjective expected probability of educational successis a crucial parameter and is assumed to vary with preceding educational performance
74While a self-ful�lling prophecy is de�ned as the e�ect of a teacher's inaccurate expectation on studentachievement, and rigid teacher expectations may emerge because dissonant information is ignored,I wish to argue here that perceptual biases can also be reconstructed by a mechanism of dissonancereduction: In a trivariate relation between ego (a teacher), alter (a student), and a state-of-a�airs(e.g. school performance), it would be rational for ego to form beliefs of alter 's behavior consistentwith ego's preceding beliefs in order to avoid cognitive dissonance � regardless of whether the beliefsactual correspond to alter 's behavior. For teachers, it might be e�cient to ignore 'dissonant' studentbehavior due to a strategy of satis�cing (Simon, 1957).
75Following (Biggs, 2009, p. 308f.), teachers providing more emotional support would a�ect students'beliefs, while teachers providing more challenging material to higher-achievers would alter theiropportunity structure.
57
4 Applications
(Breen and Goldthorpe, 1997, 285; Esser, 1999, p. 272).Recalling what has been said about the impact of a teacher treatment e�ect, the
e�cacy of a self-ful�lling prophecy can be modeled in terms of a student's subjectiveexpected probability of educational success which is a function of preceding expectededucational success, actual performance, and a teacher treatment component consistingof factors such as classroom praise, bilateral encouragement, etc. Moreover, I follow theliterature by assuming that inaccurate teacher expectations can be de�ned as teachers'over- and underestimations of their students compared to a set of student backgroundvariables (also see below).If all other model parameters are restricted to be constant, an overestimated student
would expect a higher utility from continuing on a higher educational track than anunderestimated student due to her higher subjective expected probability of educationalsuccess. This can be attributed to actual achievement di�erences on the one hand, andresidual di�erences in motivation and self-concept (cf. Jussim, 1989; Gill and Reynolds,1999; Muller et al., 1999; Mechtenberg, 2009; Mistry et al., 2009) on the other hand.By relating the e�ect of a self-ful�lling prophecy to di�erences in the subjective ex-
pected probabilities of educational success of over- and underestimated students, re-spectively, the underlying teacher treatment e�ect is reconstructed as a concatenation ofbelief-mediated mechanisms : As outlined above, teachers �rst form initial beliefs abouta student's academic performance, and although these beliefs are largely accurate, aresidual share of inaccuracy was shown to remain (Ready and Wright, 2011). By amechanism of dissonance reduction, teachers might ignore positive information aboutnegative students (and reversely) and thereby form rigid expectations that are prone toinduce a self-ful�lling prophecy. Thus, the latter can be de�ned as the impact of inac-curate teachers' expectations on students' beliefs in terms of their subjective expectedprobability of educational success � caused by both achievement di�erences and directe�ects of teacher treatment on students' motivation and self-concept � inducing di�er-ences in the utility that is attached to a higher educational outcome between over- andunderestimated students.76 Hence, by linking a convenient SEU explanation of socialinequality in educational opportunities (Esser, 1999) to self-ful�lling prophecy researchdealing with inaccurate teacher beliefs, we now see the importance of Boudon's demandfor an action theory that has to deal with evidently false beliefs (Boudon, 1996, 1998,2003).
Empirical identi�cation of SFP's As just described, it is crucial to arrive at anempirical identi�cation of inaccurate teachers' expectations since otherwise, it cannotbe ruled out that teachers predict rather than cause subsequent student achievement.In contemporary self-ful�lling prophecy research, this is accomplished by regressing the
76While all cost-bene�t models of educational transitions assume that desires (i.e. the absolute valueof education) are constant between the social strata, it might well be possible that additionalopportunity-mediated mechanisms � e.g. of classroom context � a�ect the utilities attached toeducational transitions in general and the e�ect of a self-ful�lling prophecy as described above inparticular (Blalock and Wilken, 1979). Though certainly promising, this is beyond the scope of boththe underlying paper and this section.
58
I. Causes and E�ects of Teachers' Evaluations: A Theoretical Primer
available measure of teachers' expectations on a set of student background variables andby then storing the residuals of that regression as teachers' over- and underestimationscompared to the respective background characteristics. As predictors, both studentachievement and motivation are usually considered to isolate a residual component in ateacher's expectation that might re�ect inaccuracy (Madon et al., 1997, 2006).Unfortunately, with the CHiSP data, I am not able to operationalize indicators for all
parameters in the theoretical model at each point in time. The data entails measures forstudent cost-bene�t assessments and teachers' expectations measured at the same time� which might be problematic for the empirical identi�cation of self-ful�lling prophecies.However, I assume that by regressing teachers' evaluations � the measure of teachers'expectations in the CHiSP data � on suitable indicators of students' performance andmotivation, respectively, and by isolating the residual terms resulting from these regres-sions, di�erences in students' subjective expected success estimates that are not re�ectedin actual performance or motivation di�erences can at least be approximated. Once asigni�cant e�ect of the residual terms on students' educational transitions is found � asit holds for students' probability of passing German Abitur � following good falsi�ca-tionist practices (Popper, 1959), it is up to future studies to reject the assumption thatthis e�ect is not due to a belief-mediated mechanism of a teacher treatment e�ect.The statistical approaches in the paper are aimed at providing conservative (i.e. lower-
bound) estimates of self-ful�lling prophecy e�ects (also see Biggs, 2009, p. 300) by alsotrying to control for unobserved heterogeneity. To be precise, it might still be the casethat teachers dispose of something like private information (Cunha et al., 2005; Cunhaand Heckman, 2007) that is not re�ected in measures of either student motivation orperformance, but a�ects their transition propensities (either directly, or indirectly viacost-bene�t considerations77). This is, admittedly, an identi�cation problem of socialmechanisms based on survey data: �Under non-experimental conditions we can see onlywhat that mechanism in conjunction with other factors makes it do� (Collier, 1994, p.33). To avoid potential biases as accurately as possible, I apply two di�erent methodsof controlling for potential unobserved but confounding variables � a so-called Heckmanmodel (Heckman, 1979) on the one hand, and a sensitivity analysis (Buis, 2007, 2010,2011) on the other hand. Both approaches suggest that at least teacher treatment e�ectson students' probability of passing Abitur are not a�ected by unobserved heterogeneity(see below).
Results Analyses in this and the following paper di�er from the two preceding ones inthat teachers' evaluations are used to construct predictors rather than the outcome. Inorder to arrive at a satisfactory empirical identi�cation of self-ful�lling prophecies, teach-ers' evaluations are regressed on measures of both student performance and motivation.
77If students from di�erent social strata would have di�erent desires with regard to the absolute valueof education per se � which would contradict theoretical approaches in the tradition of Keller andZavalloni (1964) as well as Boudon (1974) �, and if di�erences in these desires would have an impacton students' transition decisions, and if teachers could observe these di�erences and would groundtheir expectations upon them, this private information needs not necessarily be re�ected in students'cost-bene�t considerations.
59
4 Applications
Regarding performance, regressors concerned student intelligence as measured by the in-telligence structure test (Amthauer, 1957) and student grade point average (GPA). As re-gards motivation, indicators of student homework e�ort, their self-assessment of relativeschool performance compared to classmates, and general self-con�dence are considered.Results of these analyses show that indicators of performance are much more importantpredictors of teachers' evaluations than indicators of student motivation (whereupon thee�ect of student self-assessment of relative school performance is highest).Separate residual terms for each of the performance model, the motivation model, and
a full model comprising predictors of both concepts are stored in the data and used topredict i) students' probability to pass Abitur (i.e. German highest secondary-schooltrack exam) on the �rst try, and ii) students' propensity to start academic studieswithin two years after high school graduation.78 All models control for indicators ofall subjective-expected-utility (SEU) concepts conventionally used to predict students'educational transitions. These comprise controls for the expected educational bene�t,the subjective expected probability of educational success79, the expected status decline,its expected in�uence on actual transition decisions as well as the expected costs ofeducation. Additionally, the models account for potential heterogeneity bias that mayarise due to unobserved variance of both the SEU indicators80 and the residual termsused to approximate teacher treatment e�ects in terms of a self-ful�lling prophecy, aswell as for selection bias following from the fact that we can only estimate universityentrance transition probabilities for those students who successfully graduated from highschool. This is accomplished by means of a so-called Heckman correction (Heckman,1979) that has already been applied on educational transition models (Becker, 2000,2003). Following this approach (and extending it to account for potential heterogeneitybias also among the indicators used to identify self-ful�lling prophecies), all cost-bene�tindicators as well as the residuals obtained to identify di�erences in subjective expectedprobability estimates net of actual motivation and performance are regressed on parentalsocial class. When the results of the respective probit regressions are stored as InverseMill's Ratios and then entered as control terms in the equation of primary interest (i.e.predicting students' transition probabilities), it is possible to control for class-relateddi�erences that might enter the educational utility function (for a description of theparticular mathematics of this approach see e.g. Heckman, 1979; Winship and Mare,
78See sections 3.1 and 4.1 of the respective papers for more details on the cut-o�s used for the dependentvariables.
79Note that due to data constraints, I do not dispose of an appropriate measure of students' subjectiveexpected probability of educational success � which would certainly be a better measure in thisstage of students' educational life course (also see the paragraph on the waning coe�cients patternin section 2.2 of paper 4) � than parental assessments. However, the respective bridge assumptionin this context is that parents have good knowledge of their children's probability estimates andthat the extent of these approximations does not vary between the social strata. Also note that thismeasure is analytically distinct from the concept used for theoretical identi�cation of self-ful�llingprophecies as outlined above.
80One could argue that the identi�cation assumption that the degree of accuracy regarding parentalassessments of their children's subjective expected probability of educational success must not varyby parental social class is relaxed in models with heterogeneity bias correction.
60
I. Causes and E�ects of Teachers' Evaluations: A Theoretical Primer
1992; Breen, 1996; Briggs, 2004). As an alternative, I also apply a procedure to controlfor unobserved heterogeneity which was proposed by Buis (2007, 2010, 2011): A randomvariable with zero mean and both varying standard deviation and varying correlationwith the self-ful�lling prophecy residuals is used to approximate a potential mediator ofthese residuals that might not be associated with parental social class. The advantageof that latter method is that is does not rely on the identifying assumption that parentalsocial class as the crucial predictor in the selection equation is not associated with thedependent variables in the outcome equations � which might be an objection against themodels applying the Heckman correction method.81
In particular, I found that self-ful�lling prophecies in terms of a teacher treatmente�ect � that was identi�ed by residualized teachers' expectations � have a distinct e�ectfor all three variants of the estimated residual terms (performance model, motivationmodel, and a full model consisting of indicators for both of these concepts) on bothstudents' probability of passing Abitur as well as on their propensity to start academicstudies apart from all indicators for the SEU predictors conventionally used in educa-tional transition research.Regarding corrections for selection bias, results remains stable in case of high school
graduation (Abitur) � but not in case of students' propensities to start academic studies.The �rst result indicates that the belief-mediated mechanism of a self-ful�lling prophecyin terms of a teacher treatment e�ect is not a�ected by heterogeneity in beliefs thatcould be accounted for in terms of social class. The second result is an illustration ofpath dependency e�ects of self-ful�lling prophecies, but it also indicates that there isno distinct belief-mediated mechanism operating that a�ects university transitions oncehomogeneity in beliefs conditional on having successfully graduated from high schoolhas been taken into account.82
Regarding sensitivity analyses, private information of the teachers that might be asso-ciated with either student beliefs of educational success or their educational transitionswhich can not be accounted for by means of parental social class should only be an issuedistorting the robustness of the results if an appropriate indicator would correlate un-reasonably high with both the residual terms that were used for empirical identi�cationof self-ful�lling prophecies as well as with students' educational transitions.Hence, I conclude that the belief-mediated teacher treatment e�ect in terms of a
self-ful�lling prophecy predicts students' high school graduations robustly regarding i)heterogeneity of student beliefs according to social class, and ii) reasonable degrees ofteachers' private information. Contrarily, once homogeneity of student beliefs in terms of
81Note that Birkelbach (2011) also tests for self-ful�lling prophecies in terms of a belief-mediated mech-anism based on CHiSP data. However, although referring to the SEU explanation of educationaldecisions (Esser, 1999), he does not provide a formal model in SEU terminology. Furthermore,(in my view) less precise indicators of self-ful�lling prophecies without controls for endogeneity orselection bias are used � which is why I still consider my contribution to be of distinct scienti�crelevance.
82Given the stability of the indicator used to operationalize students' subjective expected probabilityof educational success, one could argue that relaxing the assumption that the proximity of this(parental) measure to students' own beliefs must not vary by social class is permissible from anempirical point of view.
61
4 Applications
a selection bias � arising conditional on having successfully graduated from high school� has been controlled for, we do not �nd anything more than path dependency e�ects.
4.4 Changes of Self-Ful�lling Teacher Expectancy E�ects Over
Time
The fourth paper asks, Does the e�ect of teachers' expectations on students' educationalopportunities decrease over educational transitions? A statistical matching approach.Conceptually, I use the same framework for identi�cation of a teacher treatment e�ectin terms of a self-ful�lling prophecy as in the third paper. However, in addition to thelatter article, I also test for potential changes of this e�ect over students' educationallife course.
Evidence from educational transition research Starting with conventional IEO re-search, several theoretical approaches postulate decreasing social background e�ects overstudents' educational transitions. First, according to the l ife course perspective (LCP;Müller and Karle, 1993), the more students make their way through secondary socializa-tion, the less strong parental treatment e�ects may in�uence students in their academicoutcomes. Second, maximally maintained inequality (MMI; Raftery and Hout, 1993)suggests that decreasing social background e�ects at later educational transitions arein turn sensitive to the progress of educational expansion that a�ects enrollment rates.Third, relative r isk aversion (RRA; Breen and Goldthorpe, 1997) assumes that homo-geneity in ability among working-class students increases with subsequent transitions;and once a particular transition has been passed, the risk of status decline for working-class parents is lower than for the preceding decision since the critical level of statusmaintenance is already reached. Fourth, e�ectively maintained inequality (EMI; Lu-cas, 2001, 2009) additionally accounts for the fact that educational systems may betracked. Lucas (2001) �nds persisting residual class di�erences between di�erent edu-cational tracks also at a higher transition � which rejects LCP and also challenges theassumption of MMI that class di�erences in educational transition probabilities diminishonce a certain level of education has become universal due to educational expansion.
Formal evaluation of all propositions As LCP could already be rejected since resultsare more in favor of MMI (Lucas, 2001), in his formal analysis, Lucas (2009) onlycompares the implications of MMI, RRA and EMI. As he notes, only one of the threeproposals, namely RRA, has already been written down in formal terms. Thus, Lucas'objective is �rst to provide a formal notation of both MMR and EMI, and second, to testwhich of the three proposals su�er from the logical threats tautology, self-contradictionand evaluative infeasibility.According to Lucas (2009), the statement of MMI that �transition rates and inequal-
ity (as measured by odds ratios) remain constant unless forced to change by increasingenrollments� (Raftery and Hout, 1993, p. 42) can be understood in two ways: First, tran-sitions by class odds-ratios ω1 are a function of the e�ect of social origins on education
62
I. Causes and E�ects of Teachers' Evaluations: A Theoretical Primer
demand, β, and the change in this e�ect over time, γ:
ω1 = h(β + γ) (2)
Concluding that unless forced, odds-ratios will not change, implies that γ = 0 (Lucas,2009, p. 466). Second, however, if transition rates are forced to change by increasingenrollments, according to Lucas (2009), the only conceivable way that margin-free odds-ratios could be forced to change would have to read
ω2 = h((β + γ), (α + λ)) (3)
� where α denotes the e�ect of population size on educational demand, and λ againthe change in this e�ect over time. Hence, a change in the e�ect of population size oneducational demand could force to change the transition odds-ratios without any changein the origin e�ect.By plotting the results of an analysis of the main MMI statement in a logistic regression
framework, Lucas (2009) can show that i) odds-ratio ω2 is not margin-contaminated, asMMI would require; and ii) ω1 is not forced down if high-origin transition probabilitiesincrease towards 1. Thus, MMI is either contradictory (in case of ω2) or evaluativelyinfeasible (in case of ω1).Regarding RRA and EMI, both proposals stand the test of being non-tautological,
non-contradictory and evaluatively feasible. As both RRA and EMI share a lot of com-mon statements with yet a number of considerable di�erences, Lucas (2009) is unable toget to a �nal statement whether the two theories relate to each other in a complementary(or even nested?) manner.What is common among all theoretical accounts presented above is that by origin,
they are not aimed at explaining changes in background e�ects over educational tran-sitions � but over student cohorts. This phenomenon has already been reconstructedas an opportunity-mediated social mechanism by Hedström (2005, p. 55): �Di�erencesin social mobility rates between di�erent nations or between di�erent points in timeare explained by reference to di�erences in mobility opportunities due to di�erencesin occupational or class distributions.� This is approximately true for MMI (thoughformally rejected) since population growth is supposed to a�ect individual transitionratios. However, reading EMI more closely reveals that what it actually postulatesshould be reconstructed more accurately as a concatenation of an opportunity- and adesire-mediated mechanism since MMI also supposes population size to a�ect educationaldemand (captured by parameter α in Lucas' formal evaluation).Regarding RRA, its strong anchoring on students' beliefs was already carved out
� which re�ects that a simple opportunity-mediated mechanism would fall too short.Finally, one could conclude that just as MMI, also EMI challenges RRA's assumptionof constant desires among the social strata since it postulates that classes di�er intheir placement on available educational tracks (academic vs. vocational) � which maythoroughly be due to class-speci�c di�erences in educational desires.However, for the objective of the present study, the particular applicability of RRA
stems from the fact that it explicitly links students' ability to their subjective expected
63

4 Applications
probability of educational success (while EMI is agnostic on this relationship; see Lucas,2009, p. 502). As this is the crucial link the formal model of self-ful�lling propheciespresented in the third paper points to, RRA might be more suitable for deducing waning-coe�cient hypotheses in this regard.
Bayesian belief updating This is especially true since in later writings, Breen (1999)and Breen and García-Peñalosa (2002) propose the mechanism of Bayesian learning toaccount for student belief updating conditional on having passed an educational tran-sition. In social mechanism theory, learning theory in general can be regarded �as aspeci�c type of DBO theory that is applicable when actors use information about thepast to decide what to do in the future � (Hedström, 2005, p. 41).The core idea of the reasoning followed in the paper is that students update their
beliefs while following the Bayesian rule, which is illustrated in �gure 2 (cf. Lynch, 2007,p. 10f.). Let us say that p(A|B) denotes the area consisting only of A while assumingthat B is already true. (The '|' is read as 'given', so p(A|B) means the probability ofA given B.) If we know that B is true, then the total sample space from the entirerectangle is reduced to the circle B only. Given this reduced space B, p(A) is in turnreduced to (A,B) � which is given by the A ∩ B region. If A and B were independent,p(A,B) = p(A) · p(B). Thus, knowing that B is already true, it follows that
p(A|B) =p(A,B)
p(B)(4)
Figure 2: A Venn diagram illustrating the Bayesian rule. Source: Lynch (2007, p. 11).
Breen (1999) and Breen and García-Peñalosa (2002) proposed to model students'belief updating mechanisms � having passed a given transition � in a way of Bayesianlearning that follows the above-shown rule. If θ′ denotes a state wherein e�ort has astronger impact on the probability of success than ability, and θ a state wherein it would
64

I. Causes and E�ects of Teachers' Evaluations: A Theoretical Primer
be just the opposite, and AH a student's choice of a high educational career path, thenthe posterior belief of a student about θ′ (i.e. the belief about θ′ conditional on havingsucceeded in the high educational career path AH) reads (Breen and García-Peñalosa,2002, p. 909):
Pr(θ′|AH) =Pr(AH|θ′)Pr(θ′)
Pr(AH|θ′)Pr(θ′) + Pr(AH|θ)Pr(θ)(5)
Hence, students' posterior belief about θ′ is a function of their prior belief about θ′
times the prior belief about their success in the higher academic track given that θ′ istrue (i.e. that e�ort is more important than ability) � divided by the term just describedplus the prior belief that θ is true (i.e. ability is more important than e�ort) times theprior belief about their success in the higher academic track given that θ is true.Grounding on these theoretical considerations, in the paper I use the mechanism of
Bayesian learning proposed by Breen (1999) and Breen and García-Peñalosa (2002) toaccount for students' belief updating in course of their educational transitions. Admit-tedly, I do not present a comprehensive Bayesian model of educational transitions �which would go beyond the scope of a primarily empirical contribution. Notwithstand-ing this issue, the theoretical speci�cation should hopefully become clear even though:Recall that according to what has been postulated regarding the theoretical speci�-cation of a teacher treatment e�ect on students' educational transitions in sense of aself-ful�lling prophecy, the subjective expected probability of educational success of astudent who has been overestimated should be higher than the respective self-estimateof a student who had been underestimated by her teacher. Now the crucial assumptionis that given an educational transition was successfully passed, this belief is updatedupwardly. Due to this mechanism of belief updating conditional on having successfullypassed the preceding transition, in the paper, it is illustratively sketched that variationin student beliefs should become more homogeneous � leading to decreasing self-ful�llingprophecy e�ects over time.This rationale is then used to deduce testable hypotheses. Apart from the 'baseline'
assumption (which is also tested in the third paper) that self-ful�lling prophecies in termsof a teacher treatment e�ect may have an impact on students' transition probabilities(which is here tested by means of di�erent data; see below), two di�erent hypothesesaddress potential changes of this e�ect over time: First, I postulate that the e�ect ofa teacher's expectation which is measured before the �rst transition point on the �rsttransition is larger than the e�ect of a teacher's expectation which is measured beforethe second transition point on the second transition. Second, I hypothesize that thelong-term e�ect of a teacher's expectation measured before the �rst transition pointon the second transition is smaller than the two possible short term e�ects. I expectboth phenomena to occur due to a mechanism of Bayesian updating of student beliefsconditional on having successfully passed the �rst transition.
Results To evaluate all hypotheses that were deduced above, measures of teachers'expectations at two di�erent points in time as well as two di�erent transition points
65
4 Applications
� idealiter temporarily closely following upon such a measure � have to be observed.Unfortunately, the CHiSP only entails indicators of teachers' expectations measured instudents' 10th class, and nothing more. This is why other data sources have to be takeninto account.Since I did not �nd data that satis�es the above conditions and also entails accurate
indicators of students' cost-bene�t considerations in sense of Esser's (1999) SEU modelof educational transitions, I make use of the technique of statistical matching (Rubin,1986; D'Orazio et al., 2006) in order to arrive at an arti�cial longitudinal data �le bymeans of linking distinct student data �les according to a distance function.Concretely, apart from CHiSP, I rely on a data set named �Elternhaus und Bil-
dungschancen� (Parental H ome and Educational Opportunities; henceforth abbreviatedas PHEO) which was surveyed at about the same time (1968) as the former data. Themeasure of teachers' expectations available here are primary school teachers' transitionrecommendations regarding whether or not a given student should better attend Germanhighest track school (Gymnasium) � or a lower form.83 Consequently, the correspond-ing educational transition taken from PHEO are students' transitions from primary tosecondary school (here also simpli�ed to the question whether or not students made itto Gymnasium). Additionally, comparable variables in order to operationalize students'cost-bene�t considerations as well as controls for parental social class could be derived.As in CHiSP, teachers' expectations are residualized by using appropriate indicators ofstudents' performance and motivation, respectively, in order to arrive at an empiricalidenti�cation of a self-ful�lling prophecy in terms of a teacher treatment e�ect by iso-lating the inaccurate part in teachers' expectations.84 Both data are linked in orderto arrive at an arti�cial longitudinal data set by means of statistical matching. Con-cretely, a vector of variables X from �le A and another vector of variables Z from �leB � with each of them missing in the other �le, respectively � can be combined basedon a vector of variables Y common to both �les as long as X and Z are independentconditional on Y. This conditional independence assumption cannot be tested empir-ically but only evaluated theoretically. As it is outlined in more detail in paper 4, Iexpect both teachers' evaluations and students' transition recommendations in primary(X) and secondary school (Z) to be independent of each other conditional on a vectorof students' cost-bene�t considerations Y.Having identi�ed students' expected bene�t, their expected amount of status decline
and their subjective expected probability of educational success as suitable matchingindicators in both data sources, the two �les are linked by means of the Gower distancefunction which accounts for mixed binary and categorical measurement levels and isavailable in the StatMatch package in R (D'Orazio, 2009). Descriptive analyses do notindicate any occurrence of severe bias in the matched �le.
83The precise alternatives were a recommendation for an intermediate track (Realschule) or the lowertrack (Hauptschule), but for statistical matching purposes, this variable is dichotomized.
84In contrast to CHiSP, PHEO did not test for students' intelligence test scores � which is why onlygrades were used for residualization purposes in both data sets regarding the performance dimen-sion. Similarly, residuals are not net of students' self-assessment regarding their relative schoolperformance due to lack of measurement in PHEO.
66
I. Causes and E�ects of Teachers' Evaluations: A Theoretical Primer
Using transition information from both sources, in the synthetic �le, a dependentvariable of subsequent educational transitions is computed measuring i) whether or notstudents made it to Gymnasium, ii) whether or not the remaining students passed Abituron the �rst try, and iii) whether or not the remaining students started academic studieswithin 2 years. Comparing signi�cance statistics for the prediction of transitions fromprimary to upper secondary school (Gymnasium) between original PHEO data on theone hand and the synthetic �le on the other hand, results indicate potential overesti-mations of the e�ect of students' subjective expected probability of educational success,and also of the e�ect of subjective costs in the synthetic �le. However, relatively sim-ilar values in both e�ect sizes and signi�cance statistics can be observed for the threeresiduals that were used to identify self-ful�lling prophecies.
Comparing the impact of the residual terms on students' later educational transitions,I �nd signi�cant but somewhat smaller e�ects on students' probability of passing Abitur� but insigni�cant estimates for students' propensity to start academic studies. Hence,based on the synthetic �le, the general self-ful�lling prophecy hypothesis only holds forthe �rst two transitions but has to be rejected for the third one.
Evaluating predicted probabilities for the comprehensive educational transition mod-els obtained from sequential logit modeling, i) di�erences in predicted transition proba-bilities between students with primary school over- and underestimations, respectively,become smaller from transition 1 (+/- Gymnasium) to transition 2 (+/- Abitur); ii)di�erences between students with secondary school over- and underestimations, respec-tively, become smaller from transition 2 to transition 3 (+/- university transition); andiii) the predicted probabilities of students who have been overestimated at secondaryschool to make the transition to university are still higher than the predicted probabil-ities of students who had been overestimated at primary school. Observation i) and ii)give support for the hypothesis postulating decreasing teacher expectancy e�ects due todi�erent treatments onto an immediately occurring educational transition over students'educational life course, and observation iii) gives support for the hypothesis postulatingshort-time teacher treatment e�ects to be larger than long-time e�ects.
Regarding robustness analyses, a comparison of the results obtained from the synthetic�le with 'real' Panel data in terms of the British Cohort Study (BCS )85 suggests that inthe latter data, the same trend of di�erences in predicted probabilities can be observed.Additional sensitivity analyses (Buis, 2007, 2010, 2011) indicate that an unobserved butnonetheless confounding variable could be an issue of distortion particularly at latereducational transition points. Notwithstanding this potential source of bias, I hold theview that in sum, results tend to support the assumption of a belief-mediated mechanismof Bayesian updating in a sequence of educational transitions.
85Although the BCS contains measures for both students' multiple educational transitions and multipleteachers' evaluations, its measures for student cost-bene�t considerations are a far cry from beingoptimal. Hence, I still regard the results as obtained from statistical matching to be of distinctscienti�c value.
67
5 Conclusion
5 Conclusion
Summary Starting with Max Weber's de�nition of sociology as a scienti�c disciplinethat strives for both an interpretive understanding, and � by means of that � a causalexplanation of its subject matter (Weber, 1964, p. 88), I �rst discussed how Weberattempts to unify the Geisteswissenschaften and positivism as two lines of thoughtsthat had separated from each other at the end of the 19th century. In this context, Ialso highlighted that as regards the claim for a comprehensive understanding, Hempel'sdeductive-nomological explanations or covering-law model � that still prevails as thedominant paradigm in certain sociological textbooks (e.g. Opp, 2005b) � unfortunatelyfalls behind both Weber's understanding explanation and Popper's situational logic en-tailing a relatively broad notion of rationality well-equipped to ful�ll the demand ofunderstanding social action.Overcoming the methodological myopia of the covering-law model is also a crucial
objective of recent social-mechanism approaches in analytical sociology. While it wasshown that the existing multitude of de�nitions can be distinguished along the dimen-sions of i) their observability, ii) their law-likeness, and iii) their level of analysis, theirgeneral aims can best be described by Elster's metaphor of �opening the black box andshowing the cogs and wheels of the internal machinery� (Elster, 1985, p. 5). In con-junction with a notion of subjective rationality of intermediate strength within strongbonds to situational restrictions (Goldthorpe, 1998) such as the desires, beliefs, and op-portunities model proposed by Hedström (2005), desire-mediated, belief-mediated andopportunity-mediated mechanisms can be distinguished. Within that framework, follow-ing the maxim of Occam's Razor (Thorburn, 1918), a parsimonious theory of actionshould be preferred which may be amended by additional bridge assumptions where thesimpli�ed version is found to be unrealistic (Lindenberg, 1990). I postulated that thisframework would also prove useful in approximating the causes and e�ects of teachers'evaluations by means of mechanism-based explanations in sense of a Weberian under-standing explanation.Having outlined these more abstract theoretical foundations, I then continued by link-
ing Max Weber's (2000) de�nition of social class in terms of life chances to the thesis ofmeritocracy (Young, 1958; Bell, 1972) positing that individuals' social position shoulddepend on their respective merits which are de�ned as the sum of individual IQ ande�ort. Having rejected the postulate of some authors (Jensen, 1969; Herrnstein andMurray, 1994) about the primacy of the heritability of intelligence and its impact on in-dividual achievement compared to social background variables (Heckman, 1995; Fischeret al., 1996; Daniels et al., 1997; Korenman and Winship, 2000), I focused on both clas-sic and recent theoretical approaches accounting for student inequality in educationalopportunities (IEO). Grounding on a still in�uential distinction by Boudon (1974), socialinequality in educational transitions can be decomposed into primary e�ects � mainlydue to social-environmental factors � and secondary e�ects of social inequality � mainlydue to varying utility considerations attached to a particular educational transition byparents of di�erent social strata. To be precise, even if primary e�ects of social inequal-ity in terms of performance di�erences between the social strata were accounted for,
68
I. Causes and E�ects of Teachers' Evaluations: A Theoretical Primer
their educational transition propensities would still di�er because of a belief-mediatedmechanism of relative risk aversion (Breen and Goldthorpe, 1997): The higher parents'socioeconomic status, i) the higher their e�ort necessary to ensure their o�spring wouldat least be equal o� in terms of educational quali�cation; ii) the higher the expectedbene�t of higher education; iii) the higher the subjective expected probability of educa-tional success (even apart from actual performance di�erences); and iv) the lower bothmonetary and transactional costs are perceived. This set the ground for the followinganalysis of teachers' evaluations as one of students' signi�cant others a�ecting their lifechances in terms of educational transition probabilities.Finally, I tried to recapitulate the main �ndings of my four papers in this volume
by using the theoretical toolbox discussed above. Focus of all four papers are teachers'evaluations of students' prospective academic aptitude as measured in the Cologne HighSchool Panel (CHiSP). While the �rst two papers consider these evaluations as an out-come, papers three and four use residualized teachers' evaluations � aimed to identifyself-ful�lling prophecies in terms of a teacher treatment e�ect � as a predictor of thestudents' later educational transitions. Hence, in the 'applied' part of this introduction,I initially focused on the underlying mechanisms of the teacher side of the social situa-tion as regards their formation of evaluations, and thereafter, on teachers' expectations� again measured in terms of their evaluations � as an intervening variable for students'cost-bene�t considerations.
In the �rst paper, it is proposed that the formation of teachers' evaluations as mea-sured in CHiSP can generally be reconstructed by frame-selection theory. The latterassumes that when individual actors are exposed to a social situation, at �rst, a cer-tain frame of this situation will be activated either automatically, if unquestioned; orby means of more penetrative rational re�ection, if problematic. While the frame ofteachers' social situation � a survey question asking for a nonbinding evaluation of theirstudents � will be unproblematic, and therefore, automatically activated, the scripts ofaction invoked in the second step might well vary between automatic processing andrational re�ection. Most probably, teachers' beliefs about their students may be theresult of an automatically-driven meritocratic assessment grounding on students' grades(meritocracy-as-mode). Perhaps less legitimate, but equally understandable might beteachers' automatic shaping of their evaluations based on student social backgroundcriteria, of which unconscious habitus-related match/mismatch considerations would bea prominent example. Complementary, both meritocratic criteria (such as students'intelligence apart from school grades) as well as social backgrounds (such as parentalsocioeconomic status as a perceived indicator for parents' ability to provide academicsupport) could also serve as rationally-driven motives of teachers' formation of beliefsabout their students. Although empirical analyses based on CHiSP data are not suitedto decompose automatically-driven and rationally-driven ways of teachers' belief forma-tions, results indicate that meritocratic criteria such as student grades and intelligenceare more important predictors of teachers' evaluations than parental socioeconomic sta-tus or student aspirations (as an indicator of what is usually referred to as an academichabitus) � though the latter variables are still signi�cant. This could be interpreted in
69
5 Conclusion
that teachers' evaluations are for the most part, though not perfectly, accurate beliefsof students' actual achievement.
The second paper asks to what extent teachers' evaluations would be subject toreference-group e�ects. Some arguments referred to what is conventionally known asBig-Fish-Little-Pond E�ect (BFLPE) research (with students' academic self-concept asan outcome and class-level achievement as a contextual-level predictor), but since teach-ers' evaluations as an outcome are very distinct from the former dependent variable, alsodi�erent social mechanisms had to be unfolded. While I argued that the conventionalnegative BFLPE of class-level achievement on students' academic self-concept is one netof a counterbalancing positive Re�ected-Glory E�ect (RGE) of school-level social status(Marsh et al., 2000) since two di�erent social mechanisms are at work simultaneously (anendogenous feedback e�ect in case of the BFLPE, and an exogenous contextual e�ect incase of the RGE ; see Manski, 1993, p. 31f.), a negative e�ect of class-level achievementon teachers' evaluations could be due to an opportunity-mediated mechanism in termsof teachers' adjustment of their reference standards independently of their beliefs abouttheir students. Contrarily, either the opportunity-mediated mechanism of regression tothe mean or the belief-mediated mechanism of dissonance reduction � conveniently alsocalled Halo e�ect � could instead lead to a positive e�ect of class-level achievementon teachers' evaluations. In addition to these 'main e�ect' hypotheses, concatenationsof opportunity- and belief-mediated mechanisms could account for interaction e�ectsof class-level achievement with student-level achievement on the one hand, and withteachers' reported grading concepts on the other hand. Regarding results, multilevelanalyses supported the hypotheses of a Halo e�ect caused by the concatenation of anopportunity- and belief-mediated mechanism of dissonance reduction � leading to a pos-itive e�ect of class-mean achievement on teachers' evaluations. Concerning interactione�ects, the coe�cient of class-level aggregated student grade point average (GPA) sig-ni�cantly increases with better individual student marks.
Since results of the �rst two papers indicate that there is a residual part of inac-curacy in teachers' expectations as measured by teachers' evaluations, the third paperinvestigates to what extent this inaccuracy net of suitable measures of both studentmotivation and achievement could account for di�erences in students' educational tran-sition propensities net of indicators of student (or parent) cost-bene�t considerationsregarding these transitions. The underlying mechanism of this hypothesized e�ect isone of student belief-mediation in terms of a self-ful�lling prophecy (Merton, 1948) dueto a teacher treatment e�ect which has also been called the Pygmalion e�ect (Rosen-thal and Jacobson, 1968). Theoretically, I assume this mechanism to operate via anunobserved e�ect of teacher 'caress' on students' later subjective expected probabilityof educational success that leads to di�erences in transition rates between students whohave been overestimated and students who have been underestimated by their teacher.Empirically, this e�ect is identi�ed by residualizing teachers' expectations (measuredby their evaluations) on indicators of student achievement such as intelligence or gradepoint average as well as of motivation and academic self-concept. These residuals are
70
I. Causes and E�ects of Teachers' Evaluations: A Theoretical Primer
found to signi�cantly predict students' propensity to pass Abitur (German high schooldegree qualifying for academic studies) net of controls for expected bene�t of education,the motive of status maintenance, subjective expected probability of educational success,and perceived costs of education. Furthermore, this e�ect is robust against two distinctapproaches accounting for unobserved heterogeneity (Heckman, 1979; Buis, 2007, 2010,2011). In contrast, no robust signi�cant e�ect can be noted regarding students' univer-sity transitions � indicating that self-ful�lling prophecies in terms of a teacher treatmente�ect might diminish over time.
Exactly this is the crucial question of the fourth paper. In its theoretical section,�rst, several approaches from inequality in educational opportunity research suggest-ing decreasing e�ects of students' social backgrounds in their educational course of life� Life Course Perspective (Müller and Karle, 1993); Maximally Maintained Inequality(Raftery and Hout, 1993); Relative Risk Aversion (Breen and Goldthorpe, 1997); andE�ectively Maintained Inequality (Lucas, 2001, 2009) � are discussed. Since on the onehand, Relative Risk Aversion is one of the two theories not rejected by Lucas (2009),and on the other hand, it explicitly links students' ability to their beliefs (in terms ofsubjective expected probabilities of educational success), it is considered to be the mostpromising candidate among the theories discussed in order to develop the argument forthe hypothesis of decreasing self-ful�lling prophecy e�ects over time. Indeed, Breen andGoldthorpe (1999) and Breen and García-Peñalosa (2002) propose a belief-mediatedmechanism of Bayesian updating that could well account for decreasing teacher treat-ment e�ects on students' beliefs about their expectations of success (as proposed fortheoretical identi�cation of self-ful�lling prophecy e�ects in paper 3). The di�erence inupward belief adjustment between students who have been overestimated and studentswho have been underestimated by their teachers � conditional on having successfullypassed a transition, respectively � can be assumed to be positive. Therefore, I postulatei) that the e�ect of a teacher's expectation which is measured before the �rst transitionpoint on the �rst transition is larger than the e�ect of a teacher's expectation which ismeasured before the second transition point on the second transition; and ii) that thelong-term e�ect of a teacher's expectation measured before the �rst transition point onthe second transition is smaller than the two possible short-term e�ects. Due to lackof suitable data, a synthetic �le is created by means of statistical matching (D'Orazioet al., 2006) of the CHiSP one the one hand, and a panel survey named 'Elternhaus undBildungschancen' (Parental Home and Educational Opportunities; PHEO) on the otherhand � with PHEO comprising of measures of teachers' expectations, student achieve-ment and motivation indicators, parent cost-bene�t considerations in primary school;and CHiSP measuring respective variables in secondary school. Based on the resultingsynthetic �le observing arti�cial student transitions from primary to secondary schooluntil starting academic studies, it is observed that i) di�erences in predicted transitionprobabilities between students with primary school over- and underestimations, respec-tively, become smaller from transition 1 (+/- Gymnasium) to transition 2 (+/- Abitur);ii) di�erences between students with secondary school over- and underestimations, re-spectively, become smaller from transition 2 to transition 3 (+/- university transition);
71
5 Conclusion
and iii) the predicted probabilities of students who had been overestimated at secondaryschool to make the transition to university are still higher than the predicted probabil-ities of students who had been overestimated at primary school. A set of robustnessanalyses indicates that these results are stable against a variety of statistical checks.For illustrating purposes, �gure 5 provides an overview of the crucial social mech-
anisms hypothesized for the four papers of the volume at hand. In the �rst paper,student characteristics As (such as achievement or social backgrounds) a�ect teachers'evaluations At passed on a belief-mediated mechanism Bt: For each of the constructsmeritocracy and habitus, teachers' variable rationality Kroneberg (2005, 2006) is con-sidered by assuming script selection either based on habitual routines and automaticprocessing (as-mode) or on rational re�ection (rc-mode). At the current stage, the the-oretical model remains silent on assumptions regarding potential variation in teachers'desires or their opportunity context.This opportunity structure is explicitly considered in the second paper. Concretely,
the classroom context Ot may directly 'lift' teachers' evaluations At in terms of reference-standard adjustments (opportunity-mediated mechanism), or also indirectly by means ofan additional belief-mediated mechanism Bt when teachers project higher class meanachievement also on low-achievement students. Moreover, the classroom opportunitystructure also moderates the belief-mediated mechanism of teachers' script selection:The higher school class' average achievement, counterintuitively, the more importantachievement-related criteria become. Again, no assumptions are made regarding varia-tion in teachers' desires.In the third paper, the idea of a self-ful�lling prophecy in the educational system is
reconstructed as a concatenation of belief-mediated mechanisms. First, student charac-teristics As1 (such as social backgrounds, cf. Ready and Wright, 2011) invoke teachers'sometimes more positive, sometimes more negative beliefs Bt about their students.86
According to the Thomas theorem (Thomas and Thomas, 1928), these beliefs may man-ifest in teacher treatment e�ects A′
t87 such as classroom praise, bilateral encouragement,
etc. The teacher treatment e�ect, in turn, has consequences for students' beliefs Bs2 interms of their subjective expected probability of educational success (pep). Well in linewith the logic of Esser's (1999) SEU model, the self-ful�lling prophecy has consequencesfor students' educational transition propensities (here denoted as As2). As in paper one,I am agnostic about potential variation in both teachers' desires and opportunities.The fourth paper entails only one change compared to the third one: Conditional on
having passed a preceding transition As2 or not, students upwardly or downwardly adjusttheir beliefs Bs3 in terms of their subjected expected probability of educational success.According to Esser's (1999) SEU model, this a�ects students' subsequent transitionpropensities As3.
86In line with the paper's methodological speci�cation, it is important to note that these are beliefsapart from both student achievement and motivation.
87I use the 'tick' in A′t to clarify that the teacher treatment e�ect is analytically distinct from teachers'
evaluations analyzed in papers 1 and 2 (though the same variable is used for empirical identi�cationstrategies).
72
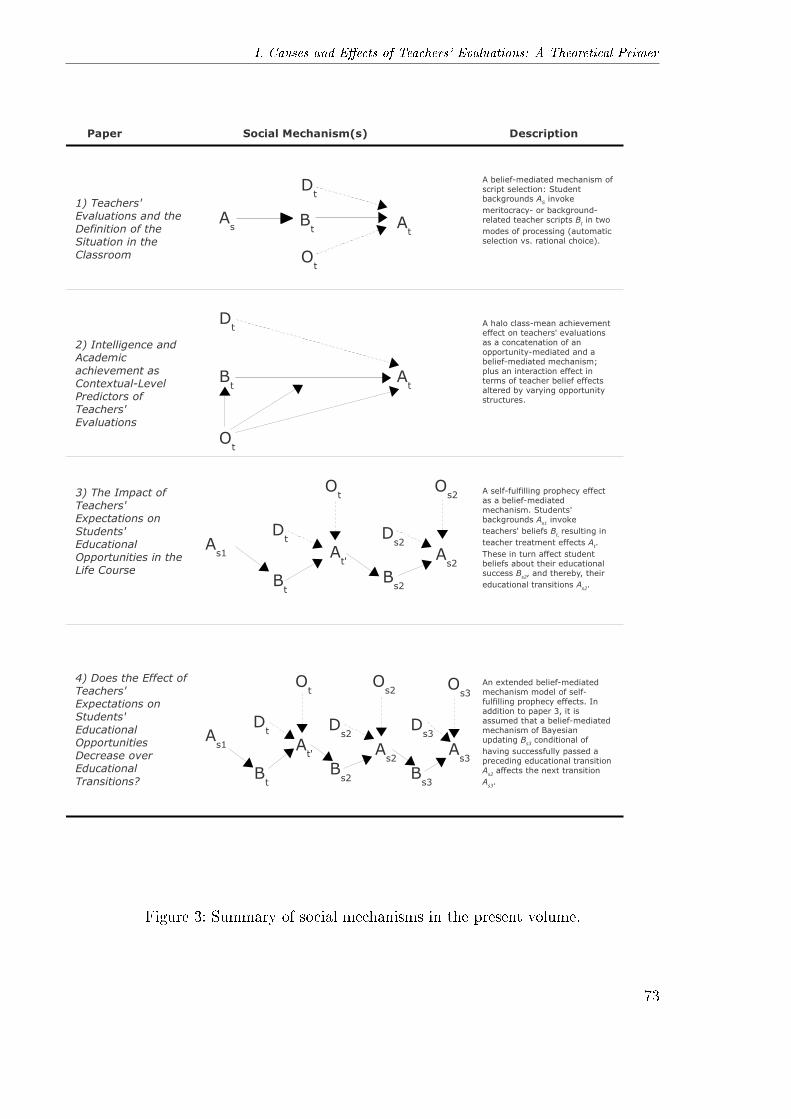
I. Causes and E�ects of Teachers' Evaluations: A Theoretical Primer
Dt
Bt
As
Dt
Bt
As1
Bs2
Ds2
As2
1) Teachers' Evaluations and the Definition of the Situation in the Classroom O
t
At
Paper Social Mechanism(s) Description
2) Intelligence and Academic achievement as Contextual-Level Predictors of Teachers' Evaluations
Dt
Bt
Ot
At
3) The Impact of Teachers' Expectations on Students' Educational Opportunities in the Life Course
Ot
Os2
Dt
Bt
As1
Bs2
Ds2
As2
Ot
Os2
Bs3
As3
Ds3
Os3
A belief-mediated mechanism of script selection: Student backgrounds AS invoke meritocracy- or background-related teacher scripts Bt in two modes of processing (automatic selection vs. rational choice).
A halo class-mean achievement effect on teachers' evaluations as a concatenation of an opportunity-mediated and a belief-mediated mechanism; plus an interaction effect in terms of teacher belief effects altered by varying opportunity structures.
A self-fulfilling prophecy effect as a belief-mediated mechanism. Students' backgrounds As1 invoke teachers' beliefs Bt, resulting in teacher treatment effects At. These in turn affect student beliefs about their educational success Bs2, and thereby, their educational transitions As2.
An extended belief-mediated mechanism model of self-fulfilling prophecy effects. In addition to paper 3, it is assumed that a belief-mediated mechanism of Bayesian updating Bs3 conditional of having successfully passed a preceding educational transition As2 affects the next transition As3.
4) Does the Effect of Teachers' Expectations on Students' Educational Opportunities Decrease over Educational Transitions?
At'
At'
Figure 3: Summary of social mechanisms in the present volume.
73

5 Conclusion
Outlook Having set the ground for the papers included in this volume, �nally, palpa-ble limitations and resulting propositions for follow-up studies should be summarized.In paper one, a notable limitation is that due to data restrictions, we are not able toempirically identify the conditions of which mode of information-processing (automaticas-mode or rational rc-mode) is used by teachers. Hence, an urgent advice for futurestudies would be to develop even more �ne-grained mechanism-based explanations insearch of intervening opportunity structures or teacher belief sets that might account fordi�erences in information processing. Idealiter, these new explanations should be testedby means of appropriate indicators leading to a better understanding of the information-processing side of teachers' expectancy formation. Methodologically, considering indi-cators on the teacher level would imply to extend our method of analysis towards amultilevel structural equation model (Muthén, 1994; Bauer, 2003) where teachers' eval-uations of their students are nested in teacher contexts.Another limitation of the �rst paper is that although a structural model is used as
method of analysis, controls for measurement error may be regarded to be insu�cient.This becomes particularly an issue concerning the operationalization of unconsciousforms of symbolic communication between teachers and students usually referred to ase�ects of habitus : As indicated in the last section of this introduction, in the paperwe found a signi�cant e�ect of the analogy sub-dimension of intelligence on both stu-dents' average grade and teachers' evaluations. Within our framework distinguishingbetween as-mode and rc-mode processing on the one hand and meritocracy- and social-background-related predictors on the other hand, this could either be understood as amanifestation of a meritocracy-rc-mode type of processing (in terms of a particular im-portance of analogy-based inferences to the teachers). But on the other hand, since wedo not dispose of a su�ciently high number of indicators in order to minimize measure-ment error, we cannot reject the alternative interpretation that teachers' appreciationof the verbal dimension of intelligence relates to habitual forms of student behavior thatis valued by teachers in both their evaluations and grade assignments. Furthermore, onthe one hand, the latter are also an aggregate form of teachers' evaluations (and could inturn be the result of habitus-related criteria); and on the other hand, students' objectiveacademic performance could be understood as a latent variable which is only imperfectlymeasured by their average grades. For instance, teachers might refrain from consideringstudents' class contribution all too much in their grading assignment (though one wouldexpect a considerable correlation between the two), but class contribution might a�ecthow teachers arrive at a more general evaluation of students' prospective aptitude foracademic studies. Students' class contribution would now be a probable candidate toincorporate both habitus-related characteristics and to be responsible for the separateregression path of both students' average grades and teachers' evaluations on the verbaldimension of students' intelligence in terms of the analogy sub-score.Regarding the latent variable of academic performance, a conventional �rst-order fac-
tor model will already be an improvement to current manifest approaches. Concerningmeasurement of a latent variable of habitual background-related forms of student be-havior and symbolic communication, however, we would encourage future studies ofteachers' evaluations to make use of a second-order factor model (Chen et al., 2005;
74
I. Causes and E�ects of Teachers' Evaluations: A Theoretical Primer
Rindskopf and Rose, 1988) wherein students' so-called habitus is the higher-order factorwhich is measured by lower-level factors such as parental SES, parental cultural capital(including cultural practices) and maybe also students' aspirations (but cf. footnote 63)� each of them ideally operationalized by a variety of appropriate indicators.
Regarding paper two, there is still work left concerning the theoretical justi�cationof both 'main' and interaction e�ect hypotheses in the paper as well as with respectto their mechanism-based explanation in this introductory chapter. Thus, a more �ne-grained analysis of the social mechanisms behind teacher-level variables such as theirframes of reference as potential moderators of reference-group e�ects on teachers' eval-uations will be inevitable. Following Hauser (1970a, p. 659), a thorough speci�cationof the individual-level situation is of utmost importance before research can arrive at acomprehensive understanding also of contextual-level e�ects. Therefore, more researchon the conditions of teachers' active mode of information-processing (as-mode vs. rc-mode) as demanded for the analysis of teachers' social situation in the classroom (paper1) is also needed as a theoretical prerequisite for the analysis of contextual-level e�ectson teachers' evaluations and their interaction with teacher-level variables.In this context, at least from my point of view, it is really astonishing that since Blalock
and Wilken (1979), no e�ort has been invested in the analysis of opportunity-mediatedmechanisms of individual cost-bene�t considerations. From the more methodologicalliterature (Friedrich, 1982; Brambor et al., 2006) we know that cross-level interactione�ects can either be understood as as a contextual-level e�ect varying with an individual-level predictor, or as an individual-level e�ect varying with a contextual-level predictor� and the same, of course, applies for the social mechanisms behind. Hence, of course,the relative importance of student characteristics for a teacher to arrive at an evaluationmay vary with class-average achievement � even if in our study, marginal e�ects of thecomplementary reading indicated relatively higher e�ects. Since an important limitationof our study is the selectivity of our data, we would not see the former reading to berejected at all.Even if the theoretical approach intentionally chosen here follows a very soft action-
theoretical framework, future studies might wish to ground reference-group e�ect hy-potheses � irrespectively of the outcome at hand � on more elaborate cost-bene�t re-lated social mechanisms. Nota bene, Blalock and Wilken (1979) already observed that�contextual variables may a�ect either subjective probabilities (expectancies) or utili-ties (values) and thereby produce either additive or multiplicative contextual terms� (p.360). Since I do not see that sociologists have advanced in this respect in general, Irecommend scholars to invest more theoretical e�ort in the speci�cation of potentiallyopportunity-mediated mechanisms of social actors' utility considerations.Furthermore, conventional BFLPE research found student gender composition in the
classroom to be a moderator of class-level achievement e�ects on students' academicself-concept (Thijs et al., 2010). This e�ect can be explained by the assumption thatindividuals' beliefs about their abilities are shaped in relation to in-group standards(Rosenberg, 1979, ch. 6-9), and it was found that same-gender classmate beliefs morestrongly a�ect students' academic decisions than opposite-gender classmate beliefs (Cor-
75
5 Conclusion
rell, 2001). For this reason, a higher negative BFLPE of same-gender classmate achieve-ment than of opposite-gender classmate achievement on students' self-concept can bereconstructed as a concatenation of an opportunity- and a belief-mediated social mech-anism. Similarly, teachers might hold di�erent beliefs of their students depending onparticular combinations of their own gender, students' gender, the gender compositionin the classroom, and possibly even teachers' gender composition in school. Therefore,future studies should analyze if reference-group e�ects on teachers' evaluations vary withdi�erent gender contexts.88
Although a speci�cation of the opportunity structure shaping students' utility consid-erations would certainly be an important issue for the theoretical model of self-ful�llingprophecies in terms of a teacher treatment e�ect, the more serious limitation of pa-per three can be seen in its hiatus between the theoretical and the empirical model.As outlined above, the identi�cation assumption of the theoretical model is that self-ful�lling prophecies operate via both an indirect (in terms of student grades) and a directunobserved teacher treatment e�ect on students' subjective expected probability of ed-ucational success � while all other cost-bene�t parameters are assumed to be constant.I do not have to lay much emphasis on the fact that this assumption may be violatedfor a couple of reasons. Sensitivity analyses as performed in paper three try to addressthe objection that teachers dispose of private information on unobserved student char-acteristics that either enter their utility function or directly a�ect transition decisions �but that surely are only an imperfect approximation of potentially intervening variables.Hence, future studies should try to measure a larger set of indicators of teachers' evalua-tions in order to minimize measurement error and thereby the risk of neglecting teachers'private information about their students' academic aptitude. Empirically, this could beperformed in well-known latent-variable frameworks such as con�rmatory factor analysisand structural equation modeling, or also item response theory (Rasch, 1960; Embrestonand Reise, 2000; Bond and Fox, 2001). A useful property of the latter approach � apartfrom separate estimation of person and item parameters � is that it also allows to testfor the optimal treatment of empty categories such as students who never obtained apositive nor a negative evaluation by their teacher (i.e. whether they should be modeledin terms of an ordinal variable, or if they should rather be set to missing; cf. Drasgowand Hulin, 1990, p. 579).Ideally, the theoretical model of self-ful�lling prophecies in terms of teacher-treatment
e�ects operating via student di�erences in subjective expected probabilities of educa-tional success should also be tested empirically. Hence, indicators for this crucial variableshould be measured at di�erent points in time to assess changes in subjective expectedprobabilities. If these either positive (in case of overestimations) or negative (in case ofunderestimations) changes were able to mediate the e�ect of the residual terms here usedfor empirical identi�cation of self-ful�lling prophecies, a strong hint for the theoretical
88Another recommendation addressed in the paper but less interesting in the context of a theoreticalrésumé is that teachers' evaluations could be analyzed more comprehensively as a trivariate outcomeby means of an ordered categorical multilevel model (Johnson, 1996, 1997; Gelman and Hill, 2007).
76
I. Causes and E�ects of Teachers' Evaluations: A Theoretical Primer
model's empirical validity would have been arrived at.Moreover, as one limitation of conventional Pygmalion and self-ful�lling prophecy
studies concerns an insu�cient consideration of potential moderators (especially withregard to students' social backgrounds), future studies should also test for interactione�ects of its respective measure of self-ful�lling prophecies with student (or parent) cost-bene�t considerations. The latter, in turn, could be important intervening variables interms of belief-mediated mechanisms that a�ect to what extent self-ful�lling propheciesactually take e�ect � resulting in another concatenation of social mechanisms.And �nally, although the theoretical framework used to explain self-ful�lling prophe-
cies throughout this volume is one grounding on SEU theory, the social mechanisms thathave been carved out for the �rst paper may have illustrated that rational comparisonsof the alternatives at hand, as taken for granted in SEU theory, are only one very specialcase of actors' variable rationality (Kroneberg, 2006). To be precise, students' rather un-conscious, automatic-spontaneous (as-mode) type of information processing should alsobe modeled in IEO research in general, and in self-ful�lling prophecy studies � that ex-plicitly argue in favor of subtle and unconscious teacher treatment e�ects � in particular.
A mechanism-related limitation can also be identi�ed in paper four. In its theoreti-cal section, an explanation of Bayesian updating is proposed to account for decreasingself-ful�lling prophecy e�ects over students' educational transitions. However, theseillustrations are, admittedly, a far cry from what will conventionally be understoodas Bayesian modeling. Hence, to obtain a comprehensive belief-mediated account ofdecreasing self-ful�lling prophecy e�ects, social scientists should invest more e�ort inBayesian models of belief updating. In my view, also sociologists' research about de-creasing student background e�ects in their educational life course would bene�t fromthis theoretical advancement.But this limitation is certainly a more important issue regarding the consequences of
multiple over- and underestimations for student belief updating. Madon et al. (2006)found that self-ful�lling prophecies can accumulate rather than dissipate over time ifa whole series of over- and underestimations is considered. Unsurprisingly, Bayesianexplanations of belief updating to explain accumulation of self-ful�lling prophecies stillhave to be developed.In this context, also two opportunity-mediated mechanisms are worthwhile to be con-
sidered: First, it would be interesting to broaden the perspective on an analysis ofwhether the observed phenomenon of decreasing self-ful�lling prophecy e�ects over stu-dents' educational transition is in turn sensitive to temporal (i.e. period and cohort)or institutional e�ects. This is what Maximally Maintained Inequality (Raftery andHout, 1993) postulated regarding the volatility of student background e�ects, and thiscould equally hold for self-ful�lling prophecy e�ects: Understanding the latter as teachertreatment e�ects on students' subjective expected probability of educational success, thisconcept could be a function of the variance in students' social composition, the studentbody's average ability in di�erent grades due to di�erences in enrollment rates betweenstudent cohorts, periods or educational systems. Hence, future studies should pursue amore comparative perspective in order to be able to generalize the result of decreasing
77
5 Conclusion
self-ful�lling prophecy e�ects.
Finally, another institutional (and thus opportunity-mediated) issue directly e�ectsone measure of teachers' expectations used in paper four. In the primary-school sam-ple (Parental Home and Educational Opportunities; PHEO) that is merged with thesecondary-school sample (the Cologne High School Panel; CHiSP) via statistical match-ing (D'Orazio et al., 2006), primary school teachers' transition recommendations areused to operationalize teachers' expectations. However, German Federal states (Bun-desländer) di�er in the binding character of these recommendations as regards parentalactual transitions: While at the moment, in Hessia, Mecklenburg-West Pomerania,North Rhine-Westphalia, Lower Saxony, Rhineland-Palatinate and the three Germancity states Hamburg, Berlin and Bremen, the �nal transition decision is left to the par-ents, in all other Länder, the educational system is permitted to correct parental decisionswhen di�ering from teachers' recommendations. Notably, these institutional di�erenceshave been observed to a�ect students' transition odds: A recent study by Gresch (2009)notes that di�erences in predicted transition probabilities to German highest-track sec-ondary school (Gymnasium) between students of di�erent social strata are lower in caseof binding transition recommendations than in case of non-binding ones. At least twomechanism-based explanations could account for these di�erences: On the one hand,institutional constraints surely restrict parental opportunities to opt against a particu-lar transition recommendation. On the other hand, institutional constraints could alsoalter teachers' beliefs about the extent to which their recommendation a�ects students'educational careers. In case of non-binding recommendations, teachers' and parents' be-liefs about students' educational success show a partial interdependency in that teachersmight try to anticipate how parents might decide in case of a particular recommenda-tion. In case of binding recommendations, this anticipatory character is lessened sinceteachers know that parents may always be overruled. In consequence, di�erences in insti-tutional constraints therefore a�ect the social selectivity of particular secondary schooltracks in particular states. This might in turn in�uence students' subjective expectedprobability of educational success of the given secondary-school track; and hence, self-ful�lling prophecies could no longer be convincingly identi�ed by means of that conceptwhen, as in the case at hand, two samples from di�erent Federal states with transitionrecommendations potentially di�ering in their binding character are used.89
To tell a long story short, future studies should �rst use an alternative measure ofprimary-school teachers' evaluations which is not a�ected by institutional constraints;and second, if future studies would still have to rely on evidence from statistically-matched �les, ideally, two �les from the same state should be used to exclude possibledi�erences in students' cost-bene�t considerations arising from di�erences in the socialselectivity of a given state and thereby challenging theoretical identi�cation of self-ful�lling prophecies as proposed in papers three and four.
89In order to compare the legal status of primary school teachers' transition recommendations fromtwo di�erent Federal states, access to their respective Education Act would be required � which hasnot been possible yet due to time constraints.
78
I. Causes and E�ects of Teachers' Evaluations: A Theoretical Primer
Concluding theoretical and methodological remarks In sum, research on teach-ers' evaluations (and, to a certain extent, also IEO research in general) would certainlybene�t from a more thorough theoretical and methodological undergirding. Regardingtheory, IEO research recently discovered the relevance of the framework of counterfac-tuals for the analysis of educational transitions (Erikson and Jonsson, 1996b; Eriksonet al., 2005; Jackson et al., 2007). Furthermore, econometric theoretical models such asidenti�cation of a causal treatment e�ect have been adopted (for a review see Gangl,2010). However, from my point of view, social scientists tend to use both concepts ina rather sloppy manner � completely ignoring the ontological and epistemological pre-requisites involved. I do not have to lay much emphasis on the fact that the notionof causality is one of the philosophical problems discussed most intensely since ancientGreek philosophy (see e.g. Gotthelf, 1976). For statisticians such as Holland (1986) orRubin (1986), manipulability theories of causation are particularly attractive for theirgeneral assumption that manipulation of a cause will result in the manipulation of ane�ect (Woodward, 2008). But even these largely pragmatic theories of causation are notwithout problems: For instance, von Wright's (1971) account relates p's bringing aboutq to an agency concept that would have di�culties to incorporate environmental e�ects� that might also a�ect human interaction.90 And even the more recent and elaboratedstructural theory by Judea Pearl (2000) is not immune against the objection of circu-larity (Woodward, 2008).91 Hence, more e�ort should be invested into the speci�cationof the underlying causal framework of the social sciences.Similarly, counterfactuals are much more than a methodological tool-box easily at
hand for educational transition analysts. As Menzies (2009) points out, a notion ofcausality that would be interpreted as counterfactual from today's point of view wasalready held by David Hume92, and as indicated above, this notion culminated in DavidLewis' very elaborated theory of counterfactual causality (Lewis, 1973, 1977, 1979, 1981).However, it is important to note that Lewis' condition �If it were the case that A, then itwould be the case that C � (Lewis, 1973, p. 418) is more and more relaxed throughout hispaper to be true also when some A-world where C holds is closer to the actual world thanis any A-world where C does not hold (Menzies, 2009). This means that Lewis holdsa realism also about non-actual possible worlds close to ours that does not necessarilycoincide with social scientists' pragmatic usage of methodological counterfactualism asa tool for decomposing primary and secondary e�ects of social inequality.I do not say that methodological counterfactualism � given its ontological foundation
� is not suited for mechanism-based explanations that also strive to ensure a deeper
90An illustrative example for an environmental e�ect considerably constraining individual interactionis the war in Dafur: A progressive deserti�cation and soil erosion for the last 30 years caused adecrease in both cultivable areas and grasslands. This made members of several ethnic groups toleave their ancestral regions and to move to the higher-precipitation areas in the south of Sudan �where they came into con�ict with local ethnic groups (University for Peace, 2004).
91For an application of Pearl's theory of causation on educational inequality see Morgan and Winship(2012).
92�We may de�ne a cause to be an object followed by another [...] where, if the �rst object had notbeen, the second never had existed� (Hume, 1913, section VII).
79

5 Conclusion
understanding.93 Quite contrarily, the founding father of a uni�ed approach in thisrespect, Max Weber, holds a notion of causation that is notably close to contemporarycounterfactualism:
�The judgement that if a single historical fact is conceived of as absent fromor modi�ed in a complex of historical conditions, it would condition a course ofhistorical events in such a way which would be di�erent in certain historically
important respects, seems to be of considerable value for the determination of the'historical signi�cance' of those facts� (Weber, 1948, p. 166; orig. emph.).94
Thus, in sum, social scientists should avoid overhasty usage of concepts fraught withmeaning that is not entirely grasped, and they should devote more work in the theoreticalunderpinnings of those concepts that are considered to be useful from a pragmatic pointof view.Another issue quite relevant for rational-choice or subjective-expected-utility-based
explanations of social inequality in educational opportunities in general a�ects the un-derlying decision heuristics. As outlined above, current theoretical accounts assume thatthe underlying decision heuristic reads �Maximize the expected value!� equally for allsocial strata (Esser, 1999, p. 274). However, social psychologists have revealed thatindividuals not always act according to this admittedly e�cient strategy � but may inparticular situations have good reasons to follow alternative heuristics that are mediocrefrom a strict point of view (Simon, 1955, 1957; Tversky and Kahneman, 1974; also seeCoombs et al., 1970, ch. 5; Lave and March, 1975, pp. 140-143). For instance, inequali-ties in educational opportunities would probably increase if parents from the lower stratawould act according to the comparably conservative maximin principle � maximizing theminimum possible value while completely ignoring subjective probabilities even if theymay be relatively high � while middle- and higher-class parents still maximize their ex-pected value.95 Hence, IEO theory should, possibly by means of agent-based modeling(Hedström, 2005, ch. 6), evaluate the consequences of di�erent constellations of class-variant decision heuristics when all other parameters are held constant. This, of course,would amount to soften Occam's razor in introducing additional auxiliary assumptions.
Regarding methods, in particular realist generative process theorists as referred to inthe theoretical section would admittedly insist (or at least recommend) that causal forcescould best be approximated by means of small or medium N studies (Gerring, 2007).This advice intuitively makes sense since the more �ne-grained the mechanism-basedexplanation (i.e. the smaller the entities the observed factorial regularity is decom-posed into), the harder it is to get closer to the actual causal structure by observable
93Once the above-noted issues have been resolved, counterfactual thinking as a decision heuristic mightprove helpful in both clarifying the e�cacy of contrast e�ects in reference-group e�ect research(Roese, 1994) and mediating individuals' expectancies of success through subjective perceptions ofcontrol (Roese, 1994; Nasco and Marsh, 1999).
94See Ringer (2002) for a more elaborate discussion of Weber's notion of causation.95See Jæ ger and Holm (2012) for a �rst attempt of distinguishing between 'conformists' and 'rebels'
in the framework of Breen and Goldthorpe's (1997) relative risk aversion theory.
80
I. Causes and E�ects of Teachers' Evaluations: A Theoretical Primer
quantitative indicators. Hence, the set of social mechanisms providing an understand-ing explanation of the causes and e�ects of teachers' evaluations as reconstructed inthis introduction should idealiter be evaluated by means of process tracing in small ormedium N studies (Mahoney, 2000; Bennett and Elman, 2006; Bennett, 2010; Collier,2011; Beach and Pedersen, 2012; Rohl�ng, 2012, ch. 6).Sticking to the quantitative framework as applied here, recent evidence would suggest
that listwise deletion of missing values as applied in the four papers at hand is usuallyinferior in precision compared to methods of imputation (Schafer, 1997; Schafer andGraham, 2002; Graham, 2009). To be precise, statisticians distinguish between threescenarios of missing data: missing at random (MAR), missing completely at random(MCAR), and missing not at random (MNAR). MAR allows the probabilities of miss-ingness to depend on the observed data but not on the missing data. MCAR is a specialcase of MAR where the probability of missingness does not depend on the observed dataeither. Consequently, MNAR already occurs when the MAR condition is violated.Unless designs of planned missingness such as cohort-sequential longitudinal designs or
administration of multiple questionnaires with varying subsets of items occur, violationof MCAR or MAR can be expected to be likely (Schafer, 1997, ch. 2); and resultsof statistical analyses obtained after listwise deletion may be biased if the data is notMCAR or at least MAR (Schafer and Graham, 2002).In contrast, Graham and Donaldson (1993) as well as Collins et al. (2001) found
that in many realistic scenarios violating MAR, the bias potentially resulting by falselyassuming MAR will actually be negligible. Graham (2009, p. 554) adds that especiallyin case of multiple regression models, the most undesirable property of listwise deletionis its loss of power. To be sure, listwise deletion is superior to pairwise deletion sinceas in contrast to the latter, a common set of cases for all analyses is used (cf. Schafer,1997, p. 39).96 Single imputation methods such as arithmetic mean imputation (Wilks,1932), conditional mean imputation (Buck, 1960) or stochastic regression imputation� augmenting each score predicted by conditional mean imputation with a normallydistributed residual term (cf. Enders, 2010, ch. 2.8.) � are known to underestimatestandard error in regression analyses (Enders, 2010, p. 48).Full information maximum likelihood (FIML) that uses the whole set of available cases
in order to obtain ML estimates of the aspired values is known to behave well underMAR, but not under MNAR conditions (Enders, 2010, p. 87). As one crucial pointof arguing of papers three and four is to tackle the objection of potential unobservedheterogeneity, one might arrive at the conclusion that there is no well-thought reasonto reject the assumption of MNAR a priori. Furthermore, paper one used an inputmatrix of polychoric correlations (Olsson, 1979; Muthén, 1984; Aish and Jöreskog, 1990;Jöreskog, 1994) in order to account for categorical outcomes in the structural model. Incontrast, using the FIML approach to impute missing values would require the use ofraw data (Enders, 2010, p. 123).
96The problem of inconsistent sets of cases is particularly an issue for statistical approaches relyingon a variance-covariance matrix as data input such as structural equation modeling (Little, 1992;Marsh, 1998; Wothke, 1993) � which is the method of analysis of paper 1 in the volume at hand.
81
5 Conclusion
The only imputation technique that is approximately stable under MNAR conditionsis multiple imputation (MI). Basically, MI starts from stochastic regression imputationbut then generates multiple copies of the underlying data set, each �lled with di�erentmissing values. The analyses of interest are then performed simultaneously with all dif-ferent data, and these results are pooled � typically by means of the data augmentationalgorithm (Schafer, 1997; Tanner and Wong, 1987) � in order to arrive at one �nal es-timate. The stochastic regression imputation step predicts the values for a variable tobe imputed by regressing it on various predictors and then adds a normalized residualterm obtained from this regression equation.97 Now recall that papers three and fouruse the residuals estimated from a logistic regression of teachers' expectations on stu-dents' educational performance and motivation to arrive at an empirical identi�cationof self-ful�lling prophecies. In my view, it has to be evaluated �rst whether the stochas-tic regression part of multiple imputation does neither upwardly nor downwardly biasestimation strategies that also make use of residualized variables.98 Furthermore, thereis no option to estimate the polychoric correlation matrix that has been used as inputmatrix for the con�rmatory factor analysis and structural equation models as performedin paper 1 in an MI framework.99 Finally, I see the risk of generally augmenting biasin the data when missing variables are �rst imputed and then used for data fusion viastatistical matching. Therefore, I stick to the conventional approach of listwise deletionsince it is unsettled whether the more sophisticated techniques would not rather lowerthe precision of the estimates.Apart from potential concerns with missing data handling that I see rejected by the
above-speci�ed arguments, a general objection against particular methodological strate-gies such as statistical matching (D'Orazio et al., 2006) could be their peril. However,on the one hand, from an epistemological point of view, I follow Popper (1963) in hisopinion that researchers should always formulate hypotheses as falsi�able as possible inorder to enable empirical research to reduce complexity in that only those hypothesesunrejected so far are corroborated for the time being.100
On the other hand, from a more pragmatic point of view, when the alternativescomprise doing something risky (maybe even transcending the Popperian sense of it),
97I above said that MI is only approximately stable under MNAR conditions since the imputationprocess has to be corrected as proposed by Rubin (1987): �Generate multiple imputations under anMAR mechanism, then add a constant to the imputed values to compensate for the possibility thatthe MAR-based imputations may be too high or too low� (Enders, 2010, p. 289).
98A more practical reason against the feasibility of multiple imputation throughout paper 3 is thatthe Inverse Mill's Ratios for each SEU predictor and residual term to control for heterogeneity biashad to be computed by hand. Hence, it wouldn't have been possible to estimate a Heckman modelsimultaneously on several imputed data sets. In fact, the selection model applied in paper 3 can beregarded as a (admittedly imperfect) method to account for missingness under MNAR conditions(cf. Enders, 2010, pp. 291-298).
99Asparouhov and Muthén (2010) showed that given a su�ciently high number of imputed data sets(5 and more), Weighted Least Squares may yield consistent results in both single-level and two-levelstructural equation models with categorical variables.
100�A serious empirical test always consists in the attempt to �nd a refutation, a counter example (sic!).In the search for a counter example, we have to use our background knowledge; for we always tryto refute �rst the most risky predictions (...)� (Popper, 1963, p. 240; orig. emph.).
82
I. Causes and E�ects of Teachers' Evaluations: A Theoretical Primer
or discarding analyses completely, I take the liberty to opt for the former. As Boudon(1976, p. 1185) prominently remarks: �But I always thought that 'try, and see whathappens' was a better though less secure line of behavior as far as research was concernedthan following a well-explored trail � for instance, applying to data statistical techniqueswhich are mechanically well-known and which always 'work'.� Pursuant to the title ofan essay by Giuliani (2003), the attempt of the volume at hand is to follow a sociologicalmethodology that does not attempt to understand more than it can explain, and that doesonly explain what has been understood � with an associated demand of being on the safeside theoretically wherever daring methodologically.
References
Adorno TW; Albert H; Dahrendorf R et al. (1976) The Positivist dispute in Germansociology. New York / Hagenstown, San Francisco, London: Harper and Row.
Aigner DJ (1970) A comment on problems in making inferences from the ColemanReport. American Sociological Review 35(2): 249�252.
Aish AM and Jöreskog KG (1990) A panel model for political e�cacy and responsiveness:an application of LISREL 7 with weighted least squares. Quality and Quantity 24(4):405�426.
Albert H (1985) Treatise on Critical Reason. Princeton, New Jersey: Princeton Univer-sity Press.
Amthauer R (1957) Intelligenz-Struktur-Test. Göttingen: Hogrefe.
Apel KO (1979) Die Erklären:Verstehen-Kontroverse in transzendentalpragmatischerSicht. Frankfurt a.M.: Suhrkamp.
Asparouhov T and Muthén BO (2010) Weighted least squares estimation with missingdata. Mplus Technical Appendix .URL: http://www.statmodel.com/download/GstrucMissingRevision.pdf
Ayer AJ (1952) Language, Truth, and Logic. New York: Dover Publications.
Balog A (2008) Verstehen und Erklären bei Max Weber. In: Greshof R; Kneer G andSchneider WL (eds.) Verstehen und Erklären - Sozial- und kulturwissenschaftlichePerspektiven, 73�93. München: Wilhelm Fink Verlag.
Bandura A (1969) Social-learning theory of identi�catory processes. Handbook of social-ization theory and research 213�262.
Barton AH (1970) Comments on Hauser's �Context and Consex�. American Journal ofSociology 76(3): 514�517.
83
References
Bauer DJ (2003) Estimating multilevel linear models as structural equation models.Journal of Educational and Behavioral Statistics 28(2): 135�167.
Beach D and Pedersen RB (2012) Process-Tracing Methods .
Bechtel W (2006) Discovering Cell Mechanisms. The Creation of Modern Cell Biology.New York: Cambridge Univ Press.
Bechtel W (2008) Mental Mechanism. Philosophical Perspectives on Cognitive Neuro-science. London: Routledge.
Bechtel W and Abrahamsen A (2005) Explanation: A mechanist alternative. Studiesin History and Philosophy of Science Part C: Studies in History and Philosophy ofBiological and Biomedical Sciences 36(2): 421�441.
Beck PA (1991) Voters' intermediation environments in the 1988 presidential contest.Public Opinion Quarterly 55(3): 371�394.
Beck U (1986) Risikogesellschaft. Auf dem Weg in eine andere Moderne. Frankfurt a.M.:Suhrkamp.
Beck U (1992) Risk Society. Towards a New Modernity. London/Thousand Oaks/NewDheli: Sage Publications.
Becker D and Birkelbach K (2010) Intelligenz und Schulleistung als Kontextmerkmale:Big-Fish-Little-Pond- oder Re�ected-Glory-E�ekt? Eine Mehrebenen-Analyse vonLehrerurteilen. In: Beckers T; Birkelbach K; Hagenah J et al. (eds.) Komparativeempirische Sozialforschung, 113�141. Wiesbaden: VS-Verlag.
Becker G (1976) The Economic Approach to Human Behavior. Chicago: Chicago Uni-versity Press.
Becker GS (1962) Investment in human capital: a theoretical analysis. The Journal ofPolitical Economy 70(5): 9�49.
Becker R (2000) Klassenlage und Bildungsentscheidungen - Eine empirische Anwendungder Wert-Erwartungstheorie. Zeitschrift für Soziologie 52(3): 450�474.
Becker R (2003) Educational expansion and persistent inequalities of education. Euro-pean Sociological Review 19(1): 1�24.
Becker R (2012) Bildungsungleichheit im Lichte aktueller Theorieanwendung in der sozi-ologischen Bildungsforschung. Bildung - Arbeit - Erwachsenwerden. Ein interdiszi-plinärer Blick auf die Transition im Jugend und jungen Erwachsenenalter 43�75.
Becker R and Hadjar A (2011) Meritokratie - Zur gesellschaftlichen Legitimation un-gleicher Bildungs-, Erwerbs-und Einkommenschancen in modernen Gesellschaften.Lehrbuch der Bildungssoziologie 37�62.
84
I. Causes and E�ects of Teachers' Evaluations: A Theoretical Primer
Becker R and Hecken AE (2009a) Higher education or vocational training? An empir-ical test of the rational action model of educational choices suggested by Breen andGoldthorpe and Esser. Acta Sociologica 52(1): 25�45.
Becker R and Hecken AE (2009b) Why are working-class children diverted from univer-sities? An empirical assessment of the diversion thesis. European Sociological Review25(2): 233�250.
Becker R and Schubert F (2006) Soziale Ungleichheit von Lesekompetenzen. EineMatching-Analyse im Längsschnitt mit Querschnittsdaten von PIRLS 2001 und PISA2000. Kölner Zeitschrift für Soziologie und Sozialpsychologie 58(2): 253�284.
Bell D (1972) On equality: I. Meritocracy and equality. Public Interest 29: 29�68.
Benjamin W (1968) Theses on the Philosophy of History. In: Arendt H (ed.) WalterBenjamin: Illuminations, 253�264. New York: Schocken Books.
Bennett A (2010) Process tracing: A Bayesian perspective. The Oxford handbook ofpolitical methodology 702�721.
Bennett A and Elman C (2006) Complex causal relations and case study methods: theexample of path dependence. Political Analysis 14(3): 250�267.
Bernstein B (1971) Class, Codes and Control. Vol I: Theoretical Studies towards a So-ciology of Language. London: Routledge.
Bernstein B (1981) Codes, modalities, and the process of cultural reproduction: A model.Language in society 10(3): 327�363.
Bernstein B (1990) Class, Codes and Control. Vol. IV: The Structuring of PedagogicDiscourse. London: Routledge.
Bernstein B (1995) Code theory and its positioning: a case study in misrecognition.British Journal of Sociology of Education 16(1): 3�19.
Bhaskar R (1975) A Realist Theory of Science. Leeds: Leeds Books.
Biggs M (2009) Self-ful�lling prophecies. In: Baerman P and Hedström P (eds.) TheOxford Handbook of Analytical Sociology, 294�314. Oxford: Oxford University Press.
Birkelbach K (2011) Teacher evaluations over the life course: valid prognosis or self-ful�lling prophecy? In: Mica A; Peisert A and Winczorek J (eds.) Sociology and theUnintended - Robert Merton Revisited, 133�153. Frankfurt a.M.: Peter Lang.
Blalock HM (1984) Contextual-e�ects models: theoretical and methodological issues.Annual Review of Sociology 10: 353�372.
Blalock HM and Wilken PH (1979) Intergroup Processes. A Micro-Macro Perspective.New York: The Free Press.
85
References
Blau PM and Duncan OD (1967) The American Occupational Structure. New York:John Wiley.
Blossfeld HP and Shavit Y (1993) Persisting barriers. In: Blossfeld HP and Shavit Y(eds.) Persistent Inequality - Changing Educational Attainment in Thirteen Countries,1�23. Boulder, CO: Westview Press.
Böhm JM (2008) Verstehen und Erklären bei Popper. In: Gresho� R; Kneer G andSchneider L (eds.) Verstehen und Erklären - Sozial- und kulturwissenschaftliche Per-spektiven, 365�389. München: Wilhelm Fink Verlag.
Bond TG and Fox CM (2001) Applying the Rasch Model: Fundamental Measurement inthe Human Sciences. Mahwah, NJ: Lawrence Erlbaum Associates, Inc.
Bornmann L (2010) Die analytische Soziologie: Soziale Mechanismen, DBO-Theorie undAgentenbasierte Modelle. Österreichische Zeitschrift für Soziologie 35(4): 25�44.
Boudon R (1974) Education, Opportunity and Social Inequality: Changing Prospects inWestern Society. New York: John Wiley & Sons.
Boudon R (1976) Comment on Hauser's review of Education, Opportunity, and SocialInequality. The American Journal of Sociology 81(5): 1175�1187.
Boudon R (1979) Generating models as a research strategy. In: Merton RK; Coleman JSand Rossi PH (eds.) Qualitative and Quantitative Social Research, 51�64. New York:The Free Press.
Boudon R (1981) The logic of social action: an introduction into sociological analysis.London: Routledge & Kegan Paul.
Boudon R (1991) What middle-range theories are. Contemporary Sociology: An Inter-national Journal of Reviews 20(4): 519�522.
Boudon R (1996) The 'cognitivist model': a generalized rational-choice model. Ratio-nality and society 8(2): 123�150.
Boudon R (1998) Limitations of rational choice theory. American Journal of Sociology104(3): 817�828.
Boudon R (2003) Beyond rational choice theory. Annual review of sociology 29: 1�21.
Bourdieu P (1973) Cultural reproduction and social production. In: Brown R (ed.)Knowledge, Education, and Cultural Change: Papers in the Sociology of Education,71�112. London: Tavistock Publications.
Bourdieu P (1977) Outline of a Theory of Practice (Cambridge Studies in Social andCultural Anthropology). Cambridge: Cambridge University Press.
86
I. Causes and E�ects of Teachers' Evaluations: A Theoretical Primer
Bourdieu P (1986) Distinction: A Social Critique of the Judgement of Taste. London:Routledge.
Bourdieu P (1988) Vive la crise! Theory and Society 17(5): 773�787.
Bourdieu P (1991) Language and Symbolic Power. Cambridge: Polity Press.
Bourdieu P and Passeron JC (1990) Reproduction in Education, Society and Culture.London: Sage Publications Ltd.
Bowles S and Levin HM (1968) The determinants of scholastic achievement - an appraisalof some recent evidence. Journal of Human Resources 3(1): 3�24.
Brambor T; Clark WR and Golder M (2006) Understanding interaction models: im-proving empirical analyses. Political Analysis 14(1): 63�82.
Braun N (1995) Individual thresholds and social di�usion. Rationality and Society 7(2):167�182.
Breen R (1996) Regression Models: Censored, Sample Selected or Truncated Data. Thou-sand Oaks, CA: Sage Publications.
Breen R (1999) Beliefs, rational choice and bayesian learning. Rationality and Society11(4): 463�479.
Breen R and García-Peñalosa C (2002) Bayesian learning and gender segregation. Jour-nal of Labor Economics 20(4): 899�922.
Breen R and Goldthorpe JH (1997) Explaining educational di�erentials: towards a for-mal rational action theory. Rationality and Society 9(3): 275�305.
Breen R and Goldthorpe JH (1999) Class inequality and meritocracy: a critique ofSaunders and an alternative analysis. The British Journal of Sociology 50(1): 1�27.
Breen R and Jonsson JO (2000) Analyzing educational careers: a multinomial transitionmodel. American Sociological Review 65(5): 754�772.
Breen R; Luijkx R; Müller W et al. (2009) Nonpersistent inequality in educational at-tainment: evidence from eight European countries. American Journal of Sociology114(5): 1475�1521.
Breen R and Rottman D (1995) Class analysis and class theory. Sociology 29(3): 453�473.
Briggs DC (2004) Causal inference and the Heckman model. Journal of Educational andBehavioral Statistics 29(4): 397�420.
Bryk AS and Raudenbush SW (1992) Hierarchical Linear Models. Thousand Oaks, CA:Sage Publications.
87
References
Buck SF (1960) A method of estimation of missing values in multivariate data suitablefor use with an electronic computer. Journal of the Royal Statistical Society. SeriesB (Methodological) 22(2): 302�306.
Buis ML (2007) SEQLOGIT: Stata module to �t a sequential logit model.URL: http://ideas.repec.org/c/boc/bocode/s456843.html
Buis ML (2010) Inequality of Educational Outcome and Inequality of Educational Op-portunity in the Netherlands during the 20th Century. Disseration thesis, Vrije Uni-versiteit Amsterdam.
Buis ML (2011) The consequences of unobserved heterogeneity in a sequential logitmodel. Research in Social Strati�cation and Mobility 29(3): 247�262.
Bunge M (1997) Mechanism and explanation. Philosophy of the Social Sciences 27(4):410�465.
Bunge M (2004) How does it work? Philosophy of the Social Sciences 34(2): 182�210.
Byrne BM; Shavelson RJ and Muthén BO (1989) Testing for the equivalence of factorcovariance and mean structures: the issue of partial measurement invariance. Psycho-logical Bulletin 105(3): 456�466.
Cain GG and Watts HW (1968) The controversy about the Coleman report: comment.The Journal of Human Resources 3(3): 389�392.
Cain GG and Watts HW (1970) Problems in making policy inferences from the ColemanReport. American Sociological Review 35(2): 228�242.
Carver RP (1975) The Coleman Report: using inappropriately designed achievementtests. American Educational Research Journal 12(1): 77�86.
Chen FF; Sousa KH and West SG (2005) Teacher's corner: testing measurement invari-ance of second-order factor models. Structural Equation Modeling: A MultidisciplinaryJournal 12(3): 471�492.
Cialdini RB; Borden RJ; Thorne A et al. (1976) Basking in re�ected glory: three (foot-ball) �eld studies. Journal of Personality and Social Psychology 34(3): 366�375.
Coleman JS (1966) Equality of Educational Opportunity. Washington, DC: U.S. Gov-ernment Printing O�ce.
Coleman JS (1968) Equality of Educational Opportunity: reply to Bowles and Levin.The journal of human resources 3(2): 237�246.
Coleman JS (1970) Reply to Cain and Watts. American Sociological Review 35(2):242�249.
Coleman JS (1990) Foundations of Social Theory. New York: Harvard University Press.
88
I. Causes and E�ects of Teachers' Evaluations: A Theoretical Primer
Collier A (1989) Scienti�c Realism and Socialist Thought. Hemel Hempstead: HarvesterVerso.
Collier A (1994) Critical Realism: An Introduction to Roy Bhaskar's Philosophy. London:Verso.
Collier D (2011) Understanding process tracing. PS: Political Science & Politics 44(4):823�830.
Collins LM; Schafer JL and Kam CM (2001) A comparison of inclusive and restrictivestrategies in modern missing data procedures. Psychological Methods 6(4): 330�351.
Collins RL (1996) For better or worse: The impact of upward social comparison onself-evaluations. Psychological Bulletin 119(1): 51�69.
Comte A (1839) Cour de philosophie positive, vol. 4. Paris: Bachelier.
Comte A (1865) A General View Of Positivism. London: Trübner and Co.
Coombs CH; Dawes RM and Tversky A (1970)Mathematical Psychology: An ElementaryIntroduction. Englewood Cli�s, NJ: Prentice Hall.
Correll SJ (2001) Gender and the career choice process: the role of biased self-assessments. American Journal of Sociology 106(6): 1691�1730.
Craver CF (2007) Explaining the Brain. Mechanisms and the Mosaic Unity of Neuro-science. Oxford: Oxford University Press.
Cunha F and Heckman JJ (2007) Identifying and estimating the distributions of ex postand ex ante returns to schooling. Labour Economics 14(6): 870�893.
Cunha F; Heckman JJ and Navarro S (2005) Separating uncertainty from heterogeneityin life cycle earnings. Oxford Economic Papers 57(2): 191�261.
Dai DY and Rinn AN (2008) The big-�sh-little-pond e�ect: What do we know andwhere do we go from here? Educational Psychology Review 20(3): 283�317.
Daniels M; Devlin B and Roeder K (1997) Of genes and IQ. In: Devlin B; FienbergSE; Resnick DP et al. (eds.) Intelligence, Genes, & Success: Scientists Respond to theBell Curve, 45�70. New York: Springer.
Daniels N (1978) Merit and meritocracy. Philosophy & Public A�airs 7(3): 206�223.
Darden L (2006) Reasoning in Biological Discoveries. Essays on Mechanisms, Inter�eldRelations, and Anomaly Resolution. Cambridge, UK: Cambridge University Press.
Davidson D (1980) Essays on Actions and Events. Oxford: Clarendon Press.
89
References
Davis JA (1966) The campus as a frog pond: an application of the theory of relativedeprivation to career decisions of college men. The American Journal of Sociology72(1): 17�31.
Davis K and Moore WE (1945) Some principles of strati�cation. American SociologicalReview 10(2): 242�249.
Dijkstra P; Kuyper H; van der Werf G et al. (2008) Social comparison in the classroom:a review. Review of Educational Research 78(4): 828�879.
Dilthey W (1883) Einleitung in die Geisteswissenschaften: Versuch einer Grundlegungfür das Studium der Gesellschaft und der Geschichte. Leipzig: Duncker & Humblot.
Dilthey W (1924) Ideen über eine beschreibende und zergliederte Psychologie. In:Dilthey W (ed.) Die geistige Welt, 139�240. Leipzig und Berlin: Teubner.
Dilthey W (1927) Der Aufbau der geschichtlichen Welt in den Geisteswissenschaften.Leipzig und Berlin: Teubner.
Dilthey W (1984) Introduction to the Human Sciences. In: Makkreel RA and Rodi F(eds.) Selected Works (Vol. I). Princeton, New Jersey: Princeton University Press.
DiMaggio P (1982) Cultural capital and school success: the impact of status cultureparticipation on the grades of U.S. high school students. American Sociological Review47(2): 189�201.
DiPrete TA and Eirich GM (2006) Cumulative advantage as a mechanism for inequality:A review of theoretical and empirical developments. Annual Review of Sociology 32:271�297.
D'Orazio M (2009) StatMatch: Statistical Matching. R package version 0.8.URL: http://cran.r-project.org/package=StatMatch
D'Orazio M; Di Zio M and Scanu M (2006) Statistical Matching - Theory and Practice.Chichester: John Wiley & Sons.
Drasgow F and Hulin CL (1990) Item response theory. In: Dunette MD and Hough LM(eds.) Handbook of industrial and organizational psychology, vol. 1, 2nd edn., 577�636.Consulting Psychologists Press Palo Alto, CA.
Droysen JG (1857) Grundriss der Historik. In: Droysen JG (ed.) Historik (1977, ed. byPeter Leyh). Stuttgart, Bad Cannstatt: Frommann-Holzboog.
Dumais SA (2006) Early childhood cultural capital, parental habitus, and teachers'perceptions. Poetics 34(2): 83�107.
Elster J (1983) Sour Grapes: Studies in the Subversion of Rationality. Cambridge:Cambridge University Press.
90
I. Causes and E�ects of Teachers' Evaluations: A Theoretical Primer
Elster J (1985) Making Sense of Marx. Cambridge: Cambridge University Press.
Elster J (1989) Nuts and Bolts for the Social Sciences. Cambridge: Cambridge UniversityPress.
Elster J (1998) A plea for mechanisms. In: Hedström P and Swedberg R (eds.) Socialmechanisms: An analytical approach to social theory, 45�73. Cambridge: CambridgeUniversity Press.
Elster J (1999) Alchemies of the Mind: Rationality and the Emotions. Cambridge:Cambridge University Press.
Elster J (2007) Explaining Social Behavior - More Nuts and Bolts for the Social Sciences.Cambridge: Cambridge University Press.
Embreston SE and Reise SP (2000) Item Response Theory for Psychologists. Mahwah,NJ: Lawrence Erlbaum.
Enders CK (2010) Applied Missing Data Analysis. New York: The Guilford Press.
Erbring L and Young AA (1979) Individuals and social structure: contextual e�ects asendogenous feedback. Sociological Methods & Research 7(4): 396�430.
Erikson RS; Goldthorpe JH; Jackson M et al. (2005) On class di�erentials in educationalattainment. Proceedings of the National Academy of Sciences of the United States ofAmerica 102(27): 9730�9733.
Erikson RS and Jonsson JO (1996a) Introduction: explaining class inequality in educa-tion: the Swedish test case. In: Erikson RS and Jonsson JO (eds.) Can EducationBe Equalized? The Swedish Case in Comparative Perspective, 1�63. Boulder, CO:Westview Press.
Erikson RS and Jonsson JO (1996b) The Swedish context: educational reform andlong-term change in educational inequality. In: Erikson RS and Jonsson JO (eds.)Can Education Be Equalized? The Swedish Case in Comparative Perspective, 65�93.Boulder, CO: Westview Press.
Erikson RS and Rudolphi F (2010) Change in social selection to upper secondary school- primary and secondary e�ects in Sweden. European Sociological Review 26(3): 291�305.
Esser H (1993a) Soziologie. Allgemeine Grundlagen. Frankfurt / New York: CampusVerlag.
Esser H (1993b) The Rationality of Everyday Behavior: A Rational Choice Reconstruc-tion of the Theory of Action by Alfred Schutz. Rationality and Society 5(1): 7�31.
Esser H (1996a) Die De�nition der Situation. Kölner Zeitschrift für Soziologie undSozialpsychologie 48(1): 1�34.
91

References
Esser H (1996b) What is wrong with `variable sociology'? European Sociological Review12(2): 159�166.
Esser H (1999) Soziologie. Spezielle Grundlagen. Bd. 1: Situationslogik und Handeln.Frankfurt / New York: Campus Verlag.
Esser H (2010) Das Modell der Frame-Selektion. Eine allgemeine Theorie der Sozial-wissenschaften. In: Albert G and Sigmund S (eds.) Soziologische Theorie kontrovers(Sonderheft 50 der Kölner Zeitschrift für Soziologie und Sozialpsychologie), 50�62.Wiesbaden: VS Verlag für Sozialwissenschaften.
Esser H and Kroneberg C (2010) Am besten nichts Neues? In: Albert G and Sigmund S(eds.) Soziologische Theorie kontrovers (Sonderheft 50 der Kölner Zeitschrift für Sozi-ologie und Sozialpsychologie), 79�86. Wiesbaden: VS Verlag für Sozialwissenschaften.
Eysenck HJ (1975) Equality and education: fact and �ction. Oxford Review of Education1(1): 51�58.
Farkas G (1974) Speci�cation, residuals and contextual e�ects. Sociological Methods &Research 2(3): 333�363.
Feldman L and Price V (2008) Confusion or enlightenment? How exposure to dis-agreement moderates the e�ects of political discussion and media use on candidateknowledge. Communication Research 35(1): 61�87.
Festinger L (1957) A Theory of Cognitive Dissonance. Evanston, IL: Row, Peterson.
Feuer LS (1957) The principle of simplicity. Philosophy of Science 24(2): 109�122.
Fischer CS; Hout M; Jankowski MS et al. (1996) Inequality by design. Princeton, NewJersey: Princeton University Press.
Freedman DA (1987) As others see us: a case study in path analysis. Journal of Educa-tional and Behavioral Statistics 12(2): 101�128.
Friedrich RJ (1982) In defense of multiplicative terms in multiple regression equations.American Journal of Political Science 26(4): 797�833.
Galton F (1869) Heredity Genius: An Inquiry Into Its Laws and Consequences. London:Collins.
Galton F (1886) Regression towards mediocrity in hereditary stature. The Journal ofthe Anthropological Institute of Great Britain and Ireland 15: 246�263.
Gambetta D (1998) Concatenations of mechanisms. In: Hedström P and Swedberg R(eds.) Social Mechanisms: An Analytical Approach to Social Theory, 102�124. Cam-bridge, UK: Cambridge University Press.
92
I. Causes and E�ects of Teachers' Evaluations: A Theoretical Primer
Gangl M (2010) Causal inference in sociological research. Annual Review of Sociology36: 21�47.
Gelman A and Hill J (2007) Data Analysis Using Regression and Multilevel/HierarchicalModels. Cambridge: Cambridge University Press.
Gerring J (2007) Review article: the mechanistic world view: thinking inside the box.British Journal of Political Science 38: 161�179.
Gill S and Reynolds AJ (1999) Educational expectations and school achievement ofurban African American children. Journal of School Psychology 37(4): 403�424.
Giuliani L (2003) Kleines Plädoyer für eine archäologische Hermeneutik, die nicht mehrverstehen will, als sie auch erklären kann, und die nur soviel erklärt, wie sie verstandenhat. In: Heinz M; Eggert MKH and Veit U (eds.) Zwischen Erklären und Verstehen?Beiträge zu den erkenntnistheoretischen Grundlagen archäologischer Interpretation,9�22. Münster: Waxmann.
Glaesser J and Cooper B (2011) Selectivity and �exibility in the German secondaryschool system: a con�gurational analysis of recent data from the German Socio-Economic Panel. European Sociological Review 27(5): 570�585.
Glennan SS (1996) Mechanisms and the nature of causation. Erkenntnis 44(1): 49�71.
Glennan SS (2002) Rethinking mechanistic explanation. Philosophy of Science 69(S3):S342�S353.
Go�man E (1974) Frame Analysis: An Essay on the Organization of Experience. London:Harper and Row.
Goldberger AS and Manski CF (1995) Review article: The Bell Curve by Herrnsteinand Murray. Journal of Economic Literature 33(2): 762�776.
Goldstein H (1995) Multilevel Statistical Methods. London: Hodder Arnold.
Goldthorpe JH (1996a) Class analysis and the reorientation of class theory: the case ofpersisting di�erentials in educational attainment. British Journal of Sociology 47(3):481�505.
Goldthorpe JH (1996b) Problems of �meritocracy�. In: Erikson RS and Jonsson JO(eds.) Can Education Be Equalized? The Swedish Case in Comparative Perspective,255�287. Boulder, CO / Oxford: Westview Press.
Goldthorpe JH (1998) Rational action theory for sociology. British Journal of Sociology49(2): 167�192.
Goldthorpe JH (2001) Causation, statistics, and sociology. European Sociological Review17(1): 1�20.
93

References
Goldthorpe JH (2003) The myth of education-based meritocracy. New Economy 10(4):234�239.
Goldthorpe JH (2007) �Cultural Capital�: Some Critical Observations. Sociologica 1(2):1�23.
Goldthorpe JH and Jackson M (2005) Education-based meritocracy - the barriers to itsrealisation. Paper presented at the Start-Up Workshop of the EDUC Research Themeof the 6th EU Framework Network of Excellence �Economic Change, Quality of Life& Social Cohesion (EQUALSOC)�, Dec. 2-3, 2005, Mannheim Centre for EuropeanSocial Research .
Goldthorpe JH and Jackson M (2008) `Education-based meritocracy: the barriers toits realization. In: Lareau A and Conley D (eds.) Social Class: How Does it Work?,93�117. New York: Russell Sage Foundation Publication.
Gottfredson LS (1981) Circumscription and compromise: a developmental theory ofoccupational aspirations. Journal of Counseling Psychology 28(6): 545�579.
Gotthelf A (1976) Aristotle's conception of �nal causality. The Review of Metaphysics30(2): 226�254.
Graham JW (2009) Missing data analysis: making it work in the real world. AnnualReview of Psychology 60: 549�576.
Graham JW and Donaldson SI (1993) Evaluating interventions with di�erential attrition:The importance of nonresponse mechanisms and use of follow-up data. Journal ofApplied Psychology 78(1): 119�128.
Granovetter M (1978) Threshold models of collective behavior. American Journal ofSociology 83(6): 1420�1443.
Granovetter M and Soong R (1983) Threshold models of di�usion and collective behav-ior. Journal of Mathematical sociology 9(3): 165�179.
Gresch C (2009) Empfehlungsstatus, Übergangsempfehlung und der Wechsel in dieSekundarstufe I: Bildungsentscheidungen und soziale Ungleichheit. Bildungsentschei-dungen. Sonderheft der Zeitschrift für Erziehungswissenschaften 230�256.
Gross N (2009) A pragmatist theory of social mechanisms. American Sociological Review74(3): 358�379.
Harker R and May SA (1993) Code and habitus: comparing the accounts of Bernsteinand Bourdieu. British Journal of Sociology of Education 14(2): 169�178.
Hauser RM (1970a) Context and consex: a cautionary tale. American Journal of Soci-ology 75(4): 645�664.
94
I. Causes and E�ects of Teachers' Evaluations: A Theoretical Primer
Hauser RM (1970b) Reply to Barton. The American Journal of Sociology 76(3): 517�520.
Hauser RM (1974) Contextual analysis revisited. Sociological Methods & Research 2(3):365�375.
Hauser RM (1976) On Boudon's model of social mobility. American Journal of Sociology911�928.
Healy MJR and Goldstein H (1978) Regression to the mean. Annals of human biology5(3): 277�280.
Heckman JJ (1979) Sample selection bias as a speci�cation error. Econometrica: Journalof the Econometric Society 47(1): 153�161.
Heckman JJ (1995) Lessons from the bell curve. Journal of Political Economy 103(5):1091�1120.
Hedström P (2005) Dissecting The Social. On the Principles of Analytical Sociology.Cambridge: Cambridge University Press.
Hedström P and Swedberg R (1996) Social mechanisms. Acta Sociologica 39(3): 281�308.
Hedström P and Swedberg R (1998a) Social Mechanisms: An Analytical Approach toSocial Theory. Cambridge: Cambridge University Press.
Hedström P and Swedberg R (1998b) Social mechanisms: an introductory essay. In:Hedström P and Swedberg R (eds.) Social Mechanisms: An Analytical Approach toSocial Theory, 1�31. Cambridge: Cambridge University Press.
Hedström P; Swedberg R and Udehn L (1998) Popper's situational analysis and con-temporary sociology. Philosophy of the Social Sciences 28(3): 339�364.
Hedström P and Ylikoski P (2010) Causal mechanisms in the social sciences. AnnualReview of Sociology 36: 49�67.
Heider F (1946) Attitudes and cognitive organization. Journal of Psychology 21(1):107�112.
Hempel CG (1942) The function of general laws in history. The Journal of Philosophy39(2): 35�48.
Hempel CG (1965) Aspects of scienti�c explanation. In: Hempel CG (ed.) Aspects ofScienti�c Explanation and Other Essays in the Philosophy of Science, 331�496. NewYork: The Free Press.
Hempel CG and Oppenheim P (1948) Studies in the Logic of Explanation. Philosophyof Science 15(2): 135�175.
95
References
Herrnstein R and Murray C (1994) The Bell Curve - Intelligence and Class Structure inAmerica. New York: The Free Press.
Hillmert S (2013) Links between immigration and social inequality in education: Acomparison among �ve European countries. Research in Social Strati�cation andMobility 32: 7�23.
Hillmert S and Jacob M (2010) Selections and social selectivity on the academic track:a life-course analysis of educational attainment in Germany. Research in Social Strat-i�cation and Mobility 28(1): 59�76.
Ho�er TB (2001) Meritocracy. In: Levinson D; Cookson PW and Sadovnik AR (eds.)Education and Sociology: An Encyclopedia, 435�442. New York and London: Rout-ledge.
Holland PW (1986) Statistics and causal inference. Journal of the American statisticalAssociation 81(396): 945�960.
Horkheimer M and Adorno TW (2002) Dialectic of Enlightenment: Philosophical Frag-ments. Stanford: Stanford University Press.
Hox JJ (2010) Multilevel Analysis - Techniques and Applications. 2nd edn. New Yorkand Hove: Routledge.
Hume D (1913) An enquiry concerning the principles of morals (repr. from the ed. of1777). Leipzig: Meiner.
Hyman H (1953) The Value systems of di�erent classes: A social psychological contribu-tion to the analysis of strati�cation. In: Bendix R and Lipset SM (eds.) Class, Statusand Power, 426�442. Glencoe: The Free Press.
Jackson M; Erikson RS; Goldthorpe JH et al. (2007) Primary and secondary e�ects inclass di�erentials in educational attainment. Acta Sociologica 50(3): 211�229.
Jæ ger MM and Holm A (2012) Conformists or rebels? Relative risk aversion, educationaldecisions and social class reproduction. Rationality and Society 24(2): 221�253.
Jaeger MM (2007) Economic and social returns to educational choices. Rationality andSociety 19(4): 451�483.
Jalbert JE (2008) Husserl's position between Dilthey and the Windelband-Rickert schoolof Neo-Kantianism. Journal of the History of Philosophy 26(2): 279�296.
Jencks C (1972) Inequality: A reassessment of the e�ect of family and schooling inAmerica. New York: Basic Books.
Jensen AR (1969) How much can we boost IQ and scholastic achievement. HarvardEducational Review 39(1): 1�123.
96
I. Causes and E�ects of Teachers' Evaluations: A Theoretical Primer
Jensen AR (1974) Ethnicity and scholastic achievement. Psychological Reports 34(2):659�668.
Jensen AR (1986) g: artifact or reality? Journal of Vocational Behavior 29(3): 301�331.
Jensen AR (1987) The" g" beyond factor analysis. In: Glover JA; Conoley JC and WittJC (eds.) The In�uence of Cognitive Psychology on Testing and Measurement, 87�142.Hillsdale: Lawrence Erlbaum Associates, Inc.
Jensen AR and Reynolds CR (1982) Race, social class and ability patterns on the WISC-R. Personality and Individual Di�erences 3(4): 423�438.
Johnson VE (1996) On Bayesian analysis of multirater ordinal data: an application toautomated essay grading. Journal of the American Statistical Association 91(433):42�51.
Johnson VE (1997) An alternative to traditional GPA for evaluating student perfor-mance. Statistical Science 12(4): 251�269.
Jöreskog KG (1993) Testing structural equation models. In: Bollen KA and Long JS(eds.) Testing Structural Equation Models, 294�316. London: Sage Publications Ltd.
Jöreskog KG (1994) On the estimation of polychoric correlations and their asymptoticcovariance matrix. Psychometrika 59(3): 381�389.
Jussim L (1986) Self-ful�lling prophecies: a theoretical and integrative review. Psycho-logical Review 93(4): 429�445.
Jussim L (1989) Teacher expectations: self-ful�lling prophecies, perceptual biases, andaccuracy. Journal of Personality and Social Psychology 57(3): 469�480.
Jussim L; Eccles J and Madon S (1996) Social perception, social stereotypes, and teacherexpectations: accuracy and the quest for the powerful self-ful�lling prophecy. In:Zanna MP (ed.) Advances in Experimental Social Psychology, vol. 28, 281�388. SanDiego: Academic Press.
Jussim L and Harber KD (2005) Teacher expectations and self-ful�lling prophecies:knowns and unknowns, resolved and unresolved controversies. Personality and SocialPsychology Review 9(2): 131�155.
Kahneman D and Tversky A (1984) Choices, values, and frames. American Psychologist39(4): 341�350.
Kant I (1850) Critique of Pure Reason. London: Henry G. Bohn.
Kant I (1902) Prolegomena to Any Future Metaphysics. Chicago: Open Court PublishingCompany.
97
References
Karlson KB and Holm A (2011) Decomposing primary and secondary e�ects: a newdecomposition method. Research in Social Strati�cation and Mobility 29(2): 221�237.
Kelle U and Lüdemann C (1995) Grau, teurer Freund, ist alle Theorie... RationalChoice und das Problem der Brückenannahmen. Kölner Zeitschrift für Soziologieund Sozialpsychologie 47(2): 249�267.
Keller S and Zavalloni M (1964) Ambition and social class: a respeci�cation. SocialForces 43(1): 58�70.
Kemp S and Holmwood J (2003) Realism, regularity and social explanation. Journal forthe Theory of Social Behaviour 33(2): 165�187.
Kendall MG (1951) The Advanced Theory of Statistics. New York: Hafner.
Kloosterman R; Ruiter S; De Graaf PM et al. (2009) Parental education, children'sperformance and the transition to higher secondary education: trends in primary andsecondary e�ects over �ve Dutch school cohorts (1965�99). The British Journal ofSociology 60(2): 377�398.
Koertge N (1979) The methodological status of Popper's rationality principle. Theoryand Decision 10(1): 83�95.
Korenman S and Winship C (2000) A reanalysis of The Bell Curve: intelligence, familybackground, and schooling. In: Arrow K; Bowles S and Durlauf S (eds.) Meritocracyand Economic Inequality, 137�178. Princeton, New Jersey: Princeton University Press.
Kozlowski SW and Kirsch MP (1987) The systematic distortion hypothesis, halo, andaccuracy: an individual-level analysis. Journal of Applied Psychology 72(2): 252�261.
Kristen C (1999) Bildungsentscheidungen und Bildungsungleichheit: Ein Überblick überden Forschungsstand, vol. 5. Mannheim: Mannheimer Zentrum für Europäische Sozial-forschung (MZES).
Kroneberg C (2005) Die De�nition der Situation und die variable Rationalität der Ak-teure: Ein allgemeines Modell des Handelns. Zeitschrift für Soziologie 34: 344�363.
Kroneberg C (2006) The de�nition of the situation and variable rationality: The modelof frame selection as a general theory of action. Sonderforschungsbereich 504 Publica-tions, University of Mannheim .
Kroneberg C (2011) Die Erklärung sozialen Handelns. Grundlagen und Anwendung einerintegrativen Theorie. Wiesbaden: VS Verlag für Sozialwissenschaften.
Kroneberg C; Heintze I and Mehlkop G (2008) On shoplifting and tax fraud: An action-theoretic analysis of crime. Sonderforschungsbereich 504 Publications, University ofMannheim .
98
I. Causes and E�ects of Teachers' Evaluations: A Theoretical Primer
Kroneberg C and Kalter F (2012) Rational Choice Theory and Empirical Research:Methodological and Theoretical Contributions in Europe. Annual Review of Sociology38: 73�92.
Kroneberg C; Yaish M and Stocké V (2010) Norms and rationality in electoral partici-pation and in the rescue of Jews in WWII. Rationality and Society 22(1): 3�36.
Lakatos I (1978) The Methodology of Scienti�c Research Programmes: PhilosophicalPapers Volume 1. Cambridge: Cambridge University Press.
Lareau A and Weininger EB (2003) Cultural capital in educational research: a criticalassessment. Theory and Society 32(5): 567�606.
Lave CA and March JG (1975) An Introduction to Models in the Social Sciences. NewYork / Evanston / San Francisco / London: Harper and Row.
Lewis D (1973) Counterfactuals and comparative possibility. Journal of PhilosophicalLogic 2(4): 418�446.
Lewis D (1977) Possible-world semantics for counterfactual logics: a rejoinder. Journalof Philosophical Logic 6(1): 359�363.
Lewis D (1979) Counterfactual dependence and time's arrow. Noûs 13(4): 455�476.
Lewis D (1981) Ordering semantics and premise semantics for counterfactuals. Journalof Philosophical Logic 10(2): 217�234.
Lindenberg S (1985) An assessment of the new political economy: its potential for thesocial sciences and for sociology in particular. Sociological Theory 3(1): 99�114.
Lindenberg S (1990) Homo socio-oeconomicus: the emergence of a general model ofman in the social sciences. Journal of Institutional and Theoretical Economics 146(4):727�748.
Lindenberg S and Frey BS (1993) Alternatives, frames, and relative prices: a broaderview of rational choice theory. Acta Sociologica 36(3): 191�205.
Linn RL (1973) Fair test use in selection. Review of Educational Research 43(2): 139�161.
Little D (1991) Varieties of Social Explanation: An Introduction to the Philosophy ofScience. Boulder, CO: Westview Press.
Little RJA (1992) Regression with missing X's: a review. Journal of the AmericanStatistical Association 87(420): 1227�1237.
Loehlin JC; Vandenberg SG and Osborne RT (1973) Blood group genes and Negro-Whiteability di�erences. Behavior Genetics 3(3): 263�270.
99

References
Lucas SR (2001) E�ectively maintained Iinequality: education transitions, track mobil-ity, and social background e�ects. American Journal of Sociology 106(6): 1642�1690.
Lucas SR (2009) Strati�cation theory, socioeconomic background, and educational at-tainment. Rationality and Society 21(4): 459�511.
Lucchini M; Della Bella S and Pisati M (2013) The weight of the genetic and envi-ronmental dimensions in the inter-generational transmission of educational success.European Sociological Review 29(2): 289�301.
Lüdtke O; Köller O; Marsh HW et al. (2005) Teacher frame of reference and the big-�sh-little-pond e�ect. Contemporary Educational Psychology 30(3): 263�285.
Luhmann N (1995) Social Systems. Stanford: Stanford University Press.
Lynch SM (2007) Introduction to Applied Bayesian Statistics and Estimation for SocialScientists. New York: Springer.
Maaz K; Trautwein U; Lüdtke O et al. (2008) Educational transitions and di�erentiallearning environments: how explicit between-school tracking contributes to social in-equality in educational outcomes. Child Development Perspectives 2(2): 99�106.
Maccoby EE (1992) The role of parents in the socialization of children: An historicaloverview. Developmental Psychology 28(6): 1006�1017.
Machamer P; Darden L and Craver CF (2000) Thinking about mechanisms. Philosophyof Science 67(1): 1�25.
Madon S; Jussim L and Eccles J (1997) In search of the powerful self-ful�lling prophecy.Journal of Personality and Social Psychology 72(4): 791�809.
Madon S; Willard J; Guyll M et al. (2006) Self-ful�lling prophecy e�ects of mothers'beliefs on children's alcohol use: accumulation, dissipation, and stability over time.Journal of personality and social psychology 90(6): 911�926.
Mahoney J (2000) Strategies of causal inference in small-N analysis. Sociological Methods& Research 28(4): 387�424.
Mahoney J (2001) Review essay: beyond correlational analysis: recent innovations intheory and method. In: Sociological Forum, vol. 16, 575�593. Springer.
Makreel RA (1992) Dilthey - Philosopher of the Human Studies. Princeton, New Jersey:Princeton University Press.
Manski CF (1993) Identi�cation problems in the social sciences. Sociological methodology23(1993): 1�56.
Marsh HW (1987) The big-�sh-little-pond e�ect on academic self-concept. Journal ofEducational Psychology 79(3): 280�295.
100
I. Causes and E�ects of Teachers' Evaluations: A Theoretical Primer
Marsh HW (1998) Pairwise deletion for missing data in structural equation models: non-positive de�nite matrices, parameter estimates, goodness of �t, and adjusted samplesizes. Structural Equation Modeling: A Multidisciplinary Journal 5(1): 22�36.
Marsh HW; Chit-Kwong K and Kit-Tai H (2000) Longitudinal multilevel models ofthe big-�sh-little-pond e�ect on academic self-concept: counterbalancing contrast andre�ected-glory e�ects in Hong Kong schools. Journal of Personality and Social Psy-chology 78(2): 337�349.
Marsh HW; Köller O and Baumert J (2001) Reuni�cation of East and West Germanschool systems: longitudinal multilevel modeling study of the big-�sh-little-pond e�ecton academic self-concept. American Educational Research Journal 38(2): 321�350.
Marsh HW and Parker JW (1984) Determinants of student self-concept: Is it betterto be a relatively large �sh in a small pond even if you don't learn to swim as well?Journal of Personality and Social Psychology 47(1): 213�231.
Marsh HW; Seaton M; Trautwein U et al. (2008) The big-�sh�little-pond-e�ect standsup to critical scrutiny: implications for theory, methodology, and future research.Educational Psychology Review 20(3): 319�350.
Maus I (2006) Der Urzustand. In: Hö�e O (ed.) Klassiker Auslegen: John Rawls - eineTheorie der Gerechtigkeit, 71�95. Berlin: Akademie Verlag.
Maxwell JA (2004) Causal explanation, qualitative research, and scienti�c inquiry ineducation. Educational Researcher 33(2): 3�11.
Mayntz R (2004) Mechanisms in the analysis of social macro-phenomena. Philosophy ofthe Social Sciences 34(2): 237�259.
McFarland C and Buehler R (1995) Collective self-esteem as a moderator of the frog-pond e�ect in reactions to performance feedback. Journal of Personality and SocialPsychology 68(6): 1055�1070.
Mechtenberg L (2009) Cheap talk in the classroom: How biased grading at school ex-plains gender di�erences in achievements, career choices and wages. Review of Eco-nomic Studies 76(4): 1431�1459.
Menzies P (2009) Counterfactual Theories of Causation. In: The Stanford Encyclopediaof Philosophy.URL: http://plato.stanford.edu/entries/causation-counterfactual/
Merton RK (1948) The self-ful�lling prophecy. Antioch Review 8(2): 193�210.
Merton RK (1957) On sociological theories of the middle range. In: On the TheoreticalSociology. Five Essays, Old and New, 39�72. New York: The Free Press.
101
References
Merton RK (1987) Three fragments from a sociologist's notebooks: establishing thephenomenon, speci�ed ignorance, and strategic research materials. Annual Review ofSociology 13.
Meulemann H (1976) Wortbedeutungsverständnis und Wortbedeutungsexplikationen -Eine empirische Analyse zweier Aspekte des Sprachverhaltens und ihrer sozialen De-terminanten im Rahmen der Theorie der linguistischen Codes. Materialien aus derBildungsforschung Nr. 4. Berlin: Max-Planck-Institut für Bildungsforschung.
Meulemann H (1979) Klassenlage, Entscheidungsfeld und Bildungsaspirationen - EinVersuch zur theoretischen Präzisierung und kausalen Erklärung von Zusammenhängenzwischen sozialer Struktur und individueller Lebensplanung. Zeitschrift für Soziologie8(4): 391�414.
Mill JS (1843) The Logic of the Moral Sciences [1872]. London: John W. Parker, WestStrand.
Mill JS (1863) Die Methode der inductiven Forschung als die Methode der Natur-forschung. Braunschweig: Friedrich Vieweg und Sohn.
Mistry RS; White ES; Benner AD et al. (2009) A longitudinal study of the simultaneousin�uence of mothers' and teachers' educational expectations on low-income youth'sacademic achievement. Journal of Youth and Adolescence 38(6): 826�838.
Modin B; Erikson R and Vå gerö D (2013) Intergenerational Continuity in School Per-formance: Do Grandparents Matter? European Sociological Review (forthcoming).
Morgan SL (2006) Expectations and Aspirations. In: Ritzer G (ed.) The BlackwellEncyclopedia of Sociology, Vol. 3, 1528�1531. Malden, Mass: Wiley Blackwell.
Morgan SL (2011) Models of college entry in the United States and the challenges ofestimating primary and secondary e�ects. Cornell University Working Paper .
Morgan SL and Winship C (2012) Bringing Context and Variability Back in to CausalAnalysis. In: Kincaid H (ed.) Oxford Handbook of the Philosophy of the Social Sci-ences, chap. 14. Oxford: Oxford University Press.
Moynihan DP (1968) Sources of resistance to the Coleman Report. Harvard EducationalReview 38(1): 23�36.
Muller C; Katz SR and Dance LJ (1999) Investing in teaching and learning: dynamicsof the teacher-student relationship from each actor's perspective. Urban Education34(3): 292�337.
Müller W and Karle W (1993) Social selection in educational systems in Europe. Euro-pean Sociological Review 9(1): 1�23.
102
I. Causes and E�ects of Teachers' Evaluations: A Theoretical Primer
Müller-Benedict V (1999) Strukturelle Grenzen sozialer Mobilität. Ein Modell des Mikro-Makro-Übergangs nach Boudon. Kölner Zeitschrift fur Soziologie und Sozialpsycholo-gie 51(2): 313�338.
Müller-Benedict V (2007) Wodurch kann die soziale Ungleichheit des Schulerfolgs amstärksten verringert werden? Kölner Zeitschrift für Soziologie und Sozialpsychologie59(4): 615�639.
Murphy KR; Jako RA and Anhalt RL (1993) Nature and consequences of halo error: acritical analysis. Journal of Applied Psychology 78(2): 218.
Muthén BO (1984) A general structural equation model with dichotomous, orderedcategorical, and continuous latent variable indicators. Psychometrika 49(1): 115�132.
Muthén BO (1994) Multilevel covariance structure analysis. Sociological Methods &Research 22(3): 376�398.
Mutz DC (2002) The consequences of cross-cutting networks for political participation.American Journal of Political Science 46(4): 838�855.
Nadeau R (1993) Confuting Popper on the rationality principle. Philosophy of the SocialSciences 23(4): 446�467.
Nasco SA and Marsh KL (1999) Gaining control through counterfactual thinking. Per-sonality and Social Psychology Bulletin 25(5): 557�569.
Nash R (2005) Boudon, realism, and the cognitive habitus: why an explanation ofinequality / di�erence cannot be limited to a model of secondary e�ects. Interchange36(3): 275�293.
Neal DA and Johnson WR (1996) The Role of Pre-market Factors in Black-White WageDi�erences. Tech. Rep. 5, National Bureau of Economic Research.
Need A and De Jong U (2001) Educational di�erentials in the Netherlands. Rationalityand Society 13(1): 71�98.
Neugebauer M (2010) Bildungsungleichheit und Grundschulempfehlung beim Übergangauf das Gymnasium: Eine Dekomposition primärer und sekundärer Herkunftse�ekte.Zeitschrift für Soziologie 39(3): 202�214.
Olsson UH (1979) Maximum likelihood estimation of the polychoric correlation coe�-cient. Psychometrika 44(4): 443�460.
Opp KD (1991) DDR'89. Zu den Ursachen einer spontanen Revolution. KölnerZeitschrift für Soziologie und Sozialpsychologie 43(2): 302�321.
Opp KD (2005a) Explanations by mechanisms in the social sciences. Problems, advan-tages and alternatives. Mind & Society 4(2): 163�178.
103
References
Opp KD (2005b) Methodologie der Sozialwissenschaften: Einführung in Probleme ihrerTheorienbildung und praktischen Anwendung. Wiesbaden: VS Verlag für Sozialwis-senschaften.
Opp KD (2011) Modeling micro-macro relationships: problems and solutions. Journalof Mathematical Sociology 35: 209�234.
Pearl J (2000) Causality: Models, Reasoning, and Inference. Cambridge: CambridgeUniversity Press.
Pietsch M and Stubbe TC (2007) Inequality in the transition from primary to secondaryschool: school choices and educational disparities in Germany. European EducationalResearch Journal 6(4): 424�445.
Plato (1991) The Republic. New York: Vintage Books.
Plato (2009) Meno. Rockville, Maryland: Serenity Publishers.
Popper K (1959) The Logic of Scienti�c Discovery. London: Hutchinson.
Popper KR (1944a) The poverty of historicism, I. Economica 11(42): 86�103.
Popper KR (1944b) The poverty of historicism, II. Economica 11(43): 119�137.
Popper KR (1945a) The Open Society and its Enemies. London: Routledge.
Popper KR (1945b) The poverty of historicism, III. Economica 12(46): 69�89.
Popper KR (1957) The Poverty of Historicism. London: Routledge & Kegan Paul.
Popper KR (1963) Conjectures and Refutations: The Growth of Scienti�c Knowledge.London: Routledge.
Popper KR (1974) Unended Quest. La Salle, IL: Open Court Publishing & Co.
Popper KR (1985) The rationality princinple. In: Miller D (ed.) Popper Selections,357�365. Princeton, New Jersey: Princeton University Press.
Popper KR (1994) Models, instruments, and truth: the status of the rationality principlein the social sciences. In: Notturno MA (ed.) The Myth of the Framework. New York:Routledge.
Quetelet A (1835) Sur l'homme et le développement de ses facultés, ou Essai de physiquesociale. Paris: Bachelier.
Raftery AE and Hout M (1993) Maximally maintained inequality: expansion, reform,and opportunity in Irish education, 1921-75. Sociology of Education 66(1): 41�62.
Rasch G (1960) Probabilistic models for some intelligence and attainment tests. Koeben-havn: Danmarks paedagogiske Institut.
104
I. Causes and E�ects of Teachers' Evaluations: A Theoretical Primer
Raudenbush SW (1984) Magnitude of teacher expectancy e�ects on pupil IQ as a func-tion of the credibility of expectancy induction: a synthesis of �ndings from 18 exper-iments. Journal of Educational Psychology 76(1): 85�97.
Rawls J (1971) A Theory of Justice. Cambridge, Mass.: Belknap Press of HarvardUniversity Press.
Rawls J (1974) Some reasons for the maximin criterion. The American Economic Review64(2): 141�146.
Ready DD and Wright DL (2011) Accuracy and inaccuracy in teachers' perceptions ofyoung children's cognitive abilities. American Educational Research Journal 48(2):335�360.
Reskin BF (2003) Including mechanisms in our models of ascriptive inequality. AmericanSociological Review 68(1): 1�21.
Rheinberg F (1980) Leistungsbewertung und Lernmotivation. Göttingen: Hogrefe.
Rickert H (1899) Kulturwissenschaft und Naturwissenschaft. Freiburg: Mohr.
Rickert H (1902) Die Grenzen der naturwissenschaftlichen Begri�sbildung - eine logischeEinleitung in die historischen Wissenschaften. Tübingen: Mohr.
Riedel M (1978) Verstehen oder Erklären? Zur Theorie und Geschichte der hermeneutis-chen Wissenschaften. Stuttgart: Klett-Cotta.
Riesman D (1967) Notes on meritocracy. Daedalus 96(3): 897�908.
Rigsby LC and McDill EL (1972) Adolescent peer in�uence processes: conceptualizationand measurement. Social Science Research 1(3): 305�321.
Rindermann H and Heller KA (2005) The bene�t of gifted classes and talent schools fordeveloping students' competences and enhancing academic self-concept. Zeitschriftfür Pädagogische Psychologie 19(3): 133�136.
Rindskopf D and Rose T (1988) Second order factor analysis: some theory and applica-tions. Multivariate Behavioral Research 23(1): 51�67.
Ringer F (2002) Max Weber on causal analysis, interpretation, and comparison. Historyand Theory 41(2): 163�178.
Robinson WS (1950) Ecological Correlations and the behavior of individuals. AmericanSociological Review 15(3): 351�357.
Roese NJ (1994) The functional basis of counterfactual thinking. Journal of Personalityand Social Psychology 66(5): 805�818.
105
References
Rohl�ng I (2012) Case Studies and Causal Inference: An Integrative Framework. Bas-ingstoke: Palgrave Macmillan.
Rosenberg M (1979) Conceiving the Self. New York: Basic Books.
Rosenthal R and Jacobson L (1968) Pygmalion in the Classroom: Teacher Expectationand Pupils' Intellectual Development. New York: Holt, Rinehart & Winston.
Rubin DB (1986) Statistical matching using �le concatenation with adjusted weightsand multiple imputations. Journal of Business & Economic Statistics 4(1): 87�94.
Rubin DB (1987) Multiple Imputation for Nonresponse in Surveys. Hoboken, NJ: Wiley.
Rushton JP and Jensen AR (2005) Thirty years of research on race di�erences in cogni-tive ability. Psychology, Public Policy, and Law 11(2): 235�294.
Salmon WC (1971) Statistical Explanation and Statistical Relevance. Pittsburgh: Uni-versity of Pittsburgh Press.
Sarrazin T (2010) Deutschland scha�t sich ab. Wie wir unser Land aufs Spiel setzen.2nd edn. München: DVA.
Saunders P (1997) Social mobility in Britain: an empirical evaluation of two competingexplanations. Sociology 31(2): 261�288.
Scarr S; Pakstis AJ; Katz SH et al. (1977) Absence of a relationship between degreeof White ancestry and intellectual skills within a Black population. Human Genetics39(1): 69�86.
Schafer JL (1997) Analysis of Incomplete Multivariate Data. Boca Raton / London /New York / Washington, DC: Chapman & Hall.
Schafer JL and Graham JW (2002) Missing data: our view of the state of the art.Psychological methods 7(2): 147�177.
Schneider T (2008) Social inequality in educational participation in the German schoolsystem in a longitudinal perspective: pathways into and out of the most prestigiousschool track. European Sociological Review 24(4): 511�526.
Schubert F and Becker R (2010) Social inequality of reading literacy - a longitudinalanalysis with cross-sectional data of PIRLS 2001 and PISA 2000 utilizing the pair wisematching procedure. Research in Social Strati�cation and Mobility 28(1): 109�133.
Seaton M; Marsh HW and Craven RG (2009) Earning its place as a pan-human theory:universality of the big-�sh-little-pond e�ect across 41 culturally and economicallydiverse countries. Journal of Educational Psychology 101(2): 403�419.
106
I. Causes and E�ects of Teachers' Evaluations: A Theoretical Primer
Seaton M; Marsh HW and Craven RG (2010) Big-�sh-little-pond e�ect: generalizabilityand moderation - two sides of the same coin. American Educational Research Journal47(2): 390�433.
Sewell WH; Haller AO and Ohlendorf GW (1970) The educational and early occupationalstatus attainment process: replication and revision. American Sociological Review35(6): 1014�1027.
Sewell WH; Haller AO and Portes A (1969) The educational and early occupationalattainment process. American Sociological Review 34(1): 82�92.
Simon HA (1955) A behavioral model of rational choice. Quarterly Journal of Economics69(1): 99�118.
Simon HA (1957) Models of Man. New York: Wiley.
Snijders TAB and Bosker RJ (1999) Multilevel Analysis: An Introduction to Basic andAdvanced Multilevel Modeling. London: Sage Publications Ltd.
Solga H (2002) 'Stigmatization by negative selection' - explaining less-educated people'sdecreasing employment opportunities. European Sociological Review 18(2): 159�178.
Solga H (2005) Meritokratie - die moderne Legitimation ungleicher Bildungschancen.In: Berger PA and Kahlert H (eds.) Institutionalisierte Ungleichheiten: Wie das Bil-dungswesen Chancen blockiert, 19�38. Weinheim & München: Juventa.
Solga H and Becker R (2012) Soziologische Bildungsforschung - eine kritische Bestand-saufnahme. In: Becker R and Solga H (eds.) Soziologische Bildungsforschung. Sonder-heft 52 der Kölner Zeitschrift für Soziologie und Sozialpsychologie, 7�43. Wiesbaden:VS Verlag für Sozialwissenschaften.
Spearman C (1904) "General intelligence," objectively determined and measured. TheAmerican Journal of Psychology 15(2): 201�292.
Stigler GJ and Becker GS (1977) De gustibus non est disputandum. The AmericanEconomic Review 67(2): 76�90.
Stinchcombe AL (1991) The conditions of fruitfulness of theorizing about mechanismsin social science. Philosophy of the Social Sciences 21(3): 367�388.
Stocké V (2007) Explaining educational decision and e�ects of families' social classposition: an empirical test of the Breen Goldthorpe model of educational attainment.European Sociological Review 23(4): 505�519.
Stocké V (2009) Adaptivität oder Konformität? Die Bedeutung der Bezugsgruppe unddie Leistungsrealität der Kinder auf die Entwicklung elterlicher Bildungsaspiratio-nen am Ende Grundschulzeit. Bildungsentscheidungen. Sonderheft der Zeitschrift fürErziehungswissenschaften 12: 257�280.
107
References
Stocké V (2010) Der Beitrag der Theorie rationaler Entscheidung zur Erklärung vonBildungsungleichheit. In: Quenzel G and Hurrelmann K (eds.) Bildungsverlierer -Neue Ungleichheiten, 73�94. Wiesbaden: Springer.
Stocké V (2011) Educational Aspirations and Inequality in Educational Opportunity:The Di�erence between Realistic and Idealistic Aspirations. Presentation at the RC28Spring Meeting of the International Sociological Association (Essex, UK) .
Stou�er SA (1950) The American Soldier. Princeton, New Jersey: Princeton UniversityPress.
Sun R; Slusarz P and Terry C (2005) The interaction of the explicit and the implicit inskill learning: a dual-process approach. Psychological review 112(1): 159�192.
Tanner MA and Wong WH (1987) The calculation of posterior distributions by dataaugmentation. Journal of the American Statistical Association 82: 528�540.
Thijs J; Verkuyten M and Helmond P (2010) A further examination of the big-�sh-little-pond e�ect. Sociology of Education 83(4): 333�345.
Thomas WI and Thomas DS (1928) The Child in America: Behavior Problems andPrograms. New York: Knopf.
Thorburn WM (1918) The myth of Occam's razor. Mind 27(3): 345�353.
Thorndike EL (1920) A constant error in psychological ratings. Journal of AppliedPsychology 4(1): 25�29.
Thorndike RL (1971) Concepts of culture-fairness. Journal of Educational Measurement8(2): 63�70.
Thorngate W (1980) E�cient decision heuristics. Behavioral Science 25(3): 219�225.
Tizard B (1974) IQ and Race. Nature 247(01): 316.
Tolsma J; Need A and de Jong U (2010) Explaining participation di�erentials in Dutchhigher education: the impact of subjective success probabilities on level choice and�eld choice. European Sociological Review 26(2): 235�252.
Trautwein U and Lüdtke O (2005) The big-�sh-little-pond e�ect. Future research ques-tions and educational implications. Zeitschrift für Pädagogische Psychologie 19(3):137�140.
Trautwein U; Lüdtke O; Marsh HW et al. (2006) Tracking, grading, and student mo-tivation: using group composition and status to predict self-concept and interest inninth-grade mathematics. Journal of Educational Psychology 98(4): 788�806.
Tversky A and Kahneman D (1974) Judgment under uncertainty: heuristics and biases.Science 185(4157): 1124�1131.
108
I. Causes and E�ects of Teachers' Evaluations: A Theoretical Primer
Udehn L (2002) The changing face of methodological individualism. Annual Review ofSociology 28: 479�507.
University for Peace (ed.) (2004) Environmental Degradation as a Cause of Con�ict inDafur. Khartoum: University for Peace.
Van De Werfhorst HG and Van Tubergen F (2007) Ethnicity, schooling, and merit inthe Netherlands. Ethnicities 7(3): 416�444.
Van den Eeden P (1992) Multilevel theory and the underspeci�cation of multilevel mod-els. Quality & Quantity 26(3): 307�322.
von Wright GH (1971) Explanation and Understanding. London: Routledge & KeganPaul.
�uber D (2010) Social science between Neo-Kantianism and Philosophy of Life: Thecases of Weber, Simmel, and Mannheim. Historical Perspectives on Erklären andVerstehen 267�290.
Weber M (1922) Wirtschaft und Gesellschaft. Grundriss der Sozialökonomik. Tübingen:Mohr.
Weber M (1948) From Max Weber: Essays in Sociology. London: Routledge.
Weber M (1964) The Theory of Social and Economic Organization. New York: The FreePress.
Weber M (1968) Economy and Society: An Outline of Interpretive Sociology. New York:Bedminster Press.
Weber M (1978) Economy and Society - An Outline of Interpretive Sociology (Vol. 1 &2). Berkeley: University of California Press.
Weber M (1981) Some categories of interpretative sociology. Sociological Quaterly 22(2):151�180.
Weber M (1985) Wirtschaft und Gesellschaft - Grundriss der verstehenden Soziologie.Tübingen: Mohr.
Weber M (2002) Economy and society: an outline of interpretive sociology. In: WoolseyBiggard N (ed.) Readings in Economic Sociology, 24�37. Oxford: Blackwell Publishing.
Weingartner S (2013) Hochkulturelle Praxis und Frame-Selektion. Kölner Zeitschrift furSoziologie und Sozialpsychologie 65(1): 3�30.
Wilks SS (1932) Moments and distributions of estimates of population parameters fromfragmentary samples. The Annals of Mathematical Statistics 3(3): 163�195.
109
References
Windelband W (1894) Geschichte und Naturwissenschaft. In: Windelband W (ed.)Präludien, 355�379. Tübingen: Mohr.
Winship C and Mare RD (1992) Models for sample selection bias. Annual Review ofSociology 18: 327�350.
Wippler R (1978) The structural-individualistic approach in Dutch sociology. TheNetherlands Journal of Sociology 14: 135�155.
Woodward J (2002) What is a mechanism? A counterfactual account. Philosophy ofScience 69(S3): 366�377.
Woodward J (2008) Causation and Manipulability. In: Zalta EN (ed.) Stanford Ency-clopedia of Philosophy. Stanford: Center for the Study of Language and Information,Stanford University.URL: http://plato.stanford.edu/cgi-bin/encyclopedia/archinfo.cgi?entry=causation-mani
Wothke W (1993) Nonpositive de�nite matrices in structural modeling. Testing Struc-tural Equation Models 154: 256�293.
Yaish M and Katz-Gerro T (2012) Disentangling `cultural capital': the consequencesof cultural and economic resources for taste and participation. European SociologicalReview 28(2): 169�185.
Young M (1958) The Rise of the Meritocracy, 1870-2033: An Essay on Education andInequality. London: Thames & Hudson.
Zeidner M and Schleyer EJ (1998) The big-�sh-little-pond e�ect for academic self-concept, test anxiety, and school grades in gifted children. Contemporary EducationalPsychology 24(4): 305�329.
110
II. Teachers' Evaluations and the
De�nition of the Situation in the
Classroom
(with Klaus Birkelbach)
While a multitude of American, Swiss and German studies analyzed the predic-
tors of kindergarten and primary school teachers' evaluations or transition recom-
mendations, respectively, we did not �nd comparable evidence regarding teachers'
evaluations measured mid of secondary school. In the theoretical section, we regard
German 10th class teachers' evaluations with a prognostic claim about students'
future academic ability as a result of a special social situation in the classroom;
and we synthesize existing meritocratic and habitus-related explanations to a more
general theory of action according to the M odel of F rame Selection (MFS). In the
empirical section, we test both meritocratic and habitus-related hypotheses in a set
of structural equation models. Using data from the Cologne H igh School Panel
(CHiSP) we �nd that even when controlling for the model's path structure, indi-
cators for both kinds of concepts are statistically signi�cant. However, notwith-
standing the underlying type of information processing, the predictive power of
indicators operationalizing the meritocratic explanation is comparatively higher.
1 Introduction
The literature in educational sociology tends to agree in that teachers' expectations,judgments or evaluations can be an important dimension of social inequality in educa-tional research. Regarding teachers' evaluations as a treatment variable, at least sincethe Wisconsin model of status attainment (Sewell et al., 1969, 1970), teachers' eval-uations are acknowledged to play a decisive role in individuals' both educational andoccupational status attainment process.Regarding teachers' evaluations as an outcome, in the American context, a number
of studies has shown that teachers' evaluations vary by students' social backgrounds,their ethnic group, and both social and racial student-teacher matches and mismatches(Alexander et al., 1987; Page, 1987; Farkas et al., 1990; Farkas, 2003; Ferguson, 2003;
111
1 Introduction
Downey and Pribesh, 2004; Hughes et al., 2005; Ready and Wright, 2011).1 In theGerman context, a great deal of literature has focused on the determinants of primaryschool teachers' transition recommendations regarding the secondary school track choicesuggested to their students (Ingenkamp, 1971; Becker, 2003; Bos and Pietsch, 2004;Jürges and Schneider, 2006; Arnold et al., 2007; Ditton, 2007; Pietsch and Stubbe,2007).In both the German and the American case, researchers mainly focused on teachers'
evaluations at students' early ages � being it in kindergarten or in primary school. Thus,little is known whether the determinants of teachers' evaluations found in these studiesapply to teachers' evaluations at secondary school to the same extent. In particular,we aim to analyze German 10th class Gymnasium teachers' evaluations regarding theirstudents' prospective aptitude for academic studies, and regarding the latter transitions,the current state of the art is quite puzzling.On the one hand, various theories propose that the e�ect of students' social back-
grounds on their educational opportunities should decline both over time and in thecourse of students' educational transitions (Müller and Karle, 1993; Raftery and Hout,1993; Breen and Goldthorpe, 1997; Lucas, 2001, 2009). On the other hand, several morerecent studies also found social background e�ects to increase from upper secondaryto tertiary education (Selz and Vallet, 2006; Erikson, 2007; Mayer et al., 2007; Müllerand Pollak, 2007; Lörz and Schindler, 2009; ?). Hence, even seemingly trivial questionssuch as whether students' social background e�ects on secondary school teachers' evalu-ations are still present after having controlled for student achievement indicators � whichis observable for primary school teachers' recommendations � remain unanswered yet.As a second contradiction to the waning coe�cients hypothesis, Andersen and Hansen(2012) deduced from Bourdieu's theory of cultural capital that the impact of its stylisticor symbolic components should increase with higher educational levels; and concerningstudents' educational performance, the authors �nd signi�cant support for this claim.Therefore, we see need to test whether similar mechanisms are still present regardingsecondary school teachers' evaluations.A theoretical shortcoming of the literature about teachers' evaluations in general is
that although proponents of rational-choice explanations of educational inequality haveinvested a great deal of e�ort in modeling expectations and cost-bene�t evaluations ofboth students and their parents (Breen and Goldthorpe, 1997; Esser, 1999; Goldthorpe,1996), action theories of teachers' assessments have not progressed with similar pace(Ditton, 2007). Therefore, as an additional, more conceptual aim, we intend to synthesizecommon hypotheses about how teachers' evaluations are shaped to a more abstracttheory of action.Our indicator of 10th class teachers' evaluations is taken from the Cologne High School
Panel (CHiSP), a German Panel dataset initially surveyed in 1969. In line with postu-lates by both early status attainment theorists (Sewell et al., 1969, 1970) and Pygmalionor self-ful�lling prophecy studies (Rosenthal and Jacobson, 1968; Madon et al., 1997;
1For a review of older (and in part less elaborate) studies analyzing the correlation between teachers'achievement judgments and students' actual achievement see Hoge and Coladarci (1989).
112
II. Teachers' Evaluations and the Social Situation in the Classroom
Jussim and Harber, 2005), it has been shown that these kind of evaluations actuallyhave a direct impact on students' educational transitions (Becker, 2010) � which, inturn, a�ect long-term occupational positions via path dependencies (Birkelbach, 2011).Thus, another contribution of our paper lies in analyzing the conditions which shapeevaluations of the �signi�cant others� (Sewell et al., 1969) that directly or indirectlyin�uence long-term educational and occupational status attainment processes.This is carried out by regarding teachers' evaluations about students' future aca-
demic ability as a result of a speci�c social situation in the classroom. In the followingtheoretical section (section 2), we will �rst replicate the general model of sociologicalexplanations as it has been introduced by Coleman (1990). Thereafter, in a brief refer-ence to the M odel of F rame Selection (MFS), we will discuss how existing meritocraticand habitus-related explanations of teachers' evaluations can be synthesized into the as-sumption of action scripts of a more automatic (as-mode) and a more rational (rc-mode)type of information processing, respectively (section 2.1).After that we will summarize the state of the art in German and Swiss educational
research about predictors of teachers' recommendations � supplemented by a reviewof several international studies regarding teachers' evaluations �, and we will deducecorresponding hypotheses for the speci�c kind of evaluations in our data (section 2.2).In section 3, we will brie�y describe our data, indicators, and research design. Sincewe hypothesize a more complex path structure for some of our theoretical concepts,we will test our hypotheses via structural equation modeling (SEM). In section 4, wewill discuss our main �ndings from our structural equation models. Most important,students' average grade is the strongest predictor in our models while intelligence comessecond. This leads us to the conclusion (section 5) that the meritocracy explanationof teachers' evaluations � regardless of the underlying type of information processing �is empirically more pronounced than the explanation based on criteria conventionallyassociated with the e�cacy of students' habitus. However, since we recognized severaladditional path coe�cients for manifest variables that may be related to unconsciousand automatic status-related mental processes often referred to as e�ects of habitus, wedemand from further studies to develop a more elaborate measurement model of theunderlying processes both on the teacher and on the student side than we were ableto analyze with our data. Considering also teachers' backgrounds would then lead to amultilevel structural equation model with teachers' evaluations nested in both student-and teacher-level contexts.
2 Theory and Hypotheses
A general model of sociological explanations was given in Coleman's (1990) seminalmonograph wherein he di�erentiates between macro-level and micro-level propositionsas a general form of modeling individual behavior in speci�c social contexts. The three-step procedure from the macro-level to the micro-level and back to the macro-level wasextended by Esser (1993, 1996, 1999) who labeled the steps as the logic of the situation,the logic of selection, and the logic of aggregation.
113

2 Theory and Hypotheses
The logic of the situation describes the top-down link from the macro-level to themicro-level entailing assumptions about both the conditions of the social situation andthe alternatives of individual actors. Actors' expectations and evaluations are linked tothe conditions and alternatives of the social situation via bridge hypotheses.2 The logic ofselection aims to explain individual decisions on the micro-level based on an underlyingtheory of action. If the latter is described explicitly, scholars conventionally make use ofrational choice (RC ) or subjective expected utility (SEU ) theory, or, as explicated below,of the M odel of F rame Selection (MFS).The logic of aggregation 'simply' embodies the bottom-up link between individual
behavior on the micro-level and a collective explanandum on the macro-level via trans-formation rules that may vary depending on the respective context. Figure 1 displaysthis general scheme of sociological explanations.
MACRO-LEVEL
MICRO-LEVEL
Social Situation 1
Social Situation 2
Individual Actor Individual Action
Figure 1: A general model of sociological explanations. Source: Esser (1993, p. 98).
Subject matter of our investigation is a speci�c form of teachers' evaluations concern-ing their students' ability for academic studies. In concrete terms, we refer to teachers'nominations whom of their students they consider to be able to start academic studiesand, likewise, whom they consider to lack these prerequisites.3 For an explanation of theemergence of these particular evaluations, a more detailed description of the social situ-ation in the classroom is fruitful. Since teachers' evaluations will surely depend on theirrespective expectations of students' prospective achievement, our aim is to specify the
2Some authors also use the term 'bridge hypotheses' to refer to speci�cations of the degree of actors'rationality (e.g. Kelle and Lüdemann, 1995). We follow Kroneberg and Kalter (2012) in that wewould these latter statements as auxiliary assumptions in order to distinguish them from the bridgeassumptions associated with the logic of the situation.
3A more detailed description of our data and our dependent variable is given in section 3.
114
II. Teachers' Evaluations and the Social Situation in the Classroom
relevant bridge hypotheses that are necessary to link these expectations and evaluationsto the conditions of the underlying social situation.
2.1 The Social Situation in the Classroom
In the literature on teachers' recommendations, it is assumed that the latter are actuallybased on rational decisions and a 'correct' de�nition of the situation in order to ensurethese recommendations to be somehow optimal for the students (Ditton, 2007).4 In thissense, a 'correct' de�nition of the situation should be shaped by the idea of meritocracy,and it should consider both students' actual achievement and their future developmentpossibilities. In the words of David Bell (1972, p. 41f.), �meritocracy is (...) the dis-placement of one principle of strati�cation by another, of ascription by achievement�,and it is this idea that is supposed to legitimize for the selective function of the educa-tional system (Solga, 2005).5 Hence, we should keep in mind that when talking about'rational' recommendations of the teachers, we always imply a kind of Weberian idealtype (Weber, 1968, p. 19-22) of objectivity and rationality that might (and idealiter alsoshould) thoroughly serve as a frame for teachers' recommendations. However, all actualrecommendations will never be more than a subjective and thus more or less imperfectrealization of this ideal type of rationality.In many � not all � German federal states ('Bundesländer'), teachers' recommen-
dations concerning the transition from primary to the three-tiered secondary school(Hauptschule, Realschule, and Gymnasium) are legally binding.6 Because of the minorpermeability between lower and higher education within the strati�ed German schoolsystem, there are only small chances to adjust an inaccurate (but nonetheless binding)recommendation of the teacher or an inadequate parental transition decision duringstudents' future educational life course (see e.g. Glaesser and Cooper, 2011). Actu-ally, teachers' recommendations are more or less accurate forecasts of students' futureachievement. One can expect them to be grounded on an evaluation of their actual
4Apart from Germany, we only know of the Netherlands and Switzerland as countries wherein studentsreceive an explicit recommendation by their primary school teachers with regard to secondary schoolchoice. In the Dutch case, teachers' recommendations are strongly in�uenced by students' resultsin a (compulsory) national achievement test (Tolsma et al., 2010). Both criteria were introducedin 1968 (in course of the Mammoth Law) in order to achieve a more meritocratic school system(Dronkers, 1993). Several studies noted that, possibly due to a success of all integrative ambitions,the e�ect of students' social backgrounds on teachers' recommendations decreased over time (for areview see Dronkers, 1983). In the Swiss canton Fribourg, transition recommendations at the end ofprimary school (i.e. in 6th grade) have been introduced in the course of broader educational reformsmid of the 1990s in order to foster transparency and to even out educational inequalities (Baeriswylet al., 2006, p. 378f.). Analyses based on student data from Fribourg indicate that in contrast toGermany, the e�ect of students' social backgrounds is partialed out when controls for achievementgo into the model (Baeriswyl et al., 2006; Trautwein and Baeriswyl, 2007).
5For theoretical and empirical critiques of the meritocratic argument see Kaplan and Kaplan (1997);Breen and Goldthorpe (1999); Goldthorpe (2003); Goldthorpe and Jackson (2008) as well as Beckerand Hadjar (2011).
6For a more detailed description of the German educational system see Hillmert and Jacob (2010);Jürges and Schneider (2006) as well as Pietsch and Stubbe (2007).
115
2 Theory and Hypotheses
performance, and on additional information about familial endorsement even spanningstudents' prospective educational transitions. Thus, teachers' recommendations have farreaching consequences for students' further life course.However, with regard to teachers' evaluations in our data, which are � in contrast to
teachers' recommendations � neither made public to the students nor have a bindingcharacter for them, an explanation based on a too narrow notion of rationality may falltoo short. One major reason is that these subjective evaluations lack any dependenceon structural necessities of the school system � meaning that teachers' subjective assess-ments of students' academic ability will neither be in�uenced by assumptions about theirdirect impact on students' transition decisions nor by outright norms of the respectiveschool environment.In the American context, several studies argued that although even non-binding eval-
uations are relatively unbiased regarding students' actual performance (Hoge and Co-ladarci, 1989; Ready and Wright, 2011), nonetheless, cultural di�erences between stu-dents and their teachers might be an important factor in explaining teachers' evalua-tions apart from achievement-related criteria (Alexander et al., 1987; Farkas et al., 1990;Farkas, 2003; Ferguson, 2003; Downey and Pribesh, 2004; Morris, 2005). While in thelatter studies, these cultural di�erences were largely related to ethnic group membership,in case of our data (German Gymnasium students surveyed in 1969), ethnic or racialissues are unlikely to be a dominant factor. Yet there are arguments that even for thespeci�c kind of evaluations surveyed in our data, both achievement-related criteria andstudents' social backgrounds might shape teachers' judgments. In particular, we striveto provide a reconstruction of teachers' reasoning when evaluating their students byreferring to Esser's and Kroneberg's enhancement of Kahneman and Tversky's (1984)early proposition of the framing approach towards a general theory of action (Esser,1996, 2010; Esser and Kroneberg, 2010; Kroneberg, 2006; Kroneberg et al., 2008, 2010;Kroneberg, 2011; Kroneberg and Kalter, 2012).Concretely, a particular frame de�ning an actor's social situation is usually given in
terms of an automatic-spontaneous mode (as-mode), but within each such frame, certainscripts of action (and also actions themselves) may vary between a more habitual as-mode and a more rational rc-mode depending on the de�nitional complexity of thesocial situation.7 In the Cologne High School Panel (CHiSP), for the teachers, thegiven frame of a survey-based assessment of students' prospective aptitude for academicstudies should be relatively doubtless (as-mode).Regarding the more concrete scripts of action, one the one hand, the most obvious
(i.e. as-mode) script would be one that is consistent with the demand for professionalpedagogic diagnostics according to meritocratic criteria such as students' academic per-formance. But in addition, several authors have argued that teachers can also be uncon-sciously in�uenced by students' habitus (Bourdieu, 1986; Bourdieu and Passeron, 1990)in terms of schemes of perception as well as of communication and self-control strate-
7More precisely, the probability of an as-mode script to be activated is positively associated with itsgeneral availability, its accessibility given the selection of a particular frame, and the match of thatframe to the social situation at hand (Kroneberg, 2006, p. 18; also see Kroneberg, 2011, p. 132).
116
II. Teachers' Evaluations and the Social Situation in the Classroom
gies (De Graaf and De Graaf, 2002; De Graaf et al., 2000; De Graaf, 1986; DiMaggio,1982; Dumais, 2006; Jaeger, 2009). Depending on each script's availability (Kroneberg,2006, p. 18), a dominant as-mode script will approximate more to one of either typesof meritocracy and habitus. While taking up the general assumption of actors' vari-able rationality (Kroneberg, 2005, 2006, 2011, 104-108), and in that case the idea ofunconscious status-related mental processes, we would refrain from adhering to all ide-ological implications the concept of habitus has been revealed to comprise (cf. Lareauand Weininger, 2003 and Goldthorpe, 2007).On the other hand, for both meritocracy- and habitus-related scripts, teachers might
also �nd entirely rational justi�cations why they ground their evaluations on certain cri-teria (rc-mode). Concerning meritocracy, teachers could re�ect that a student's currentschool performance does only imperfectly correspond to her actual cognitive capabil-ity and/or motivation that might nonetheless enable her to start academic studies atuniversity. Regarding students' social backgrounds, though of course not being in linewith the paradigm of meritocratic pedagogic diagnostics, teachers might hold the viewthat service-class students might be more successful at university than working-class stu-dents in that their parents, say having an academic background themselves, would bemore able to support them, or that they better match to the habitus of their universityteachers.8
In sum, we assume that in most cases, teachers ground their evaluations on meri-tocratic criteria according to a relatively automatic as-mode processing type � whichcan be distorted by unconscious status-related mental processes conventionally denotedas habitus e�ects. But the other hand, teachers may also refer to additional rationaljusti�cations in terms of both meritocracy- and status-related characteristics.9
2.2 Determinants of Teachers' Evaluations
Academic performance Being perhaps the most visible criterion, the predictive va-lidity of school grades as the most common indicator of students' academic performanceis, as several meta-analyses suggest, well-corroborated (Burton and Ramist, 2001; Kun-cel et al., 2001; Morgan, 1989; Robbins et al., 2004). Although in Germany the valueof school grades for long-term recommendations has been discussed since the 1920s (cf.Ingenkamp, 1971; Ziegenspeck and Lehmann, 1999), the average grades given by di�er-
8Elster (1983, pp. 69-71, 101-108) and Hedström (2005, p. 4) are quite critical about the analyticprecision of Bourdieu's notion of habitus. Collet (2009) and Yaish and Katz-Gerro (2012) are dissat-is�ed with a reduction of habitus on a merely unconscious, stimulus-response type of behavior. Inline with the idea of variable rationality, we assume that teachers may also rationally re�ect aboutstatus-related mental processes (habitus-rc-mode).
9Note that with the current data at hand, we are not able to test whether a given action scriptof either theoretical concept is actually more close to the as-mode or more close to the rc-modeof information processing. This is why the theoretical remarks above should be read more as atheoretical elucidation than in terms of 'rigor' groundwork whereof testable hypotheses would bededuced. However, in the conclusion section we will provide practical advice how empirical analysesmight further proceed to test the prevalence of either action script reliant on teacher backgroundvariables and/or in a more comparative framework.
117
2 Theory and Hypotheses
ent teachers over a longer time span are at least a good predictor of students' futureacademic success (Trapmann et al., 2007). Moreover, Arnold et al. (2007, p. 283) foundthat students' grades in mathematics and German language taken together can accountfor about two thirds of the total variance of teachers' recommendations. For both Ger-many (Tiedemann and Billmann-Mahecha, 2007; Gröhlich and Guill, 2009; Milek et al.,2009) and Switzerland (Trautwein and Baeriswyl, 2007), primary school teachers' tran-sition recommendations were observed to be signi�cantly predicted by students' gradeseven after controlling for class-level reference-group e�ects. Since the former �ndingsare supported by American studies analyzing teachers' evaluations (Hughes et al., 2005;Ready and Wright, 2011)10, and teachers' consideration of students' academic perfor-mance can be expected to be their probably most dominant (as-mode) script of action,we hypothesize:
H1: The better students' school grades, the higher their probability of obtaining a betterevaluation.
Cognitive ability According to Ingenkamp (1971), in the �eld of transition from pri-mary to secondary school, test results have always been used to compensate for thefallibility of teachers' assessments.11 In terms of predictive validity, also more recentstudies highlight that standardized test scores would be more valid indicators than stu-dents' school grades (Camara, 1998; Camara and Echternacht, 2000; Camara et al.,2003).Admittedly, cognitive capabilities can be regarded as the most important predictor of
school achievement, but a considerable empirical gap between test results and teachers'evaluations can be detected notwithstanding: In their investigation of German primaryschool teachers' transition recommendations, Arnold et al. (2007, p. 281) found thatstudents' reading literacy could account for only 31% of the variance of the teachers'recommendations.Nevertheless, a linear relationship between intelligence and the probability of obtaining
a particular teacher's recommendation to attend Gymnasium still holds � especially forthe verbal component of intelligence (Ditton, 2007). Moreover, both Tiedemann andBillmann-Mahecha (2007) as well as Trautwein and Baeriswyl (2007) showed that apartfrom grades, test results still a�ect teachers' transition recommendations in Germany andSwitzerland � even when the models are controlled for class-level reference-group e�ects.While in the American context, most studies used students' test results as a measure oftheir academic performance (see previous paragraph), Farkas et al. (1990) indeed foundteachers' evaluations to be considerably correlated with students' test results (while
10Alexander et al. (1987) and Farkas et al. (1990) analyzed how teachers' evaluations serve as a me-diating variable between students' social backgrounds, their cognitive abilities, and their schoolgrades.
11Moede et al. (1919) and Bobertag and Hylla (1926) can be quoted as very early references for attempt-ing to ground teachers' recommendations about school transition on the ground of standardized testresults.
118
II. Teachers' Evaluations and the Social Situation in the Classroom
teacher-assigned grades were measured separately).12 As we argued in the theoreticalsection, apart from students' academic performance, teachers might additionally try toestimate students' cognitive ability in order to rationally (rc-mode) increase the validityof their forecasts with regard to students' potential academic success at university. Thuswe hypothesize:
H2: The higher students' intelligence, the higher their probability of obtaining a betterevaluation.
Social backgrounds Although the impact of students' social background variables ontheir school achievement is basically undoubted, both strength and importance of thisrelationship is still discussed broadly (Becker, 2003; Becker and Hecken, 2009; Shavitand Blossfeld, 1993; Breen and Goldthorpe, 1997; Breen and Jonsson, 2000; Breen et al.,2009, 2010; Erikson et al., 2005; Goldthorpe, 2003; Hillmert and Jacob, 2010; Schneider,2008; Schubert and Becker, 2010; Stocké, 2007; Tolsma et al., 2010).In general, the literature distinguishes between primary e�ects of social inequality
which denote the impact of parental socioeconomic status (SES) on di�erences in stu-dents' academic abilities, and secondary e�ects of social inequality that capture di�er-ences � primarily in educational aspirations � apart from actual di�erences in academicabilities (Boudon, 1974).As regards primary e�ects, Arnold et al. (2007, p. 287) also observed that the odds to
attend Gymnasium is almost four times higher for �higher service class� children com-pared to �working class� children. Having controlled for students' cognitive abilities andreading literacy, these odds ratio reduces to 2.6. Hence, the di�erence between the twovalues can be interpreted as the result of primary e�ects of social inequality regard-ing teachers' formation of their evaluations due to students' actual ability di�erences(for similar results see Bos and Pietsch, 2004; Jürges and Schneider, 2006; Pietsch andStubbe, 2007; Tiedemann and Billmann-Mahecha, 2007 and Gröhlich and Guill, 2009).13
In American studies, signi�cant e�ects of parental SES on teachers' evaluations are re-ported by Alexander et al. (1987); Farkas et al. (1990); Downey and Pribesh (2004);Hughes et al. (2005) and Ready and Wright (2011). These �ndings and the mechanismsdiscussed in our theoretical section provide us with good reasons to test for the suppo-sition that parental SES might also in�uence teachers' evaluations as measured in ourdata:
H3: The higher the socioeconomic status (SES) of students' parents, the higher their
12However, although Farkas et al. (1990) provided a variety of regression models, no regression modelof the e�ect of test results on teachers' evaluations net of other predictors was reported. Also notethat Farkas et al. (1990) used teachers' evaluations to operationalize students' habits and stylesaccording to Bourdieu's (1986) notion of cultural capital � which does not allow to estimate thee�ect of habitus-related processes on teachers' evaluations (if not measured in terms of grades).
13As mentioned above, in the Swiss study by Trautwein and Baeriswyl (2007), the e�ect of parentalSES on teachers' transition recommendations is canceled out when analyses control for students'grades, their motivation and their cognitive capabilities.
119
2 Theory and Hypotheses
probability of obtaining a better evaluation.
As regards secondary e�ects, the �the inadequacy of uni-factorial theories� has beenprominently criticized (Boudon, 1974, p. 101). The crucial point of this critique aboutmerely one-factorial theories is that secondary e�ects of social inequality are still presentafter having controlled for all primary e�ects. That is, regardless of di�erences in cog-nitive abilities, �working class� children will still do less successfully in school because oflower educational expectations and aspirations.14
Our assumption is that students' aspirations not only impact their educational tran-sitions � but also, previously, their teachers' evaluations that might thoroughly have anin�uence on the later transition decisions. The claim that this e�ect takes place inde-pendently of academic performance, cognitive abilities and even parental SES impliesthat students' aspirations somehow a�ect teachers' internalized norms and habits.Several authors made use of students' aspirations to measure habitus-related compo-
nents (McClelland, 1990; Dumais, 2002, 2006; Andres, 2009)15, and also Morgan (2002,p. 423) argues in favor of using aspirations in terms of an �anticipation, based uponthe unconscious estimation of the objective probabilities of success� (Bourdieu, 1973, p.83). As outlined in section 2.1, if teachers have internalized certain norms and habitsquite strongly, the latter might automatically enter teachers' dominant script of actionin terms of an as-mode type of processing.However, maintaining the idea of variable rationality as proposed by the MFS, teachers
could also �nd rather rational arguments why students with certain social backgroundsin general and certain aspirations in particular might do better (rc-mode).In sum, on a conceptual level, e�ects of students' aspirations on their educational
transitions are explained as a form of secondary e�ects of social inequality in educationalopportunities. Regarding teachers' evaluations as an outcome, on a processual level, webroaden the limited focus of the literature on merely habitual explanations by allowingfor teachers' rational re�ections on students' aspirations as well.16
14Given education as an investment good (Goldthorpe, 1996, p. 494), the chief concern for each familywill be to achieve some kind of inter-generational stability of class positions. Hence, service-classparents will be more likely than others to encourage their children to attain some kind of highereducation (Breen and Goldthorpe, 1997). Reversely, for families in less advantaged positions, notonly less ambitious and less costly educational options would be adequate for the goal of maintainingclass stability � but also each failed attempt in obtaining higher educational levels is likely to be moreserious in its consequences (e.g. in terms of further opportunity costs which have to be shouldered).Thus, a higher level of education will be aspired if the educational motivation to continue somehowexceeds the underlying investment risk (also see Esser, 1999, pp. 265-275).
15Contrarily, van de Werfhorst and Hofstede (2007) are quite skeptic about the relation of students'habitus to their aspirations, and the authors did not �nd a signi�cant e�ect in their regressionmodels. However, van de Werfhorst and Hofstede (2007) merely operationalized habitus in terms ofparental 'high brow' culture participation, and following a recent critique by Andersen and Hansen(2012), this is a too narrow understanding of the concept since students' working habits and theirvisible educational e�ort would be excluded (also see Farkas et al., 1990).
16Once more we have to stress that when we make use of 'habitual' explanations, we do not buy allimplications associated with Bourdieu's concept of habitus. For instance, rational action theorieson social inequality in educational opportunities dissect the latter into stratum-speci�c di�erences
120

II. Teachers' Evaluations and the Social Situation in the Classroom
Hence, our last hypothesis reads ass follows:
H4: The higher students' aspirations, the higher their probability of obtaining a betterevaluation.
3 Research Design
3.1 Data
All analyses will rely on a dataset which is known as the �Cologne High School Panel�(CHiSP). The CHiSP consists of an initial survey from 1969 with N=3385 10th gradehigh school (Gymnasium) students in North Rhine-Westphalia and three re-surveys in1985 (N=1987), 1996/97 (N=1596), and 2010 (N=1301). In the initial survey, studentshave been asked about issues like their performance, interests and plans in school, abouttheir social origin and their relationship to their parents. Simultaneously to the initialsurvey, the students took part in an Intelligence S tructure T est (IST) which consistsof four sub-scales developed by Amthauer (1957). At the same time, also the students'teachers (N=1701) and parents (N=2646) have been surveyed. The main items of theparent questionnaire covered issues such as their social background, their child-raisingpractices, and their educational and occupational aspirations for their children.17
3.2 Variables
Dependent variable In the CHiSP, teachers have been asked to evaluate by a dichoto-mous decision whom of their students they suppose to be able for academic studies, andwhom of them not. Since this was an open-ended question, teachers could classify stu-dents as being able, as being not able � or not at all.This data structure causes two problems. First, each student could be evaluated by
more than one teacher, and each teacher could evaluate more than one student. An
concerning parents' or students' underlying cost-bene�t considerations (Boudon, 1974, p. 29�.;Goldthorpe, 1996; Erikson and Jonsson, 1996; Breen and Goldthorpe, 1997; Esser, 1999, p. 265-275). While both in the latter studies as well as in the paper at hand, the less parsimoniousassumption of variation in the absolute value of education per se is abandoned, exactly this is whatcultural capital theorists in the tradition of Bourdieu (1986) maintain (McClelland, 1990; Dumais,2002, 2006; Andres, 2009).
17In the �rst re-survey in 1985, the former students � at that time about 30 years old � provided detailedinformation about their private backgrounds and occupational careers beginning at the age of 15until the age of 30. In the second re-survey in 1996/97, the time segment from the age of 30 until theage of 43 was added to the data, and in the third re-survey in 2010, the time segment until the age of55 followed. Apart from the former students' life courses, common focus of the questionnaires wereitems about their biographical self-de�nition and -re�ection, causal attribution, about the essentialrole of particular areas of life, and about their attitudes towards family, work and politics. For ageneral overview on the existing literature with the CHiSP data hitherto see Birkelbach (1998) andMeulemann et al. (2001).
121
3 Research Design
analysis of the intra-class correlations (ICC) revealed a considerable variance of multipleteachers' evaluations for each student (see Becker and Birkelbach, 2010). Second, thequestion's openness might induce additional complication, because it has to be clari�edwhether the 'missing' category should really be considered as a missing value in statisticalterms � or if we were to lose substantial information when proceeding on this assumption.To overcome the �rst problem, our analyses will focus on evaluations only of class
teachers.18 To overcome the second problem, as a preliminary analysis we have estimatedtwo logistic regressions of the chance of getting a positive evaluation vs. getting anegative one, or none at all, respectively, on the same independent variables which wewill use in our structural equation models. These results are displayed in the appendix(tables B and C). We can note that for the analysis of the chance of getting a positiveevaluation vs. getting none at all (table C), the e�ect sizes of all independent variablesare of the same sign, but notably lower than for the analysis of the chance of gettinga positive evaluation vs. getting a negative one (table B). This is also re�ected in theexplained variances of the two models, which are notably higher for the models in tableB than for those in table C. Thus, we can conclude that students who have not beenmentioned at all rank lower in their teachers' perceptions than students with a positiveteacher evaluation, but higher than students with a negative teacher evaluation. Toget to the point: When teachers do not receive clear evidence for their decision, theywill shape only vague expectations for their students. Thus, in the subsequent structuralequation models we will treat the 'missing' category not as missing � but as being locatedbetween teachers' positive and negative evaluations. Hence, our outcome will be codedas follows: 1 'not able'; 2 'not mentioned'; 3 'able'.
Independent variables First, students' intelligence was measured by their scores inan Intelligence S tructure T est (Amthauer, 1957) consisting of four sub-scales each re-�ecting a distinct cognitive dimension (analogy, selection of words, series of numbers,cube test). For the structural equation models we will use the z-transformed scores ofthese sub-scales as a measure for the latent variable of students' intelligence (re�ectiveindicators; see Bollen and Lennox, 1991; MacCallum and Browne, 1993; Diamantopoulosand Winklhofer, 2001).Second, we control for students' academic performance in terms of their average
grades.19 Third, parental socioeconomic status (SES) will be operationalized as the max-imum value of both mother's and father's education and occupational prestige (whichequals the �dominance� approach suggested by Erikson, 1984). Education was mea-
18We expect that the intra-individual variance of teachers' evaluations partially depends on the qualityof teacher-student relationships. We assume that class teachers have a more intense relationship toand a better knowledge of their students than other teachers � which is why their evaluations shouldbe less error-prone (Raudenbush, 1984, p. 91). Thus, regarding only class teachers' evaluationswill both simplify the data structure and provide a lower-bound estimate in particular of the 'lesslegitimate' predictors of teachers' evaluations.
19Note that according to the German grade system, an average grade below the median displays rela-tively better marks and an average grade above the median relatively worse marks. To ensure thathigher variable values are associated with better marks, we inverted the variable.
122
II. Teachers' Evaluations and the Social Situation in the Classroom
sured in twelve categories ranking from 1 'without graduation' to 12 'university degree'.We categorized this variable into four dimensions (1 'lower'; 2 'middle'; 3 'higher'; 4'degree'). Concerning occupational prestige, the data already contains the respectiveTreiman prestige scores (Treiman, 1977).20
Finally, students' aspirations are measured by their appraisement whether 'Abitur' isnecessary to reach their aim in life � if any (1 'necessary'; 2 'not necessary, but useful';3 'not necessary'). We dichotomized this variable into 0 'no aim in life / Abitur notnecessary'; 1 'Abitur useful or necessary'.21
3.3 Preliminary Path Structure and Plan of Analysis
Since we expect the independent variables to be correlated with each other consider-ably, we intend to model these intercorrelations directly in our estimations. We expect,�rst, that students' intelligence will be able to explain part of the variance of their schoolgrades. Second, our considerations about the primary e�ect of social inequality (Boudon,1974) imply that parental SES will in�uence both students' intelligence and their schoolgrades. Third, to consider also the secondary e�ect of social inequality, we assume animpact of parental SES on students' aspirations. Fourth, it seems reasonable that highergrades will foster students' aspirations � and reversely. Therefore, we will allow for acovariance between those two variables. And �nally, research about both Pygmalionand self-ful�lling prophecies22 has shown that understanding teachers' evaluations as anentirely endogenous variables would fall too short. This is why we will model the rela-tionship between school grades and teachers' evaluations and the one between students'aspirations and teachers' evaluations as covariances rather than as regression weights.The preliminary path model is presented in �gure 2.
20See Ganzeboom and Treiman (1996) for a general overview about classi�cation of occupations. An-other possibility of dealing with parental SES would be to model all available information, i.e. allfour variables, as formative indicators of a latent variable 'SES' (Bollen and Lennox, 1991; MacCal-lum and Browne, 1993; Diamantopoulos and Winklhofer, 2001). However, since the initial surveyof the CHiSP took place in 1969, we have to expect that a considerable amount of mothers wouldnot have been employed; hence, the variance of this variable would be rather low. Indeed, a briefglance at the distribution of occupational prestige by gender revealed that an amount of 78% of allmothers had not been in labour when they have been surveyed (not shown, available upon request).As a consequence, the factor loadings of a con�rmatory factor analysis wherein we treated the fourSES variables as formative indicators were rather low (not shown, available upon request). Thus, weconsider introducing the maximum value of both mothers' and fathers' education and occupationalprestige as two single indicators to be a better strategy and to lead to more consistent estimates.
21Table A (appendix) lists minimum/maximum, mean and standard deviation of all variables.22For the initial study of Pygmalion in the Classroom see Rosenthal and Jacobson (1968). For early
meta-analyses of existing studies about Pygmalion up to that point see Smith (1980) and Rau-denbush (1984). For a more recent summary of implications and open questions in self-ful�llingprophecy research see Jussim and Harber (2005).
123
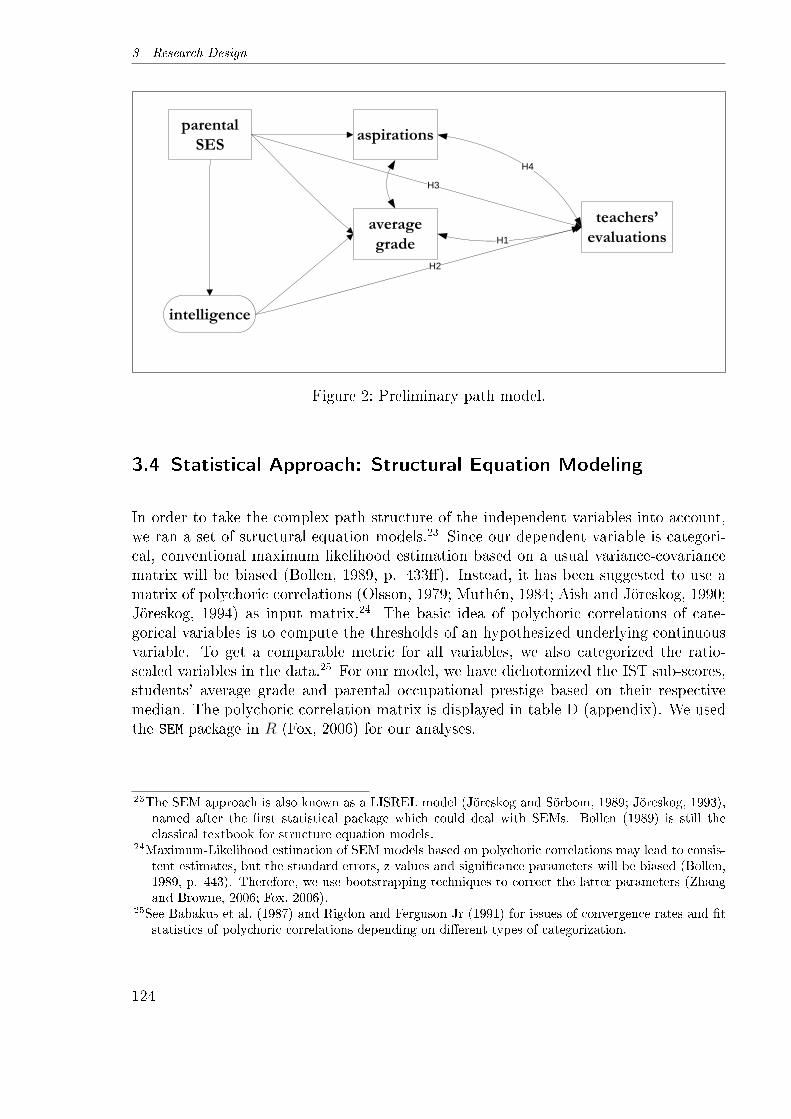
3 Research Design
intelligence
averagegrade
parentalSES
teachers’evaluationsH1
aspirations
H3
H4
H2
Figure 2: Preliminary path model.
3.4 Statistical Approach: Structural Equation Modeling
In order to take the complex path structure of the independent variables into account,we ran a set of structural equation models.23 Since our dependent variable is categori-cal, conventional maximum likelihood estimation based on a usual variance-covariancematrix will be biased (Bollen, 1989, p. 433�). Instead, it has been suggested to use amatrix of polychoric correlations (Olsson, 1979; Muthén, 1984; Aish and Jöreskog, 1990;Jöreskog, 1994) as input matrix.24 The basic idea of polychoric correlations of cate-gorical variables is to compute the thresholds of an hypothesized underlying continuousvariable. To get a comparable metric for all variables, we also categorized the ratio-scaled variables in the data.25 For our model, we have dichotomized the IST sub-scores,students' average grade and parental occupational prestige based on their respectivemedian. The polychoric correlation matrix is displayed in table D (appendix). We usedthe SEM package in R (Fox, 2006) for our analyses.
23The SEM approach is also known as a LISREL model (Jöreskog and Sörbom, 1989; Jöreskog, 1993),named after the �rst statistical package which could deal with SEMs. Bollen (1989) is still theclassical textbook for structure equation models.
24Maximum-Likelihood estimation of SEM models based on polychoric correlations may lead to consis-tent estimates, but the standard errors, z-values and signi�cance parameters will be biased (Bollen,1989, p. 443). Therefore, we use bootstrapping techniques to correct the latter parameters (Zhangand Browne, 2006; Fox, 2006).
25See Babakus et al. (1987) and Rigdon and Ferguson Jr (1991) for issues of convergence rates and �tstatistics of polychoric correlations depending on di�erent types of categorization.
124
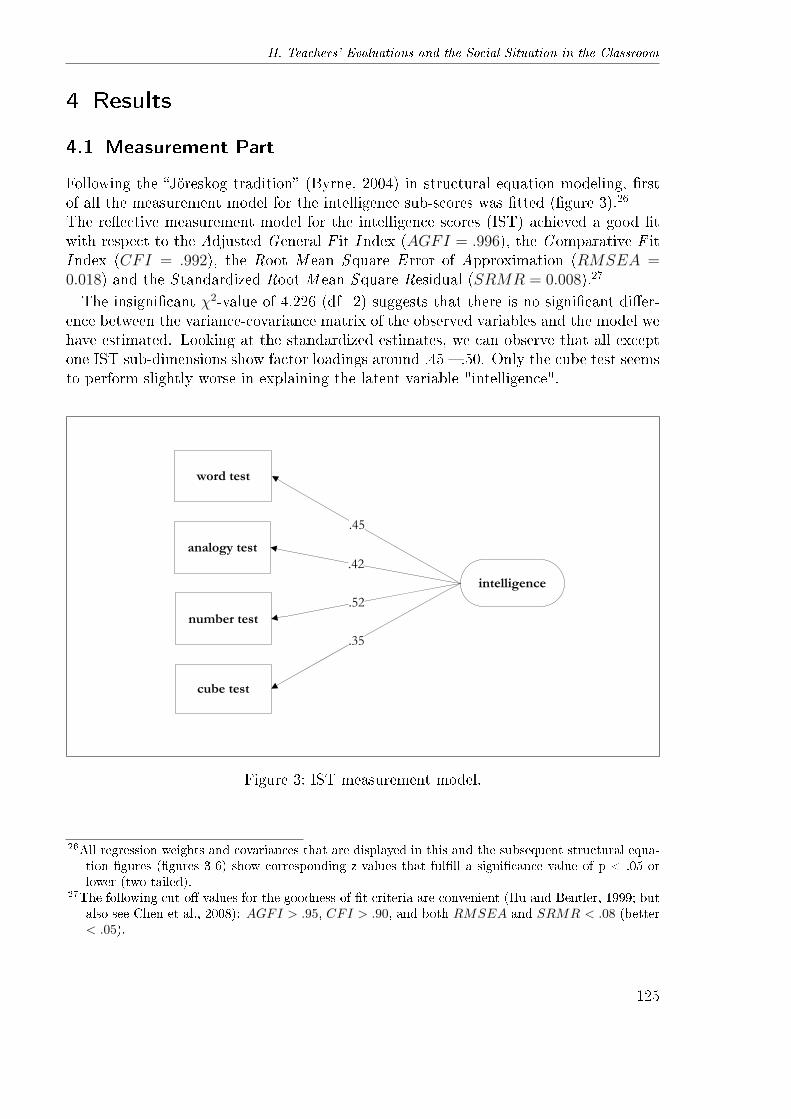
II. Teachers' Evaluations and the Social Situation in the Classroom
4 Results
4.1 Measurement Part
Following the �Jöreskog tradition� (Byrne, 2004) in structural equation modeling, �rstof all the measurement model for the intelligence sub-scores was �tted (�gure 3).26
The re�ective measurement model for the intelligence scores (IST) achieved a good �twith respect to the Adjusted General F it Index (AGFI = .996), the Comparative F itIndex (CFI = .992), the Root M ean Square E rror of Approximation (RMSEA =0.018) and the S tandardized Root M ean Square Residual (SRMR = 0.008).27
The insigni�cant χ2-value of 4.226 (df=2) suggests that there is no signi�cant di�er-ence between the variance-covariance matrix of the observed variables and the model wehave estimated. Looking at the standardized estimates, we can observe that all exceptone IST sub-dimensions show factor loadings around .45 � .50. Only the cube test seemsto perform slightly worse in explaining the latent variable "intelligence".
intelligence
word test
analogy test
number test
cube test
.35
.52
.42
.45
Figure 3: IST measurement model.
26All regression weights and covariances that are displayed in this and the subsequent structural equa-tion �gures (�gures 3-6) show corresponding z-values that ful�ll a signi�cance value of p < .05 orlower (two-tailed).
27The following cut-o� values for the goodness-of-�t criteria are convenient (Hu and Bentler, 1999; butalso see Chen et al., 2008): AGFI > .95, CFI > .90, and both RMSEA and SRMR < .08 (better< .05).
125
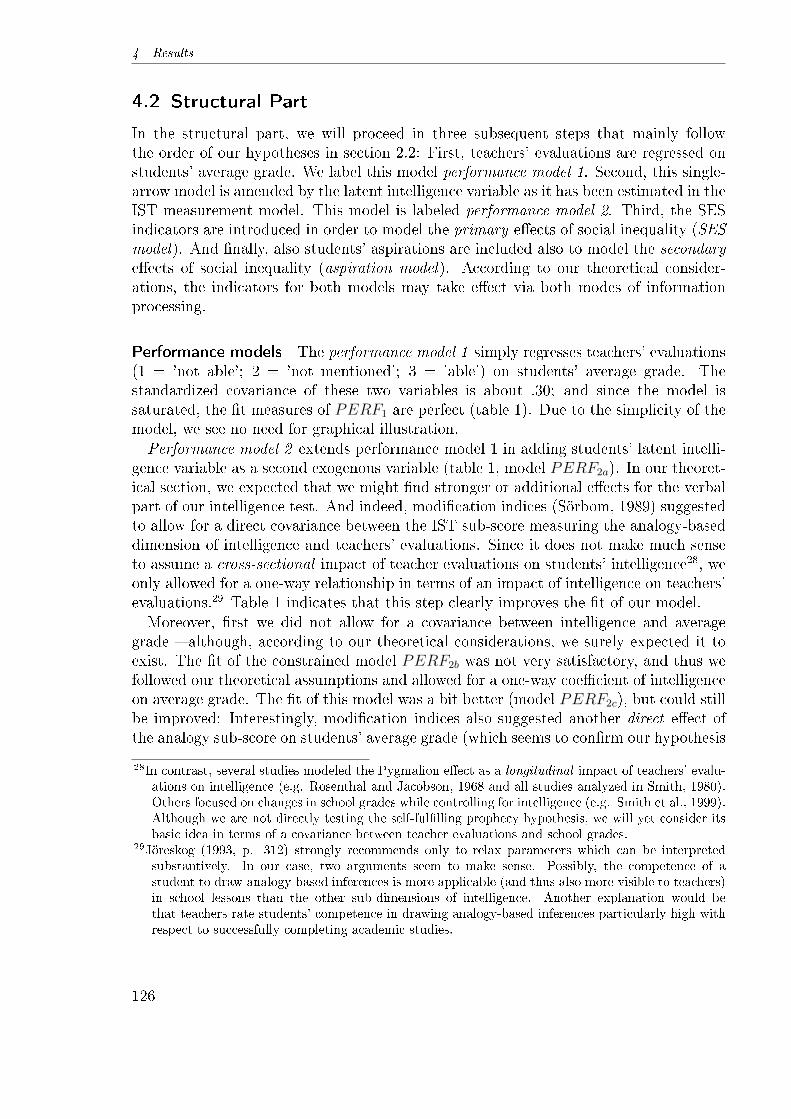
4 Results
4.2 Structural Part
In the structural part, we will proceed in three subsequent steps that mainly followthe order of our hypotheses in section 2.2: First, teachers' evaluations are regressed onstudents' average grade. We label this model performance model 1. Second, this single-arrow model is amended by the latent intelligence variable as it has been estimated in theIST measurement model. This model is labeled performance model 2. Third, the SESindicators are introduced in order to model the primary e�ects of social inequality (SESmodel). And �nally, also students' aspirations are included also to model the secondarye�ects of social inequality (aspiration model). According to our theoretical consider-ations, the indicators for both models may take e�ect via both modes of informationprocessing.
Performance models The performance model 1 simply regresses teachers' evaluations(1 = 'not able'; 2 = 'not mentioned'; 3 = 'able') on students' average grade. Thestandardized covariance of these two variables is about .30; and since the model issaturated, the �t measures of PERF1 are perfect (table 1). Due to the simplicity of themodel, we see no need for graphical illustration.Performance model 2 extends performance model 1 in adding students' latent intelli-
gence variable as a second exogenous variable (table 1, model PERF2a). In our theoret-ical section, we expected that we might �nd stronger or additional e�ects for the verbalpart of our intelligence test. And indeed, modi�cation indices (Sörbom, 1989) suggestedto allow for a direct covariance between the IST sub-score measuring the analogy-baseddimension of intelligence and teachers' evaluations. Since it does not make much senseto assume a cross-sectional impact of teacher evaluations on students' intelligence28, weonly allowed for a one-way relationship in terms of an impact of intelligence on teachers'evaluations.29 Table 1 indicates that this step clearly improves the �t of our model.Moreover, �rst we did not allow for a covariance between intelligence and average
grade � although, according to our theoretical considerations, we surely expected it toexist. The �t of the constrained model PERF2b was not very satisfactory, and thus wefollowed our theoretical assumptions and allowed for a one-way coe�cient of intelligenceon average grade. The �t of this model was a bit better (model PERF2c), but could stillbe improved: Interestingly, modi�cation indices also suggested another direct e�ect ofthe analogy sub-score on students' average grade (which seems to con�rm our hypothesis
28In contrast, several studies modeled the Pygmalion e�ect as a longitudinal impact of teachers' evalu-ations on intelligence (e.g. Rosenthal and Jacobson, 1968 and all studies analyzed in Smith, 1980).Others focused on changes in school grades while controlling for intelligence (e.g. Smith et al., 1999).Although we are not directly testing the self-ful�lling prophecy hypothesis, we will yet consider itsbasic idea in terms of a covariance between teacher evaluations and school grades.
29Jöreskog (1993, p. 312) strongly recommends only to relax parameters which can be interpretedsubstantively. In our case, two arguments seem to make sense. Possibly, the competence of astudent to draw analogy-based inferences is more applicable (and thus also more visible to teachers)in school lessons than the other sub-dimensions of intelligence. Another explanation would bethat teachers rate students' competence in drawing analogy-based inferences particularly high withrespect to successfully completing academic studies.
126

II. Teachers' Evaluations and the Social Situation in the Classroom
about the particular visibility of this sub-dimension of intelligence at school). Thismodel, PERF2d, is presented in �gure 4. The numbers next to the arrows show the
intelligence
number test
cube test
.35
.52
.42
.45
average grade
teachers’ evaluations
.15
.20
analogy test
word test
.40
.10
.16
Figure 4: Performance model.
standardized path coe�cients, the factor loadings, and the covariances of the model,respectively. Similar to our logistic regressions (cf. appendix, tables B and C), thecovariance between average grade and teachers' evaluations seems to be much larger thanthe impact of students' intelligence scores (.40 vs. .20). Controlling also for intelligence,we note that the relationship between intelligence and teachers' evaluations is mediatedby the intervening variable average grade (.15). It also seems noteworthy that the distincte�ect of the IST sub-score measuring the analogy dimension of intelligence on averagegrade (.10) is again not much smaller than the respective overall regression weight of thelatent variable intelligence (.15) � which is due to a drop-down of the latter from .43 inthe restricted model (not shown). The �t of this model is convincing (cf. table 1, modelPERF2d).
SES model Now we introduce the maximum value of both highest parental educationaldegree and occupational prestige as two single indicators in order to model the primarye�ects of social inequality explicitly. The initial �t of this model is already acceptable(see table 2, model SES1), and it could be improved slightly when the covariance be-tween the two SES indicators was relaxed (model SES2). Another improvement couldbe achieved when we allowed for the regression weights of the two SES indicators on thelatent intelligence variable (model SES3) � meaning an operationalization of primarye�ects of social inequality. Yet, in contrast to our theoretical model (�gure 2), two co-e�cients in the SES model turned out to lack statistical signi�cance: the coe�cient ofeducation on the overall latent intelligence variable, and the coe�cient of occupationalprestige on teachers' evaluations. Therefore, we subsequently dropped these regressionweights (models SES4 and SES5). Moreover, modi�cation indices suggested to intro-
127

4 Results
Table 1: Performance models: Fit measures
PERF1 PERF2a PERF2b PERF2c PERF2d
χ2 <.001 172.03 138.02 28.015 8.85
df 1 10 9 7 6
p(> χ2) 1 <.001 <.001 <.001 0.182
AGFI 1 0.966 0.97 0.992 0.997
RMSEA 0 0.069 0.065 0.03 0.012
CFI 1 0.912 0.93 0.989 0.998
SRMR 0 0.061 0.058 0.018 0.009
duce a direct e�ect of parental education on the analogy sub-score of intelligence. Sincewe already found direct e�ects of this dimension on both average grade and teachers'evaluations (see �gure 4), which was in line with our theoretical considerations, we al-lowed for this regression weight (model SES6). While models SES5 and SES6 stillcontain occupational prestige as a covariate of education, we �nally tested a model thatcompletely passed the former variable (model SES7). This model could achieve a better�t than SES6, and, according to Occam's razor's maxim of parsimoniousness, it is thepreferred model up to now (see �gure 5).30 The direct e�ect of parental education onteachers' evaluations is about .10 � which is the second smallest coe�cient in the modelup to now. Yet, we also have to keep in mind the indirect e�ect in terms of the rela-tionship between education, the IST analogy dimension and teachers' evaluations.31 Thecovariance between students' average grade and teachers' evaluations is still the strongeste�ect in the model (.40), while � at least up to now � the impact of intelligence on teach-ers' evaluations comes second (.26). Again, the e�ect of the latent intelligence variableon teachers' evaluations slightly increases when controlling for direct and indirect e�ectsof parental education. Apparently, the predictive power of intelligence on teachers' eval-uations becomes even stronger among students with the same social background. Thismodel yielded an entirely satisfactory �t (table 2, model SES7 ).
Aspiration model In order to model also the secondary e�ects of social inequality aswell as teachers' more or less conscious re�ections on them, we �nally included students'aspirations measured by their dummy-coded appraisement if 'Abitur' is necessary to
30We tested three additional variants of models SES6 and SES7 (not shown, available upon request):one with a regression weight of occupational prestige on average grade (not signi�cant), one with adirect e�ect of education on the latent IST variable rather than on the sub-score merely measuringits analogy dimension (signi�cant, but worse model �t), and one with regression weights of parentaleducation on both the latent IST variable and the analogy sub-score (which is signi�cant, but su�ersfrom multicollinearity). Because of these respective drawbacks we still prefer model SES7.
31The total e�ect of parental education on teachers' evaluations is computed as .10 + (.11 · .08 · .4) +(.11 · .13) ≈ .118.
128
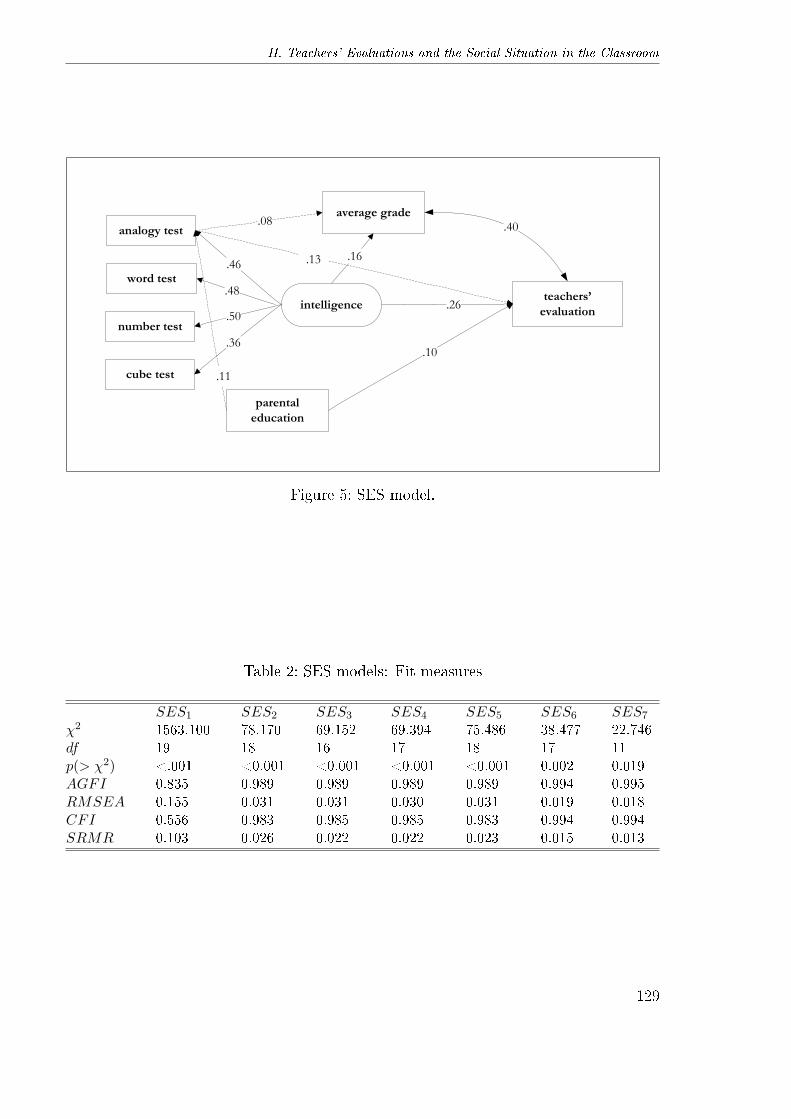
II. Teachers' Evaluations and the Social Situation in the Classroom
intelligence
number test
cube test
.36
.50
.48
.46
average grade
teachers’ evaluation
.16
.26
analogy test
word test
.40.08
.13
parental education
.10
.11
Figure 5: SES model.
Table 2: SES models: Fit measures
SES1 SES2 SES3 SES4 SES5 SES6 SES7χ2 1563.100 78.170 69.152 69.394 75.486 38.477 22.746
df 19 18 16 17 18 17 11
p(> χ2) <.001 <0.001 <0.001 <0.001 <0.001 0.002 0.019
AGFI 0.835 0.989 0.989 0.989 0.989 0.994 0.995
RMSEA 0.155 0.031 0.031 0.030 0.031 0.019 0.018
CFI 0.556 0.983 0.985 0.985 0.983 0.994 0.994
SRMR 0.103 0.026 0.022 0.022 0.023 0.015 0.013
129
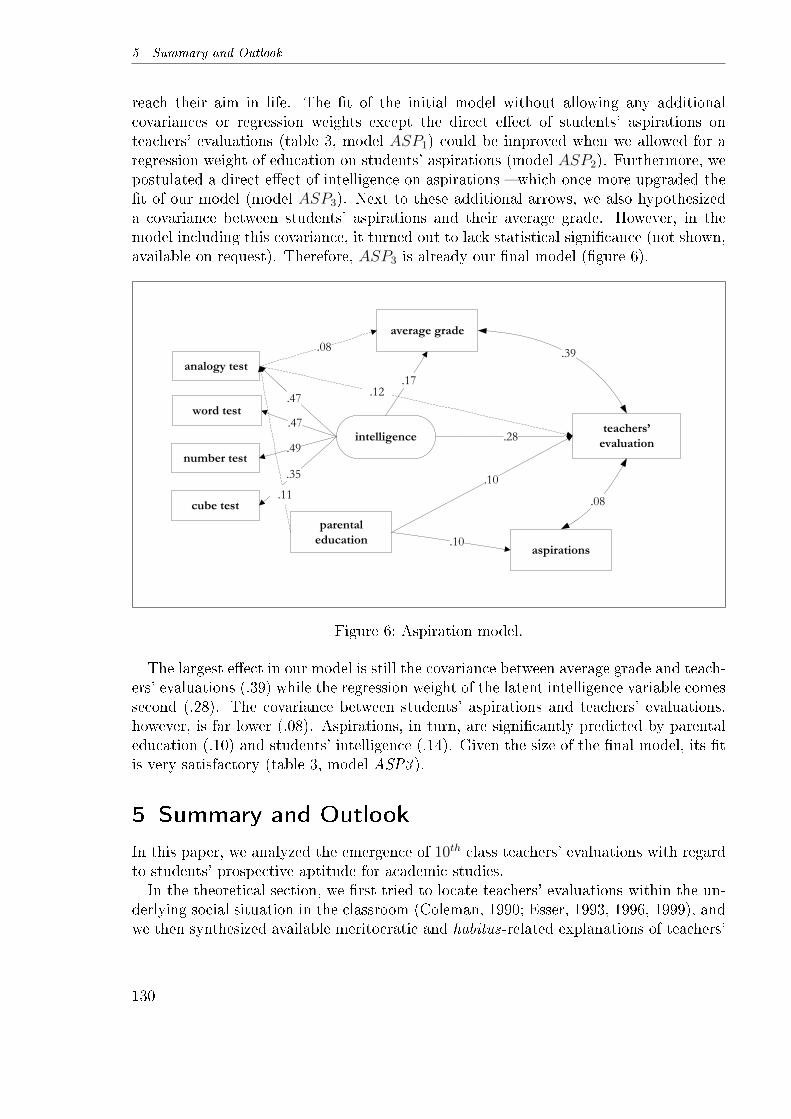
5 Summary and Outlook
reach their aim in life. The �t of the initial model without allowing any additionalcovariances or regression weights except the direct e�ect of students' aspirations onteachers' evaluations (table 3, model ASP1) could be improved when we allowed for aregression weight of education on students' aspirations (model ASP2). Furthermore, wepostulated a direct e�ect of intelligence on aspirations � which once more upgraded the�t of our model (model ASP3). Next to these additional arrows, we also hypothesizeda covariance between students' aspirations and their average grade. However, in themodel including this covariance, it turned out to lack statistical signi�cance (not shown,available on request). Therefore, ASP3 is already our �nal model (�gure 6).
intelligence
number test
cube test
.35
.49
.47
.47
average grade
teachers’ evaluation
.17
.28
analogy test
word test
.39.08
.12
parental education
.10.11
aspirations.10
.08
Figure 6: Aspiration model.
The largest e�ect in our model is still the covariance between average grade and teach-ers' evaluations (.39) while the regression weight of the latent intelligence variable comessecond (.28). The covariance between students' aspirations and teachers' evaluations,however, is far lower (.08). Aspirations, in turn, are signi�cantly predicted by parentaleducation (.10) and students' intelligence (.14). Given the size of the �nal model, its �tis very satisfactory (table 3, model ASP3 ).
5 Summary and Outlook
In this paper, we analyzed the emergence of 10th class teachers' evaluations with regardto students' prospective aptitude for academic studies.In the theoretical section, we �rst tried to locate teachers' evaluations within the un-
derlying social situation in the classroom (Coleman, 1990; Esser, 1993, 1996, 1999), andwe then synthesized available meritocratic and habitus-related explanations of teachers'
130
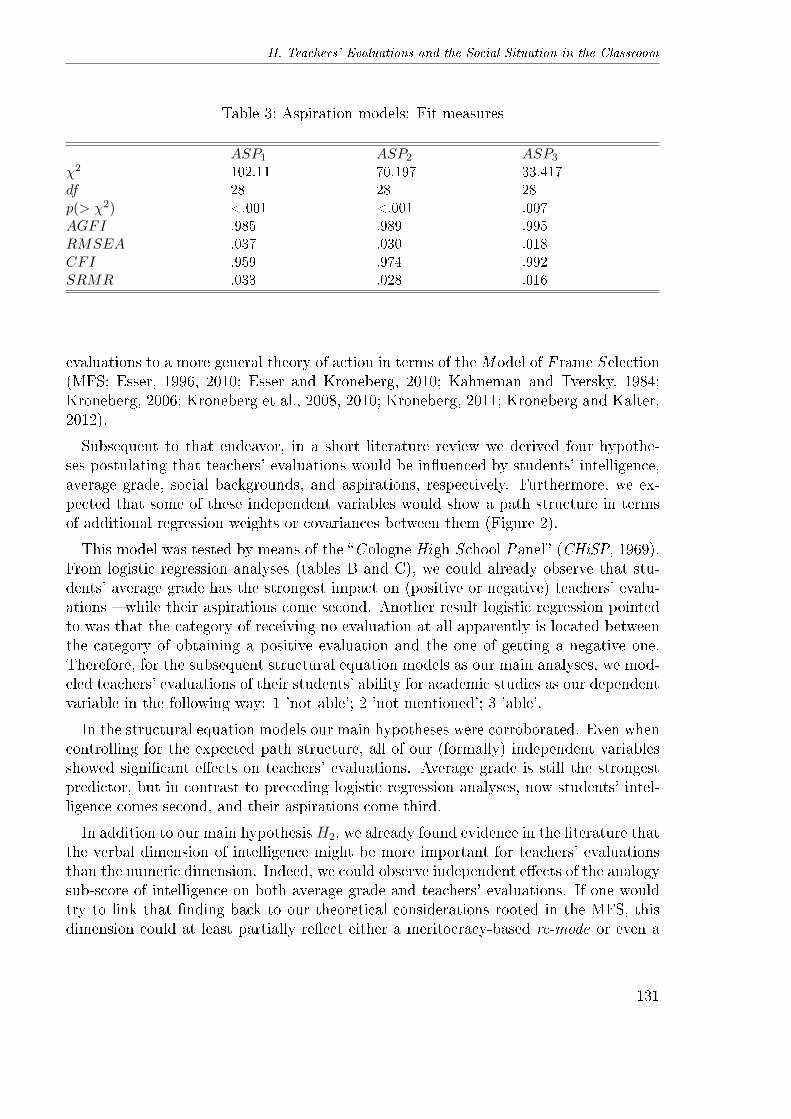
II. Teachers' Evaluations and the Social Situation in the Classroom
Table 3: Aspiration models: Fit measures
ASP1 ASP2 ASP3
χ2 102.11 70.197 33.417
df 28 28 28
p(> χ2) <.001 <.001 .007
AGFI .985 .989 .995
RMSEA .037 .030 .018
CFI .959 .974 .992
SRMR .033 .028 .016
evaluations to a more general theory of action in terms of the M odel of F rame Selection(MFS; Esser, 1996, 2010; Esser and Kroneberg, 2010; Kahneman and Tversky, 1984;Kroneberg, 2006; Kroneberg et al., 2008, 2010; Kroneberg, 2011; Kroneberg and Kalter,2012).
Subsequent to that endeavor, in a short literature review we derived four hypothe-ses postulating that teachers' evaluations would be in�uenced by students' intelligence,average grade, social backgrounds, and aspirations, respectively. Furthermore, we ex-pected that some of these independent variables would show a path structure in termsof additional regression weights or covariances between them (Figure 2).
This model was tested by means of the �Cologne High School Panel� (CHiSP, 1969).From logistic regression analyses (tables B and C), we could already observe that stu-dents' average grade has the strongest impact on (positive or negative) teachers' evalu-ations � while their aspirations come second. Another result logistic regression pointedto was that the category of receiving no evaluation at all apparently is located betweenthe category of obtaining a positive evaluation and the one of getting a negative one.Therefore, for the subsequent structural equation models as our main analyses, we mod-eled teachers' evaluations of their students' ability for academic studies as our dependentvariable in the following way: 1 'not able'; 2 'not mentioned'; 3 'able'.
In the structural equation models our main hypotheses were corroborated. Even whencontrolling for the expected path structure, all of our (formally) independent variablesshowed signi�cant e�ects on teachers' evaluations. Average grade is still the strongestpredictor, but in contrast to preceding logistic regression analyses, now students' intel-ligence comes second, and their aspirations come third.
In addition to our main hypothesisH2, we already found evidence in the literature thatthe verbal dimension of intelligence might be more important for teachers' evaluationsthan the numeric dimension. Indeed, we could observe independent e�ects of the analogysub-score of intelligence on both average grade and teachers' evaluations. If one wouldtry to link that �nding back to our theoretical considerations rooted in the MFS, thisdimension could at least partially re�ect either a meritocracy-based rc-mode or even a
131
5 Summary and Outlook
habitus-based as-mode of processing.32
But compared to the initial path model, we also had to drop several arrows due to lackof signi�cance: First, we did not �nd a signi�cant regression weight of parental educationon the overall latent intelligence variable. However, we could note a signi�cant impact ofparental education on the analogy sub-score of intelligence. Since this variable showedindependent e�ects on both average grade and teachers' evaluations, we conclude thatthe primary e�ect of social inequality is mainly passed on via this predictor. Second, wecould not �nd any direct e�ects of parental occupational prestige on students' averagegrade. Apparently, in our socially selective sample � recall that our observations are(predominantly upper-class) Gymnasium students � the primary e�ect of social inequal-ity is exhaustively modeled when we control for the indirect e�ect of parental SES viaintelligence on average grade. The third arrow we had to drop concerned the regressionweight of parental occupational prestige on students' aspirations. This indicates that bycontrolling for parental education, all social background e�ects on students' aspirationsare already modeled.In sum, we can conclude that although indicators for all four types of theoretical con-
cepts showed statistical signi�cance, results con�rmed our expectations that the meri-tocracy explanation � be it based on rc-mode or as-mode scripts � shows more predictivepower than the explanation based on habitus-related criteria. Yet, both the empiricaldominance of students' average grade in our models and the fact that the verbal di-mension of intelligence showed additional path coe�cients on both average grade andteachers' evaluations might underline the particular importance of the as-mode type ofmeritocratic reasoning.These results suggest the following implications for further studies: First, the under-
lying social mechanisms of the emergence of teachers' evaluations have to be furtherexamined. Future studies should try to sharpen the distinction between rc-mode andas-mode processing type explanations as we have transferred it on the social situationin the classroom.Clearly, this approach needs the consideration of more background variables. On the
one hand, the set of student variables in our analyses might be no exhaustive operational-ization of the student side of the social situation in the classroom. Thus, it would makesense to include additional information such as students' grades in di�erent subjects ortheir academic self-concept in order to specify the social situation in the classroom moreconcretely.Moreover, we already indicated that although at �rst sight, it appears reasonable
to interpret the additional path coe�cient of the analogy sub-score on both students'academic performance and teachers' evaluations in line with an automatically-drivenmeritocratic form of reasoning, at a second glance, these arrows might also emerge byvirtue of unconscious, symbolic communication among teachers and students usuallyreferred to as e�ects of habitus : Recapitulating our theoretical considerations strictly inthe latent variable framework, only one of our lower-level concepts intelligence, academic
32Below we discuss why we see arguments for either mode of processing, and we propose a method howto decide which mode of processing may be the actual drive for this arrow.
132
II. Teachers' Evaluations and the Social Situation in the Classroom
performance, parental SES and students aspirations was actually measured as a latentvariable, namely students' intelligence. Thus, both students' academic performance andtheir social backgrounds � more or less consciously observed by their teachers � wereoperationalized by single manifest indicators that probably did not control su�ciently formeasurement error. In other words, students' objective academic performance should beunderstood as a latent variable which is only approximately measured by their averagegrades. The latter, in turn, are nothing but the result of a speci�c form of teachers'evaluations which may themselves be distorted by unconscious, habitus-related criteriathat operate in addition to teachers' meritocratic considerations. We expect that weprobably would �nd supplemental e�ects of both the verbal dimension of intelligence andour measure of academic performance on our indicators of students' social backgrounds� currently only in part re�ecting teachers' unconscious mental processes � if we couldprovide a more detailed operationalization of the e�cacy of habitus (e.g. in terms ofstudents' cultural capital, their cultural practices, etc.) than we were able to measurewith our data at hand.33 In concrete terms, we demand from further studies to testfor a second-order factor model (Chen et al., 2005; Rindskopf and Rose, 1988) withstudents' habitus as the higher-level factor, and parental SES, students' aspirations andtheir cultural capital as lower-level factors that should be operationalized by appropriateindicators, respectively.34
On the other hand, if one would really want to disentangle the conditions determiningin which situations teachers' scripts of action tend to follow either a more automatic ora more rational mode of information processing � which we solely sketched for theoret-ical elucidation purposes �, it will be inevitable also to control for teacher backgroundvariables. Future studies should try to �nd variables such as teachers' pedagogic con-cepts, their attitudes towards educational inequality or measures of teachers' successattribution that explain why a particular teacher follows a certain dominant script ofaction. Furthermore, teachers' backgrounds should ideally cover indicators of the sym-bolic processes usually referred to as e�ects of habitus as well: Only if both students'and teachers' habitus are measured adequately, a �nal decision about habitus match ormismatch will be possible. Methodologically, controlling also for teachers' backgrounds
33See Kingston (2001), Lareau and Weininger (2003), and, recently, Andersen and Hansen (2012) for acritical assessment of cultural capital usage in educational research.
34DiMaggio (1982) and De Graaf (1986) used exploratory factor analysis to measure families' culturalcapital, but to the best of our knowledge, a con�rmatory factor model of the notion of habitusin a broader sense is still missing. McClelland (1990), Dumais (2002, 2006) and Andres (2009)operationalized habitus by students' aspirations, but as Dumais (2002, p. 51) herself acknowledged,single-indicator measures for habitus are far from perfect (also see Reay, 2004, p. 440f.). Andres(2009) made use of a path model to test the interrelations between social backgrounds, di�erentforms of capital and dispositions; but although claimed in his theoretical section, no analyticaloperationalization of habitus was given in his measurement part. In this attempt, further studies mayalso refer to the theoretical concepts used by social psychology that o�er a whole bunch of literatureabout the prediction of behavior by attitudes (for meta-analyses see Glasman and Albarracín, 2006;Kim and Hunter, 1993a,b; Kraus, 1995; Wallace et al., 2005). However, although Acock and Scott(1980) already modeled attitudes as being a�ected by social class, more recent psychological studiesapparently neglected this endogeneity.
133
References
would equal a multilevel structural equation model (Bauer, 2003; Heck, 2001; Muthén,1994; Rabe-Hesketh et al., 2004, 2007) wherein both students and teachers' evaluationsare nested in teacher contexts.And �nally, the theoretical and methodological propositions o�ered here would cer-
tainly gain from a more comparative framework.35 Provided that reliable indicatorsallowing to disentangle both modes of processing from each other can be found, it wouldbe illuminating to see whether the potential prevalence of either one is contingent upondi�erences in social selectivity between educational systems, or upon changes in social se-lectivity and/or saturation within a given one (for an overview see Shavit and Blossfeld,1993).
References
Acock AC and Scott WJ (1980) A model for predicting behavior: the e�ect of attitudeand social class on high and low visibility political participation. Social PsychologyQuarterly 43(1): 59�72.
Aish AM and Jöreskog KG (1990) A panel model for political e�cacy and responsiveness:an application of LISREL 7 with weighted least squares. Quality and Quantity 24(4):405�426.
Alexander KL; Entwisle DR and Thompson MS (1987) School performance, status re-lations, and the structure of sentiment: bringing the teacher back in. American Soci-ological Review 52(5): 665�682.
Amthauer R (1957) Intelligenz-Struktur-Test. Göttingen: Hogrefe.
Andersen PL and Hansen MN (2012) Class and cultural capital - the case of classinequality in educational performance. European Sociological Review 28(5): 607�621.
Andres L (2009) The cumulative impact of capital on dispositions across time: a 15years perspective of young canadians. In: Quantifying Theory: Pierre Bourdieu, 75�88. Dordrecht: Springer Netherlands.
Arnold KH; Bos W; Richert P et al. (2007) Schullaufbahnpräferenzen am Ende dervierten Klassenstufe. In: Bos W; Hornberg S; Arnold KH et al. (eds.) IGLU2006 - Schullaufbahnempfehlungen von Lehrkräften für Kinder am Ende der viertenJahrgangsstufe, 271�297. Münster / New York: Waxmann.
Babakus E; Ferguson Jr CE and Jöreskog KG (1987) The sensitivity of con�rmatorymaximum likelihood factor analysis to violations of measurement scale and distribu-tional assumptions. Journal of Marketing Research 24(2): 222�228.
35This would be of particular relevance also regarding the MFS since in a comparative framework,variance in teachers' frames of the underlying social situation could be studied as well.
134

II. Teachers' Evaluations and the Social Situation in the Classroom
Baeriswyl F; Wandeler C; Trautwein U et al. (2006) Leistungstest, O�enheit von Bil-dungsgängen und obligatorische Beratung der Eltern. Zeitschrift für Erziehungswis-senschaft 9(3): 373�392.
Bauer DJ (2003) Estimating multilevel linear models as structural equation models.Journal of Educational and Behavioral Statistics 28(2): 135�167.
Becker D (2010) The impact of teachers' expectations on students' educational oppor-tunities in the life course. Cologne Graduate School Working Paper Series 1(7).URL: http://econpapers.repec.org/paper/cgrcgsser/01-07.htm
Becker D and Birkelbach K (2010) Intelligenz und Schulleistung als Kontextmerkmale:Big-Fish-Little-Pond- oder Re�ected-Glory-E�ekt? Eine Mehrebenen-Analyse vonLehrerurteilen. In: Beckers T; Birkelbach K; Hagenah J et al. (eds.) Komparativeempirische Sozialforschung, 113�141. Wiesbaden: VS-Verlag.
Becker R (2003) Educational expansion and persistent inequalities of education. Euro-pean Sociological Review 19(1): 1�24.
Becker R and Hadjar A (2011) Meritokratie - Zur gesellschaftlichen Legitimation un-gleicher Bildungs-, Erwerbs-und Einkommenschancen in modernen Gesellschaften.Lehrbuch der Bildungssoziologie 37�62.
Becker R and Hecken AE (2009) Why are working-class children diverted from univer-sities? An empirical assessment of the diversion thesis. European Sociological Review25(2): 233�250.
Bell D (1972) On Meritocracy and Equality. The Public Interest 29: 29�68.
Birkelbach K (1998) Berufserfolg und Familiengründung. Lebensläufe zwischen institu-tionellen Bedingungen und individueller Konstruktion. Opladen: Westdeutscher Ver-lag.
Birkelbach K (2011) Teacher evaluations over the life course: valid prognosis or self-ful�lling prophecy? In: Mica A; Peisert A and Winczorek J (eds.) Sociology and theUnintended - Robert Merton Revisited, 133�153. Frankfurt a.M.: Peter Lang.
Bobertag O and Hylla E (1926) Begabungsprüfung für den Übergang von der Grundschulezu weiterführenden Schulen. Langensalza: Verlag von Julius Beltz.
Bollen KA (1989) Structural Equations With Latent Variables. New York: Wiley.
Bollen KA and Lennox R (1991) Conventional wisdom on measurement: a structuralequation perspective. Psychological Bulletin 110(2): 305�314.
Bos W and Pietsch M (2004) Erste Ergebnisse aus KESS 4. Kurzbericht. Hamburg:Freie und Hansestadt Hamburg.
135

References
Boudon R (1974) Education, Opportunity and Social Inequality: Changing Prospects inWestern Society. New York: John Wiley & Sons.
Bourdieu P (1973) Cultural reproduction and social production. In: Brown R (ed.)Knowledge, Education, and Cultural Change: Papers in the Sociology of Education,71�112. London: Tavistock Publications.
Bourdieu P (1986) Distinction: A Social Critique of the Judgement of Taste. London:Routledge.
Bourdieu P and Passeron JC (1990) Reproduction in Education, Society and Culture.London: Sage Publications Ltd.
Breen R and Goldthorpe JH (1997) Explaining educational di�erentials: towards a for-mal rational action theory. Rationality and Society 9(3): 275�305.
Breen R and Goldthorpe JH (1999) Class inequality and meritocracy: a critique ofSaunders and an alternative analysis. The British Journal of Sociology 50(1): 1�27.
Breen R and Jonsson JO (2000) Analyzing educational careers: a multinomial transitionmodel. American Sociological Review 65(5): 754�772.
Breen R; Luijkx R; Müller W et al. (2009) Nonpersistent inequality in educational at-tainment: evidence from eight European countries. American Journal of Sociology114(5): 1475�1521.
Breen R; Luijkx R; Muller W et al. (2010) Long-term trends in educational inequality inEurope: class inequalities and gender di�erences. European Sociological Review 26(1):31�48.
Burton NW and Ramist L (2001) Predicting Success in College: SAT Studies of ClassesGraduating Since 1980. New York: College Board Research Report No. 2001-2.
Byrne BM (2004) Testing for multigroup invariance using AMOS graphics: a road lesstraveled. Structural Equation Modeling: A Multidisciplinary Journal 11(2): 272�300.
Camara W (1998) High School Grading Policies. Tech. Rep. RN-04, College Board, NewYork.
Camara W and Echternacht G (2000) The SAT I and High School Grades: Utility inPredicting Success in College. New York: The College Board.
Camara W; Kimmel E; Scheuneman J et al. (2003) Whose Grades Are In�ated? Tech.Rep. RN-10, College Board, New York.
Chen F; Curran PJ; Bollen KA et al. (2008) An empirical evaluation of the use of�xed cuto� points in RMSEA test statistic in structural equation models. SociologicalMethods & Research 36(4): 462�494.
136

II. Teachers' Evaluations and the Social Situation in the Classroom
Chen FF; Sousa KH and West SG (2005) Teacher's corner: testing measurement invari-ance of second-order factor models. Structural Equation Modeling: A MultidisciplinaryJournal 12(3): 471�492.
Coleman JS (1990) Foundations of Social Theory. New York: Harvard University Press.
Collet F (2009) Does habitus matter? A comparative review of Bourdieu's habitus andSimon's bounded rationality with some implications for economic sociology. Sociolog-ical Theory 27(4): 419�434.
De Graaf ND and De Graaf PM (2002) Formal and popular dimensions of culturalcapital: e�ects on children's educational attainment. The Netherlands' Journal ofSocial Sciences 38(2): 167�186.
De Graaf ND; De Graaf PM and Kraaykamp G (2000) Parental cultural capital andeducational attainment in the Netherlands: a re�nement of the cultural capital per-spective. Sociology of Education 73(2): 92�111.
De Graaf PM (1986) The impact of �nancial and cultural resources on educationalattainment in the Netherlands. Sociology of Education 59(4): 237�246.
Diamantopoulos A and Winklhofer HM (2001) Index construction with formative indi-cators: an alternative to scale development. Journal of Marketing Research 38(2):269�277.
DiMaggio P (1982) Cultural capital and school success: the impact of status cultureparticipation on the grades of U.S. high school students. American Sociological Review47(2): 189�201.
Ditton H (2007) Der Beitrag von Schule und Lehrern zur Reproduktion von Bildung-sungleichheit. In: Becker R and Lauterbach W (eds.) Bildung als Privileg, 247�275.Wiesbaden: VS Verlag für Sozialwissenschaften.
Downey DB and Pribesh S (2004) When race matters: teachers' evaluations of students'classroom behavior. Sociology of Education 77(4): 267�282.
Dronkers J (1983) Have inequalities in educational opportunity changed in the Nether-lands? A review of empirical evidence. The Netherlands Journal of Sociology 19(2):133�150.
Dronkers J (1993) Educational reform in the Netherlands: did it change the impact ofparental occupation and education? Sociology of Education 66(4): 262�277.
Dumais SA (2002) Cultural capital, gender, and school success: the role of habitus.Sociology of Education 75(1): 44�68.
Dumais SA (2006) Early childhood cultural capital, parental habitus, and teachers'perceptions. Poetics 34(2): 83�107.
137

References
Elster J (1983) Sour Grapes: Studies in the Subversion of Rationality. Cambridge:Cambridge University Press.
Erikson RS (1984) Social class of men, women and families. Sociology 18(4): 500�514.
Erikson RS (2007) Social selection in Stockholm schools: primary and secondary e�ectson the transition to upper secondary education. In: Scherer S; Pollak R; Otte G et al.(eds.) From Origin to Destination: Trends and Mechanisms in Social Strati�cationResearch, 61�81. Frankfurt a.M.: Campus.
Erikson RS; Goldthorpe JH; Jackson M et al. (2005) On class di�erentials in educationalattainment. Proceedings of the National Academy of Sciences of the United States ofAmerica 102(27): 9730�9733.
Erikson RS and Jonsson JO (1996) Introduction: explaining class inequality in educa-tion: the Swedish test case. In: Erikson RS and Jonsson JO (eds.) Can EducationBe Equalized? The Swedish Case in Comparative Perspective, 1�63. Boulder, CO:Westview Press.
Esser H (1993) Soziologie. Allgemeine Grundlagen. Frankfurt / New York: CampusVerlag.
Esser H (1996) Die De�nition der Situation. Kölner Zeitschrift für Soziologie undSozialpsychologie 48(1): 1�34.
Esser H (1999) Soziologie. Spezielle Grundlagen. Bd. 1: Situationslogik und Handeln.Frankfurt / New York: Campus Verlag.
Esser H (2010) Das Modell der Frame-Selektion. Eine allgemeine Theorie der Sozial-wissenschaften. In: Albert G and Sigmund S (eds.) Soziologische Theorie kontrovers(Sonderheft 50 der Kölner Zeitschrift für Soziologie und Sozialpsychologie), 50�62.Wiesbaden: VS Verlag für Sozialwissenschaften.
Esser H and Kroneberg C (2010) Am besten nichts Neues? In: Albert G and Sigmund S(eds.) Soziologische Theorie kontrovers (Sonderheft 50 der Kölner Zeitschrift für Sozi-ologie und Sozialpsychologie), 79�86. Wiesbaden: VS Verlag für Sozialwissenschaften.
Farkas G (2003) Racial disparities and discrimination in education: what do we know,how do we know it, and what do we need to know? The Teachers College Record105(6): 1119�1146.
Farkas G; Grobe RP; Sheehan D et al. (1990) Cultural resources and school success:gender, ethnicity, and poverty groups within an urban school district. AmericanSociological Review 55(1): 127�142.
Ferguson RF (2003) Teachers' perceptions and expectations and the Black-White testscore gap. Urban Education 38(4): 460�507.
138
II. Teachers' Evaluations and the Social Situation in the Classroom
Fox J (2006) Structural equation modeling with the sem package in R. Structural Equa-tion Modeling: A Multidisciplinary Journal 13(3): 465�486.
Ganzeboom HBG and Treiman DJ (1996) Internationally comparable measures of oc-cupational status for the 1988 International Standard Classi�cation of Occupations.Social Science Research 25(3): 201�239.
Glaesser J and Cooper B (2011) Selectivity and �exibility in the German secondaryschool system: a con�gurational analysis of recent data from the German Socio-Economic Panel. European Sociological Review 27(5): 570�585.
Glasman LR and Albarracín D (2006) Forming attitudes that predict future behavior:a meta-analysis of the attitude-behavior relation. Psychological bulletin 132(5): 778�822.
Goldthorpe JH (1996) Class analysis and the reorientation of class theory: the case ofpersisting di�erentials in educational attainment. British Journal of Sociology 47(3):481�505.
Goldthorpe JH (2003) The myth of education-based meritocracy. New Economy 10(4):234�239.
Goldthorpe JH (2007) �Cultural Capital�: Some Critical Observations. Sociologica 1(2):1�23.
Goldthorpe JH and Jackson M (2008) `Education-based meritocracy: the barriers toits realization. In: Lareau A and Conley D (eds.) Social Class: How Does it Work?,93�117. New York: Russell Sage Foundation Publication.
Gröhlich C and Guill K (2009) How stable are reference group e�ects of secondaryschool track recommendations? Journal for Educational Research Online/Journal fürBildungsforschung Online 1(1): 154�171.
Heck RH (2001) Multilevel modeling with SEM. In: Marcoulides GA and SchumackerRE (eds.) New Developments and Techniques in Structural Equation Modeling, 89�127.Hillsdale: Lawrence Erlbaum.
Hedström P (2005) Dissecting The Social. On the Principles of Analytical Sociology.Cambridge: Cambridge University Press.
Hillmert S and Jacob M (2010) Selections and social selectivity on the academic track:a life-course analysis of educational attainment in Germany. Research in Social Strat-i�cation and Mobility 28(1): 59�76.
Hoge RD and Coladarci T (1989) Teacher-based judgments of academic achievement: areview of literature. Review of Educational Research 59(3): 297�313.
139
References
Hu L and Bentler PM (1999) Cuto� criteria for �t indexes in covariance structure anal-ysis: conventional criteria versus new alternatives. Structural Equation Modeling: AMultidisciplinary Journal 6(1): 1�55.
Hughes JN; Gleason KA and Zhang D (2005) Relationship in�uences on teachers' per-ceptions of academic competence in academically at-risk minority and majority �rstgrade students. Journal of School Psychology 43(4): 303�320.
Ingenkamp K (1971) Die Fragwürdigkeit der Zensurengebung. Texte und Untersuchungs-berichte. Weinheim & Basel: Beltz Verlag.
Jaeger MM (2009) Equal access but unequal outcomes: cultural capital and educationalchoice in a meritocratic society. Social Forces 87(4): 1943�1971.
Jöreskog KG (1993) Testing structural equation models. In: Bollen KA and Long JS(eds.) Testing Structural Equation Models, 294�316. London: Sage Publications Ltd.
Jöreskog KG (1994) On the estimation of polychoric correlations and their asymptoticcovariance matrix. Psychometrika 59(3): 381�389.
Jöreskog KG and Sörbom D (1989) LISREL 7. A guide to the program and applications.Chicago, Ill.: SPSS Inc.
Jürges H and Schneider K (2006) Age at school entry and teachers' recommendations forsecondary school track choice in Germany. Paper presented at the 20th annual ESPEconference, 22 - 24 June, 2006, Verona .
Jussim L and Harber KD (2005) Teacher expectations and self-ful�lling prophecies:knowns and unknowns, resolved and unresolved controversies. Personality and SocialPsychology Review 9(2): 131�155.
Kahneman D and Tversky A (1984) Choices, values, and frames. American Psychologist39(4): 341�350.
Kaplan LD and Kaplan C (1997) Democracy, meritocracy, and the cognitive elite: thereal thesis of the bell curve. Educational Theory 47(3): 425�431.
Kelle U and Lüdemann C (1995) Grau, teurer Freund, ist alle Theorie... RationalChoice und das Problem der Brückenannahmen. Kölner Zeitschrift für Soziologieund Sozialpsychologie 47(2): 249�267.
Kim MS and Hunter JE (1993a) Attitude-behavior relations: a meta-analysis of attitu-dinal relevance and topic. Journal of Communication 43(1): 101�142.
Kim MS and Hunter JE (1993b) Relationships among attitudes, behavioral intentions,and behavior. Communication Research 20(3): 331�364.
Kingston PW (2001) The unful�lled promise of cultural capital theory. Sociology ofEducation 74: 88�99.
140
II. Teachers' Evaluations and the Social Situation in the Classroom
Kraus SJ (1995) Attitudes and the prediction of behavior: a meta-analysis of the em-pirical literature. Personality and Social Psychology Bulletin 21(1): 58�75.
Kroneberg C (2005) Die De�nition der Situation und die variable Rationalität der Ak-teure: Ein allgemeines Modell des Handelns. Zeitschrift für Soziologie 34: 344�363.
Kroneberg C (2006) The de�nition of the situation and variable rationality: The modelof frame selection as a general theory of action. Sonderforschungsbereich 504 Publica-tions, University of Mannheim .
Kroneberg C (2011) Die Erklärung sozialen Handelns. Grundlagen und Anwendung einerintegrativen Theorie. Wiesbaden: VS Verlag für Sozialwissenschaften.
Kroneberg C; Heintze I and Mehlkop G (2008) On shoplifting and tax fraud: An action-theoretic analysis of crime. Sonderforschungsbereich 504 Publications, University ofMannheim .
Kroneberg C and Kalter F (2012) Rational Choice Theory and Empirical Research:Methodological and Theoretical Contributions in Europe. Annual Review of Sociology38: 73�92.
Kroneberg C; Yaish M and Stocké V (2010) Norms and rationality in electoral partici-pation and in the rescue of Jews in WWII. Rationality and Society 22(1): 3�36.
Kuncel NR; Hezlett SA and Ones DS (2001) A comprehensive meta-analysis of thepredictive validity of the Graduate Record Examinations: implications for graduatestudent selection and performance. Psychological Bulletin 127(1): 162�181.
Lareau A and Weininger EB (2003) Cultural capital in educational research: a criticalassessment. Theory and Society 32(5): 567�606.
Lörz M and Schindler S (2009) Educational expansion and e�ects on the transition tohigher education: Has the e�ect of social background characteristics declined or justmoved to the next stage? In: Hadjar A and Becker R (eds.) Expected and UnexpectedConsequences of the Educational Expansion in Europe and USA, 97�110. Bern: Haupt.
Lucas SR (2001) E�ectively maintained Iinequality: education transitions, track mobil-ity, and social background e�ects. American Journal of Sociology 106(6): 1642�1690.
Lucas SR (2009) Strati�cation theory, socioeconomic background, and educational at-tainment. Rationality and Society 21(4): 459�511.
MacCallum RC and Browne MW (1993) The use of causal indicators in covariancestructure models: some practical issues. Psychological Bulletin 114(3): 533�541.
Madon S; Jussim L and Eccles J (1997) In search of the powerful self-ful�lling prophecy.Journal of Personality and Social Psychology 72(4): 791�809.
141
References
Mayer KU; Müller W and Pollak R (2007) Germany: Institutional change and inequal-ities of access in higher education. In: Shavit Y; Arum R and Gamoran A (eds.)Strati�cation in Higher Education. A Comparative Study, 240�265. Stanford: Stan-ford University Press.
McClelland K (1990) Cumulative disadvantage among the highly ambitious. Sociologyof Education 63(2): 102�121.
Meulemann H; Birkelbach K and Hellwig O (2001) Ankunft im Erwachsenenleben.Lebenserfolg und Erfolgsdeutung in einer Kohorte ehemaliger Gymnasiasten zwischen16 und 43. Opladen: Leske + Budrich Verlag.
Milek A; Lüdtke O; Trautwein U et al. (2009) Wie konsistent sind Referenzgruppenef-fekte bei der Vergabe von Schulformempfehlungen? Bundeslandspezi�sche Analysenmit Daten der IGLU-Studie. Zeitschrift für Erziehungswissenschaft 12(12): 282�301.
Moede W; Piorkowski C and Wol� G (1919) Die Berliner Begabtenschulen, ihre Organ-isation und die Methoden ihrer Schülerauswahl. Langensalza: Bayer.
Morgan R (1989) Analyses of the Predictive Validity of the SAT and High School GradesFrom 1976 to 1985. New York: College Board Research Report No. 89-7.
Morgan SL (2002) Modeling preparatory commitment and non-repeatable decisions.Rationality and Society 14(4): 387�429.
Morris EW (2005) From �middle class� to �trailer trash:� teachers' perceptions of whitestudents in a predominately minority school. Sociology of Education 78(2): 99�121.
Müller W and Karle W (1993) Social selection in educational systems in Europe. Euro-pean Sociological Review 9(1): 1�23.
Müller W and Pollak R (2007) Weshalb gibt es so wenige Arbeiterkinder an deutschenUniversitäten? In: Becker R and Lauterbach W (eds.) Bildung als Privileg? Erklärun-gen und Befunde zu den Ursachen der Bildungsungleichheit, 303�342. Wiesbaden: VSVerlag für Sozialwissenschaften.
Muthén BO (1984) A general structural equation model with dichotomous, orderedcategorical, and continuous latent variable indicators. Psychometrika 49(1): 115�132.
Muthén BO (1994) Multilevel covariance structure analysis. Sociological Methods &Research 22(3): 376�398.
Olsson UH (1979) Maximum likelihood estimation of the polychoric correlation coe�-cient. Psychometrika 44(4): 443�460.
Page R (1987) Teachers' perceptions of students: a link between classrooms, schoolcultures, and the social order. Anthropology & Education Quarterly 18(2): 77�99.
142
II. Teachers' Evaluations and the Social Situation in the Classroom
Pietsch M and Stubbe TC (2007) Inequality in the transition from primary to secondaryschool: school choices and educational disparities in Germany. European EducationalResearch Journal 6(4): 424�445.
Rabe-Hesketh S; Skrondal A and Pickles A (2004) Generalized multilevel structuralequation modeling. Psychometrika 69(2): 167�190.
Rabe-Hesketh S; Skrondal A and Zheng X (2007) Multilevel structural equation mod-eling. In: Lee SY (ed.) Handbook of Latent Variable and Related models, 209�227.Amsterdam: Elsevier.
Raftery AE and Hout M (1993) Maximally maintained inequality: expansion, reform,and opportunity in Irish education, 1921-75. Sociology of Education 66(1): 41�62.
Raudenbush SW (1984) Magnitude of teacher expectancy e�ects on pupil IQ as a func-tion of the credibility of expectancy induction: a synthesis of �ndings from 18 exper-iments. Journal of Educational Psychology 76(1): 85�97.
Ready DD and Wright DL (2011) Accuracy and inaccuracy in teachers' perceptions ofyoung children's cognitive abilities. American Educational Research Journal 48(2):335�360.
Reay D (2004) 'It's all becoming a habitus': beyond the habitual use of habitus ineducational research. British Journal of Sociology of Education 25(4): 431�444.
Rigdon EE and Ferguson Jr CE (1991) The performance of the polychoric correlationcoe�cient and selected �tting functions in con�rmatory factor analysis with ordinaldata. Journal of Marketing Research 28(4): 491�497.
Rindskopf D and Rose T (1988) Second order factor analysis: some theory and applica-tions. Multivariate Behavioral Research 23(1): 51�67.
Robbins SB; Lauver K; Le H et al. (2004) Do psychosocial and study skill factors predictcollege outcomes? a meta-analysis. Psychological Bulletin 130(2): 261�288.
Rosenthal R and Jacobson L (1968) Pygmalion in the Classroom: Teacher Expectationand Pupils' Intellectual Development. New York: Holt, Rinehart & Winston.
Schneider T (2008) Social inequality in educational participation in the German schoolsystem in a longitudinal perspective: pathways into and out of the most prestigiousschool track. European Sociological Review 24(4): 511�526.
Schubert F and Becker R (2010) Social inequality of reading literacy - a longitudinalanalysis with cross-sectional data of PIRLS 2001 and PISA 2000 utilizing the pair wisematching procedure. Research in Social Strati�cation and Mobility 28(1): 109�133.
Selz M and Vallet LA (2006) La démocratisation de l'enseignement et son paradoxeapparent. Données sociales - La société française édition 20: 101�107.
143
References
Sewell WH; Haller AO and Ohlendorf GW (1970) The educational and early occupationalstatus attainment process: replication and revision. American Sociological Review35(6): 1014�1027.
Sewell WH; Haller AO and Portes A (1969) The educational and early occupationalattainment process. American Sociological Review 34(1): 82�92.
Shavit Y and Blossfeld HP (1993) Persistent Inequality. Changing Educational Attain-ment in Thirteen Countries. San Francisco, Oxford: Westview Press.
Smith AE; Jussim L and Eccles J (1999) Do self-ful�lling prophecies accumulate, dissi-pate, or remain stable over time? Journal of Personality and Social Psychology 77(3):548�565.
Smith ML (1980) Meta-analysis of research in teacher expectation. Evaluation in Edu-cation 4: 53�56.
Solga H (2005) Meritokratie - die moderne Legitimation ungleicher Bildungschancen.In: Berger PA and Kahlert H (eds.) Institutionalisierte Ungleichheiten: Wie das Bil-dungswesen Chancen blockiert, 19�38. Weinheim & München: Juventa.
Sörbom D (1989) Model modi�cation. Psychometrika 54(3): 371�384.
Stocké V (2007) Explaining educational decision and e�ects of families' social classposition: an empirical test of the Breen Goldthorpe model of educational attainment.European Sociological Review 23(4): 505�519.
Tiedemann J and Billmann-Mahecha E (2007) Zum Ein�uss von Migration und Schulk-lassenzugehörigkeit auf die Übergangsempfehlung für die Sekundarstufe I. Zeitschriftfür Erziehungswissenschaft 10(1): 108�120.
Tolsma J; Need A and de Jong U (2010) Explaining participation di�erentials in Dutchhigher education: the impact of subjective success probabilities on level choice and�eld choice. European Sociological Review 26(2): 235�252.
Trapmann S; Hell B; Weigand S et al. (2007) Die Validität von Schulnoten zur Vorhersagedes Studienerfolgs - eine Metaanalyse. Zeitschrift für Pädagogische Psychologie 21(1):11�27.
Trautwein U and Baeriswyl F (2007) Wenn leistungsstarke Klassenkameraden einNachteil sind. Zeitschrift für Pädagogische Psychologie 21(2): 119�133.
Treiman DJ (1977) Occupational Prestige in Comparative Perspective. New York: Aca-demic Press.
van de Werfhorst HG and Hofstede S (2007) Cultural capital or relative risk aversion?Two mechanisms for educational inequality compared. The British Journal of Sociol-ogy 58(3): 391�415.
144
II. Teachers' Evaluations and the Social Situation in the Classroom
Wallace DS; Paulson RM; Lord CG et al. (2005) Which behaviors do attitudes predict?Meta-analyzing the e�ects of social pressure and perceived di�culty. Review of GeneralPsychology 9(3): 214�227.
Weber M (1968) Economy and Society: An Outline of Interpretive Sociology. New York:Bedminster Press.
Yaish M and Katz-Gerro T (2012) Disentangling `cultural capital': the consequencesof cultural and economic resources for taste and participation. European SociologicalReview 28(2): 169�185.
Zhang G and Browne MW (2006) Bootstrap �t testing, con�dence intervals, and stan-dard error estimation in the factor analysis of polychoric correlation matrices. Behav-iormetrika 33(1): 61�74.
Ziegenspeck JW and Lehmann J (1999) Handbuch Zensur und Zeugnis in der Schule.Bad Heilbrunn: Klinkhart.
145
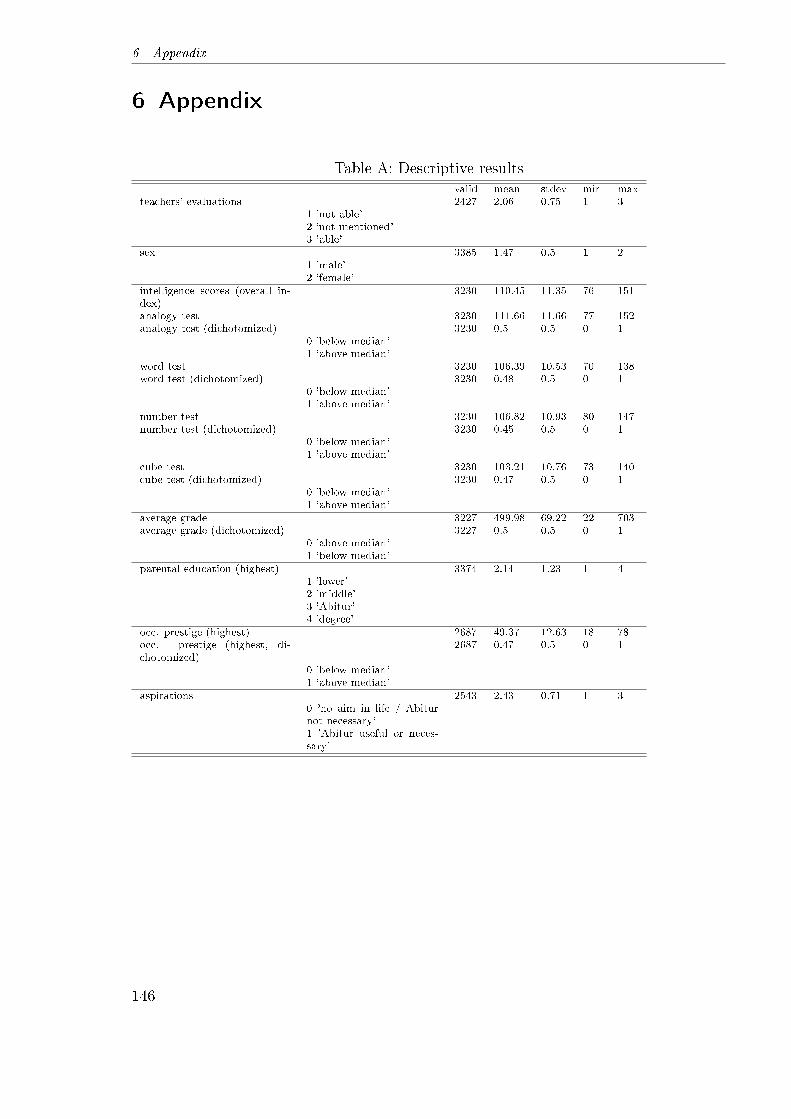
6 Appendix
6 Appendix
Table A: Descriptive resultsvalid mean stdev min max
teachers' evaluations 2427 2.06 0.75 1 31 'not able'2 'not mentioned'3 'able'
sex 3385 1.47 0.5 1 21 'male'2 'female'
intelligence scores (overall in-dex)
3230 110.45 11.35 76 151
analogy test 3230 111.66 11.66 77 152analogy test (dichotomized) 3230 0.5 0.5 0 1
0 'below median'1 'above median'
word test 3230 106.39 10.53 70 138word test (dichotomized) 3230 0.48 0.5 0 1
0 'below median'1 'above median'
number test 3230 106.82 10.93 80 147number test (dichotomized) 3230 0.45 0.5 0 1
0 'below median'1 'above median'
cube test 3230 103.21 10.76 73 140cube test (dichotomized) 3230 0.47 0.5 0 1
0 'below median'1 'above median'
average grade 3227 499.98 69.22 221 703average grade (dichotomized) 3227 0.5 0.5 0 1
0 'above median'1 'below median'
parental education (highest) 3374 2.14 1.23 1 41 'lower'2 'middle'3 'Abitur'4 'degree'
occ. prestige (highest) 2687 49.37 12.63 18 78occ. prestige (highest, di-chotomized)
2687 0.47 0.5 0 1
0 'below median'1 'above median'
aspirations 2543 2.43 0.71 1 30 'no aim in life / Abiturnot necessary'1 'Abitur useful or neces-sary'
146

II. Teachers' Evaluations and the Social Situation in the Classroom
Table B: Logistic regression: Able vs. not ablePerformance Model 1 Performance Model 2 SES Model Aspiration Modeleb/z eb/z eb/z eb/z
constant 1.06 0.57* 0.30*** 0.19***(0.29) (-2.41) (-4.08) (-5.18)
sex 0.77* 0.53*** 0.54*** 0.58***(-2.21) (-4.51) (-3.79) (-3.31)
intelligence 3.04*** 2.33*** 2.84*** 2.79***(9.52) (6.13) (6.60) (6.43)
average grade 12.35*** 13.20*** 12.93***(17.75) (15.82) (15.55)
parental education 1.19* 1.16(2.29) (1.93)
parental occ. prestige 1.56* 1.59*(2.44) (2.52)
aspirations 1.90***(3.78)
Nagelkerke's R2 0.10 0.42 0.46 0.47N 1314 1309 1067 1063
All coe�cients are odds ratios. Z-values in parentheses. Signi�cance values: * (p < .05); ** (p <.01); *** (p < .001).
Table C: Logistic regression: Able vs. not mentionedPerformance Model 1 Performance Model 2 SES Model Aspiration Modeleb/z eb/z eb/z eb/z
constant 0.58*** 0.28*** 0.15*** 0.12***(-3.30) (-6.83) (-8.15) (-8.20)
sex 0.95 0.84 1.00 1.02(-0.56) (-1.60) (-0.02) (0.16)
intelligence 1.77*** 1.56*** 1.79*** 1.76***(5.71) (4.17) (4.93) (4.73)
average grade 4.56*** 4.72*** 4.63***(13.41) (12.27) (12.10)
parental education 1.15* 1.13*(2.41) (2.19)
parental occ. prestige 1.07 1.08(0.46) (0.54)
aspirations 1.27(1.79)
Nagelkerke's R2 0.03 0.17 0.19 0.19N 1720 1716 1412 1406
All coe�cients are odds ratios. Z-values in parentheses. Signi�cance values: * (p < .05); ** (p <.01); *** (p < .001).
147
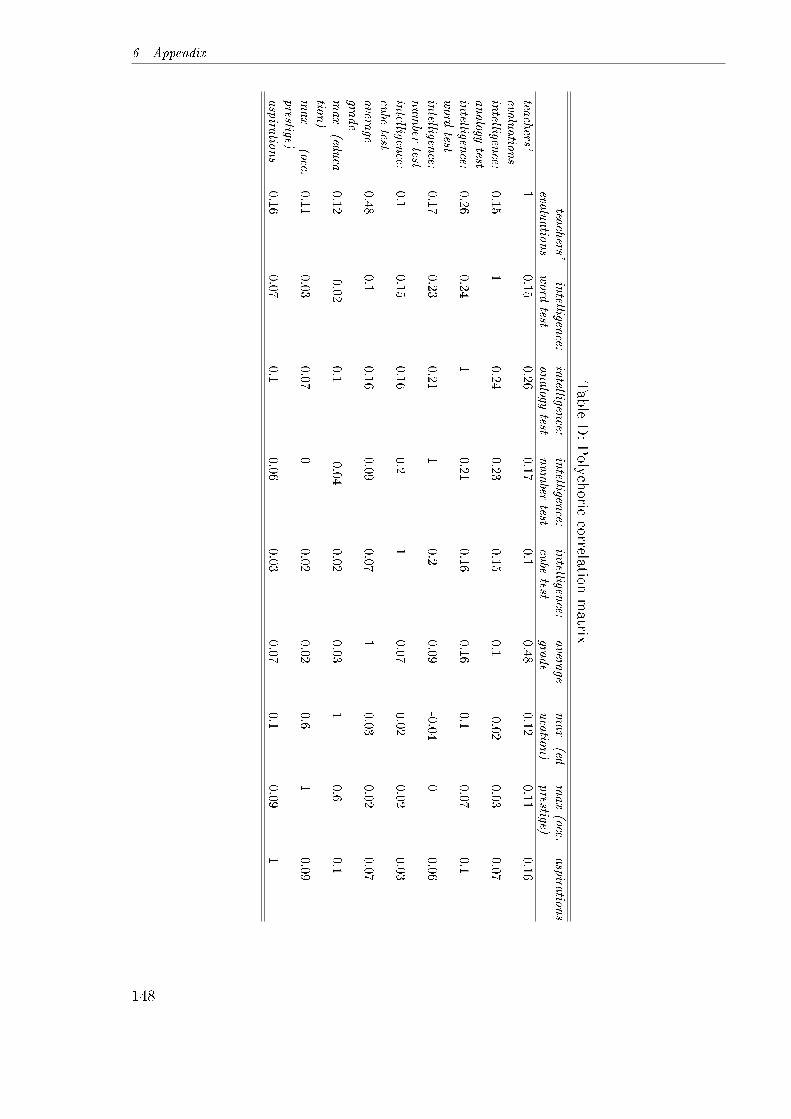
6 Appendix
Table
D:Polychoric
correlationmatrix
teachers'
evaluatio
ns
intelligen
ce:word
testintelligen
ce:analogy
testintelligen
ce:number
testintelligen
ce:cube
testavera
gegra
de
max
(ed-
ucatio
n)
max(occ.
prestige)
aspira
tions
teachers'
evaluatio
ns
10.15
0.26
0.17
0.1
0.48
0.12
0.11
0.16
intelligen
ce:analogy
test0.15
10.24
0.23
0.15
0.1
-0.02
0.03
0.07
intelligen
ce:word
test0.26
0.24
10.21
0.16
0.16
0.10.07
0.1
intelligen
ce:number
test0.17
0.23
0.21
10.2
0.09
-0.04
00.06
intelligen
ce:cube
test0.1
0.15
0.16
0.2
10.07
0.02
0.02
0.03
avera
gegra
de
0.48
0.1
0.16
0.09
0.07
10.03
0.02
0.07
max
(educa-
tion)
0.12
-0.02
0.1
-0.04
0.02
0.03
10.6
0.1
max
(occ.prestige)
0.11
0.03
0.07
00.02
0.02
0.61
0.09
aspira
tions
0.16
0.07
0.1
0.06
0.03
0.07
0.1
0.09
1
148
III. Intelligence and Academic
Achievement as Contextual-Level
Predictors of Teachers' Evaluations:Big Fish Little Pond or Re�ected Glory E�ect?
(with Klaus Birkelbach)
The Big Fish Little Pond e�ect (BFLPE) suggests that regardless of their in-dividual ability, students show lower self-con�dence in classes with a high averageability � which in turn causes a signi�cant decrease in individuals' school perfor-mance. Conversely, the Re�ected Glory e�ect (RGE) hypothesis postulates thatupward comparisons lead to a more critical self-evaluation, an enhancement ofmotivation and thus to an increase in school performance. Our theoretical contri-bution is that we �rst test whether comparable reference-group e�ects on teachers'evaluations vary by both student-level achievement and teachers' frames of refer-ence in terms of their grading concepts. Our methodological contribution is that weuse a cross-classi�ed design where, �rst, teachers' evaluations are the lowest unitof analysis which is nested in both student- and teacher-level contexts. We thenintroduce class-level indicators as an additional higher-level unit. Results based onthe initial survey of the Cologne High School Panel (1969/70) indicate that i) bothclass-level socioeconomic status and achievement increase students' probability ofobtaining a positive evaluation; ii) this positive e�ect signi�cantly interacts withstudent-level achievement; iii) but not with teachers' grading concepts.
1 Introduction
Although there is a non-negligible controversy in educational psychology whether 'gradepoint average' (GPA) or 'intelligence' has a higher predictive validity for students' latereducational course of life, the fact that both theoretical concepts are signi�cant is essen-tially undisputed (Burton and Ramist, 2001; Camara, 1998; Camara and Echternacht,2000; Camara et al., 2003; Kuncel et al., 2001; Morgan, 1989; Robbins et al., 2004).However, teachers also ground the evaluations of their students on factors other thanstudents' actual achievement1 � and they may even communicate this to the students
1In this paper, the term 'achievement' covers both students' intelligence and their GPA, which we willintroduce as two di�erent achievement indicators in the operationalization section.
149

1 Introduction
and their parents. In this study, we aim to shed light on how the emergence of a speci�ckind of evaluation � i.e. teachers' assessment whom of their 10th class students theybelieve to be able for academic studies, and whom of them not � might be a�ected byreference-group e�ects and their cross-level interactions with both student- and teacher-level variables.Although the evaluations that have been surveyed in our data, the Cologne H igh
School Panel (CHiSP), were never explicitly communicated either to the students ortheir parents, several studies suggest that even rather implicit teacher assessments maybe insinuated in day-to-day school life and thus could a�ect students' self-concept as well(Brophy and Good, 1974; Brattesani et al., 1984; Good and Brophy, 2003). Therefore,in the long run, even unjusti�ed evaluations by teachers may prove themselves to betrue in terms of a self-ful�lling prophecy (Merton, 1948; Rosenthal and Jacobson, 1968;Jussim and Harber, 2005; Becker, 2010; Birkelbach, 2011).While the analysis of student-level predictors of teachers' evaluations has been of
interest in educational sociology at least since Alexander et al. (1987), applying theframework of reference-group e�ects on teachers' evaluations started with Tiedemannand Billmann-Mahecha (2007) and Trautwein and Baeriswyl (2007). In line with theseresearch traditions, the crucial questions in our study are i) to what extent do teachers'evaluations in our data actually depend on reference-group e�ects apart from student-level predictors, and ii) how strongly do potential sizes of suchlike e�ects vary with bothstudent- and teacher-level variables.Research analyzing the impact of class- or school-level predictors on students' self-
concept and/or achievement usually trades under the name of Big-Fish-Little-Pond ef-fects (BFLPE ; in case of a negative contrast process) or Re�ected Glory e�ect (RGE ; incase of a positive assimilation process) studies. While the initial study of Davis (1966),�The Campus as a Frog Pond�2, and several sociological follow-ups (Meyer, 1970; Alexan-der and Eckland, 1975) analyzed contextual-level e�ects on educational outcomes such ashigh school attainment or college aspirations, beginning with Marsh and Parker (1984),students' self-concept became the main dependent variable.In spite of Marsh's (1991) intention to broaden this interimly narrowed focus again by
applying the logic of reference-group e�ects to an extended range of outcome variables3,there were only few attempts to replicate Marsh's (1991) framework. Thus, more recentstudies (Plucker et al., 2004; Rindermann and Heller, 2005) still criticize the focus ofmost BFLPE studies on students' self-concept as being too narrow.A second disregard in BFLPE -alike studies is that although already Davis (1966)
stressed the need for an analysis of the underlying educational climates that may con-tribute to observable di�erences between schools (or classes; also see Marsh, 1991; Marshand O'Mara, 2010), only Lüdtke et al. (2005) included an indicator for teachers' frames
2While Davis (1966) called the observed reference-group e�ect 'Frog Pond' e�ect, we will refer to it asthe 'Big-Fish-Little-Pond e�ect' � which is the established term nowadays (Marsh, 1987; Trautweinand Lüdtke, 2005; Dai and Rinn, 2008; Marsh et al., 2008).
3These outcomes included students' academic and general self-concept, course-work selection, academice�ort, educational and occupational aspirations, school grades, standardized test scores, collegeattendance, and students' aspirations two years after high school.
150
III. Intelligence and Academic Achievement as Contextual-Level Predictors of Teachers' Evaluations
of reference (TFR).Recently, several Swiss and German studies tested how reference-group e�ects in�u-
ence the emergence of primary school teachers' transition recommendations (Tiedemannand Billmann-Mahecha, 2007; Trautwein and Baeriswyl, 2007; Gröhlich and Guill, 2009;Milek et al., 2009). However, none of these analyses tested for potential moderatinge�ects of TFRs (which is even more surprising than in the case of the classical BFLPEstudies in the tradition of Marsh and Parker, 1984). Furthermore, in contrast to existingBFLPE research with students' self-concept as an outcome (Marsh et al., 1995; Marshand Rowe, 1996; Marsh et al., 2001; Marsh and Hau, 2003), the above-mentioned studieslack consideration of cross-level interaction terms testing whether class-level achievementgeneralizes across student ability levels.Hence, our theoretical contribution is that we extend existing research i) by shedding
light on potential reference-group e�ects concerning the emergence of teachers' 10th
class evaluations of their students' expected success at university; and ii) by includingmeasures for TFRs and their interaction with our class-level achievement predictors aswell as iii) cross-level achievement interaction terms.Our methodological contribution is that we test this model by means of a more complex
multilevel framework where teachers' evaluations are nested in both student and teachercontexts, which are in turn nested in school classes.In the following sections, we �rst discuss the main �ndings from BFLPE research,
and related evidence about reference-group e�ects concerning primary school teachers'transition recommendations whereupon we ground our hypotheses regarding 10th classteachers' evaluations.4 In this context, we especially emphasize the hypothesized coun-terbalancing e�ect of BFLPE and RGE which are supposed to operate simultaneously(Marsh et al., 2000)5, and we deduce hypotheses about both student-level and teacher-level moderators of class-average achievement e�ects on teachers' evaluations. In a shortparagraph, we provide a brief review of potential student-level predictors of teachers'transition recommendations which we aim to include in terms of covariates. Next, wepresent our empirical models that result in cross-classi�ed multilevel analyses with threedi�erent predictor levels. After the discussion of our �ndings, we conclude with a briefsummary and several recommendations for future analyses.
2 Theory and Hypotheses
In the US context, the analysis of teachers' evaluations has mainly focused on culturaldi�erences due to racial matching or mismatching between students and their teachers(Alexander et al., 1987; Farkas et al., 1990; Downey and Pribesh, 2004). In Germany,there is a great deal of literature on the formation of primary-school teachers' transition
4Given that these kind of partly binding evaluations at the end of primary school are most prominent inSwitzerland, the Netherlands, and Germany, we will primarily refer to �ndings from these countries.
5Our sample consists of German highest-track students only, and in the original BFLPE frameworkwith students' self-concept as an outcome, the latter was found to be positively a�ected by attendanceof higher-status schools.
151
2 Theory and Hypotheses
recommendations to their students (see e.g. Arnold et al., 2007; Baumert et al., 2007; Bosand Pietsch, 2004; Ingenkamp, 1977, 1993; Lehmann et al., 1997; Jürges and Schneider,2006; Pietsch and Stubbe, 2007). These recommendations describe the appropriatesecondary school track choice for each student at the end of primary school. Drawingon �ndings from BFLPE research, more recently, reference-group e�ects on primary-school teachers' transition recommendations have also been analyzed (Trautwein andBaeriswyl, 2007; Tiedemann and Billmann-Mahecha, 2007; Gröhlich and Guill, 2009;Milek et al., 2009). Before we will use results from these studies to deduce reference-group hypotheses regarding 10th class teachers' evaluations in our data, a more extensivediscussion of BFLPE research in general appears to be reasonable.
2.1 Class-Level Predictors
The well-known study by Davis (1966) is usually referred to as being the �rst anal-ysis which revealed that students' educational outcomes may be in�uenced not onlyby individual-level predictors but by school-level variables as well.6 Applying the the-ory of relative deprivation by Samuel A. Stou�er, Davis (1966) found evidence for hishypothesis that there is a negative relationship between school quality � measured byschool-average test scores � and both students' grade point average and their collegeaspirations once students' individual-level ability is controlled for. Shortly after, Meyer(1970) provided a joint analysis of both the positive e�ect of school-level socioeconomicstatus (SES) and the negative e�ect of school-level ability on students' college inten-tions � whereas Alexander and Eckland (1975) observed that school-level e�ects on bothmid- and long-term educational outcomes are particularly mediated by direct e�ects onstudents' educational performance (also see Alwin and Otto, 1977).Given these more sociological analyses, starting with Marsh and Parker (1984), how-
ever, primarily scholars in the �eld of social psychology became interested in the e�ectof school-level predictors � which might explain why students' self-concept emergedto be the crucial outcome in reference-group e�ect research. While negative school-average ability e�ects on students' self-concept were labeled as Big-Fish-Little-Ponde�ects (BFLPE), positive e�ects of school-average social status are denoted as Re�ected-Glory e�ects (RGE).In the following, we will discuss the main �ndings from empirical tests of both (compet-
ing and/or counterbalancing) hypotheses, and how these may be related to our outcome,teachers' evaluations of students' prospective university success.
2.1.1 Big-Fish-Little-Pond (Or Contrast) Hypothesis
The crucial idea of BFLPE is that students may still di�er in their academic self-concepteven when controlling for their own cognitive abilities due to varying average class-levelachievement: A student with given cognitive ability in a low-level learning environmentmay consider herself to be kind of a big �sh, i.e. comparably well-positioned, while in
6However, Meyer (1970) provides a review of even earlier studies.
152

III. Intelligence and Academic Achievement as Contextual-Level Predictors of Teachers' Evaluations
a high-level learning environment, she might be equipped with a more negative self-concept. This leads to the paradoxical implication that talented students may develop alower self-concept when sent to gifted schools, which might in turn have a negative impacton their school achievement due to the reciprocal relationship between self-concept andacademic performance (Marsh et al., 2005; Marsh and Craven, 2006).This basic idea is empirically well-founded (e.g. Marsh and Parker, 1984; Marsh, 1987;
McFarland and Buehler, 1995; Zeidner and Schleyer, 1998; Lüdtke et al., 2005; Rinder-mann and Heller, 2005; Trautwein et al., 2006; Seaton et al., 2010; Thijs et al., 2010)7,long-lasting (Marsh et al., 2000, 2001, 2007; Marsh and O'Mara, 2010), and generalizablei) across countries (Marsh and Hau, 2003; Seaton et al., 2009), ii) across students' abilitylevels (Marsh et al., 1995; Marsh and Rowe, 1996; Marsh et al., 2001; Marsh and Hau,2003), and iii) also to other outcomes apart from self-concept both in education (Marsh,1991; Marsh and O'Mara, 2010) and beyond (e.g. Chanal et al., 2005; Trautwein et al.,2008).It is often argued that teachers are in�uenced by reference-group e�ects as well
(Reuman, 1989; Pallas et al., 1994; Lüdtke et al., 2005). Consequently, regarding thegeneralizability of BFLPE in educational settings, several studies found that students'school grades are indeed a�ected in this manner (Alwin and Otto, 1977; Marsh, 1991;Trautwein et al., 2006). Several more recent German and Swiss studies applied the ideaof reference-group e�ects on primary school teachers' transition recommendations re-garding students' secondary school choice. Trautwein and Baeriswyl (2007) observed anegative e�ect of school-class ability on teachers' transition recommendations even whencontrolling for class-level SES (which itself did not reach statistical signi�cance) based ona sample of N = 7416th grade students in the Swiss canton Fribourg. However, this e�ectwas mediated by teachers' evaluations of both students' academic performance and somemotivation-related covariates. Drawing on the Hanover Elementary School Study 2000(N = 620 students), Tiedemann and Billmann-Mahecha (2007) also found that teachers'transition recommendations were negatively a�ected by class-mean spelling achievementand class-mean cognitive abilities. In their analysis of the German KESS (Kompetenzenund E instellungen von Schülerinnen und Schülern) data (N = 11.356), Gröhlich andGuill (2009) only observed negative e�ects of students' 4th grade class-mean math abil-ity, but not of class-mean reading ability on teachers' transition recommendations at theend of primary school. However, the former e�ect was completely mediated by students'individual academic performance. And �nally, exactly the same pattern � a signi�cantnegative e�ect of class-level ability that was mediated by students' school grades � wascorroborated by Milek et al. (2009) in their analysis of the German PIRLS-E sub-sample.Hence, aside from potential mediators, we assume that a similar reference group e�ectmight a�ect teachers' evaluations of their students' future academic aptitude, movingteachers to lower their standards in classes with a lower average achievement:
H1: In low-achievement classes, students have a higher probability of obtaining a better
7For further research overviews and related discussions see Trautwein and Lüdtke (2005); Dai andRinn (2008); Dijkstra et al. (2008) and Marsh et al. (2008).
153
2 Theory and Hypotheses
evaluation by their teachers than in high-achievement classes (and vice versa).
2.1.2 Re�ected-Glory (Or Assimilation) Hypothesis
Despite strong empirical support for the BFLPE (see references above), already Marsh(1987) highlighted that the negative e�ect of school- or class-level achievement on stu-dents' academic self-concept is actually a net e�ect of both counterbalancing (negative)BFLPE and a (positive) Re�ected Glory e�ect (RGE) at the same time. While theformer usually assumes a mechanism of deprivation (Davis, 1966) or a contrast e�ect(Marsh and Parker, 1984, and ensuing studies), RGE expects a mechanism of assimila-tion.In the eponymous study by Cialdini et al. (1976), the authors demonstrated that
students were more likely to identify with their university's football team when thelatter was playing successfully. Similarly, it is not unlikely that attending high abilityand/or high status classes or schools could also positively a�ect students' self-concept.This is why Marsh (1987) argued that the observed negative BFLPE is in fact an e�ectnet of RGE.While the early sociological studies already found positive e�ects of a school's status
on students' educational aspirations (Meyer, 1970; Alexander and Eckland, 1975; Alwinand Otto, 1977), and although Marsh and Parker (1984) and Marsh (1987) controlled forschool-level SES8, later BFLPE studies usually disregarded this important contextual-level predictor until it was reintroduced by Marsh et al. (2000). The latter authors wereable to juxtapose BFLPE and RGE by demonstrating that while the e�ect of schoolstatus itself was positive, the e�ect of school-average achievement on students' academicself-concept turned out to be more negative when school status was controlled for.9
Regarding teachers' recommendations as an outcome, only two of the above-cited stud-ies explicitly considered contextual-level SES: First, Tiedemann and Billmann-Mahecha(2007) found that class-level parental educational background � suboptimally measuredby teachers' estimates of parental educational aspirations � a�ect primary school teach-ers' transition recommendations only at the .10 signi�cance level. However, no expla-nation about the particular mechanism (which can be assumed to di�er from the oneimplied in conventional BFLPE studies with students' self-concept as an outcome) wasspeci�ed. Second, Gröhlich and Guill (2009) observed that class-level SES only positivelya�ected teachers' transition recommendations in a signi�cant way when class-average
8Note that the results of Marsh and Parker (1984) and Marsh (1987) are not really consistent with theabove-cited sociological studies and later �ndings by Marsh et al. (2000), though. Marsh and Parker(1984) observed a negative e�ect of school-level SES on students' self-concept; and also Marsh (1987)reported a (weak) negative e�ect in their path models. However, the raw bivariate correlation notedin Marsh (1987) was positive. Other notable inconsistencies relate to modeling school classes vs.entire schools as the unit of analysis, and to the usage of objective (Marsh and Parker, 1984) vs.subjective (Marsh et al., 2000; Trautwein et al., 2009) contextual status measures.
9Other attempts of juxtaposing BFLPE and RGE referred to potentially intervening learning envi-ronments (McFarland and Buehler, 1995; Marsh et al., 2001) which will be discussed in the contextof potential teacher-level moderators.
154
III. Intelligence and Academic Achievement as Contextual-Level Predictors of Teachers' Evaluations
ability was controlled for. The fact that the e�ect of class-level SES was signi�cant eventhough it considerably correlated with class-level student achievement was interpretedas a hint that parents particularly strive for higher track transition recommendations inhigh-SES classes � which they do in such a way that even low-SES students bene�t fromit (Gröhlich and Guill, 2009, p. 167).With regard to the kind of evaluations in our data that were neither made public nor
were binding for the students, neither a mechanism of true 're�ected glory' nor the oneindicated by Gröhlich and Guill (2009) appears to be plausible. Instead, we suppose thatin our case, the mechanism behind the RGE hypothesis could be described more preciselyas a particular form of a halo e�ect (Thorndike, 1920): In high-SES classes, teachersmight project higher parental educational aspirations � independently of whether theyare true or just implied by the teachers � on the students from lower strata as well,which induces them to assigning more positive evaluations on average. The oppositerelationship should also hold: In low-SES classes, teachers' evaluations might likewisebe downwardly biased with regard to higher-SES students as well. Therefore, for ourmeasure of teachers' evaluations we hypothesize:
H2: In high-SES classes, students have a higher probability of obtaining a better eval-uation by their teachers than in low-SES classes (and vice versa).
Although conventional BFLPE research explaining students' academic self-concept asan outcome always found negative average achievement e�ects even when controllingfor contextual-level SES � thus regarding the relation between BFLPE and RGE ascounterbalancing �, we have good reason to assume that in our case, even a competingRGE hypothesis could be warranted:Similar to the mechanism of a Halo e�ect regarding the hypothesized positive class-
level SES e�ect as outlined above, teachers in high-achievement classes may have a morepositive attitude towards the whole class which they project onto the weaker studentsas well. We particularly assume that since our sample consists of highest-track (i.e.Gymnasium) students only, teachers could be upwardly biased a priori � which is whythe gross e�ect of academic achievement on teachers' evaluations could also be positive:
H3: In high-achievement classes, students have a higher probability of obtaining abetter evaluation by their teachers than in low-achievement classes (vice versa).
2.2 Interaction E�ects
While the preceding hypotheses regarded teachers' evaluations as an outcome, we addi-tionally test for cross-level interaction e�ects (Hox, 2010, pp. 31-36, 63-69; also calledslopes-as-outcome approach; see Bryk and Raudenbush, 1992, p. 21), i.e. whether thee�ect of class-average achievement on teachers' evaluations varies by levels of variableson a di�erent unit of analysis. To be precise, we will look at this potential variance byboth student and teacher level predictors.
155
2 Theory and Hypotheses
Student-level moderator As a �rst theoretical advancement to the existing literatureon teachers' evaluations, we postulate that the e�ect of class-mean achievement on teach-ers' evaluations varies by students' individual ability. Regarding the classical BFLPE,most studies found that the e�ect of class mean achievement was generalizable acrossdi�erent student ability levels. For instance, Marsh et al. (1995) were not able to detecta signi�cant interaction e�ect, while Marsh and Rowe (1996) did �nd a signi�cant, butrather small interaction e�ect. In contrast, Marsh et al. (2001) and Marsh and Hau(2003) found no signi�cant interaction term.However, none of the above-cited reference-group e�ect studies of teachers' recommen-
dations tested for cross-level interactions. Just as Coleman and Fults (1985) report thatstudents in the upper level of a class' ability distribution are less a�ected by BFLPE,we assume that the higher a student's achievement, the less pronounced reference-groupe�ects on teachers' evaluations will be: High achievers might be more visible in theclassroom than low achievers � which is why students' individual achievement will be amore important criterion for teachers in the case of high achievers than in the case oflow achievers.10
An alternative interpretation (or underlying mechanism) of this negative interactione�ect would be that the impact of student-level achievement on teachers' evaluations isweaker in high-achievement classes, since each student would have to be equipped witha comparatively higher aptitude to stand out from her classmates, or a teacher might(unconsciously) refer to alternative criteria (e.g. parental backgrounds) to a greaterextent when evaluating her students. We choose to adhere to the convenient frameworkof a moderation of class-level predictor e�ects by student-level covariates. Therefore,our hypothesis nonetheless reads:
H4: The e�ect of class-level achievement on teachers' evaluations decreases with stu-dents' individual achievement.
Teacher-level moderator Apart from the above-mentioned studies on student achieve-ment, there is little evidence regarding moderators of reference-group e�ects.11 Thus, inthe study at hand, we �rst test for the variance of reference-group e�ects on teachers'evaluations by teachers' grading concepts.Drawing on Rheinberg (1980) and his distinction between more social and more in-
dividualist reference standards of teachers, Lüdtke et al. (2005) interacted indicators ofthose two concepts with the e�ect of class-average math achievement on students' mathself-concept.12 Although none of these interaction terms were statistically signi�cant,
10The Halo e�ect was observed to vary with the ratee's relative visibility (see Kozlowski and Kirsch,1987).
11Dai and Rinn (2008) make the point that previous research has lacked a �speci�cation of contextswhere the BFLPE is more or less likely to occur� (p. 297). A recent exception is the study by Thijset al. (2010) that found students' perceived relative class position and both a school's class size andgender composition to moderate the BFLPE.
12Concerning self-concept as an outcome, McFarland and Buehler (1995) observed that the BFLPE
is stronger for students with a more individualist cultural heritage than for those with a more
156
III. Intelligence and Academic Achievement as Contextual-Level Predictors of Teachers' Evaluations
there are good reasons to assume that the underlying mechanism is actually more likelyto a�ect the impact of reference-group e�ects on teachers' evaluations rather than onstudents' self-concept: Teachers with a more individualist reference standard might beless prone to upward or downward movements of their evaluations depending on class-level achievement than teachers who reported a more relational reference standard. Thisis why we hypothesize:
H5: The relationship between class-level achievement and teachers' evaluations (BFLPE/RGE) varies with teachers` reported grade concepts (relational vs. individualist).
2.3 Student-Level Covariates
We include indicators for students' achievement, their social backgrounds, and their as-pirations as student-level covariates. Regarding individual achievement, in the US, stan-dardized tests such as ACT or SAT are a broadly used � albeit critically debated � toolin order to select college students after high school (Burton and Ramist, 2001; Kuncelet al., 2001; Morgan, 1989; Robbins et al., 2004). In spite of the fact that German peda-gogic researchers also acknowledge students' intelligence to be the most important singlepredictor for their educational success (e.g. Ingenkamp, 1993, p. 73), in the German ed-ucational system, there are still no serious attempts to ground students' educationaltracking on test results. Although more recent studies such as Progress in InternationalReading Literacy Study (PIRLS) 2001 and 2006 (Bos et al., 2004; Arnold et al., 2007) aswell as the German studies LAU: Aspekte der Lernausgangslage und der Lernentwicklung(Lehmann et al., 1997) and KESS 4: Kompetenzen und Einstellungen von Schülerinnenund Schülern � Jahrgangsstufe 4 (Bos and Pietsch, 2004) showed that teachers' transi-tion recommendations and students' test results only partly overlap, a virtually linearpositive relationship between students' language comprehension, their reading abilities,their ability to extract information, and their math scores as independent variables, andteachers' recommendations as the outcome nonetheless holds (Lehmann et al., 1997).This is what we would also expect concerning teachers' evaluations.Being a more visible achievement criterion to teachers (see e.g. Alexander et al., 1987,
p. 667), students' grades have a higher predictive power in explaining teachers' tran-sition recommendations than students' intelligence (Ingenkamp, 1993; Kristen, 2006).In PIRLS 2006, about 69% of the total variance in teachers' recommendations can beexplained by both students' language and math grades (while the e�ect of grades in lan-guage was a bit more pronounced than in math; see Arnold et al., 2007, p. 283). Sinceschool grades, though distorted by well-known de�ciencies, are empirically well-triedpredictors of teachers' recommendations, we consider them to be a relevant predictor ofteachers' evaluations as well.
collectivist one. Similarly, Marsh et al. (2001) found that BFLPE was more negative for WestGerman students than for East German students shortly after the reuni�cation. This result couldbe replicated by Seaton et al. (2009) based on the PISA data with 41 countries showing that BFLPEsigni�cantly interacts with countries' degree of individualism.
157
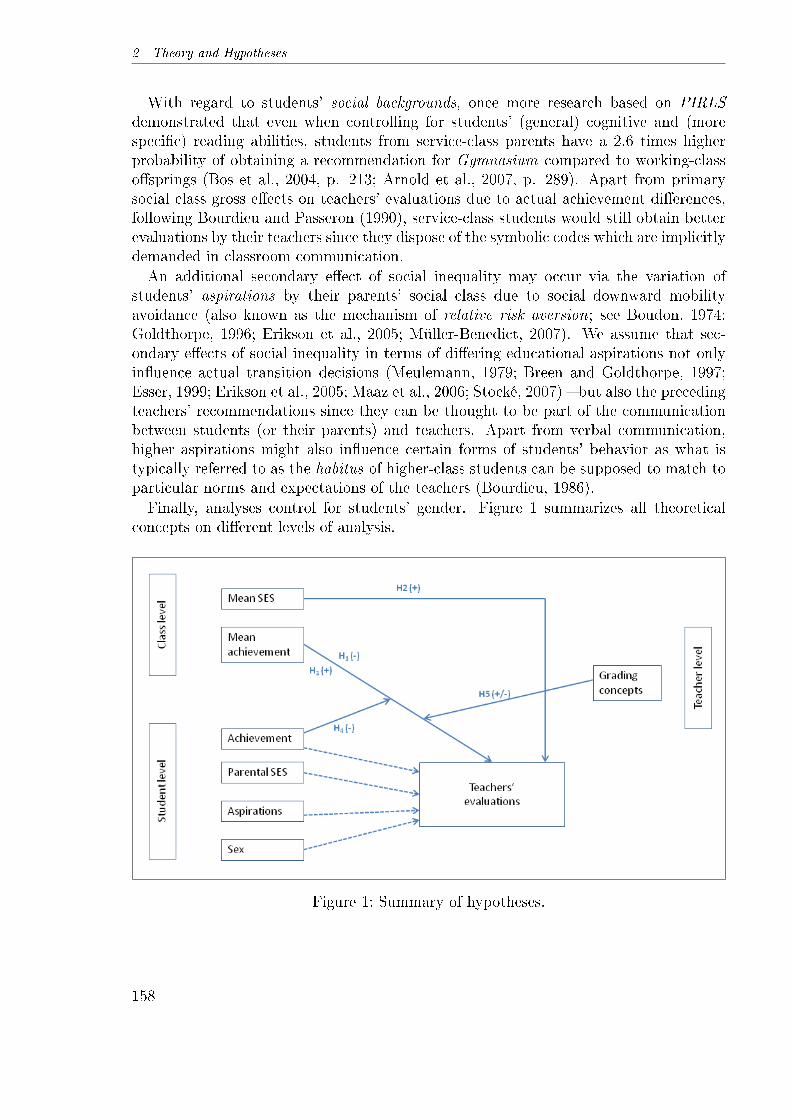
2 Theory and Hypotheses
With regard to students' social backgrounds, once more research based on PIRLSdemonstrated that even when controlling for students' (general) cognitive and (morespeci�c) reading abilities, students from service-class parents have a 2.6 times higherprobability of obtaining a recommendation for Gymnasium compared to working-classo�springs (Bos et al., 2004, p. 213; Arnold et al., 2007, p. 289). Apart from primarysocial class gross e�ects on teachers' evaluations due to actual achievement di�erences,following Bourdieu and Passeron (1990), service-class students would still obtain betterevaluations by their teachers since they dispose of the symbolic codes which are implicitlydemanded in classroom communication.An additional secondary e�ect of social inequality may occur via the variation of
students' aspirations by their parents' social class due to social downward mobilityavoidance (also known as the mechanism of relative risk aversion; see Boudon, 1974;Goldthorpe, 1996; Erikson et al., 2005; Müller-Benedict, 2007). We assume that sec-ondary e�ects of social inequality in terms of di�ering educational aspirations not onlyin�uence actual transition decisions (Meulemann, 1979; Breen and Goldthorpe, 1997;Esser, 1999; Erikson et al., 2005; Maaz et al., 2006; Stocké, 2007) � but also the precedingteachers' recommendations since they can be thought to be part of the communicationbetween students (or their parents) and teachers. Apart from verbal communication,higher aspirations might also in�uence certain forms of students' behavior as what istypically referred to as the habitus of higher-class students can be supposed to match toparticular norms and expectations of the teachers (Bourdieu, 1986).Finally, analyses control for students' gender. Figure 1 summarizes all theoretical
concepts on di�erent levels of analysis.
Figure 1: Summary of hypotheses.
158
III. Intelligence and Academic Achievement as Contextual-Level Predictors of Teachers' Evaluations
3 Data & Methods
3.1 Data
For our analysis, we use the initial survey of the Cologne High School Panel (CHiSP)from 1969/1970. Funded by the Federal State of North-Rhine Westphalia, the ResearchInstitute of Sociology at the University of Cologne surveyed N = 3.38510th class students(nested in N = 120 school classes) at the highest German school track � Gymnasium � inNorth-Rhine Westphalia. Part of the student questionnaire (Gesis-No. ZA600) coveredissues such as students' interest in school (and in certain subjects), their achievement,their future educational and occupational plans, their social backgrounds and their at-titudes towards school. Remarkably, students also took part in an intelligence structuretest (IST; Amthauer, 1957). In addition to the student questionnaires, students' parents(Gesis-No. ZA639; N = 2646) and their teachers (Gesis-No. ZA640; N = 1701) weresurveyed as well.13
3.2 Variables
3.2.1 Dependent Variable
In two questions, teachers were asked to assess whom of their students they consider to beable to make the transition to university, and whom of them not. In a recent study basedon the same data, Becker and Birkelbach (2010) analyzed the impact of reference-groupe�ects on the evaluations of class-teachers only. Here, 751 students were consideredby their class teachers as being 'able', and 616 students as being 'not able', while 1060students did not receive any evaluation at all. Becker and Birkelbach (2010) provided theargument that overall, teachers feel certain enough in their evaluations for high and lowachieving students to give an explicit prognosis, while they would rather abstain fromthat for 'average' students. This claim was supported by an analysis of students' meanintelligence scores in all three categories: For students without an explicit evaluation,the arithmetic mean of their intelligence is about IST TE0 = 109.6, for students witha positive evaluation IST TE+ = 114.7, and for students with a negative evaluationIST TE− = 107.8.14 We aim to apply a similar logic here, but in contrast to Beckerand Birkelbach (2010), we do not restrict our analyses to class teachers' evaluations.Instead, we take into account that each student potentially received an evaluation byseveral teachers, and each teacher potentially evaluated several students. In total, thereare N = 17.626 evaluations in our data, of which 4.363 evaluations are positive, and3.607 evaluations are negative. Due to space constraints, and to facilitate computations,our dependent variable is dichotomized into a positive vs. a negative evaluation.
13As a further amendment of the initial survey, an additional survey was administered to the schoolprincipals (Gesis-No. ZA996; N = 68). Later, the former students were re-surveyed in 1984/85(Gesis-No. ZA1441, N = 1987), in 1996/97 (Gesis-No. ZA4228; N = 1596) and 2010 (N = 1301,no Gesis-No. available yet).
14This trend is similar for students' school grades, and also holds in a multinomial logistic regressionanalysis with additional covariates (see Becker and Birkelbach, 2011, appendix, Tables B and C).
159
3 Data & Methods
3.2.2 Independent Variables
Student-level Students' intelligence was measured along four sub-scales of the intel-ligence structure test (ist) that the students took part in. We used the group-mean-centered15 total score of all four dimensions. Students' school achievement was oper-ationalized by their group-mean-centered grade point average (gpa). For their socialbackgrounds, we draw on a three-dimensional index of parental social class (ses) basedon parents' occupational status and situs that has already been added to the data (1'lower working class'; 2 'upper working class'; 3 'lower middle class'; 4 'middle class';5 'upper middle class'; 6 'upper class'; see Meulemann, 1979, p. 49). And �nally, stu-dents' aspirations (aspir) were measured by students' answer to the question if theyconsidered 'Abitur' to be necessary to reach their aim in life (0 'not necessary / no aimin life'; 1 'useful or necessary'). Apart from these indicators, analyses also control forstudents' gender (sex; 0 'female'; 1 'male').
Class-level To test for BFLPE (contrast e�ects) and RGE (assimilation / halo e�ects),respectively, we �rst computed two measures of class-level achievement and controlledfor class-level SES. Additional to the grand-mean-centered class-level means of students'intelligence (IST), we computed grand-mean-centered class-average grades (GPA).16
Second, we also computed grand-mean-centered class-level SES to measure potentialRGE s that might counterbalance BFLPE s. For school classes with missing values on thestudent level, we computed the grand-mean-centered class-level means of all non-missingobservations.
Teacher-level As mentioned before, teachers were asked which criteria they ordinarilyuse for their grading decisions. Apart from a list of prede�ned categories such as writtentest scores or pedagogic incentives, teachers could also name additional criteria as a �rstor a second choice. 21 (=3.92%) out of 536 teachers named an individualist gradingconcept as a second choice, and 47 (=8.77%) considered it to be their �rst choice.Contrarily, 7 teachers (=1.31%) mentioned a relational grading concept as a secondchoice, and 26 teachers (=4.85%) considered it to be their �rst choice. We created twoordinal variables (TFR(ind) and TFR(rel)) which were assigned a 1 if teachers explicitly
15Hox strongly recommends to use group-mean centering techniques only if they are supposed to repre-sent a speci�c hypothesis since the entire model is changed and cannot be re-transformed to the rawscores by means of simple algebraic transformations unlike with grand-mean centering (Hox, 2010,p. 68f.). Note that the analysis of frog-pond e�ects entails suchlike hypotheses where group-meancentering is an appropriate speci�cation (Kreft et al., 1995; Hox, 2010, p. 68f.).
16Although not an objective measure of student ability as Marsh et al. (2008) consider it to be one of thethree minimal conditions for 'true' BFLPE studies, we have good reasons also to include class-levelgrade point average as a contextual-level predictor. A simple empirical reason is that Tiedemannand Billmann-Mahecha (2007) observed signi�cant e�ects of class mean spelling performance onteachers' transition recommendations, and we want to ensure that our study is as comparable aspossible with preceding analyses. A more substantive theoretical reason is that teachers can beassumed to exchange views about student aptitudes in the faculty room (Mechtenberg, 2009), andthus a teacher evaluating a certain student might be in�uenced by opinions of other teachers.
160
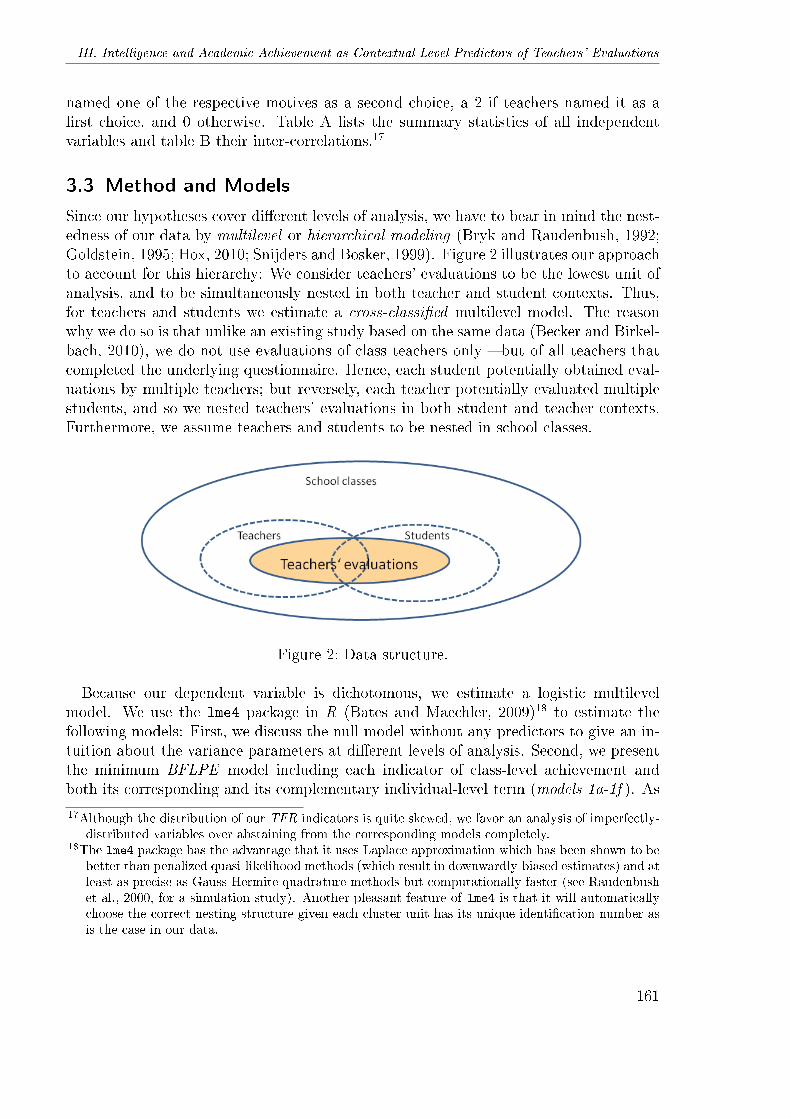
III. Intelligence and Academic Achievement as Contextual-Level Predictors of Teachers' Evaluations
named one of the respective motives as a second choice, a 2 if teachers named it as a�rst choice, and 0 otherwise. Table A lists the summary statistics of all independentvariables and table B their inter-correlations.17
3.3 Method and Models
Since our hypotheses cover di�erent levels of analysis, we have to bear in mind the nest-edness of our data by multilevel or hierarchical modeling (Bryk and Raudenbush, 1992;Goldstein, 1995; Hox, 2010; Snijders and Bosker, 1999). Figure 2 illustrates our approachto account for this hierarchy: We consider teachers' evaluations to be the lowest unit ofanalysis, and to be simultaneously nested in both teacher and student contexts. Thus,for teachers and students we estimate a cross-classi�ed multilevel model. The reasonwhy we do so is that unlike an existing study based on the same data (Becker and Birkel-bach, 2010), we do not use evaluations of class teachers only � but of all teachers thatcompleted the underlying questionnaire. Hence, each student potentially obtained eval-uations by multiple teachers; but reversely, each teacher potentially evaluated multiplestudents, and so we nested teachers' evaluations in both student and teacher contexts.Furthermore, we assume teachers and students to be nested in school classes.
Figure 2: Data structure.
Because our dependent variable is dichotomous, we estimate a logistic multilevelmodel. We use the lme4 package in R (Bates and Maechler, 2009)18 to estimate thefollowing models: First, we discuss the null model without any predictors to give an in-tuition about the variance parameters at di�erent levels of analysis. Second, we presentthe minimum BFLPE model including each indicator of class-level achievement andboth its corresponding and its complementary individual-level term (models 1a-1f ). As
17Although the distribution of our TFR indicators is quite skewed, we favor an analysis of imperfectly-distributed variables over abstaining from the corresponding models completely.
18The lme4 package has the advantage that it uses Laplace approximation which has been shown to bebetter than penalized quasi-likelihood methods (which result in downwardly-biased estimates) and atleast as precise as Gauss-Hermite quadrature methods but computationally faster (see Raudenbushet al., 2000, for a simulation study). Another pleasant feature of lme4 is that it will automaticallychoose the correct nesting structure given each cluster unit has its unique identi�cation number asis the case in our data.
161
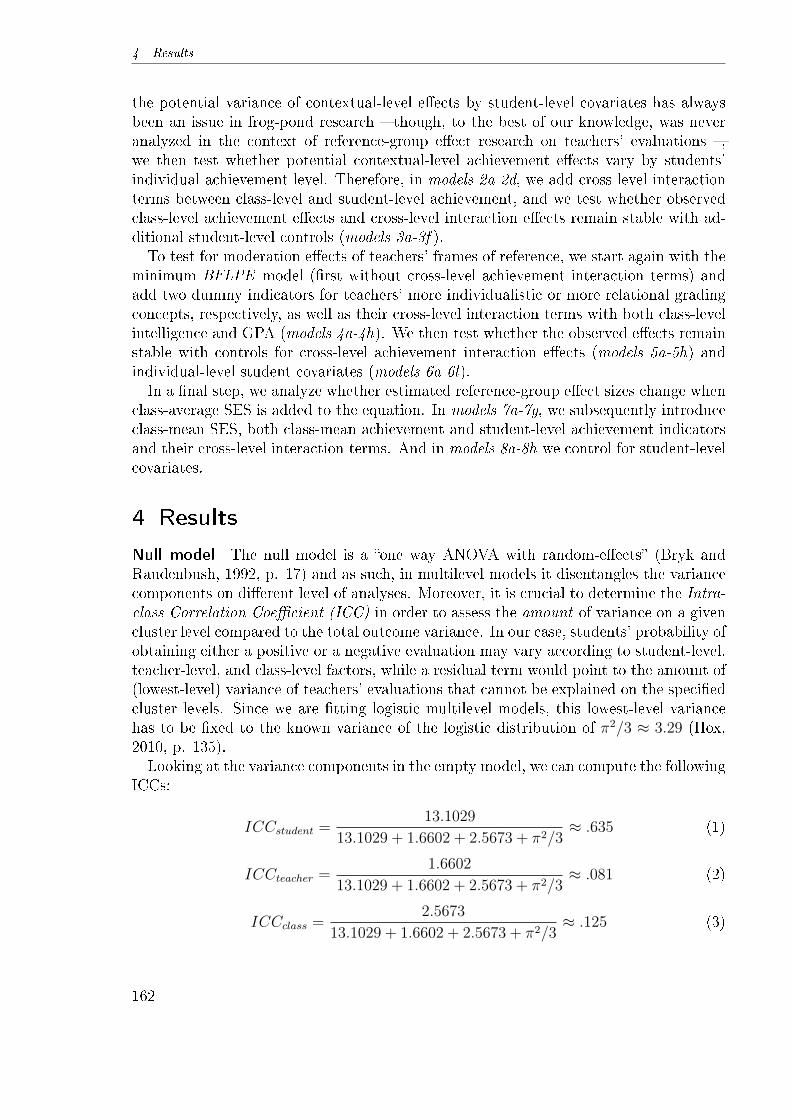
4 Results
the potential variance of contextual-level e�ects by student-level covariates has alwaysbeen an issue in frog-pond research � though, to the best of our knowledge, was neveranalyzed in the context of reference-group e�ect research on teachers' evaluations �,we then test whether potential contextual-level achievement e�ects vary by students'individual achievement level. Therefore, in models 2a-2d, we add cross-level interactionterms between class-level and student-level achievement, and we test whether observedclass-level achievement e�ects and cross-level interaction e�ects remain stable with ad-ditional student-level controls (models 3a-3f ).To test for moderation e�ects of teachers' frames of reference, we start again with the
minimum BFLPE model (�rst without cross-level achievement interaction terms) andadd two dummy indicators for teachers' more individualistic or more relational gradingconcepts, respectively, as well as their cross-level interaction terms with both class-levelintelligence and GPA (models 4a-4h). We then test whether the observed e�ects remainstable with controls for cross-level achievement interaction e�ects (models 5a-5h) andindividual-level student covariates (models 6a-6l).In a �nal step, we analyze whether estimated reference-group e�ect sizes change when
class-average SES is added to the equation. In models 7a-7g, we subsequently introduceclass-mean SES, both class-mean achievement and student-level achievement indicatorsand their cross-level interaction terms. And in models 8a-8h we control for student-levelcovariates.
4 Results
Null model The null model is a �one way ANOVA with random-e�ects� (Bryk andRaudenbush, 1992, p. 17) and as such, in multilevel models it disentangles the variancecomponents on di�erent level of analyses. Moreover, it is crucial to determine the Intra-class Correlation Coe�cient (ICC) in order to assess the amount of variance on a givencluster level compared to the total outcome variance. In our case, students' probability ofobtaining either a positive or a negative evaluation may vary according to student-level,teacher-level, and class-level factors, while a residual term would point to the amount of(lowest-level) variance of teachers' evaluations that cannot be explained on the speci�edcluster levels. Since we are �tting logistic multilevel models, this lowest-level variancehas to be �xed to the known variance of the logistic distribution of π2/3 ≈ 3.29 (Hox,2010, p. 135).Looking at the variance components in the empty model, we can compute the following
ICCs:
ICCstudent =13.1029
13.1029 + 1.6602 + 2.5673 + π2/3≈ .635 (1)
ICCteacher =1.6602
13.1029 + 1.6602 + 2.5673 + π2/3≈ .081 (2)
ICCclass =2.5673
13.1029 + 1.6602 + 2.5673 + π2/3≈ .125 (3)
162
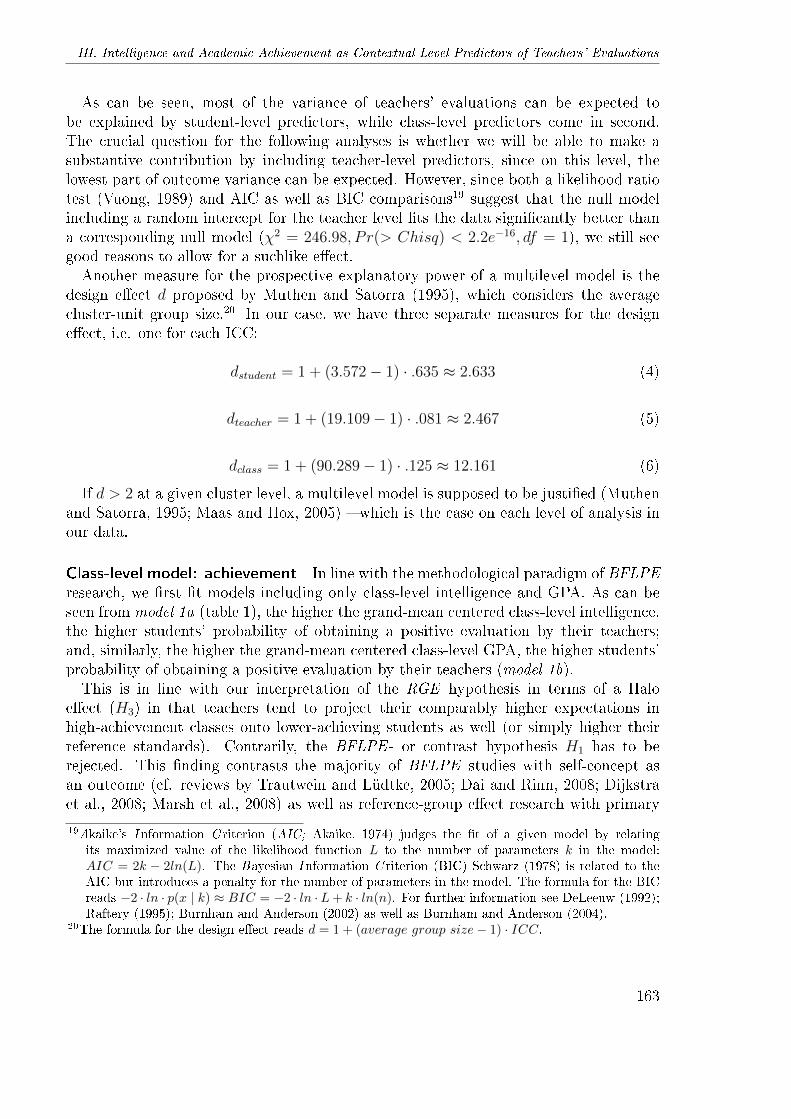
III. Intelligence and Academic Achievement as Contextual-Level Predictors of Teachers' Evaluations
As can be seen, most of the variance of teachers' evaluations can be expected tobe explained by student-level predictors, while class-level predictors come in second.The crucial question for the following analyses is whether we will be able to make asubstantive contribution by including teacher-level predictors, since on this level, thelowest part of outcome variance can be expected. However, since both a likelihood ratiotest (Vuong, 1989) and AIC as well as BIC comparisons19 suggest that the null modelincluding a random intercept for the teacher level �ts the data signi�cantly better thana corresponding null model (χ2 = 246.98, P r(> Chisq) < 2.2e−16, df = 1), we still seegood reasons to allow for a suchlike e�ect.Another measure for the prospective explanatory power of a multilevel model is the
design e�ect d proposed by Muthen and Satorra (1995), which considers the averagecluster-unit group size.20 In our case, we have three separate measures for the designe�ect, i.e. one for each ICC:
dstudent = 1 + (3.572− 1) · .635 ≈ 2.633 (4)
dteacher = 1 + (19.109− 1) · .081 ≈ 2.467 (5)
dclass = 1 + (90.289− 1) · .125 ≈ 12.161 (6)
If d > 2 at a given cluster level, a multilevel model is supposed to be justi�ed (Muthenand Satorra, 1995; Maas and Hox, 2005) � which is the case on each level of analysis inour data.
Class-level model: achievement In line with the methodological paradigm of BFLPEresearch, we �rst �t models including only class-level intelligence and GPA. As can beseen from model 1a (table 1), the higher the grand-mean centered class-level intelligence,the higher students' probability of obtaining a positive evaluation by their teachers;and, similarly, the higher the grand-mean centered class-level GPA, the higher students'probability of obtaining a positive evaluation by their teachers (model 1b).This is in line with our interpretation of the RGE hypothesis in terms of a Halo
e�ect (H3) in that teachers tend to project their comparably higher expectations inhigh-achievement classes onto lower-achieving students as well (or simply higher theirreference standards). Contrarily, the BFLPE - or contrast hypothesis H1 has to berejected. This �nding contrasts the majority of BFLPE studies with self-concept asan outcome (cf. reviews by Trautwein and Lüdtke, 2005; Dai and Rinn, 2008; Dijkstraet al., 2008; Marsh et al., 2008) as well as reference-group e�ect research with primary
19Akaike's Information C riterion (AIC; Akaike, 1974) judges the �t of a given model by relatingits maximized value of the likelihood function L to the number of parameters k in the model:AIC = 2k − 2ln(L). The Bayesian Information C riterion (BIC) Schwarz (1978) is related to theAIC but introduces a penalty for the number of parameters in the model. The formula for the BICreads −2 · ln · p(x | k) ≈ BIC = −2 · ln ·L+ k · ln(n). For further information see DeLeeuw (1992);Raftery (1995); Burnham and Anderson (2002) as well as Burnham and Anderson (2004).
20The formula for the design e�ect reads d = 1 + (average group size− 1) · ICC.
163
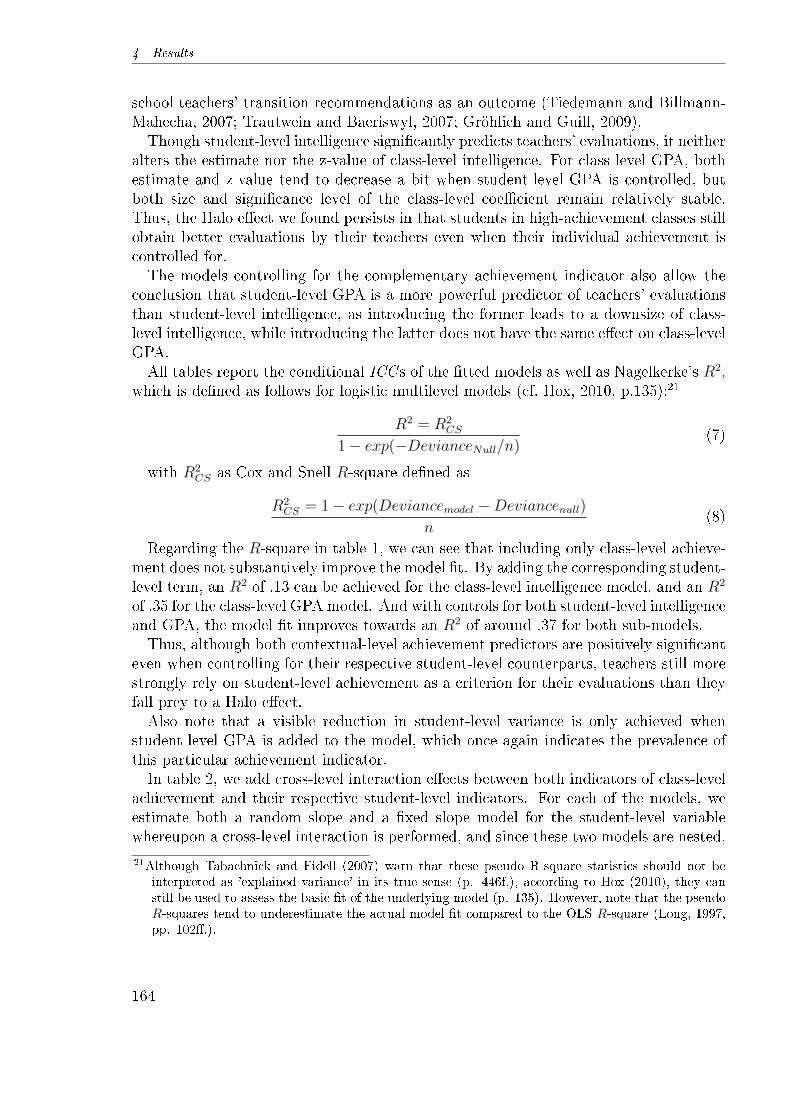
4 Results
school teachers' transition recommendations as an outcome (Tiedemann and Billmann-Mahecha, 2007; Trautwein and Baeriswyl, 2007; Gröhlich and Guill, 2009).Though student-level intelligence signi�cantly predicts teachers' evaluations, it neither
alters the estimate nor the z-value of class-level intelligence. For class level GPA, bothestimate and z-value tend to decrease a bit when student-level GPA is controlled, butboth size and signi�cance level of the class-level coe�cient remain relatively stable.Thus, the Halo e�ect we found persists in that students in high-achievement classes stillobtain better evaluations by their teachers even when their individual achievement iscontrolled for.The models controlling for the complementary achievement indicator also allow the
conclusion that student-level GPA is a more powerful predictor of teachers' evaluationsthan student-level intelligence, as introducing the former leads to a downsize of class-level intelligence, while introducing the latter does not have the same e�ect on class-levelGPA.All tables report the conditional ICC s of the �tted models as well as Nagelkerke's R2,
which is de�ned as follows for logistic multilevel models (cf. Hox, 2010, p.135):21
R2 = R2CS
1− exp(−DevianceNull/n)(7)
with R2CS as Cox and Snell R-square de�ned as
R2CS = 1− exp(Deviancemodel −Deviancenull)
n(8)
Regarding the R-square in table 1, we can see that including only class-level achieve-ment does not substantively improve the model �t. By adding the corresponding student-level term, an R2 of .13 can be achieved for the class-level intelligence model, and an R2
of .35 for the class-level GPA model. And with controls for both student-level intelligenceand GPA, the model �t improves towards an R2 of around .37 for both sub-models.Thus, although both contextual-level achievement predictors are positively signi�cant
even when controlling for their respective student-level counterparts, teachers still morestrongly rely on student-level achievement as a criterion for their evaluations than theyfall prey to a Halo e�ect.Also note that a visible reduction in student-level variance is only achieved when
student-level GPA is added to the model, which once again indicates the prevalence ofthis particular achievement indicator.In table 2, we add cross-level interaction e�ects between both indicators of class-level
achievement and their respective student-level indicators. For each of the models, weestimate both a random slope and a �xed slope model for the student-level variablewhereupon a cross-level interaction is performed, and since these two models are nested,
21Although Tabachnick and Fidell (2007) warn that these pseudo R-square statistics should not beinterpreted as 'explained variance' in its true sense (p. 446f.), according to Hox (2010), they canstill be used to assess the basic �t of the underlying model (p. 135). However, note that the pseudoR-squares tend to underestimate the actual model �t compared to the OLS R-square (Long, 1997,pp. 102�.).
164
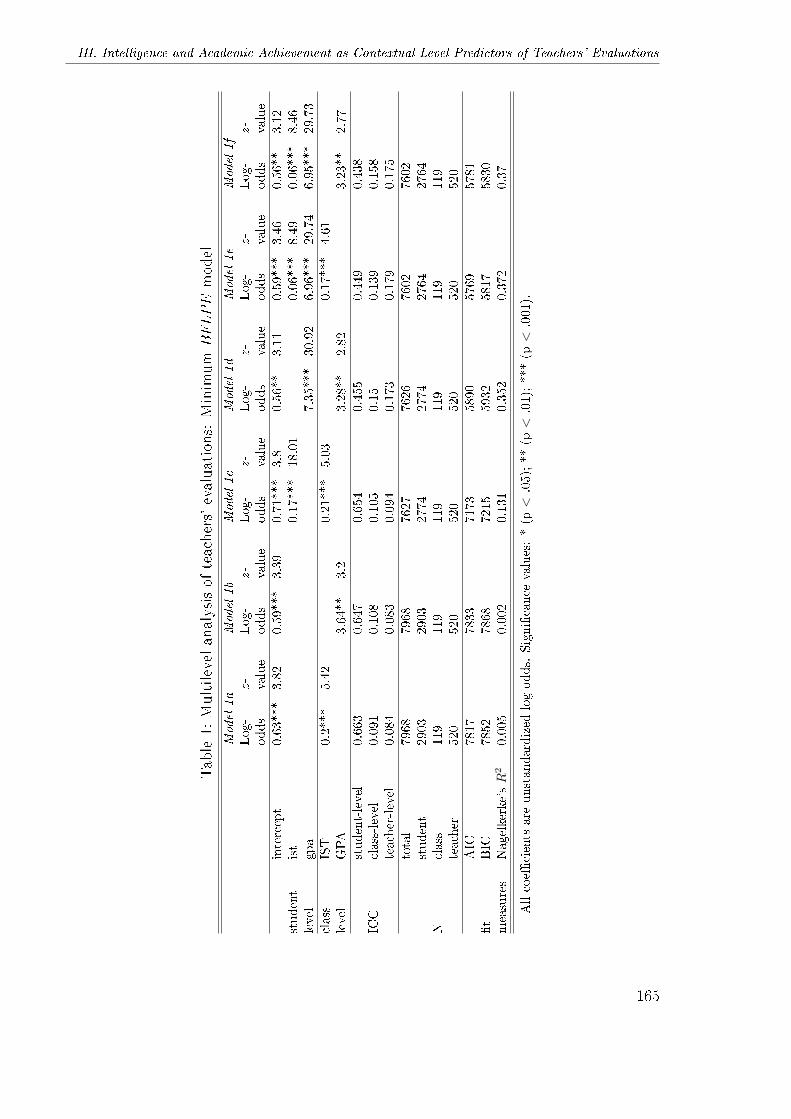
III. Intelligence and Academic Achievement as Contextual-Level Predictors of Teachers' Evaluations
Table1:Multilevelanalysisof
teachers'evaluations:
Minimum
BFLPE
model
Model
1a
Model
1b
Model
1c
Model
1d
Model
1e
Model
1f
Log-
odds
z-value
Log-
odds
z-value
Log-
odds
z-value
Log-
odds
z-value
Log-
odds
z-value
Log-
odds
z-value
intercept
0.63***
3.82
0.59***
3.39
0.71***
3.8
0.56**
3.11
0.59***
3.46
0.56**
3.12
student
ist
0.17***
18.01
0.06***
8.49
0.06***
8.46
level
gpa
7.35***
30.92
6.96***
29.74
6.95***
29.73
class
IST
0.2***
5.42
0.21***
5.03
0.17***
4.61
level
GPA
3.64**
3.2
3.28**
2.82
3.23**
2.77
student-level
0.663
0.647
0.654
0.455
0.449
0.438
ICC
class-level
0.091
0.108
0.105
0.15
0.139
0.158
teacher-level
0.084
0.083
0.094
0.173
0.179
0.175
total
7968
7968
7627
7626
7602
7602
student
2903
2903
2774
2774
2764
2764
Nclass
119
119
119
119
119
119
teacher
520
520
520
520
520
520
AIC
7817
7833
7173
5890
5769
5781
�t
BIC
7852
7868
7215
5932
5817
5830
measures
Nagelkerke'sR
20.005
0.002
0.131
0.352
0.372
0.37
Allcoe�
cients
are
unstandardized
logodds.
Signi�cance
values:*(p<
.05);**(p<
.01);***(p<
.001).
165
4 Results
we can evaluate by means of a likelihood-ratio test (Vuong, 1989) whether the random-slope model �ts the data signi�cantly better than a �xed-slope model. In none of thecases does the underlying χ2 value get close to a conventional level of statistical sig-ni�cance, which is why the estimates of table 2 are consistently based on �xed slopemodels.In model 2a and model 2b, the cross-level interaction e�ect is not signi�cant regardless
of whether student-level GPA is controlled for (as in model 2b) or not. Contrarily, model2c reveals a signi�cant cross-level interaction between class-level and student-level GPA� indicating that the e�ect of student-level GPA on teachers' evaluations increases inclasses with higher mean GPA (or that the positive e�ect of class level GPA on teachers'evaluations is stronger for students with a higher GPA). Controlling for student-levelintelligence does a�ect the signi�cance value of the cross-level interaction term (model2d); however, note that the underlying z-value of model 2d is still very close to thecritical value of 1.96.22
Since even an insigni�cant interaction term � as in the case of class-mean average IST� does not indicate that both estimate and signi�cance level of a given coe�cient do notvary by the categories of another one (see Brambor et al., 2006, p. 70), we computedthe marginal e�ects of our interaction terms as well as their corresponding conditionalz-values.23
However, also according to these statistics, no notable variance of the class-meanability e�ect on teachers' evaluations by student ability levels can be detected. Figure3 illustrates the di�erence between the two cross-level ability interaction terms for theminimum, the 25th, 50th and 75th percentile, as well as the maximum for the respectivestudent-level variable.24 While for the IST*ist interaction, marginal di�erences in theslope variance without controls for student-level GPA are canceled out when this controlgoes into the model (upper line of the �gure), there is still a considerable varianceregarding the GPA*gpa interaction even with controls for student-level intelligence (lowerline of the �gure). To be precise, the marginal e�ect of class-average intelligence on theprobability of obtaining a positive teacher evaluation varies between .11 and .31 forthe plotted percentiles of student intelligence before controlling student-level GPA, and
22The signi�cant cross-level interaction between student-level and class-level GPA remained stable evenwhen controlling for class-level intelligence and its interaction with student-level intelligence (notshown, available upon request). However, in order to avoid convergence problems in the morecomplex models following in the next paragraphs, we always included only one class-level predictorat a time.
23The marginal e�ect of an interaction term is computed by the �rst partial derivative of one of
the variables involved, which for a simple two-level case yields:∆Yij
∆X1ij= γ10 + γ11Z1j with the
corresponding standard error s.e.(γ10 + γ11z1j) =√var(γ10) + z2
1j · var(γ11) + 2 · z1j · cov(γ10, γ11)
(with z1j being a speci�c value of Z1j ; see Friedrich, 1982; Brambor et al., 2006).24We used the lmer.PlotInt.fnc in the languageR package to plot the interaction e�ects �tted by
lme4. Note that the percentiles for which the marginal e�ects are plotted refer to the distribution ofthe student-level covariate from the �tted models (net of missing values) and not to its distributionin the raw data. This is why the actual values of the percentiles di�er within the plots and comparedto the summary statistics in table A (appendix).
166
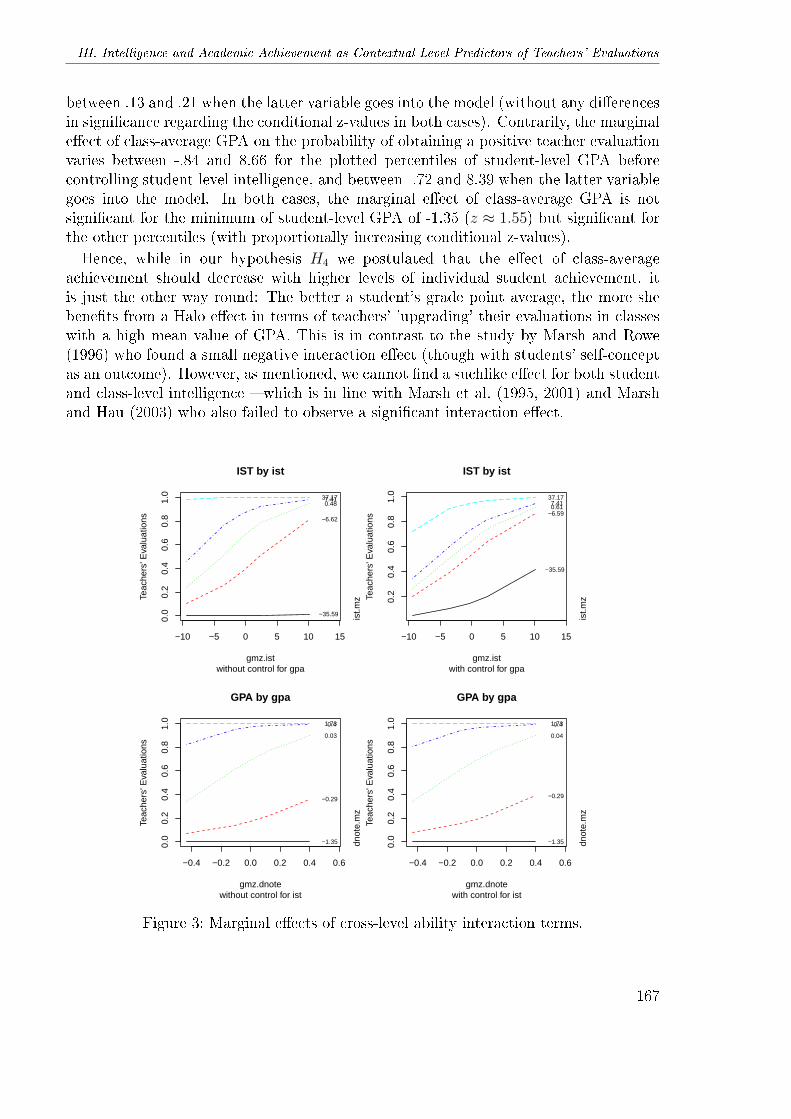
III. Intelligence and Academic Achievement as Contextual-Level Predictors of Teachers' Evaluations
between .13 and .21 when the latter variable goes into the model (without any di�erencesin signi�cance regarding the conditional z-values in both cases). Contrarily, the marginale�ect of class-average GPA on the probability of obtaining a positive teacher evaluationvaries between -.84 and 8.66 for the plotted percentiles of student-level GPA beforecontrolling student-level intelligence, and between -.72 and 8.39 when the latter variablegoes into the model. In both cases, the marginal e�ect of class-average GPA is notsigni�cant for the minimum of student-level GPA of -1.35 (z ≈ 1.55) but signi�cant forthe other percentiles (with proportionally increasing conditional z-values).Hence, while in our hypothesis H4 we postulated that the e�ect of class-average
achievement should decrease with higher levels of individual student achievement, itis just the other way round: The better a student's grade point average, the more shebene�ts from a Halo e�ect in terms of teachers' 'upgrading' their evaluations in classeswith a high mean value of GPA. This is in contrast to the study by Marsh and Rowe(1996) who found a small negative interaction e�ect (though with students' self-conceptas an outcome). However, as mentioned, we cannot �nd a suchlike e�ect for both studentand class-level intelligence � which is in line with Marsh et al. (1995, 2001) and Marshand Hau (2003) who also failed to observe a signi�cant interaction e�ect.
−10 −5 0 5 10 15
0.0
0.2
0.4
0.6
0.8
1.0
gmz.ist
Teac
hers
' Eva
luat
ions
−35.59
−6.62
0.487.4137.17
ist.m
z
IST by ist
without control for gpa
−10 −5 0 5 10 15
0.2
0.4
0.6
0.8
1.0
gmz.ist
Teac
hers
' Eva
luat
ions
−35.59
−6.590.617.41
37.17
ist.m
z
IST by ist
with control for gpa
−0.4 −0.2 0.0 0.2 0.4 0.6
0.0
0.2
0.4
0.6
0.8
1.0
gmz.dnote
Teac
hers
' Eva
luat
ions
−1.35
−0.29
0.03
0.41.73
dnot
e.m
z
GPA by gpa
without control for ist
−0.4 −0.2 0.0 0.2 0.4 0.6
0.0
0.2
0.4
0.6
0.8
1.0
gmz.dnote
Teac
hers
' Eva
luat
ions
−1.35
−0.29
0.04
0.41.73
dnot
e.m
z
GPA by gpa
with control for ist
Figure 3: Marginal e�ects of cross-level ability interaction terms.
167
4 Results
Although the cross-level interaction e�ect between class-level and student-level GPAon teachers' evaluations is statistically signi�cant, regarding the R-square terms, thesemodels do not �t the data remarkably better than models 1d and 1f (table 1) withoutsuch an e�ect.In a third step, we tested whether the class-level e�ects obtained in table 1 as well
as the cross-level interaction e�ect observed in table 2 remained stable with additionalstudent-level controls. Since in this series of models cross-level interactions are involvedas well, regarding the appropriateness of random-slope models we proceed similarly toour approach in table 2. Again, the estimates in table 3 are �xed-slope models sincetheir random-slope counterparts did not �t the data signi�cantly better.In model 3a, we add parental social class in the equation, which is positively associated
with teachers' evaluations, but does neither alter the signi�cant e�ect of class-level in-telligence nor its insigni�cant cross-level interaction term with student-level intelligence(more precisely, the z-statistic of the interaction term decreases with controls for socialclass). Similar trends hold for an additional term of students' aspirations (model 3b),whereas we �nd a positive e�ect for male students (model 3c).By content, these results indicate that the higher the social class of students' parents,
and the higher students' aspirations, the higher the probability of obtaining a positiveevaluation � which is in line with both analyses of primary school teachers' transitionrecommendations as an outcome (Bos et al., 2004; Arnold et al., 2007; Tiedemann andBillmann-Mahecha, 2007; Trautwein and Baeriswyl, 2007; Gröhlich and Guill, 2009)and a structural equation model based on the same data (Becker and Birkelbach, 2011).Similarly, male students have a higher probability of obtaining a positive evaluation thanfemale students � which contradicts a recent study based on primary school teachers'transition recommendations that found the opposite gender e�ect (Gröhlich and Guill,2009).Models 3d-3e repeated the stepwise procedures from models 3a-3c but included class-
level GPA and its interaction with student-level GPA instead of class-level intelligence.Regarding the student-level covariates and the 'main e�ect' of class-level GPA, no sub-stantive di�erence compared to models 3a-3c can be observed. Contrarily, the interac-tion term between student-level and class-level GPA is only signi�cant with controls forparental social class but not with additional controls for students' aspiration and theirgender.Apparently, a substantive part of the variance of the class-level GPA e�ect on teachers'
evaluations that could be explained by di�erences in student ability is partly due todi�erences in students' aspirations. However, since the z-statistics are again not thatfar from the threshold of 1.96, there is still evidence that the relationship between class-level GPA on teachers' evaluations is not completely insensitive to students' individualachievement in terms of GPA.Another result from table 3 is that in both models 3c and 3f, the e�ect of class-level
achievement tends to diminish slightly when students' gender is controlled for. We willcome back to this �nding in our discussion section. Though all of them signi�cant,only minor gains in model �t can be yielded by including the additional student-levelcovariates.
168
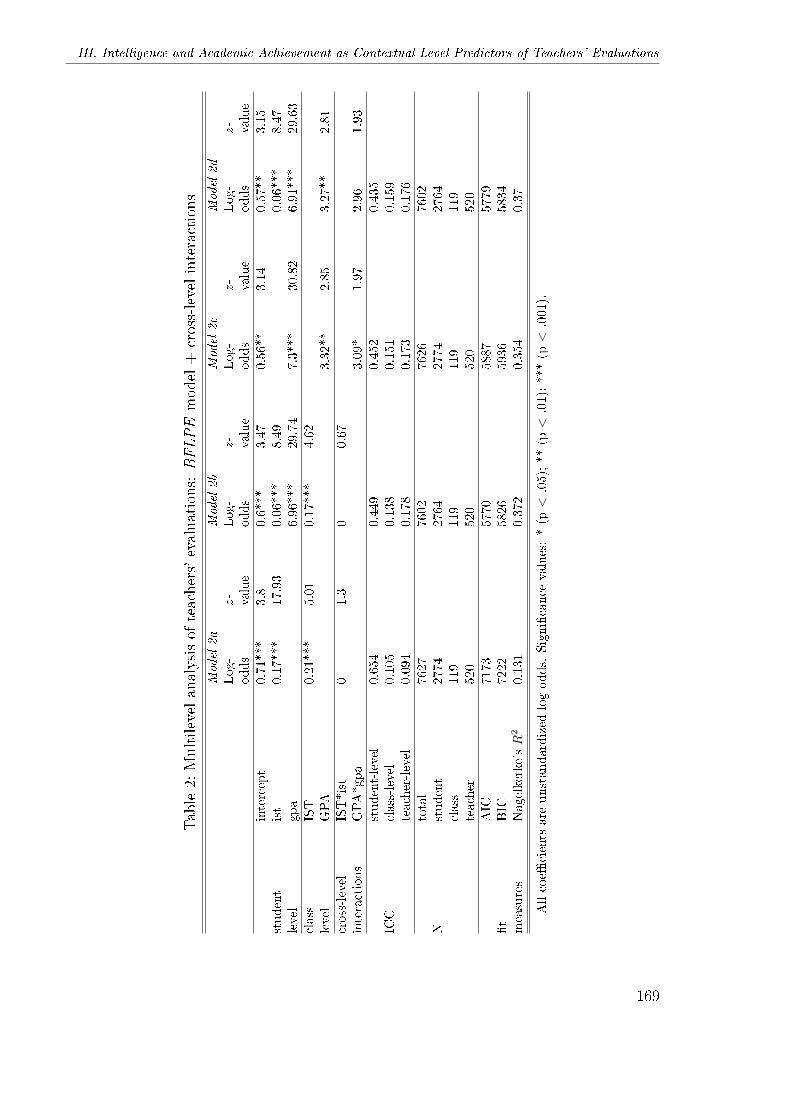
III. Intelligence and Academic Achievement as Contextual-Level Predictors of Teachers' Evaluations
Table2:Multilevelanalysisof
teachers'evaluations:
BFLPE
model+cross-levelinteractions
Model
2a
Model
2b
Model
2c
Model
2d
Log-
odds
z-value
Log-
odds
z-value
Log-
odds
z-value
Log-
odds
z-value
intercept
0.71***
3.8
0.6***
3.47
0.56**
3.14
0.57**
3.15
student
ist
0.17***
17.93
0.06***
8.49
0.06***
8.47
level
gpa
6.96***
29.74
7.3***
30.82
6.91***
29.63
class
IST
0.21***
5.01
0.17***
4.62
level
GPA
3.32**
2.85
3.27**
2.81
cross-level
IST*ist
01.3
00.67
interactions
GPA*gpa
3.09*
1.97
2.96
1.93
student-level
0.654
0.449
0.452
0.435
ICC
class-level
0.105
0.138
0.151
0.159
teacher-level
0.094
0.178
0.173
0.176
total
7627
7602
7626
7602
Nstudent
2774
2764
2774
2764
class
119
119
119
119
teacher
520
520
520
520
AIC
7173
5770
5887
5779
�t
BIC
7222
5826
5936
5834
measures
Nagelkerke'sR
20.131
0.372
0.354
0.37
Allcoe�
cients
are
unstandardized
logodds.
Signi�cance
values:*(p<
.05);**(p<
.01);***(p<
.001).
169
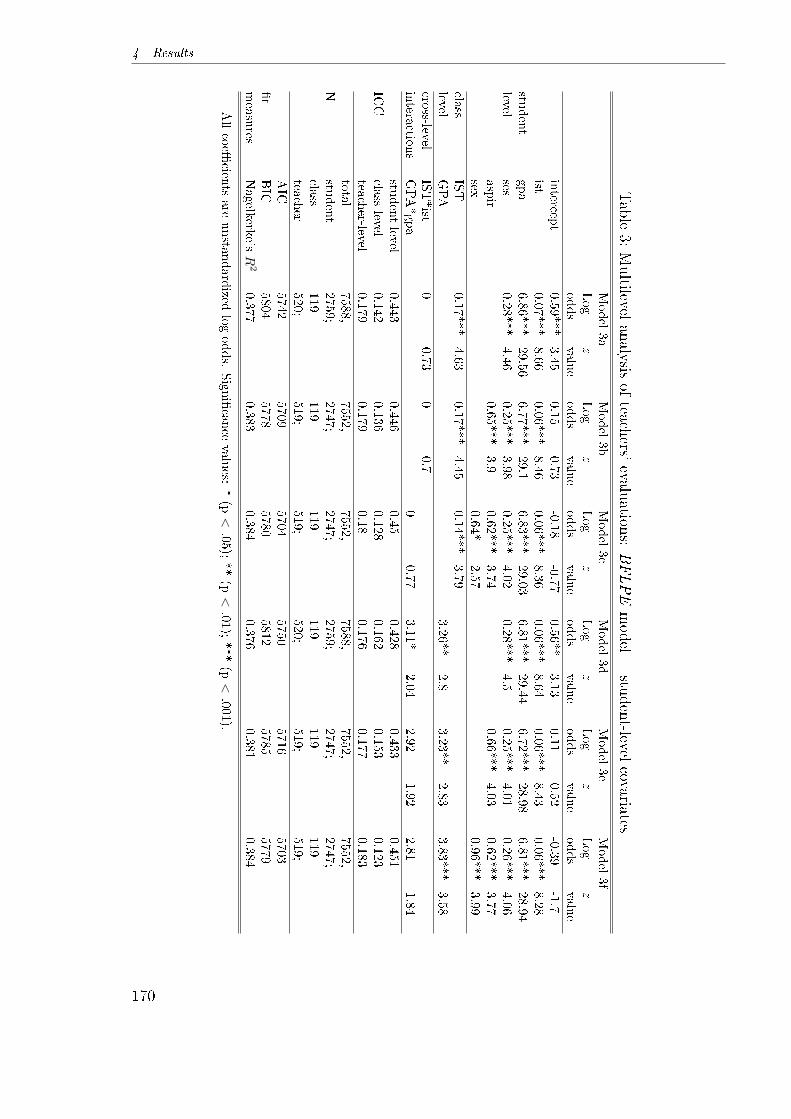
4 Results
Table
3:Multilevel
analysisof
teachers'evaluations:
BFLPE
model
+student-level
covariatesModel3a
Model3b
Model3c
Model3d
Model3e
Model3f
Log-
odds
z-valu
eLog-
odds
z-value
Log-
odds
z-value
Log-
odds
z-value
Log-
odds
z-value
Log-
odds
z-value
intercep
t0.59***
3.45
0.15
0.73
-0.18
-0.77
0.56**
3.13
0.11
0.52
-0.39
-1.7
ist0.07***
8.66
0.06***
8.46
0.06***
8.36
0.06***
8.64
0.06***
8.43
0.06***
8.28
student
gpa
6.86***
29.56
6.77***
29.1
6.83***
29.03
6.81***
29.44
6.72***
28.98
6.81***
28.94
levelses
0.28***
4.46
0.25***
3.98
0.25***
4.02
0.28***
4.5
0.25***
4.01
0.26***
4.06
aspir
0.65***
3.9
0.62***
3.74
0.66***
4.03
0.62***
3.77
sex0.64*
2.57
0.96***
3.99
class
IST
0.17***
4.63
0.17***
4.45
0.14***
3.79
levelGPA
3.26**
2.8
3.23**
2.83
3.83***
3.58
cross-level
IST*ist
00.73
00.7
intera
ctions
GPA*gpa
00.77
3.11*
2.04
2.92
1.92
2.81
1.84
student-lev
el0.443
0.446
0.45
0.428
0.433
0.451
ICC
class-level
0.142
0.136
0.128
0.162
0.153
0.123
teacher-level
0.179
0.179
0.18
0.176
0.177
0.183
total
7588,
7552,
7552,
7588,
7552,
7552,
Nstu
dent
2759;
2747;
2747;
2759;
2747;
2747;
class
119
119
119
119
119
119
teacher
520;
519;
519;
520;
519;
519;
AIC
5742
5709
5704
5750
5716
5703
�t
BIC
5804
5778
5780
5812
5785
5779
measures
Nagelk
erke'sR
20.377
0.383
0.384
0.376
0.38
10.384
Allcoe�
cients
are
unsta
ndardized
logodds.
Signi�cance
values:
*(p<
.05);**(p<
.01);***(p<
.001).
170
III. Intelligence and Academic Achievement as Contextual-Level Predictors of Teachers' Evaluations
Teacher-level model As a further advancement to the existing literature about re-ference-group e�ects on teachers' evaluations, we test whether our two indicators forteachers' frames of reference (which are dummy variables for teachers' more individualistand their more relational grade concepts, respectively) signi�cantly interact with class-level predictors. Once again, we present separate models for class-level intelligence andclass-level grades. We begin with the minimal BFLPE model including only class-levelintelligence and class-level GPA (as well as the corresponding student-level predictor),respectively, to which we subsequently add each indicator of TFR plus its interactionwith class-level achievement (tables 4 and 5). In several additional models, we add cross-level interactions between class- and student-level achievement as well as our student-level covariates (appendix, tables C to F).As one can see, neither is one of the TFR indicators signi�cantly associated with
teachers' evaluations, nor does it signi�cantly interact with class-level intelligence orGPA. Again, we test in terms of marginal e�ects and corresponding conditional z-valueswhether an insigni�cant interaction term was associated with signi�cance di�erencesin subgroups. Although these analyses also reveal that there are no di�erences in sig-ni�cance for both class-level intelligence and GPA by di�erent categories of our twoindicators of TFR, two observations appear to be worth mentioning:First, apart from signi�cance issues, students' e�ect of class-level intelligence on the
probability of obtaining a positive teacher evaluation is slightly weaker for teachers whohold a more individualist grading concept, and slightly stronger for teachers who hold amore relational grading concept. Contrarily, the e�ect of class-average GPA is slightlystronger for teachers who hold a more individualist grading concept and slightly weakerfor teachers who hold a more relational grading concept. To be sure, we cannot rejectthe null hypothesis that this �nding is merely due to random error, which is why we arenot able to maintain our hypothesis H5.Second, for one of the four interaction e�ects, the variance of the slopes by student-
level subgroups appears to be a bit higher than for the three other one, namely for thee�ect of class-level GPA by teachers' relational grading concepts. These patterns arealso illustrated by �gure 4.In several additional multilevel models, we repeat the analysis steps from the preceding
tables in subsequently adding cross-level achievement interaction e�ects (models 5a - 5h)as well as student-level covariates (models 6a - 6i). Neither do we encounter remarkabledi�erences compared to the models without TFR indicators, nor do the interactionsof the latter terms with class-level achievement become signi�cant or o�er new insightsregarding their marginal e�ects. Furthermore, no visible improvement in model �t couldbe gained. Therefore, these models are listed in the appendix (tables C � F).
Class-level model: SES In a last series of multilevel models, we tried to juxtaposepotentially counterbalancing BFLPE and RGE patterns by including class-average SESin the model. In particular, we �rst estimated a reduced model containing only class-level SES and then added class-level achievement, their cross-level interaction terms withthe corresponding student-level counterparts and additional student-level covariates. In
171
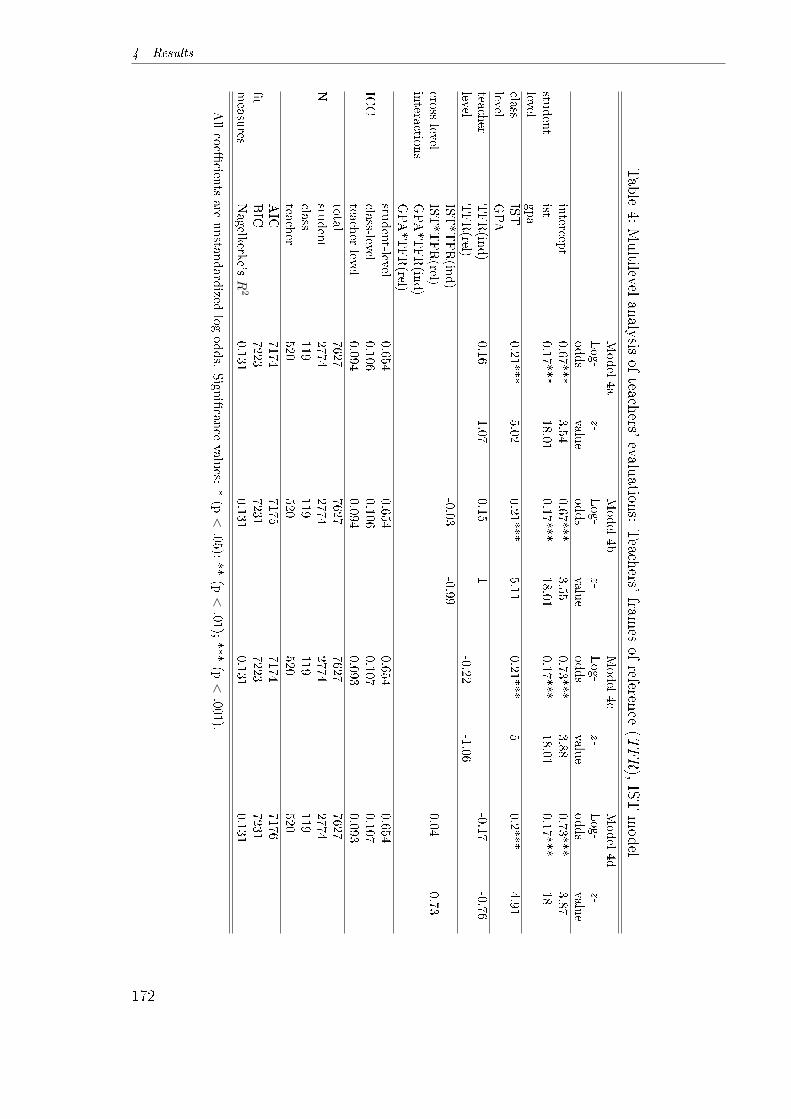
4 Results
Table
4:Multilevel
analysisof
teachers'evaluations:
Teachers'
frames
ofreference
(TFR),IST
model
Model4a
Model4b
Model4c
Model4d
Log-
odds
z-value
Log-
odds
z-value
Log-
odds
z-value
Log-
odds
z-value
intercep
t0.67***
3.54
0.67***
3.55
0.73***
3.88
0.73***
3.87
student
ist0.17***
18.01
0.17***
18.01
0.17***
18.01
0.17***
18
levelgpa
class
IST
0.21***
5.02
0.21***
5.11
0.21***
50.2***
4.91
levelGPA
teacher
TFR(in
d)
0.16
1.07
0.15
1-0.17
-0.76
levelTFR(rel)
-0.22
-1.06
IST*TFR(in
d)
-0.03
-0.99
cross-level
IST*TFR(rel)
0.04
0.73
intera
ctions
GPA*TFR(in
d)
GPA*TFR(rel)
student-level
0.654
0.654
0.654
0.654
ICC
class-level
0.106
0.106
0.107
0.107
teacher-level
0.094
0.094
0.093
0.093
total
7627
7627
7627
7627
Nstu
dent
2774
2774
2774
2774
class
119
119
119
119
teacher
520
520
520
520
AIC
7174
7175
7174
7176
�t
BIC
7223
7231
7223
7231
measures
Nagelkerke's
R2
0.131
0.131
0.131
0.131
Allcoe�
cients
are
unsta
ndardized
logodds.
Signi�cance
values:
*(p<
.05);**(p<
.01);***(p<
.001).
172

III. Intelligence and Academic Achievement as Contextual-Level Predictors of Teachers' Evaluations
Table5:Multilevelanalysisof
teachers'evaluations:
Teachers'fram
esof
reference(T
FR),GPAmodel
Model4e
Model4f
Model4g
Model4h
Log-
odds
z-value
Log-
odds
z-value
Log-
odds
z-value
Log-
odds
z-value
intercept
0.52**
2.84
0.52**
2.84
0.58**
3.21
0.58**
3.2
student
ist
level
gpa
7.35***
30.91
7.35***
30.92
7.35***
30.91
7.35***
30.92
class
IST
level
GPA
3.27**
2.81
3.16**
2.67
3.31**
2.84
3.44**
2.89
teacher
TFR(ind)
0.16
1.03
0.16
1.03
level
TFR(rel)
-0.23
-1.01
-0.18
-0.78
IST*TFR(ind)
cross-level
IST*TFR(rel)
interactions
GPA*TFR(ind)
0.56
0.54
GPA*TFR(rel)
-0.92
-0.6
student-level
0.455
0.455
0.455
0.455
ICC
class-level
0.151
0.151
0.152
0.152
teacher-level
0.172
0.172
0.171
0.172
total
7626
7626
7626
7626
Nstudent
2774
2774
2774
2774
class
119
119
119
119
teacher
520
520
520
520
AIC
5891
5893
5891
5893
�t
BIC
5940
5948
5940
5948
measures
Nagelkerke'sR
20.352
0.352
0.352
0.352
Allcoe�
cients
are
unstandardized
logodds.
Signi�cance
values:*(p<
.05);**(p<
.01);***(p<
.001).
173

4 Results
−10 −5 0 5 10 15
0.2
0.4
0.6
0.8
gmz.ist
Teac
hers
' Eva
luat
ions
012
l.asp
notin
d.k
IST by TFR_ind
−10 −5 0 5 10 15
0.2
0.4
0.6
0.8
1.0
gmz.ist
Teac
hers
' Eva
luat
ions
012
l.asp
notr
el.k
IST by TFR_rel
−0.4 −0.2 0.0 0.2 0.4 0.6
0.3
0.5
0.7
0.9
gmz.dnote
Teac
hers
' Eva
luat
ions
012
l.asp
notin
d.k
GPA by TFR_ind
−0.4 −0.2 0.0 0.2 0.4 0.6
0.3
0.4
0.5
0.6
0.7
0.8
0.9
gmz.dnote
Teac
hers
' Eva
luat
ions
0
1
2
l.asp
notr
el.k
GPA by TFR_rel
Figure 4: Marginal e�ects of cross-level interaction terms achievement * TFR.
model 7a, grand-mean centered class-average parental SES has a positive e�ect on theprobability of obtaining a positive teacher evaluation. Also note that the model �t ofthis average-SES-only model is not worse than the �t of the pure achievement models oftable 1. This could be a hint that a similar mechanism of re�ected glory is at work whenteachers 'upgrade' their evaluations in high-SES classes. In any case, our hypothesis H2
is con�rmed.Adding class-level intelligence to the model (model 7a) does downsize the coe�cient
of class-level parental SES more than adding class-level GPA to the model (model 7b)� which could indicate that part of the class-average SES e�ect can be explained bya primary e�ect of social inequality (Boudon, 1974; Breen and Goldthorpe, 1997) thatoperates via intelligence di�erences between classrooms.25 On the other hand, also whenstudent-level intelligence goes into the model, class-average SES remains signi�cant (tobe precise, the e�ect even becomes a bit stronger), and it continues to exert its signi�cantimpact also when the models control for student-level GPA (which is � as in all othertables � by far the strongest predictor of teachers' evaluations). Concerning the cross-
25A mechanism that could account for this fact would be one of selective student-to-classroom sortingby both student intelligence and SES (Rothstein, 2009; Koedel and Betts, 2011).
174
III. Intelligence and Academic Achievement as Contextual-Level Predictors of Teachers' Evaluations
level achievement interaction terms, neither do these coe�cients alter the other modelestimates, nor do we gain new evidence compared to the preceding tables.In models 8a-8h (appendix, tables G and H), we add the remaining student-level co-
variates to the models from models 7a-7g. While the e�ect of class-average parentalSES on teachers' evaluations remains signi�cant in all of these models26, regarding thestudent-level covariates, we do not �nd remarkable �ndings compared to the models with-out a class-level SES term. Whereas the cross-level interaction term between class-levelintelligence and student-level intelligence remains insigni�cant, the cross-level interac-tion term between class-level and student level GPA is signi�cant throughout the modelsexcept in model 8h. However, in the latter model, the marginal e�ects as well as theconditional signi�cances for the GPA*gpa interaction term behave similar to the �ndingsreported for table 2.
5 Discussion
Aim of study The objective of the paper at hand was to extend existing research aboutreference-group e�ects on teachers' evaluations. While previous studies based on Swissand German data only analyzed primary school teachers' transition recommendationsas an outcome (Trautwein and Baeriswyl, 2007; Tiedemann and Billmann-Mahecha,2007; Gröhlich and Guill, 2009; Milek et al., 2009), we aimed to shed light on poten-tial reference-group e�ects regarding the emergence of German 10th class Gymnasium(i.e. highest track) teachers' evaluations of their students' prospective aptitude for aca-demic studies at university. Dai and Rinn (2008) noted for classical Big-Fish-Little-PondE�ect (BFLPE) studies analyzing the e�ect of class-average achievement on students'self-concept that previous research has lacked a �speci�cation of contexts where theBFLPE is more or less likely to occur� (p. 297). This is even more valid with regard toother outcomes such as teachers' recommendations or evaluations. Whereas in BFLPEresearch, at least moderator e�ects of student achievement (Marsh et al., 1995; Marshand Rowe, 1996; Marsh et al., 2001; Marsh and Hau, 2003) and of teachers' frames ofreference (TFR; Lüdtke et al., 2005) have been tested, similar analyses regarding teach-ers' evaluations as an outcome are lacking. Hence, we �rst tested whether potentialreference-group e�ects in terms of class-average achievement on teachers' evaluationsvary by students' achievement levels or TFRs in terms of teachers' more individualistor relational grading concepts, respectively.Apart from these theoretical issues, our methodological contribution to the advance-
ment of reference-group research was that we applied a more complex multilevel designwherein we regarded multiple teachers' evaluations of multiple students to be the lowestunit nested in both teacher and student contexts with school classes as an additionalhigher-level unit of analysis.
26Note that the e�ect of class-mean SES tends to increase when students' gender is controlled for. Wewill come back to this point in the discussion section.
175
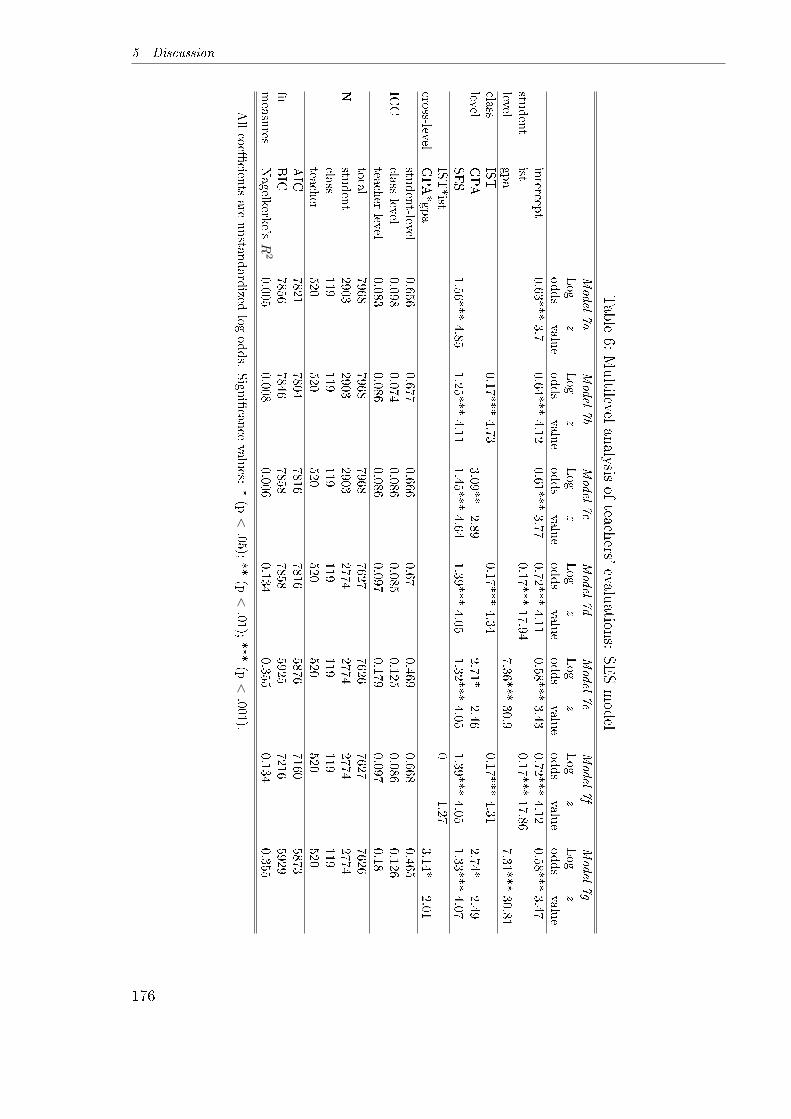
5 Discussion
Table
6:Multilevel
analysisof
teachers'evaluations:
SESmodel
Model
7a
Model
7b
Model
7c
Model
7d
Model
7e
Model
7f
Model
7g
Log-
odds
z-value
Log-
odds
z-value
Log-
odds
z-value
Log-
odds
z-value
Log-
odds
z-value
Log-
odds
z-value
Log-
odds
z-valu
eintercep
t0.63***3.7
0.64***4.12
0.61***3.77
0.72***4.11
0.58***3.43
0.72***4.12
0.58***3.47
student
ist0.17***17.94
0.17***17.86
levelgpa
7.36***30.9
7.31***30.81
class
IST
0.17***4.73
0.17***4.34
0.17***4.31
levelGPA
3.09**
2.89
2.71*
2.46
2.74*
2.49
SES
1.56***4.85
1.25***4.11
1.45
***4.64
1.39***4.05
1.32***4.05
1.39***4.05
1.33***4.07
IST*ist
01.27
cross-level
GPA*gpa
3.14*
2.01
student-level
0.656
0.677
0.666
0.67
0.469
0.668
0.465
ICC
class-lev
el0.098
0.074
0.086
0.085
0.125
0.086
0.126
teacher-level
0.083
0.086
0.086
0.097
0.179
0.097
0.18
total
7968
7968
7968
7627
7626
7627
7626
Nstu
dent
2903
2903
2903
2774
2774
2774
2774
class
119
119
119
119
119
119
119
teacher
520
520
520
520
520
520
520
AIC
7821
7804
7816
7816
5876
7160
5873
�t
BIC
7856
7846
7858
7858
5925
7216
5929
measures
Nagelkerk
e'sR
20.005
0.008
0.006
0.134
0.355
0.13
40.3
55
Allcoe�
cients
are
unsta
ndardized
logodds.
Signi�cance
values:
*(p<
.05);**(p<
.01);***(p<
.001).
176
III. Intelligence and Academic Achievement as Contextual-Level Predictors of Teachers' Evaluations
Interpretation of �ndings Based on the initial survey of the Cologne High SchoolPanel (CHiSP ; 1968/69), we found that in contrast to conventional BFLPE researchwith students' self-concept as an outcome (see research overviews by Trautwein andLüdtke, 2005; Dai and Rinn, 2008; Dijkstra et al., 2008; and Marsh et al., 2008), butalso in contrast to more recent reference-group e�ect studies of primary-school teachers'transition recommendations (Tiedemann and Billmann-Mahecha, 2007; Trautwein andBaeriswyl, 2007; Gröhlich and Guill, 2009), 10th class Gymnasium teachers' evaluationsof students' prospective aptitude for university studies (able vs. not able) are positivelya�ected by both students' class-mean intelligence scores and class-mean grade pointaverage (GPA). Hence, teachers are in�uenced by a kind of Halo e�ect (Thorndike, 1920)when evaluating their students; that is, regardless of a student's individual achievement,she gets a better evaluation in a higher-achieving class � and vice versa. This �nding canbe interpreted in a sense that teachers' beliefs about their students are positively a�ectedby a higher-achieving learning environment � a result that contradicts our BFLPE orcontrast hypothesis H1 and supports our RGE hypothesis H3 in its competing line ofreasoning.Although analyses have also shown that given a positive e�ect of class-level achieve-
ment on teachers' evaluations, student-level achievement is a far more important criterionfor teachers in shaping their evaluations � indicated by remarkably higher Pseudo-R2
values � we nonetheless owe the explanation why our results di�er from reference-groupe�ect research on primary-school teachers' transition recommendations that �nds a neg-ative class-average achievement e�ect. As a starting point, note that our analyses di�ersin three important respects from the latter studies: First, as already outlined in thehypotheses section, our data comprises a remarkably selective sample of Gymnasium(i.e. highest secondary track) students only, and possibly teachers are already primedbeforehand in supposing their students to be relatively bright; and if they teach in ahigh-achievement class, the Halo e�ect is fostered by teachers' positive prejudices, andthus it is completely overshadowing negative contrast e�ects. Second, as opposed tomore or less binding primary school teachers' transition recommendations, our outcomeis a non-binding and even anonymous assessment without any direct consequences forstudents' educational life course. Perhaps, teachers more consciously consider the rela-tive academic standing of a student compared to her classmates � which is an implicationof the BFLPE hypothesis � when they know that their decision has a consequential(some would even say irreversible) impact on students' educational course of life. Andthird, our 10th class teachers' evaluations are evidently measured at a later point intime than primary school teachers' transition recommendations. Although conventionalBFLPE research has shown that the latter e�ect tends to be long-lasting (Marsh et al.,2000, 2001, 2007; Marsh and O'Mara, 2010), it is unknown whether the time of mea-surement of teachers' evaluations as an outcome makes a di�erence. Maybe as timegoes by, teachers become more sure in their estimate of student-level ability, and so eachstudent is judged more based on her own achievement than on her relative standing inclass; and thus, the BFLPE is no longer powerful enough to overshadow its conceptualcounterpart.In any way, despite our positive class-level achievement e�ect that stands in contrast
177
5 Discussion
to existing studies up to now, results have also shown in terms of a much higher explainedvariance that student-level achievement is a much more important criterion for teachersin shaping their evaluations.Regarding cross-level interaction e�ects, we found that the e�ect of class-average in-
telligence does not vary by student-level intelligence, but the e�ect of class-average GPAdoes become stronger for students with better marks � which stands in contrast to ourexpectations as outlined in interaction e�ect hypothesis H4. Since the high achieversgain more from teachers' Halo e�ect than the low achievers, and teachers' expectationsmay a�ect students' later achievement (Rosenthal and Jacobson, 1968; Jussim and Har-ber, 2005; Becker, 2010; Birkelbach, 2011), this could result in cumulative educationalinequality in sense of Merton's Matthew e�ect (Merton, 1968).Although, as outlined in our hypotheses section, the alternative interpretation of this
interaction term in that the e�ect of student-level GPA on teachers' evaluations variesby class-level GPA is also possible � which would mean that students' individual achieve-ment becomes more distinct in high achievement contexts �, the marginal e�ects of this(and also of the ist*IST) interaction term show less variance compared to the speci�-cation in our models (cf. �gure A, appendix).Contrarily, we did not �nd evidence for reference-group e�ects to vary by teachers'
grading concepts according to conventional signi�cance thresholds. A graphical inspec-tion revealed that there is an (admittedly insigni�cant) tendency in that the e�ect ofclass-level intelligence on the probability of obtaining a positive teacher evaluation isslightly weaker for teachers who hold a more individualist grading concept, and slightlystronger for teachers who hold a more relational grading concept; while the e�ect ofclass-average GPA is slightly stronger for teachers who hold a more individualist grad-ing concept and slightly weaker for teachers who hold a more relational grading concept.Although apart from signi�cance issues, we would not consider it to be implausible thatfor individualist teachers, class-average intelligence becomes a less important criterionin forming their evaluations, we would have di�culties to explain the latter case, andtherefore simply concede that we are not able to maintain our underlying interactione�ect hypothesis H5.In contrast to Marsh et al. (2000), we were not able to juxtapose potentially coun-
terbalancing negative class-level achievement e�ects and positive class-level SES e�ects.Apart from the aforementioned positive class-average achievement e�ects we found, weadditionally encountered a similarly positive class-average SES e�ect which remains sig-ni�cant throughout all models. This �nding could be due to the fact that the studentsin our sample have been surveyed in 10th class of Gymnasium, and according to relativerisk aversion theory (Breen and Goldthorpe, 1997), the higher a student went on the ed-ucational ladder, the less likely social class di�erences will be able to explain di�erencesin achievement since selection e�ects based on social class have already taken place;and only the most able (or motivated) lower-class students remain in the higher schooltracks. On the other hand, the e�ect of class-level SES becomes even stronger whenadditionally to class-average intelligence, also student-level intelligence is controlled for;and a similar trend can be observed when students' gender is added to the model. Ap-parently, if di�erences within classes with regard to these two student characteristics are
178
III. Intelligence and Academic Achievement as Contextual-Level Predictors of Teachers' Evaluations
ruled out, the 'true' between-class SES e�ect is unmasked.Another issue is worthy of discussion, too: In contrast to both Gröhlich and Guill
(2009) and Milek et al. (2009), we did not �nd contextual-level achievement e�ectsto be mediated by students' individual achievement. But these two studies analyzedreference-group e�ects on explicit (and more binding) primary-school teachers' transi-tion recommendations, and in our case of implicit and non-binding 10th class teachers'evaluations regarding their students' prospective aptitude for academic studies at univer-sity, teachers might be more error-prone in terms of being in�uenced by contextual-levele�ects. Another possible explanation would be that only negative reference-group ef-fects are mediated by student-level achievement but not positive ones, since Halo e�ectspossibly evoke other (e.g. more motivation-related) teacher expectancies than cannotbe explained by student grades.In sum, our result of positive class-level achievement e�ects on teachers' evaluations
indicate to reject our BFLPE hypothesis H1 and to maintain its competitor, the RGEhypothesis in terms of a Halo e�ect (H3). Similarly, we also found a positive e�ect ofclass-average socioeconomic status (SES) � which con�rmed our hypothesis H2, � butwe were not able to juxtapose a potentially still present BFLPE from our RGE whencontrolling for both class-level achievement and SES. Regarding interaction e�ects, wefound that the e�ect of class-level GPA gets stronger with increasing student-level GPA,which contradicts our hypothesis H4. Moreover, we found quite puzzling results forthe variance of class-level IST and GPA by teachers' frames of reference; but as bothmarginal e�ects were not signi�cant, we simply reject our underlying hypothesis H5.
Advice for further studies Taken together, our �ndings lead to a couple of new ques-tions that could be answered in further studies. First, taking Dai and Rinn's (2008)remark for serious, further tests of both student and teacher-level moderators are highlyrecommended. On the one hand, more precise evidence on the mechanisms behind thevariance of reference-group e�ects on teachers' evaluations by student-level achievementhas to be collected. Remarkably, this e�ect only concerned school grades � de�nitelycomprising an evaluative component as well. On the other hand, we noted a quite puz-zling (though insigni�cant) pattern regarding the interaction between class-level achieve-ment and teachers' frames of reference. Further studies should try to operationalize theseframes by survey items that are speci�ed more explicitly in order to collect richer dataon teachers' grading concepts that allows to arrive at conclusions ful�lling conventionalsigni�cance thresholds.Since we observed that the e�ect of class-average achievement is not completely in-
sensitive against controls for students' gender27, prospective research on reference-groupe�ects regarding teachers' evaluations should also include gender composition at theclassroom level in the analysis. Thijs et al. (2010) have shown that the gender compo-
27While based on more recent data, Gröhlich and Guill (2009) found male students to obtain worseevaluations by their teachers (in terms of transition recommendations), in our study, it was justvice versa (controlled for achievement, respectively). A possible explanation could be that teachers'frames of gender-related educational inequality changed over time.
179
References
sition of the classroom is a promising moderator of conventional BFLPE research withstudents' self-concept as an outcome. Although, at least in Germany, two recent studiesobserved students' school grades to be in�uenced neither by same-gender e�ects nor byteachers' gender composition (Neugebauer et al., 2011; Helbig, 2010), an analysis of howteachers' evaluations might be a�ected by particular combinations of a student's gender,a teacher's gender, student-gender composition e�ects in the classroom and maybe eventeacher-gender composition e�ects at school is still missing.In methodological terms, this question could also be answered in the framework of
a cross-classi�ed hierarchical model. While our study simpli�ed analyses by looking atthe dichotomy of students with a positive vs. those with a negative evaluation, otheranalyses with an ordinal factor variable as an outcome could apply an ordered categoricalmultilevel model (Johnson, 1996, 1997; Gelman and Hill, 2007, p. 331f.) in order to useall available information. However, note that these models would have to be employedin a Bayesian framework.
References
Akaike H (1974) A new look at the statistical model identi�cation. IEEE Transactionson Automatic Control 19(6): 716�723.
Alexander K and Eckland BK (1975) Contextual e�ects in the high school attainmentprocess. American Sociological Review 40(3): 402�416.
Alexander KL; Entwisle DR and Thompson MS (1987) School performance, status re-lations, and the structure of sentiment: bringing the teacher back in. American Soci-ological Review 52(5): 665�682.
Alwin DF and Otto LB (1977) High school context e�ects on aspirations. Sociology ofEducation 50(4): 259�273.
Amthauer R (1957) Intelligenz-Struktur-Test. Göttingen: Hogrefe.
Arnold KH; Bos W; Richert P et al. (2007) Schullaufbahnpräferenzen am Ende dervierten Klassenstufe. In: Bos W; Hornberg S; Arnold KH et al. (eds.) IGLU2006 - Schullaufbahnempfehlungen von Lehrkräften für Kinder am Ende der viertenJahrgangsstufe, 271�297. Münster / New York: Waxmann.
Bates D and Maechler M (2009) lme4 - Linear mixed-e�ects models using S4 classes. Rpackage version 0.999375-31.URL: http://cran.r-project.org/web/packages/lme4/index.html
Baumert J; Brunner M; Lüdtke O et al. (2007) Was messen internationale Schulleis-tungsstudien? Resultate kumulativer Wissenserwerbsprozesse. Psychologische Rund-schau 58(2): 118�128.
180

III. Intelligence and Academic Achievement as Contextual-Level Predictors of Teachers' Evaluations
Becker D (2010) The impact of teachers' expectations on students' educational oppor-tunities in the life course. Cologne Graduate School Working Paper Series 1(7).URL: http://econpapers.repec.org/paper/cgrcgsser/01-07.htm
Becker D and Birkelbach K (2010) Intelligenz und Schulleistung als Kontextmerkmale:Big-Fish-Little-Pond- oder Re�ected-Glory-E�ekt? Eine Mehrebenen-Analyse vonLehrerurteilen. In: Beckers T; Birkelbach K; Hagenah J et al. (eds.) Komparativeempirische Sozialforschung, 113�141. Wiesbaden: VS-Verlag.
Becker D and Birkelbach K (2011) Teachers' evaluations and the de�nition of the socialsituation in the classroom. Cologne Graduate School Working Paper Series 2(4).URL: http://ideas.repec.org/p/cgr/cgsser/02-04.html
Birkelbach K (2011) Teacher evaluations over the life course: valid prognosis or self-ful�lling prophecy? In: Mica A; Peisert A and Winczorek J (eds.) Sociology and theUnintended - Robert Merton Revisited, 133�153. Frankfurt a.M.: Peter Lang.
Bos W and Pietsch M (2004) Erste Ergebnisse aus KESS 4. Kurzbericht. Hamburg:Freie und Hansestadt Hamburg.
Bos W; Voss A; Lankes EM et al. (2004) Schullaufbahnempfehlungen von Lehrkräftenfür Kinder am Ende der vierten Jahrgangsstufe. In: Bos W; Lankes EM; Prenzel Met al. (eds.) IGLU. Einige Länder der Bundesrepublik Deutschland im nationalen undinternationalen Vergleich, 191�228. Münster: Wachsmann.
Boudon R (1974) Education, Opportunity and Social Inequality: Changing Prospects inWestern Society. New York: John Wiley & Sons.
Bourdieu P (1986) Distinction: A Social Critique of the Judgement of Taste. London:Routledge.
Bourdieu P and Passeron JC (1990) Reproduction in Education, Society and Culture.London: Sage Publications Ltd.
Brambor T; Clark WR and Golder M (2006) Understanding interaction models: im-proving empirical analyses. Political Analysis 14(1): 63�82.
Brattesani KA; Weinstein RS and Marshall HH (1984) Student perceptions of di�erentialteacher treatment as moderators of teacher expectation e�ects. Journal of EducationalPsychology 76(2): 236�247.
Breen R and Goldthorpe JH (1997) Explaining educational di�erentials: towards a for-mal rational action theory. Rationality and Society 9(3): 275�305.
Brophy JE and Good TL (1974) Teacher - Student Relationships. Causes and Conse-quences. New York: Holt, Rhinehart and Winston.
181
References
Bryk AS and Raudenbush SW (1992) Hierarchical Linear Models. Thousand Oaks, CA:Sage Publications.
Burnham KP and Anderson DR (2002) Model Selection and Multimodel Inference: APractical Information-Theoretical Approach. 2nd edn. New York: Springer.
Burnham KP and Anderson DR (2004) Multimodel inference. Understanding AIC andBIC in model selection. Sociological Methods & Research 33(2): 261�304.
Burton NW and Ramist L (2001) Predicting Success in College: SAT Studies of ClassesGraduating Since 1980. New York: College Board Research Report No. 2001-2.
Camara W (1998) High School Grading Policies. Tech. Rep. RN-04, College Board, NewYork.
Camara W and Echternacht G (2000) The SAT I and high school grades: Utility inpredicting success in college. New York: The College Board.
Camara W; Kimmel E; Scheuneman J et al. (2003) Whose Grades Are In�ated? Tech.Rep. RN-10, College Board, New York.
Chanal J; Marsh HW; Sarrazin P et al. (2005) Big-�sh-little-pond e�ects on gymnasticsself-concept: social comparison processes in a physical setting. Journal of Sport andExercise Psychology 27(1): 53�70.
Cialdini RB; Borden RJ; Thorne A et al. (1976) Basking in re�ected glory: three (foot-ball) �eld studies. Journal of Personality and Social Psychology 34(3): 366�375.
Coleman JM and Fults BA (1985) Special-class placement, level of intelligence, and theself-concepts of gifted children: a social comparison perspective. Remedial and SpecialEducation 6(1): 8�10.
Dai DY and Rinn AN (2008) The big-�sh-little-pond e�ect: What do we know andwhere do we go from here? Educational Psychology Review 20(3): 283�317.
Davis JA (1966) The campus as a frog pond: an application of the theory of relativedeprivation to career decisions of college men. The American Journal of Sociology72(1): 17�31.
DeLeeuw J (1992) Introduction to Akaike (1973) information theory and an extension ofthe maximum likelihood principle. In: Kotz S and Johnson NL (eds.) Breakthroughsin Statistics, vol. 1, 559�609. London: Springer.
Dijkstra P; Kuyper H; van der Werf G et al. (2008) Social comparison in the classroom:a review. Review of Educational Research 78(4): 828�879.
Downey DB and Pribesh S (2004) When race matters: teachers' evaluations of students'classroom behavior. Sociology of Education 77(4): 267�282.
182
III. Intelligence and Academic Achievement as Contextual-Level Predictors of Teachers' Evaluations
Erikson RS; Goldthorpe JH; Jackson M et al. (2005) On class di�erentials in educationalattainment. Proceedings of the National Academy of Sciences of the United States ofAmerica 102(27): 9730�9733.
Esser H (1999) Soziologie. Spezielle Grundlagen. Bd. 1: Situationslogik und Handeln.Frankfurt / New York: Campus Verlag.
Farkas G; Grobe RP; Sheehan D et al. (1990) Cultural resources and school success:gender, ethnicity, and poverty groups within an urban school district. AmericanSociological Review 55(1): 127�142.
Friedrich RJ (1982) In defense of multiplicative terms in multiple regression equations.American Journal of Political Science 26(4): 797�833.
Gelman A and Hill J (2007) Data Analysis Using Regression and Multilevel/HierarchicalModels. Cambridge: Cambridge University Press.
Goldstein H (1995) Multilevel Statistical Methods. London: Hodder Arnold.
Goldthorpe JH (1996) Class analysis and the reorientation of class theory: the case ofpersisting di�erentials in educational attainment. British Journal of Sociology 47(3):481�505.
Good TL and Brophy JE (2003) Looking in Classrooms. New York: Pearson Education.
Gröhlich C and Guill K (2009) How stable are reference group e�ects of secondaryschool track recommendations? Journal for Educational Research Online/Journal fürBildungsforschung Online 1(1): 154�171.
Helbig M (2010) Sind Lehrerinnen für den geringeren Schulerfolg von Jungen verant-wortlich? Kölner Zeitschrift für Soziologie und Sozialpsychologie 62(1): 93�111.
Hox JJ (2010) Multilevel Analysis - Techniques and Applications. 2nd edn. New Yorkand Hove: Routledge.
Ingenkamp K (1977) Schüler- und Lehrerbeurteilung. Empirische Untersuchungen zurpädagogischen Diagnostik. Weinheim: Beltz Verlag.
Ingenkamp KH (1993) Der Prognosewert von Zensuren, Lehrergutachten, Aufnahmeprü-fungen und Tests während der Grundschulzeit für den Sekundarschulerfolg. In: Ole-chowski R (ed.) Frühe Schulische Auslese, 68�85. Frankfurt: Lang.
Johnson VE (1996) On Bayesian analysis of multirater ordinal data: an application toautomated essay grading. Journal of the American Statistical Association 91(433):42�51.
Johnson VE (1997) An alternative to traditional GPA for evaluating student perfor-mance. Statistical Science 12(4): 251�269.
183
References
Jürges H and Schneider K (2006) Age at school entry and teachers' recommendations forsecondary school track choice in Germany. Paper presented at the 20th annual ESPEconference, 22 - 24 June, 2006, Verona .
Jussim L and Harber KD (2005) Teacher expectations and self-ful�lling prophecies:knowns and unknowns, resolved and unresolved controversies. Personality and SocialPsychology Review 9(2): 131�155.
Koedel C and Betts JR (2011) Does student sorting invalidate value-added models ofteacher e�ectiveness? An extended analysis of the Rothstein critique. EducationFinance and Policy 6(1): 18�42.
Kozlowski SW and Kirsch MP (1987) The systematic distortion hypothesis, halo, andaccuracy: an individual-level analysis. Journal of Applied Psychology 72(2): 252�261.
Kreft IGG; De Leeuw J and Aiken LS (1995) The e�ect of di�erent forms of centeringin hierarchical linear models. Multivariate Behavioral Research 30(1): 1�21.
Kristen C (2006) Ethnische Diskriminierung in der Grundschule? Kölner Zeitschrift fürSoziologie und Sozialpsychologie 58(1): 79�97.
Kuncel NR; Hezlett SA and Ones DS (2001) A comprehensive meta-analysis of thepredictive validity of the Graduate Record Examinations: implications for graduatestudent selection and performance. Psychological Bulletin 127(1): 162�181.
Lehmann RH; Peek R and GänsfuÿR (1997) Aspekte der Lernausgangslage von Schü-lerinnen und Schülern der fünften Klassen an Hamburger Schulen. Bericht über dieUntersuchung im September 1996.
Long JS (1997) Regression Models for Categorical and Limited Dependent Variables.Thousand Oaks, CA: Sage.
Lüdtke O; Köller O; Marsh HW et al. (2005) Teacher frame of reference and the big-�sh-little-pond e�ect. Contemporary Educational Psychology 30(3): 263�285.
Maas CJM and Hox JJ (2005) Su�cient sample sizes for multilevel modeling. Method-ology 1(3): 86�92.
Maaz K; Hausen C; Mcelvany N et al. (2006) Stichwort: Übergänge im Bildungssystem.Zeitschrift für Erziehungswissenschaft 9(3): 299�327.
Marsh HW (1987) The big-�sh-little-pond e�ect on academic self-concept. Journal ofEducational Psychology 79(3): 280�295.
Marsh HW (1991) The failure of high ability high schools to deliver academic bene-�ts: the importance of academic self-concept and educational aspirations. AmericanEducational Research Journal 28(2): 445�480.
184

III. Intelligence and Academic Achievement as Contextual-Level Predictors of Teachers' Evaluations
Marsh HW; Chessor D; Craven RG et al. (1995) The e�ects of gifted and talentedprograms on academic self-concept: The big �sh strikes again. American EducationalResearch Journal 32(2): 285�319.
Marsh HW; Chit-Kwong K and Kit-Tai H (2000) Longitudinal multilevel models ofthe big-�sh-little-pond e�ect on academic self-concept: counterbalancing contrast andre�ected-glory e�ects in Hong Kong schools. Journal of Personality and Social Psy-chology 78(2): 337�349.
Marsh HW and Craven RG (2006) Reciprocal e�ects of self-concept and performancefrom a multidimensional perspective: beyond seductive pleasure and unidimensionalperspectives. Perspectives on Psychological Science 1(2): 133�163.
Marsh HW and Hau KT (2003) Big-�sh-little-pond e�ect on academic self-concept: across-cultural (26-country) test of the negative e�ects of academically selective schools.American Psychologist 58(5): 364�376.
Marsh HW; Köller O and Baumert J (2001) Reuni�cation of East and West Germanschool systems: longitudinal multilevel modeling study of the big-�sh-little-pond e�ecton academic self-concept. American Educational Research Journal 38(2): 321�350.
Marsh HW and O'Mara AJ (2010) Long-term total negative e�ects of school-averageability on diverse educational outcomes. Zeitschrift für Pädagogische Psychologie24(1): 51�72.
Marsh HW and Parker JW (1984) Determinants of student self-concept: Is it betterto be a relatively large �sh in a small pond even if you don't learn to swim as well?Journal of Personality and Social Psychology 47(1): 213�231.
Marsh HW and Rowe KJ (1996) The negative e�ects of school-average ability on aca-demic self-concepts: an application of multilevel modelling. Australian Journal ofEducation 40(1): 65�87.
Marsh HW; Seaton M; Trautwein U et al. (2008) The big-�sh�little-pond-e�ect standsup to critical scrutiny: implications for theory, methodology, and future research.Educational Psychology Review 20(3): 319�350.
Marsh HW; Trautwein U; Lüdtke O et al. (2005) Academic self-concept, interest, grades,and standardized test scores: reciprocal e�ects models of causal ordering. Child De-velopment 76(2): 397�416.
Marsh HW; Trautwein U; Lüdtke O et al. (2007) The big-�sh-little-pond e�ect: persis-tent negative e�ects of selective high schools on self-concept after graduation. Amer-ican Educational Research Journal 44(3): 631�669.
McFarland C and Buehler R (1995) Collective self-esteem as a moderator of the frog-pond e�ect in reactions to performance feedback. Journal of Personality and SocialPsychology 68(6): 1055�1070.
185
References
Mechtenberg L (2009) Cheap talk in the classroom: How biased grading at school ex-plains gender di�erences in achievements, career choices and wages. Review of Eco-nomic Studies 76(4): 1431�1459.
Merton RK (1948) The self-ful�lling prophecy. Antioch Review 8(2): 193�210.
Merton RK (1968) The Matthew e�ect in science. Science 159(3810): 56�63.
Meulemann H (1979) Soziale Herkunft und Schullaufbahn. Arbeitsbuch zur sozialwis-senschaftlichen Methodenlehrer. Frankfurt / New York: Campus Verlag.
Meyer JW (1970) High school e�ects on college intentions. The American Journal ofSociology 76(1): 59�70.
Milek A; Lüdtke O; Trautwein U et al. (2009) Wie konsistent sind Referenzgruppenef-fekte bei der Vergabe von Schulformempfehlungen? Bundeslandspezi�sche Analysenmit Daten der IGLU-Studie. Zeitschrift für Erziehungswissenschaft 12(12): 282�301.
Morgan R (1989) Analyses of the Predictive Validity of the SAT and High School GradesFrom 1976 to 1985. New York: College Board Research Report No. 89-7.
Müller-Benedict V (2007) Wodurch kann die soziale Ungleichheit des Schulerfolgs amstärksten verringert werden? Kölner Zeitschrift für Soziologie und Sozialpsychologie59(4): 615�639.
Muthen BO and Satorra A (1995) Complex sample data in structural equation modeling.Sociological Methodology 25: 267�316.
Neugebauer M; Helbig M and Landmann A (2011) Unmasking the myth of the same-sexteacher advantage. European Sociological Review 27(5): 669�689.
Pallas AM; Entwisle DR; Alexander KL et al. (1994) Ability-group e�ects: instructional,social, or institutional? Sociology of Education 67(1): 27�46.
Pietsch M and Stubbe TC (2007) Inequality in the transition from primary to secondaryschool: school choices and educational disparities in Germany. European EducationalResearch Journal 6(4): 424�445.
Plucker JA; Robinson NM; Greenspon TS et al. (2004) It's not how the pond makes youfeel, but rather how high you can jump. American Psychologist 59(4): 268�269.
Raftery AE (1995) Bayesian model selection in social research. Sociological Methodology25: 111�164.
Raudenbush SW; Yang ML and Yosef M (2000) Maximum likelihood for generalizedlinear models with nested random e�ects via high-order, multivariate Laplace approx-imation. Journal of Computational and Graphical Statistics 9(1): 141�157.
186
III. Intelligence and Academic Achievement as Contextual-Level Predictors of Teachers' Evaluations
Reuman DA (1989) How social comparison mediates the relation between ability-grouping practices and students' achievement expectancies in mathematics. Journalof Educational Psychology 81(2): 178�189.
Rheinberg F (1980) Leistungsbewertung und Lernmotivation. Göttingen: Hogrefe.
Rindermann H and Heller KA (2005) The bene�t of gifted classes and talent schools fordeveloping students' competences and enhancing academic self-concept. Zeitschriftfür Pädagogische Psychologie 19(3): 133�136.
Robbins SB; Lauver K; Le H et al. (2004) Do psychosocial and study skill factors predictcollege outcomes? a meta-analysis. Psychological Bulletin 130(2): 261�288.
Rosenthal R and Jacobson L (1968) Pygmalion in the Classroom: Teacher Expectationand Pupils' Intellectual Development. New York: Holt, Rinehart & Winston.
Rothstein J (2009) Student sorting and bias in value-added estimation: Selection onobservables and unobservables. Education Finance and Policy 4(4): 537�571.
Schwarz G (1978) Estimating the dimension of a model. The Annals of Statistics 6(2):461�464.
Seaton M; Marsh HW and Craven RG (2009) Earning its place as a pan-human theory:universality of the big-�sh-little-pond e�ect across 41 culturally and economicallydiverse countries. Journal of Educational Psychology 101(2): 403�419.
Seaton M; Marsh HW and Craven RG (2010) Big-�sh-little-pond e�ect: generalizabilityand moderation - two sides of the same coin. American Educational Research Journal47(2): 390�433.
Snijders TAB and Bosker RJ (1999) Multilevel Analysis: An Introduction to Basic andAdvanced Multilevel Modeling. London: Sage Publications Ltd.
Stocké V (2007) Explaining educational decision and e�ects of families' social classposition: an empirical test of the Breen Goldthorpe model of educational attainment.European Sociological Review 23(4): 505�519.
Tabachnick BG and Fidell LS (2007) Using Multivariate Statistics. 5 edn. Boston, Mass:Pearson Education.
Thijs J; Verkuyten M and Helmond P (2010) A further examination of the big-�sh-little-pond e�ect. Sociology of Education 83(4): 333�345.
Thorndike EL (1920) A constant error in psychological ratings. Journal of AppliedPsychology 4(1): 25�29.
Tiedemann J and Billmann-Mahecha E (2007) Zum Ein�uss von Migration und Schulk-lassenzugehörigkeit auf die Übergangsempfehlung für die Sekundarstufe I. Zeitschriftfür Erziehungswissenschaft 10(1): 108�120.
187
References
Trautwein U and Baeriswyl F (2007) Wenn leistungsstarke Klassenkameraden einNachteil sind. Zeitschrift für Pädagogische Psychologie 21(2): 119�133.
Trautwein U; Gerlach E and Lüdtke O (2008) Athletic classmates, physical self-concept,and free-time physical activity: a longitudinal study of frame of reference e�ects.Journal of Educational Psychology 100(4): 988�1001.
Trautwein U and Lüdtke O (2005) The big-�sh-little-pond e�ect. Future research ques-tions and educational implications. Zeitschrift für Pädagogische Psychologie 19(3):137�140.
Trautwein U; Lüdtke O; Marsh HW et al. (2006) Tracking, grading, and student mo-tivation: using group composition and status to predict self-concept and interest inninth-grade mathematics. Journal of Educational Psychology 98(4): 788�806.
Trautwein U; Lüdtke O; Marsh HW et al. (2009) Within-school social comparison: Howstudents perceive the standing of their class predicts academic self-concept. Journalof Educational Psychology 101(4): 853�866.
Vuong QH (1989) Likelihood ratio tests for model selection and non-nested hypotheses.Econometrica: Journal of the Econometric Society 57(2): 307�333.
Zeidner M and Schleyer EJ (1998) The big-�sh-little-pond e�ect for academic self-concept, test anxiety, and school grades in gifted children. Contemporary EducationalPsychology 24(4): 305�329.
188

III. Intelligence and Academic Achievement as Contextual-Level Predictors of Teachers' Evaluations
6 Appendix
Table A: Descriptive statistics of independent variablescount mean sd min max
ist (student-level intelligence, group-mean centered) 16819 0.01 10.45 -35.59 37.17gpa (student-level GPA, group-mean centered) 16820 0.00 0.45 -1.35 1.73ses (student-level SES, group-mean centered) 16833 0.00 1.19 -3.52 3.19aspir (student-level aspirations) 16796 0.68 0.47 0.00 1.00sex (student-level gender) 17689 0.54 0.50 0.00 1.00IST (class-level intelligence, grand-mean centered) 17689 -0.12 4.45 -9.37 10.20GPA (class-level GPA, grand-mean centered) 17689 -0.00 0.15 -0.43 0.40SES (class-level SES, grand-mean centered) 17689 0.01 0.52 -1.27 1.46TFR(ind) (Teachers' frame of reference: individualist) 17626 0.22 0.59 0.00 2.00TFR(rel) (Teachers' frame of reference: relational) 17626 0.10 0.42 0.00 2.00
189
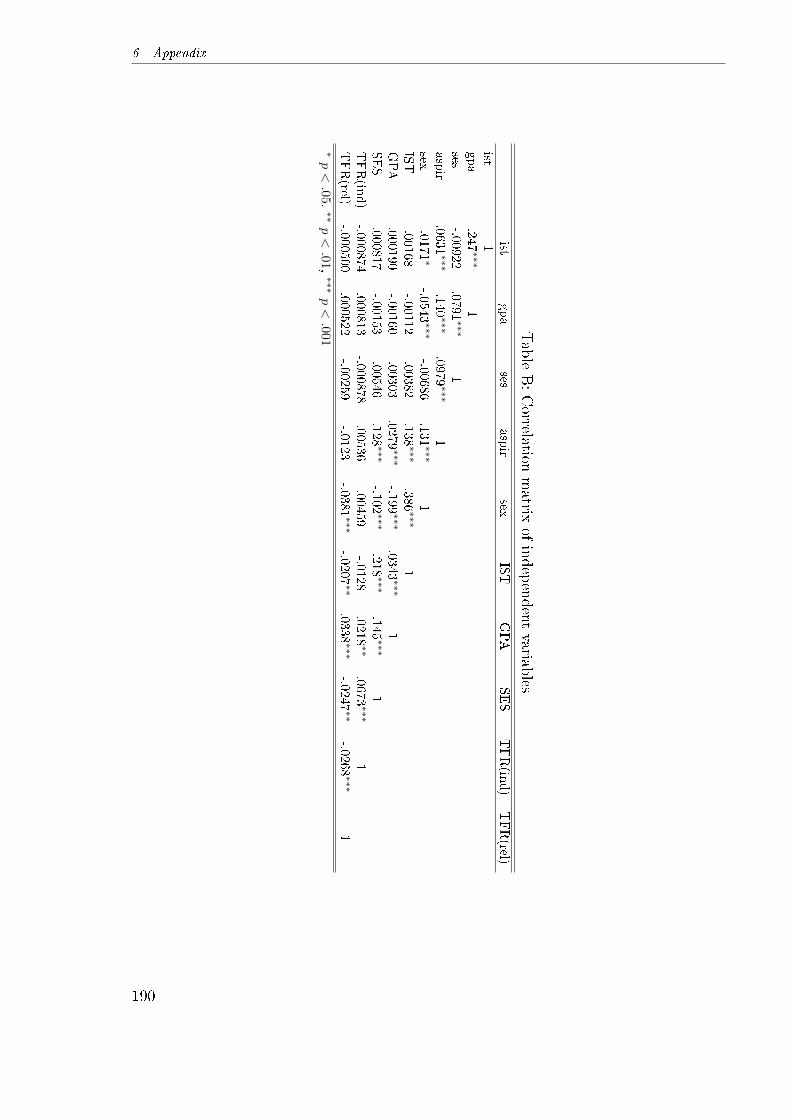
6 Appendix
Table
B:Correlation
matrix
ofindep
endentvariables
istgpa
sesaspir
sexIST
GPA
SES
TFR(in
d)
TFR(rel)
ist1
gpa
.247∗∗∗
1ses
-.00922
.0791∗∗∗
1aspir
.0631∗∗∗
.140∗∗∗
.0979∗∗∗
1sex
.0171∗
-.0543∗∗∗
-.00686
.131∗∗∗
1IST
.00168
-.00112
.00382
.138∗∗∗
.386∗∗∗
1GPA
.000190
-.00160
.00303
.0279∗∗∗
-.199∗∗∗
.0343∗∗∗
1SES
.000817
-.00153
.00546
.128∗∗∗
-.102∗∗∗
.218∗∗∗
.145∗∗∗
1TFR(in
d)
-.000874
.000813
-.000878
.00536
.00459
-.0128
.0218∗∗
.0673∗∗∗
1TFR(rel)
-.000500
.000522
-.00259
-.0123
-.0381∗∗∗
-.0207∗∗
.0338∗∗∗
-.0247∗∗
-.0268∗∗∗
1∗p<.05
,∗∗p<.01,∗∗∗
p<.001
190
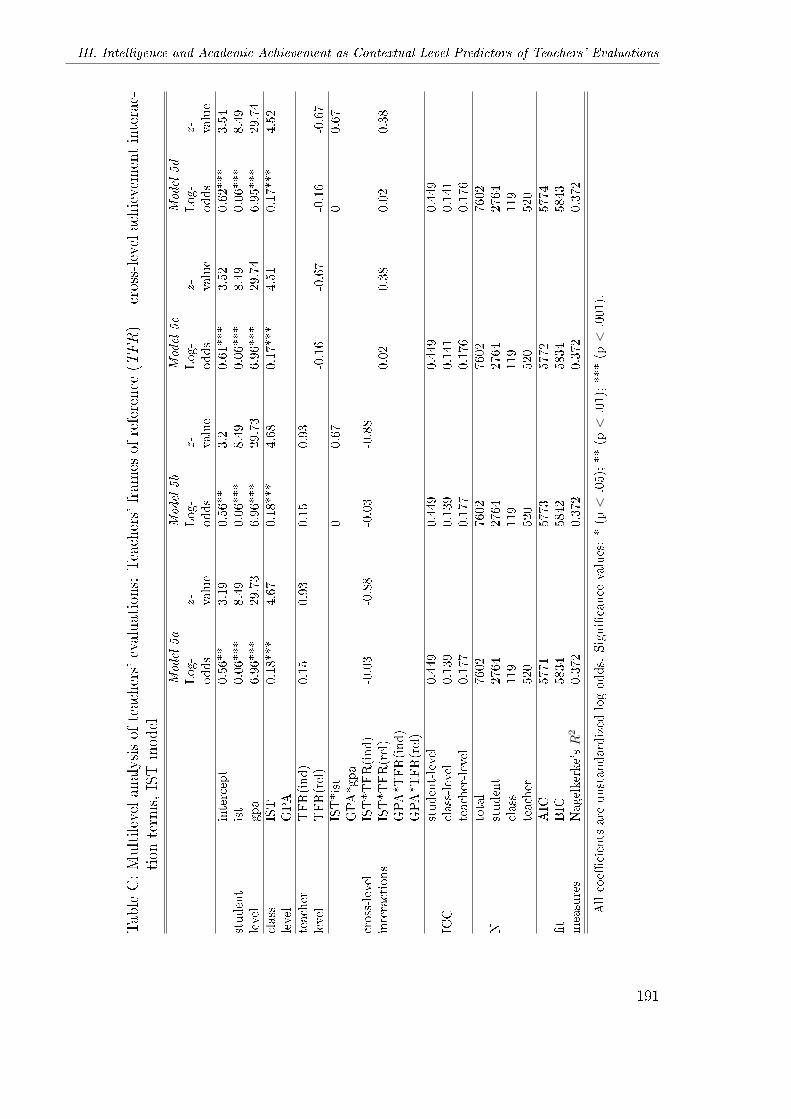
III. Intelligence and Academic Achievement as Contextual-Level Predictors of Teachers' Evaluations
TableC:Multilevelanalysisof
teachers'evaluations:Teachers'fram
esof
reference(T
FR)+cross-levelachievem
entinterac-
tion
term
s,ISTmodel
Model
5a
Model
5b
Model
5c
Model
5d
Log-
odds
z-value
Log-
odds
z-value
Log-
odds
z-value
Log-
odds
z-value
intercept
0.56**
3.19
0.56**
3.2
0.61***
3.52
0.62***
3.54
student
ist
0.06***
8.49
0.06***
8.49
0.06***
8.49
0.06***
8.49
level
gpa
6.96***
29.73
6.96***
29.73
6.96***
29.74
6.95***
29.74
class
IST
0.18***
4.67
0.18***
4.68
0.17***
4.51
0.17***
4.52
level
GPA
teacher
TFR(ind)
0.15
0.93
0.15
0.93
level
TFR(rel)
-0.16
-0.67
-0.16
-0.67
IST*ist
00.67
00.67
GPA*gpa
cross-level
IST*TFR(ind)
-0.03
-0.88
-0.03
-0.88
interactions
IST*TFR(rel)
0.02
0.38
0.02
0.38
GPA*TFR(ind)
GPA*TFR(rel)
student-level
0.449
0.449
0.449
0.449
ICC
class-level
0.139
0.139
0.141
0.141
teacher-level
0.177
0.177
0.176
0.176
total
7602
7602
7602
7602
Nstudent
2764
2764
2764
2764
class
119
119
119
119
teacher
520
520
520
520
AIC
5771
5773
5772
5774
�t
BIC
5834
5842
5834
5843
measures
Nagelkerke'sR
20.372
0.372
0.372
0.372
Allcoe�
cients
are
unstandardized
logodds.
Signi�cance
values:*(p<
.05);**(p<
.01);***(p<
.001).
191
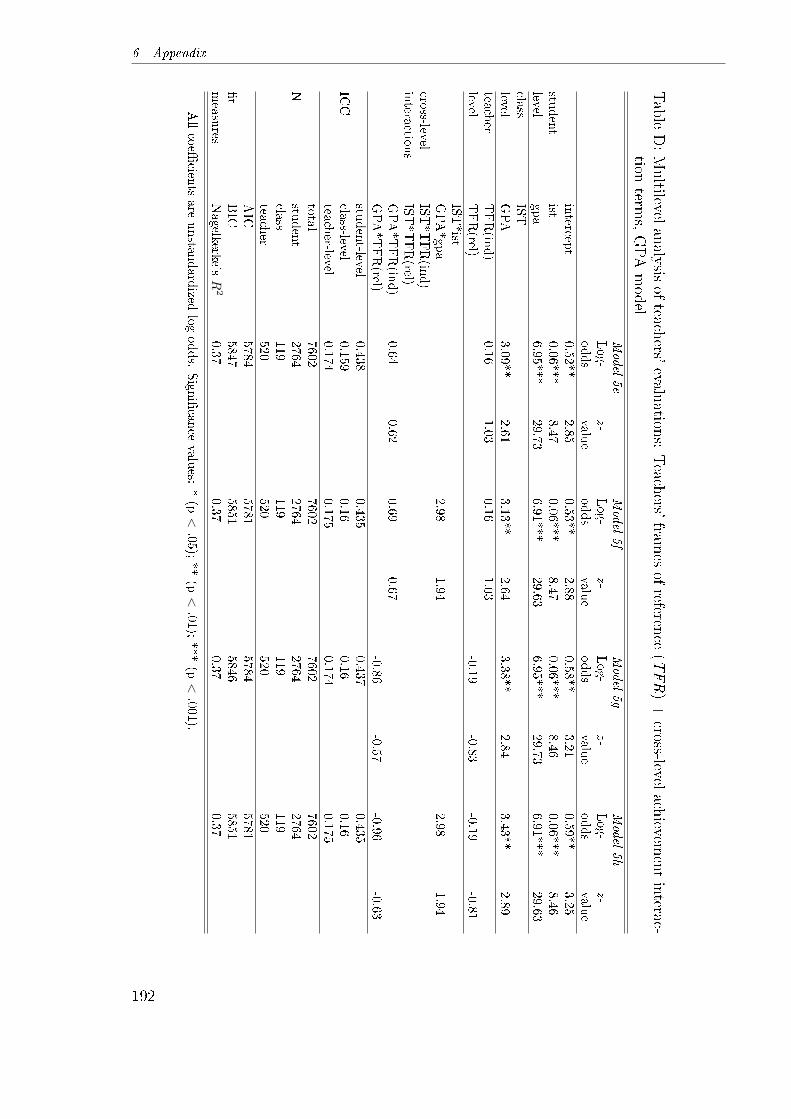
6 Appendix
Table
D:Multilevel
analysisofteachers'
evaluations:Teachers'
frames
ofreference
(TFR)+cross-level
achievement
interac-tion
terms,GPAmodel
Model
5e
Model
5f
Model
5g
Model
5h
Log-
odds
z-value
Log-
odds
z-value
Log-
odds
z-value
Log-
odds
z-value
intercep
t0.52**
2.85
0.53**
2.88
0.58**
3.21
0.59**
3.25
student
ist0.06***
8.47
0.06***
8.47
0.06***
8.46
0.06***
8.46
levelgpa
6.95***
29.73
6.91***
29.63
6.95***
29.73
6.91***
29.63
class
IST
levelGPA
3.09**
2.61
3.13**
2.64
3.38**
2.84
3.43**
2.89
teacher
TFR(in
d)
0.16
1.03
0.16
1.03
levelTFR(rel)
-0.19
-0.83
-0.19
-0.81
IST*ist
GPA*gpa
2.98
1.94
2.98
1.94
cross-level
IST*TFR(in
d)
intera
ctions
IST*TFR(rel)
GPA*TFR(in
d)
0.64
0.62
0.69
0.67
GPA*TFR(rel)
-0.86
-0.57
-0.96
-0.63
student-level
0.438
0.435
0.437
0.435
ICC
class-level
0.159
0.16
0.16
0.16
teacher-level
0.174
0.175
0.174
0.175
total
7602
7602
7602
7602
Nstu
dent
2764
2764
2764
2764
class
119
119
119
119
teacher
520
520
520
520
AIC
5784
5781
5784
5781
�t
BIC
5847
5851
5846
5851
measures
Nagelkerke's
R2
0.37
0.37
0.37
0.37
Allcoe�
cients
are
unsta
ndardized
logodds.
Signi�cance
values:
*(p<
.05);**(p<
.01);***(p<
.001).
192
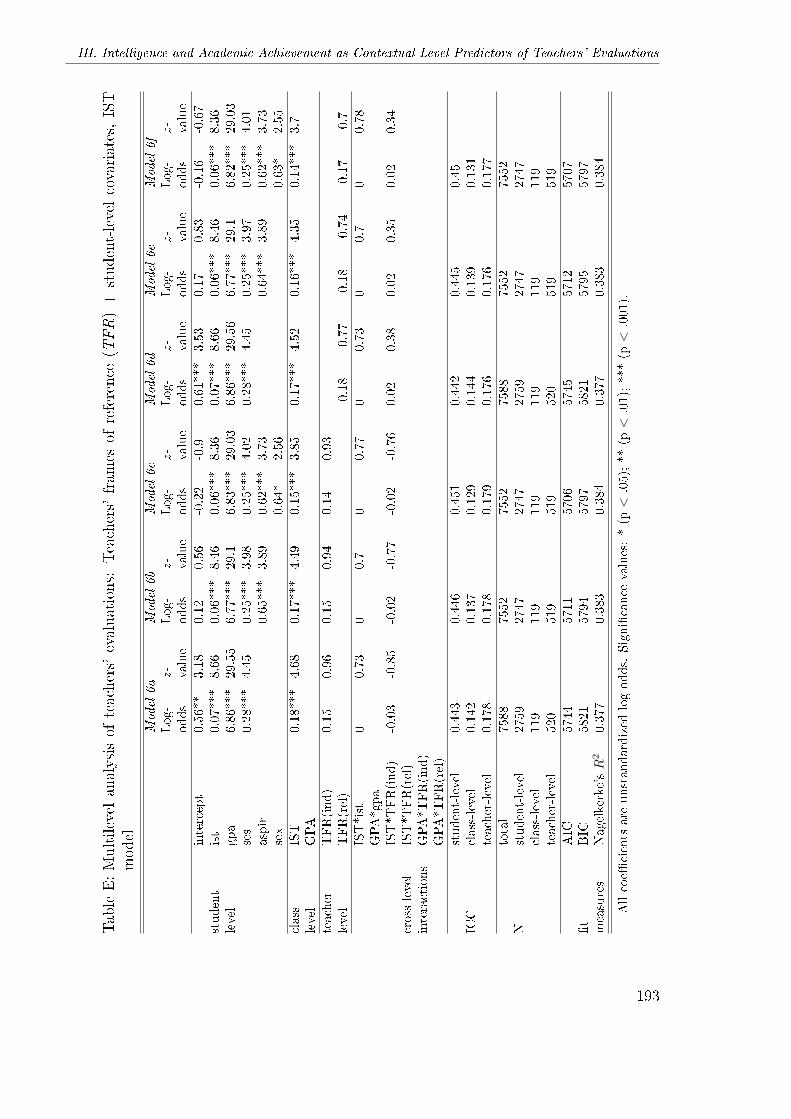
III. Intelligence and Academic Achievement as Contextual-Level Predictors of Teachers' Evaluations
TableE:Multilevelanalysisof
teachers'evaluations:
Teachers'fram
esof
reference(T
FR)+
student-levelcovariates,IST
model
Model
6a
Model
6b
Model
6c
Model
6d
Model
6e
Model
6f
Log-
odds
z-value
Log-
odds
z-value
Log-
odds
z-value
Log-
odds
z-value
Log-
odds
z-value
Log-
odds
z-value
intercept
0.56**
3.18
0.12
0.56
-0.22
-0.9
0.61***
3.53
0.17
0.83
-0.16
-0.67
student
ist
0.07***
8.66
0.06***
8.46
0.06***
8.36
0.07***
8.66
0.06***
8.46
0.06***
8.36
level
gpa
6.86***
29.55
6.77***
29.1
6.83***
29.03
6.86***
29.56
6.77***
29.1
6.82***
29.03
ses
0.28***
4.45
0.25***
3.98
0.25***
4.02
0.28***
4.45
0.25***
3.97
0.25***
4.01
aspir
0.65***
3.89
0.62***
3.73
0.64***
3.89
0.62***
3.73
sex
0.64*
2.56
0.63*
2.55
class
IST
0.18***
4.68
0.17***
4.49
0.15***
3.85
0.17***
4.52
0.16***
4.35
0.14***
3.7
level
GPA
teacher
TFR(ind)
0.15
0.96
0.15
0.94
0.14
0.93
level
TFR(rel)
-0.18
-0.77
-0.18
-0.74
-0.17
-0.7
IST*ist
00.73
00.7
00.77
00.73
00.7
00.78
GPA*gpa
IST*TFR(ind)
-0.03
-0.85
-0.02
-0.77
-0.02
-0.76
0.02
0.38
0.02
0.35
0.02
0.34
cross-level
IST*TFR(rel)
interactions
GPA*TFR(ind)
GPA*TFR(rel)
student-level
0.443
0.446
0.451
0.442
0.445
0.45
ICC
class-level
0.142
0.137
0.129
0.144
0.139
0.131
teacher-level
0.178
0.178
0.179
0.176
0.176
0.177
total
7588
7552
7552
7588
7552
7552
Nstudent-level
2759
2747
2747
2759
2747
2747
class-level
119
119
119
119
119
119
teacher-level
520
519
519
520
519
519
AIC
5744
5711
5706
5745
5712
5707
�t
BIC
5821
5794
5797
5821
5795
5797
measures
Nagelkerke'sR
20.377
0.383
0.384
0.377
0.383
0.384
Allcoe�
cients
are
unstandardized
logodds.
Signi�cance
values:*(p<
.05);**(p<
.01);***(p<
.001).
193
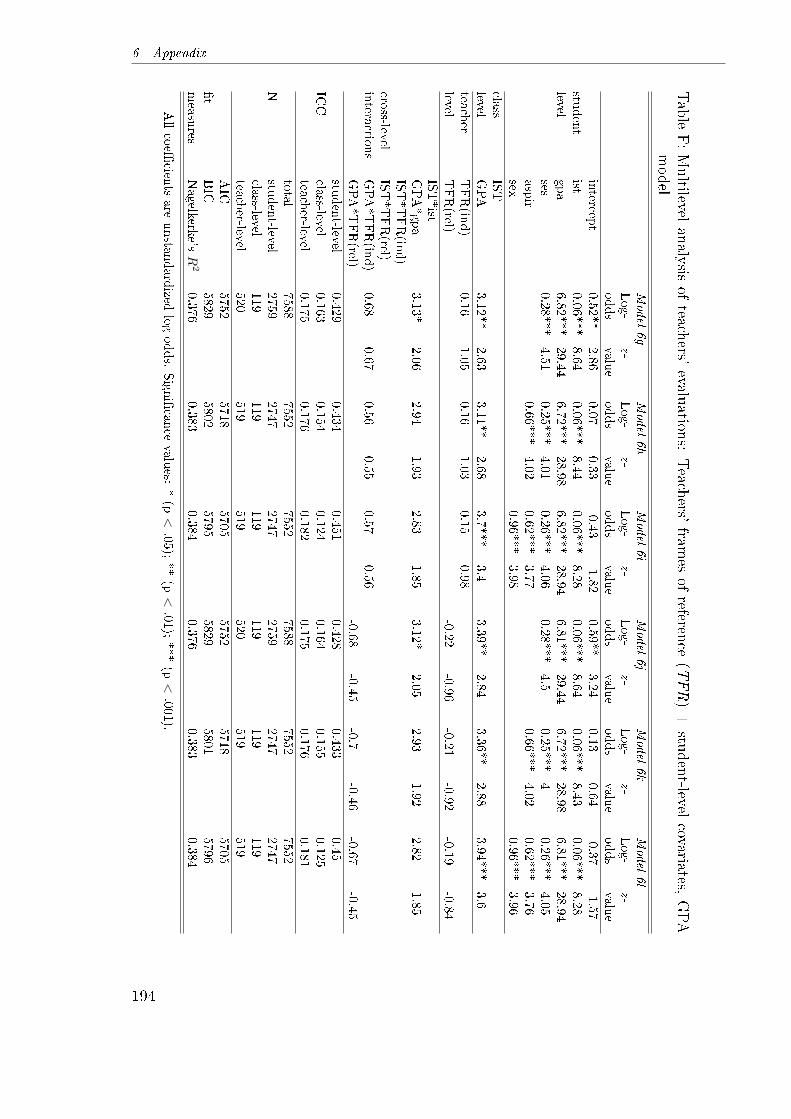
6 Appendix
Table
F:Multilevel
analysisof
teachers'evaluations:
Teachers'
frames
ofreference
(TFR)+
student-levelcovariates,
GPA
model
Model
6g
Model
6h
Model
6i
Model
6j
Model
6k
Model
6l
Log-
odds
z-valu
eLog-
odds
z-value
Log-
odds
z-value
Log-
odds
z-value
Log-
odds
z-value
Log-
odds
z-value
intercep
t0.52**
2.86
0.07
0.33
-0.43
-1.82
0.59**
3.24
0.13
0.64
-0.37
-1.57
student
ist0.06***
8.64
0.06***
8.44
0.06***
8.28
0.06***
8.64
0.06***
8.43
0.06***
8.28
levelgpa
6.82***
29.44
6.72***
28.98
6.82***
28.94
6.81***
29.44
6.72***
28.98
6.81***
28.94
ses0.28***
4.51
0.25***
4.01
0.26***
4.06
0.28***
4.5
0.25***
40.26***
4.05
aspir
0.66***
4.02
0.62***
3.77
0.66***
4.02
0.62***
3.76
sex0.96***
3.98
0.96***
3.96
class
IST
levelGPA
3.12**
2.63
3.11**
2.68
3.7***
3.4
3.39**
2.84
3.36**
2.88
3.94***
3.6
teacher
TFR(in
d)
0.16
1.05
0.16
1.03
0.15
0.98
levelTFR(rel)
-0.22
-0.96
-0.21
-0.92
-0.19
-0.84
IST*ist
GPA*gpa
3.13*
2.06
2.94
1.93
2.83
1.85
3.12*
2.05
2.93
1.92
2.82
1.85
IST*TFR(in
d)
cross-level
IST*TFR(rel)
intera
ctions
GPA*TFR(in
d)
0.68
0.67
0.56
0.55
0.57
0.56
GPA*TFR(rel)
-0.68
-0.45
-0.7
-0.46
-0.67
-0.45
student-lev
el0.429
0.434
0.451
0.428
0.433
0.45
ICC
class-level
0.163
0.154
0.124
0.164
0.155
0.125
teacher-level
0.175
0.176
0.182
0.175
0.176
0.181
total
7588
7552
7552
7588
7552
7552
Nstu
dent-lev
el2759
2747
2747
2759
2747
2747
class-level
119
119
119
119
119
119
teacher-level
520
519
519
520
519
519
AIC
5752
5718
5705
5752
5718
5705
�t
BIC
5829
5802
5795
5829
5801
5796
measures
Nagelk
erke'sR
20.376
0.383
0.384
0.376
0.38
30.384
Allcoe�
cients
are
unsta
ndardized
logodds.
Signi�cance
values:
*(p<
.05);**(p<
.01);***(p<
.001).
194
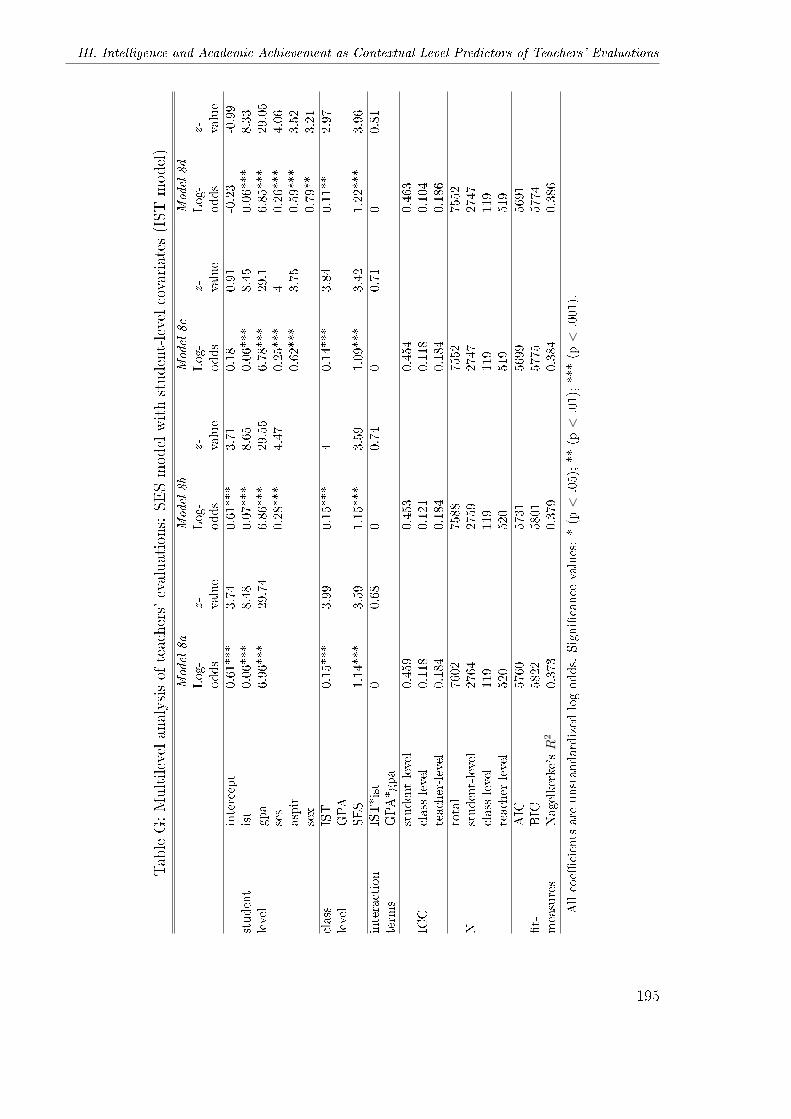
III. Intelligence and Academic Achievement as Contextual-Level Predictors of Teachers' Evaluations
TableG:Multilevelanalysisof
teachers'evaluations:
SESmodelwithstudent-levelcovariates
(IST
model)
Model
8a
Model
8b
Model
8c
Model
8d
Log-
odds
z-value
Log-
odds
z-value
Log-
odds
z-value
Log-
odds
z-value
intercept
0.61***
3.74
0.61***
3.71
0.18
0.91
-0.23
-0.99
student
ist
0.06***
8.48
0.07***
8.65
0.06***
8.45
0.06***
8.33
level
gpa
6.96***
29.74
6.86***
29.55
6.78***
29.1
6.85***
29.05
ses
0.28***
4.47
0.25***
40.26***
4.06
aspir
0.62***
3.75
0.59***
3.52
sex
0.79**
3.21
class
IST
0.15***
3.99
0.15***
40.14***
3.84
0.11**
2.97
level
GPA
SES
1.14***
3.59
1.15***
3.59
1.09***
3.42
1.22***
3.96
interaction
IST*ist
00.68
00.74
00.71
00.81
term
sGPA*gpa
student-level
0.459
0.453
0.454
0.463
ICC
class-level
0.118
0.121
0.118
0.104
teacher-level
0.184
0.184
0.184
0.186
total
7602
7588
7552
7552
Nstudent-level
2764
2759
2747
2747
class-level
119
119
119
119
teacher-level
520
520
519
519
AIC
5760
5731
5699
5691
�t-
BIC
5822
5801
5775
5774
measures
Nagelkerke'sR
20.373
0.379
0.384
0.386
Allcoe�
cients
are
unstandardized
logodds.
Signi�cance
values:*(p<
.05);**(p<
.01);***(p<
.001).
195
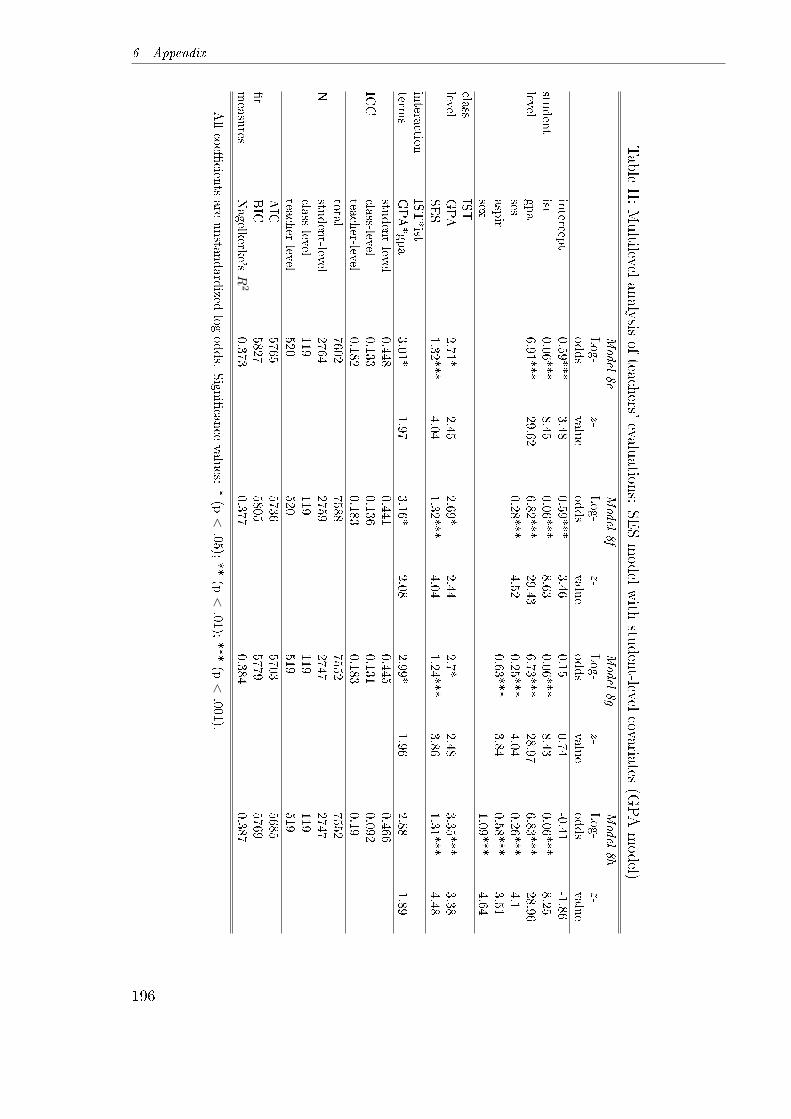
6 Appendix
Table
H:Multilevel
analysisof
teachers'evaluations:
SESmodel
with
student-levelcovariates
(GPAmodel)
Model
8e
Model
8f
Model
8g
Model
8h
Log-
odds
z-value
Log-
odds
z-value
Log-
odds
z-value
Log-
odds
z-value
intercep
t0.59***
3.48
0.59***
3.46
0.15
0.74
-0.41
-1.86
student
ist0.06***
8.45
0.06***
8.63
0.06***
8.43
0.06***
8.25
levelgpa
6.91***
29.62
6.82***
29.43
6.73***
28.97
6.83***
28.96
ses0.28***
4.52
0.25***
4.04
0.26***
4.1
aspir
0.63***
3.84
0.58***
3.51
sex1.09***
4.64
class
IST
levelGPA
2.71*
2.45
2.69*
2.44
2.7*
2.48
3.35***
3.38
SES
1.32***
4.04
1.32***
4.04
1.24***
3.86
1.31***
4.48
intera
ction
IST*ist
terms
GPA*gpa
3.01*
1.97
3.16*
2.08
2.99*
1.96
2.88
1.89
student-level
0.448
0.441
0.445
0.466
ICC
class-lev
el0.133
0.136
0.131
0.092
teacher-level
0.182
0.183
0.183
0.19
total
7602
7588
7552
7552
Nstu
dent-level
2764
2759
2747
2747
class-level
119
119
119
119
teacher-level
520
520
519
519
AIC
5765
5736
5703
5685
�t
BIC
5827
5805
5779
5769
measures
Nagelk
erke's
R2
0.373
0.377
0.384
0.387
Allcoe�
cients
are
unsta
ndardized
logodds.
Signi�cance
values:
*(p<
.05);**(p<
.01);***(p<
.001).
196
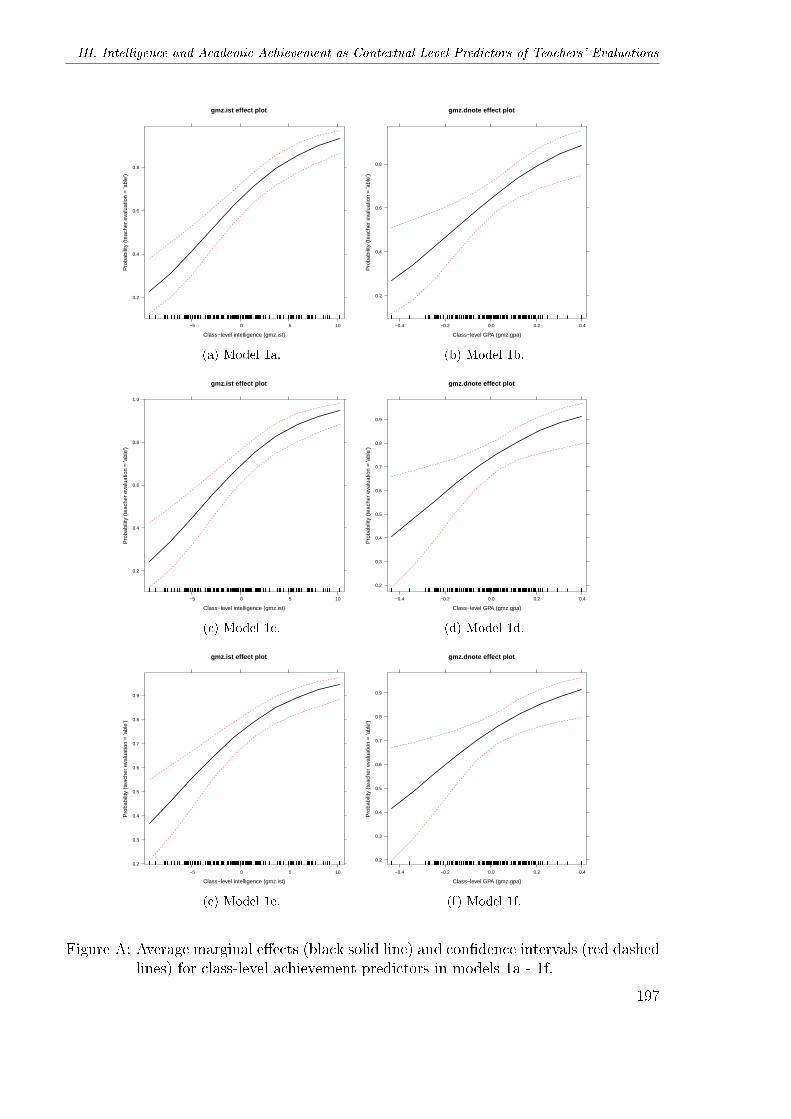
III. Intelligence and Academic Achievement as Contextual-Level Predictors of Teachers' Evaluations
gmz.ist effect plot
Class−level intelligence (gmz.ist)
Pro
babi
lity
(tea
cher
eva
luat
ion
= 'a
ble'
)
0.2
0.4
0.6
0.8
−5 0 5 10
(a) Model 1a.
gmz.dnote effect plot
Class−level GPA (gmz.gpa)
Pro
babi
lity
(tea
cher
eva
luat
ion
= 'a
ble'
)
0.2
0.4
0.6
0.8
−0.4 −0.2 0.0 0.2 0.4
(b) Model 1b.
gmz.ist effect plot
Class−level intelligence (gmz.ist)
Pro
babi
lity
(tea
cher
eva
luat
ion
= 'a
ble'
)
0.2
0.4
0.6
0.8
1.0
−5 0 5 10
(c) Model 1c.
gmz.dnote effect plot
Class−level GPA (gmz.gpa)
Pro
babi
lity
(tea
cher
eva
luat
ion
= 'a
ble'
)
0.2
0.3
0.4
0.5
0.6
0.7
0.8
0.9
−0.4 −0.2 0.0 0.2 0.4
(d) Model 1d.
gmz.ist effect plot
Class−level intelligence (gmz.ist)
Pro
babi
lity
(tea
cher
eva
luat
ion
= 'a
ble'
)
0.2
0.3
0.4
0.5
0.6
0.7
0.8
0.9
−5 0 5 10
(e) Model 1e.
gmz.dnote effect plot
Class−level GPA (gmz.gpa)
Pro
babi
lity
(tea
cher
eva
luat
ion
= 'a
ble'
)
0.2
0.3
0.4
0.5
0.6
0.7
0.8
0.9
−0.4 −0.2 0.0 0.2 0.4
(f) Model 1f.
Figure A: Average marginal e�ects (black solid line) and con�dence intervals (red dashedlines) for class-level achievement predictors in models 1a - 1f.
197
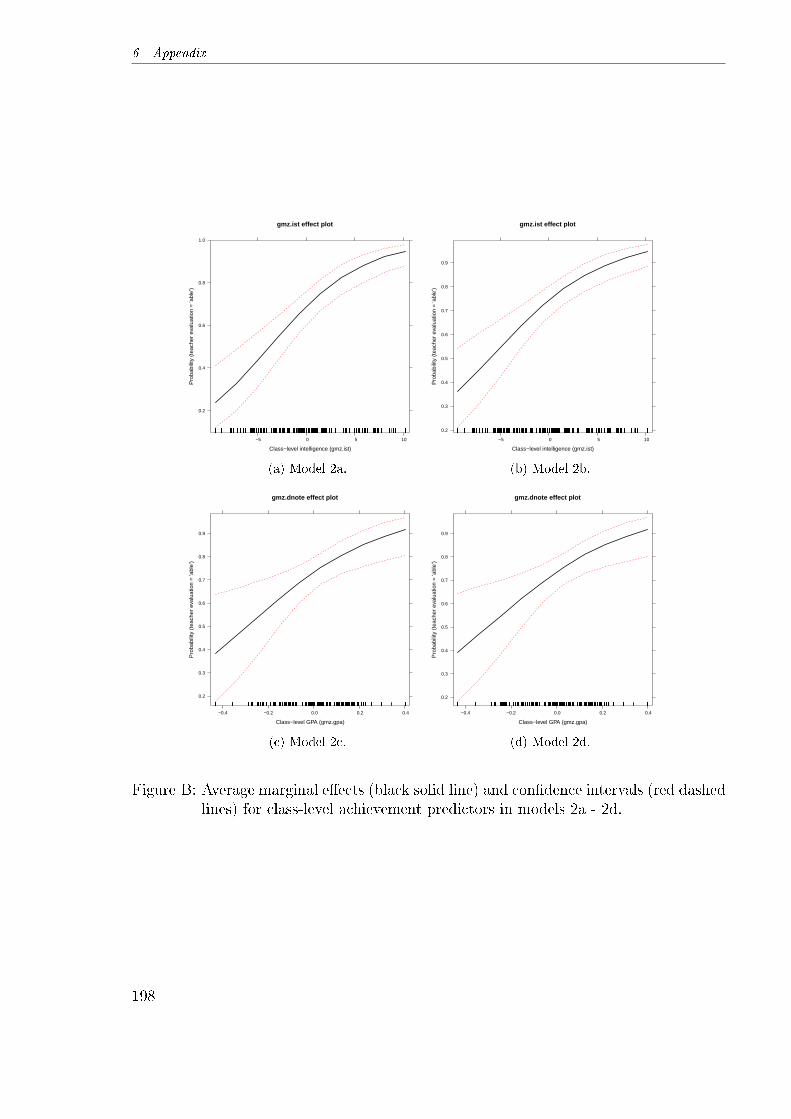
6 Appendix
gmz.ist effect plot
Class−level intelligence (gmz.ist)
Pro
babi
lity
(tea
cher
eva
luat
ion
= 'a
ble'
)
0.2
0.4
0.6
0.8
1.0
−5 0 5 10
(a) Model 2a.
gmz.ist effect plot
Class−level intelligence (gmz.ist)
Pro
babi
lity
(tea
cher
eva
luat
ion
= 'a
ble'
)0.2
0.3
0.4
0.5
0.6
0.7
0.8
0.9
−5 0 5 10
(b) Model 2b.
gmz.dnote effect plot
Class−level GPA (gmz.gpa)
Pro
babi
lity
(tea
cher
eva
luat
ion
= 'a
ble'
)
0.2
0.3
0.4
0.5
0.6
0.7
0.8
0.9
−0.4 −0.2 0.0 0.2 0.4
(c) Model 2c.
gmz.dnote effect plot
Class−level GPA (gmz.gpa)
Pro
babi
lity
(tea
cher
eva
luat
ion
= 'a
ble'
)
0.2
0.3
0.4
0.5
0.6
0.7
0.8
0.9
−0.4 −0.2 0.0 0.2 0.4
(d) Model 2d.
Figure B: Average marginal e�ects (black solid line) and con�dence intervals (red dashedlines) for class-level achievement predictors in models 2a - 2d.
198
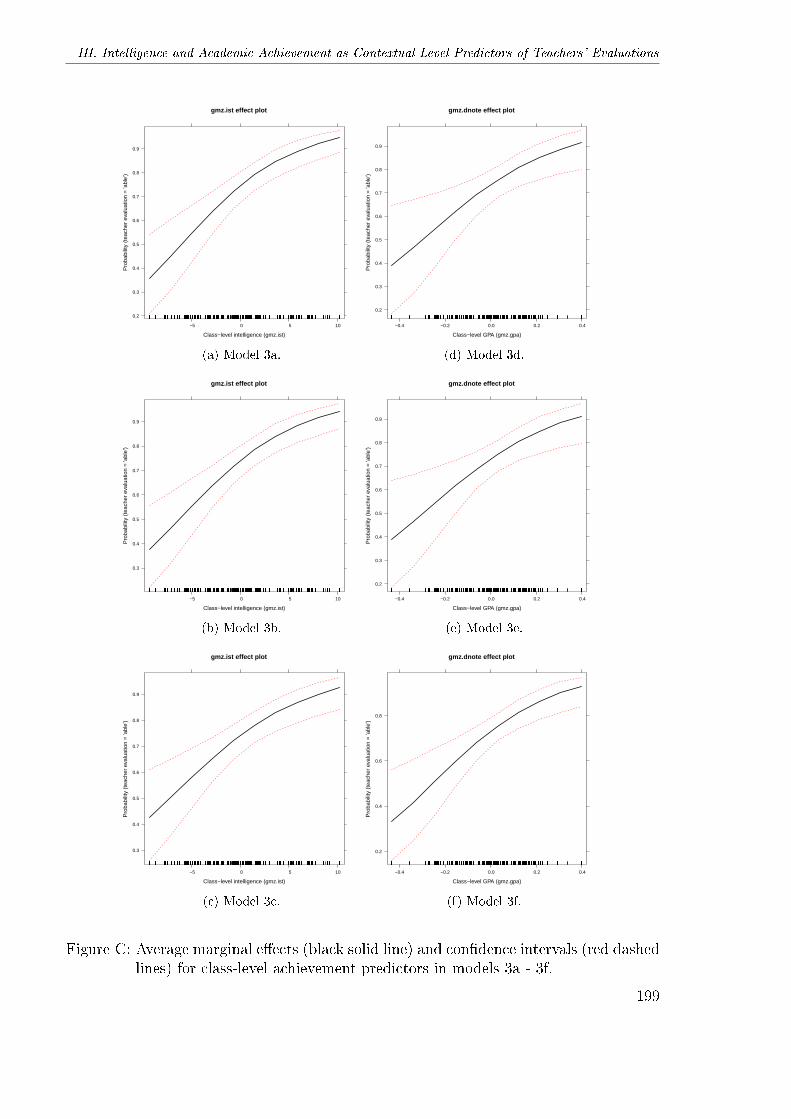
III. Intelligence and Academic Achievement as Contextual-Level Predictors of Teachers' Evaluations
gmz.ist effect plot
Class−level intelligence (gmz.ist)
Pro
babi
lity
(tea
cher
eva
luat
ion
= 'a
ble'
)
0.2
0.3
0.4
0.5
0.6
0.7
0.8
0.9
−5 0 5 10
(a) Model 3a.
gmz.dnote effect plot
Class−level GPA (gmz.gpa)
Pro
babi
lity
(tea
cher
eva
luat
ion
= 'a
ble'
)
0.2
0.3
0.4
0.5
0.6
0.7
0.8
0.9
−0.4 −0.2 0.0 0.2 0.4
(d) Model 3d.
gmz.ist effect plot
Class−level intelligence (gmz.ist)
Pro
babi
lity
(tea
cher
eva
luat
ion
= 'a
ble'
)
0.3
0.4
0.5
0.6
0.7
0.8
0.9
−5 0 5 10
(b) Model 3b.
gmz.dnote effect plot
Class−level GPA (gmz.gpa)
Pro
babi
lity
(tea
cher
eva
luat
ion
= 'a
ble'
)
0.2
0.3
0.4
0.5
0.6
0.7
0.8
0.9
−0.4 −0.2 0.0 0.2 0.4
(e) Model 3e.
gmz.ist effect plot
Class−level intelligence (gmz.ist)
Pro
babi
lity
(tea
cher
eva
luat
ion
= 'a
ble'
)
0.3
0.4
0.5
0.6
0.7
0.8
0.9
−5 0 5 10
(c) Model 3c.
gmz.dnote effect plot
Class−level GPA (gmz.gpa)
Pro
babi
lity
(tea
cher
eva
luat
ion
= 'a
ble'
)
0.2
0.4
0.6
0.8
−0.4 −0.2 0.0 0.2 0.4
(f) Model 3f.
Figure C: Average marginal e�ects (black solid line) and con�dence intervals (red dashedlines) for class-level achievement predictors in models 3a - 3f.
199

6 Appendix
gmz.ist effect plot
Class−level intelligence (gmz.ist)
Pro
babi
lity
(tea
cher
eva
luat
ion
= 'a
ble'
)
0.2
0.4
0.6
0.8
1.0
−5 0 5 10
(a) Model 4a.
gmz.ist effect plot
Class−level intelligence (gmz.ist)
Pro
babi
lity
(tea
cher
eva
luat
ion
= 'a
ble'
)
0.2
0.4
0.6
0.8
1.0
−5 0 5 10
(b) Model 4b.
gmz.ist effect plot
Class−level intelligence (gmz.ist)
Pro
babi
lity
(tea
cher
eva
luat
ion
= 'a
ble'
)
0.2
0.4
0.6
0.8
1.0
−5 0 5 10
(c) Model 4c.
gmz.ist effect plot
Class−level intelligence (gmz.ist)
Pro
babi
lity
(tea
cher
eva
luat
ion
= 'a
ble'
)
0.2
0.4
0.6
0.8
1.0
−5 0 5 10
(d) Model 4d.
Figure D: Average marginal e�ects (black solid line) and con�dence intervals (red dashedlines) for class-level intelligence in models 4a - 4d.
200

III. Intelligence and Academic Achievement as Contextual-Level Predictors of Teachers' Evaluations
gmz.dnote effect plot
Class−level GPA (gmz.gpa)
Pro
babi
lity
(tea
cher
eva
luat
ion
= 'a
ble'
)
0.2
0.3
0.4
0.5
0.6
0.7
0.8
0.9
−0.4 −0.2 0.0 0.2 0.4
(a) Model 4e.
gmz.dnote effect plot
Class−level GPA (gmz.gpa)
Pro
babi
lity
(tea
cher
eva
luat
ion
= 'a
ble'
)
0.2
0.3
0.4
0.5
0.6
0.7
0.8
0.9
−0.4 −0.2 0.0 0.2 0.4
(b) Model 4f.
gmz.dnote effect plot
Class−level GPA (gmz.gpa)
Pro
babi
lity
(tea
cher
eva
luat
ion
= 'a
ble'
)
0.2
0.3
0.4
0.5
0.6
0.7
0.8
0.9
−0.4 −0.2 0.0 0.2 0.4
(c) Model 4g.
gmz.dnote effect plot
Class−level GPA (gmz.gpa)
Pro
babi
lity
(tea
cher
eva
luat
ion
= 'a
ble'
)
0.2
0.3
0.4
0.5
0.6
0.7
0.8
0.9
−0.4 −0.2 0.0 0.2 0.4
(d) Model 4h.
Figure E: Average marginal e�ects (black solid line) and con�dence intervals (red dashedlines) for class-level GPA in models 4e - 4h.
201
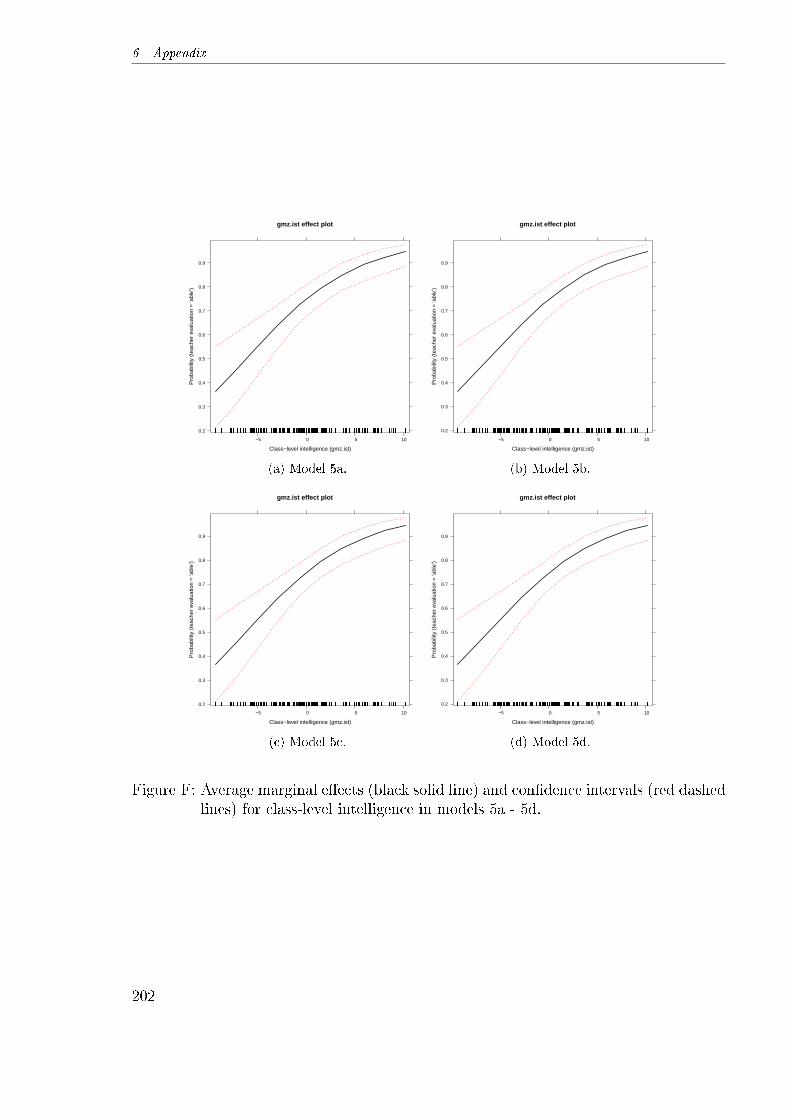
6 Appendix
gmz.ist effect plot
Class−level intelligence (gmz.ist)
Pro
babi
lity
(tea
cher
eva
luat
ion
= 'a
ble'
)
0.2
0.3
0.4
0.5
0.6
0.7
0.8
0.9
−5 0 5 10
(a) Model 5a.
gmz.ist effect plot
Class−level intelligence (gmz.ist)
Pro
babi
lity
(tea
cher
eva
luat
ion
= 'a
ble'
)0.2
0.3
0.4
0.5
0.6
0.7
0.8
0.9
−5 0 5 10
(b) Model 5b.
gmz.ist effect plot
Class−level intelligence (gmz.ist)
Pro
babi
lity
(tea
cher
eva
luat
ion
= 'a
ble'
)
0.2
0.3
0.4
0.5
0.6
0.7
0.8
0.9
−5 0 5 10
(c) Model 5c.
gmz.ist effect plot
Class−level intelligence (gmz.ist)
Pro
babi
lity
(tea
cher
eva
luat
ion
= 'a
ble'
)
0.2
0.3
0.4
0.5
0.6
0.7
0.8
0.9
−5 0 5 10
(d) Model 5d.
Figure F: Average marginal e�ects (black solid line) and con�dence intervals (red dashedlines) for class-level intelligence in models 5a - 5d.
202

III. Intelligence and Academic Achievement as Contextual-Level Predictors of Teachers' Evaluations
gmz.dnote effect plot
Class−level GPA (gmz.gpa)
Pro
babi
lity
(tea
cher
eva
luat
ion
= 'a
ble'
)
0.2
0.3
0.4
0.5
0.6
0.7
0.8
0.9
−0.4 −0.2 0.0 0.2 0.4
(a) Model 5e.
gmz.dnote effect plot
Class−level GPA (gmz.gpa)
Pro
babi
lity
(tea
cher
eva
luat
ion
= 'a
ble'
)
0.2
0.3
0.4
0.5
0.6
0.7
0.8
0.9
−0.4 −0.2 0.0 0.2 0.4
(b) Model 5f.
gmz.dnote effect plot
Class−level GPA (gmz.gpa)
Pro
babi
lity
(tea
cher
eva
luat
ion
= 'a
ble'
)
0.2
0.3
0.4
0.5
0.6
0.7
0.8
0.9
−0.4 −0.2 0.0 0.2 0.4
(c) Model 5g.
gmz.dnote effect plot
Class−level GPA (gmz.gpa)
Pro
babi
lity
(tea
cher
eva
luat
ion
= 'a
ble'
)
0.2
0.3
0.4
0.5
0.6
0.7
0.8
0.9
−0.4 −0.2 0.0 0.2 0.4
(d) Model 5h.
Figure G: Average marginal e�ects (black solid line) and con�dence intervals (red dashedlines) for class-level GPA in models 5e - 5h.
203
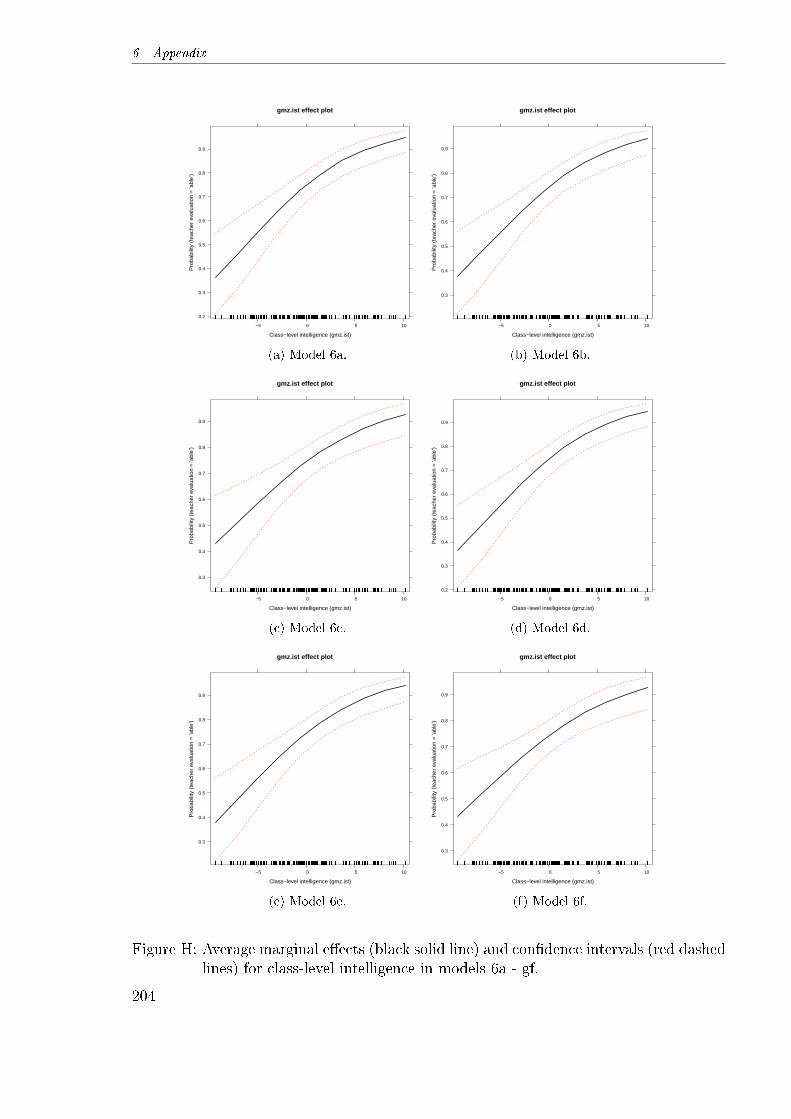
6 Appendix
gmz.ist effect plot
Class−level intelligence (gmz.ist)
Pro
babi
lity
(tea
cher
eva
luat
ion
= 'a
ble'
)
0.2
0.3
0.4
0.5
0.6
0.7
0.8
0.9
−5 0 5 10
(a) Model 6a.
gmz.ist effect plot
Class−level intelligence (gmz.ist)
Pro
babi
lity
(tea
cher
eva
luat
ion
= 'a
ble'
)
0.3
0.4
0.5
0.6
0.7
0.8
0.9
−5 0 5 10
(b) Model 6b.
gmz.ist effect plot
Class−level intelligence (gmz.ist)
Pro
babi
lity
(tea
cher
eva
luat
ion
= 'a
ble'
)
0.3
0.4
0.5
0.6
0.7
0.8
0.9
−5 0 5 10
(c) Model 6c.
gmz.ist effect plot
Class−level intelligence (gmz.ist)
Pro
babi
lity
(tea
cher
eva
luat
ion
= 'a
ble'
)
0.2
0.3
0.4
0.5
0.6
0.7
0.8
0.9
−5 0 5 10
(d) Model 6d.
gmz.ist effect plot
Class−level intelligence (gmz.ist)
Pro
babi
lity
(tea
cher
eva
luat
ion
= 'a
ble'
)
0.3
0.4
0.5
0.6
0.7
0.8
0.9
−5 0 5 10
(e) Model 6e.
gmz.ist effect plot
Class−level intelligence (gmz.ist)
Pro
babi
lity
(tea
cher
eva
luat
ion
= 'a
ble'
)
0.3
0.4
0.5
0.6
0.7
0.8
0.9
−5 0 5 10
(f) Model 6f.
Figure H: Average marginal e�ects (black solid line) and con�dence intervals (red dashedlines) for class-level intelligence in models 6a - gf.
204
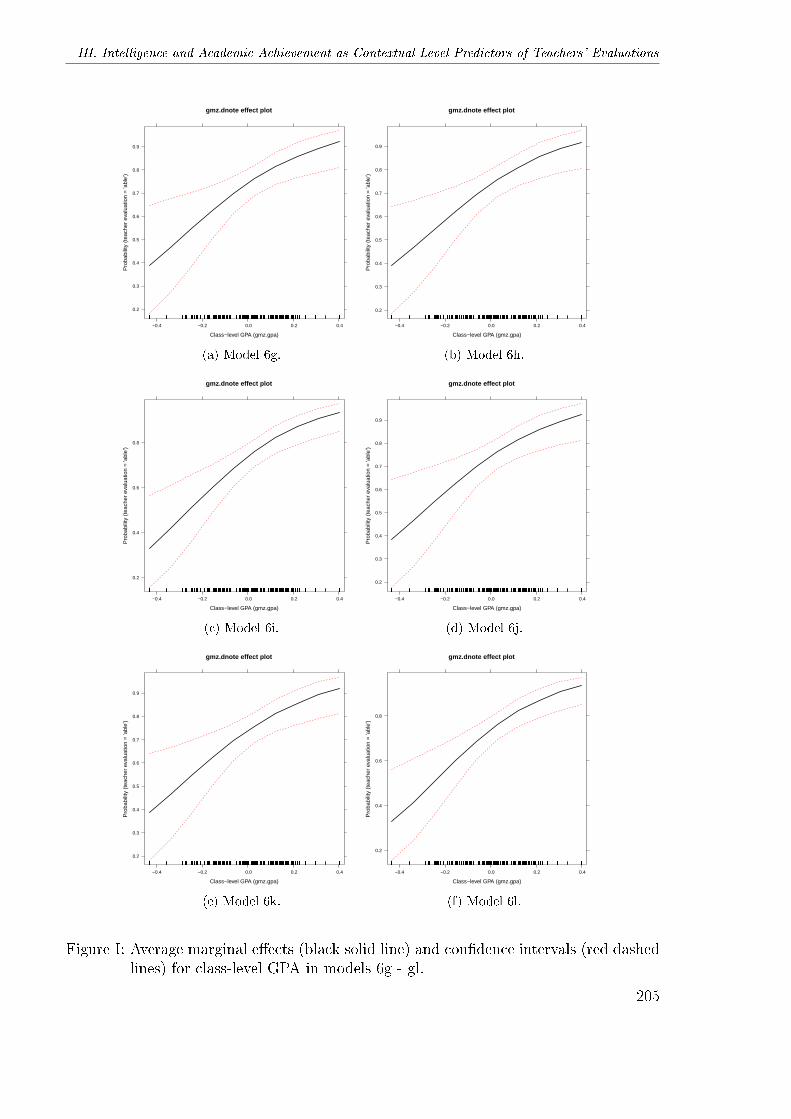
III. Intelligence and Academic Achievement as Contextual-Level Predictors of Teachers' Evaluations
gmz.dnote effect plot
Class−level GPA (gmz.gpa)
Pro
babi
lity
(tea
cher
eva
luat
ion
= 'a
ble'
)
0.2
0.3
0.4
0.5
0.6
0.7
0.8
0.9
−0.4 −0.2 0.0 0.2 0.4
(a) Model 6g.
gmz.dnote effect plot
Class−level GPA (gmz.gpa)
Pro
babi
lity
(tea
cher
eva
luat
ion
= 'a
ble'
)
0.2
0.3
0.4
0.5
0.6
0.7
0.8
0.9
−0.4 −0.2 0.0 0.2 0.4
(b) Model 6h.
gmz.dnote effect plot
Class−level GPA (gmz.gpa)
Pro
babi
lity
(tea
cher
eva
luat
ion
= 'a
ble'
)
0.2
0.4
0.6
0.8
−0.4 −0.2 0.0 0.2 0.4
(c) Model 6i.
gmz.dnote effect plot
Class−level GPA (gmz.gpa)
Pro
babi
lity
(tea
cher
eva
luat
ion
= 'a
ble'
)
0.2
0.3
0.4
0.5
0.6
0.7
0.8
0.9
−0.4 −0.2 0.0 0.2 0.4
(d) Model 6j.
gmz.dnote effect plot
Class−level GPA (gmz.gpa)
Pro
babi
lity
(tea
cher
eva
luat
ion
= 'a
ble'
)
0.2
0.3
0.4
0.5
0.6
0.7
0.8
0.9
−0.4 −0.2 0.0 0.2 0.4
(e) Model 6k.
gmz.dnote effect plot
Class−level GPA (gmz.gpa)
Pro
babi
lity
(tea
cher
eva
luat
ion
= 'a
ble'
)
0.2
0.4
0.6
0.8
−0.4 −0.2 0.0 0.2 0.4
(f) Model 6l.
Figure I: Average marginal e�ects (black solid line) and con�dence intervals (red dashedlines) for class-level GPA in models 6g - gl.
205
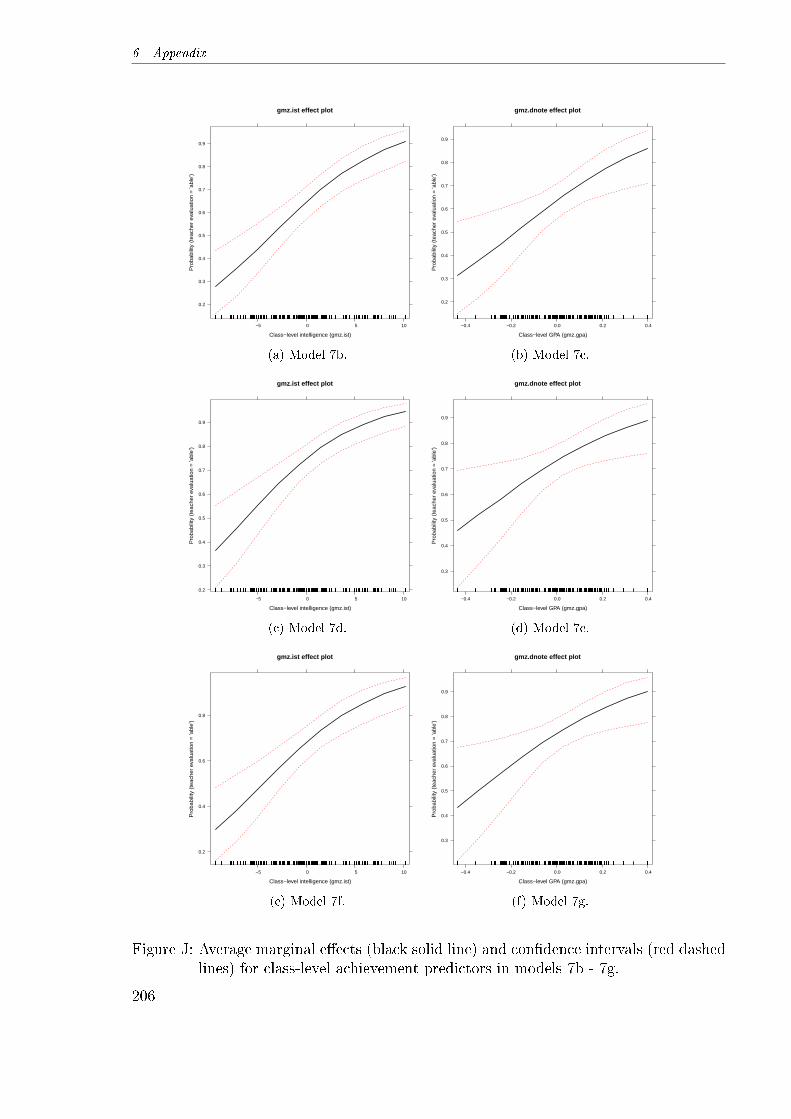
6 Appendix
gmz.ist effect plot
Class−level intelligence (gmz.ist)
Pro
babi
lity
(tea
cher
eva
luat
ion
= 'a
ble'
)
0.2
0.3
0.4
0.5
0.6
0.7
0.8
0.9
−5 0 5 10
(a) Model 7b.
gmz.dnote effect plot
Class−level GPA (gmz.gpa)
Pro
babi
lity
(tea
cher
eva
luat
ion
= 'a
ble'
)
0.2
0.3
0.4
0.5
0.6
0.7
0.8
0.9
−0.4 −0.2 0.0 0.2 0.4
(b) Model 7c.
gmz.ist effect plot
Class−level intelligence (gmz.ist)
Pro
babi
lity
(tea
cher
eva
luat
ion
= 'a
ble'
)
0.2
0.3
0.4
0.5
0.6
0.7
0.8
0.9
−5 0 5 10
(c) Model 7d.
gmz.dnote effect plot
Class−level GPA (gmz.gpa)
Pro
babi
lity
(tea
cher
eva
luat
ion
= 'a
ble'
)
0.3
0.4
0.5
0.6
0.7
0.8
0.9
−0.4 −0.2 0.0 0.2 0.4
(d) Model 7e.
gmz.ist effect plot
Class−level intelligence (gmz.ist)
Pro
babi
lity
(tea
cher
eva
luat
ion
= 'a
ble'
)
0.2
0.4
0.6
0.8
−5 0 5 10
(e) Model 7f.
gmz.dnote effect plot
Class−level GPA (gmz.gpa)
Pro
babi
lity
(tea
cher
eva
luat
ion
= 'a
ble'
)
0.3
0.4
0.5
0.6
0.7
0.8
0.9
−0.4 −0.2 0.0 0.2 0.4
(f) Model 7g.
Figure J: Average marginal e�ects (black solid line) and con�dence intervals (red dashedlines) for class-level achievement predictors in models 7b - 7g.
206
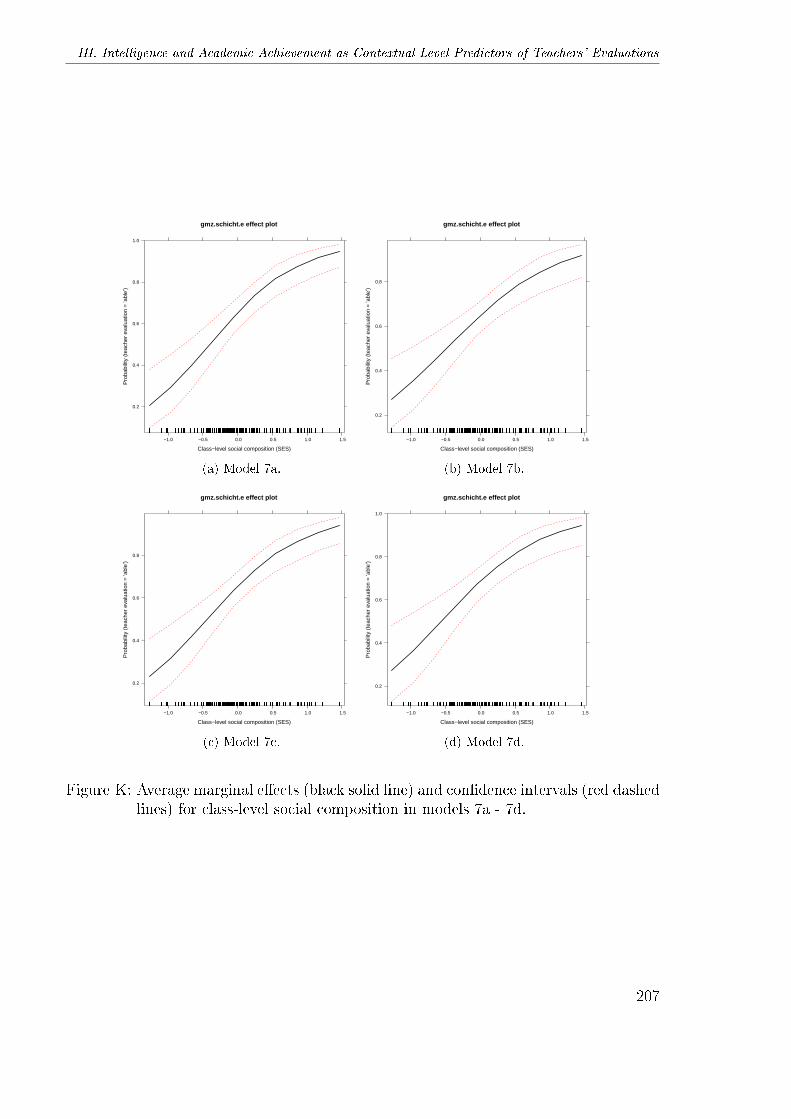
III. Intelligence and Academic Achievement as Contextual-Level Predictors of Teachers' Evaluations
gmz.schicht.e effect plot
Class−level social composition (SES)
Pro
babi
lity
(tea
cher
eva
luat
ion
= 'a
ble'
)
0.2
0.4
0.6
0.8
1.0
−1.0 −0.5 0.0 0.5 1.0 1.5
(a) Model 7a.
gmz.schicht.e effect plot
Class−level social composition (SES)
Pro
babi
lity
(tea
cher
eva
luat
ion
= 'a
ble'
)
0.2
0.4
0.6
0.8
−1.0 −0.5 0.0 0.5 1.0 1.5
(b) Model 7b.
gmz.schicht.e effect plot
Class−level social composition (SES)
Pro
babi
lity
(tea
cher
eva
luat
ion
= 'a
ble'
)
0.2
0.4
0.6
0.8
−1.0 −0.5 0.0 0.5 1.0 1.5
(c) Model 7c.
gmz.schicht.e effect plot
Class−level social composition (SES)
Pro
babi
lity
(tea
cher
eva
luat
ion
= 'a
ble'
)
0.2
0.4
0.6
0.8
1.0
−1.0 −0.5 0.0 0.5 1.0 1.5
(d) Model 7d.
Figure K: Average marginal e�ects (black solid line) and con�dence intervals (red dashedlines) for class-level social composition in models 7a - 7d.
207
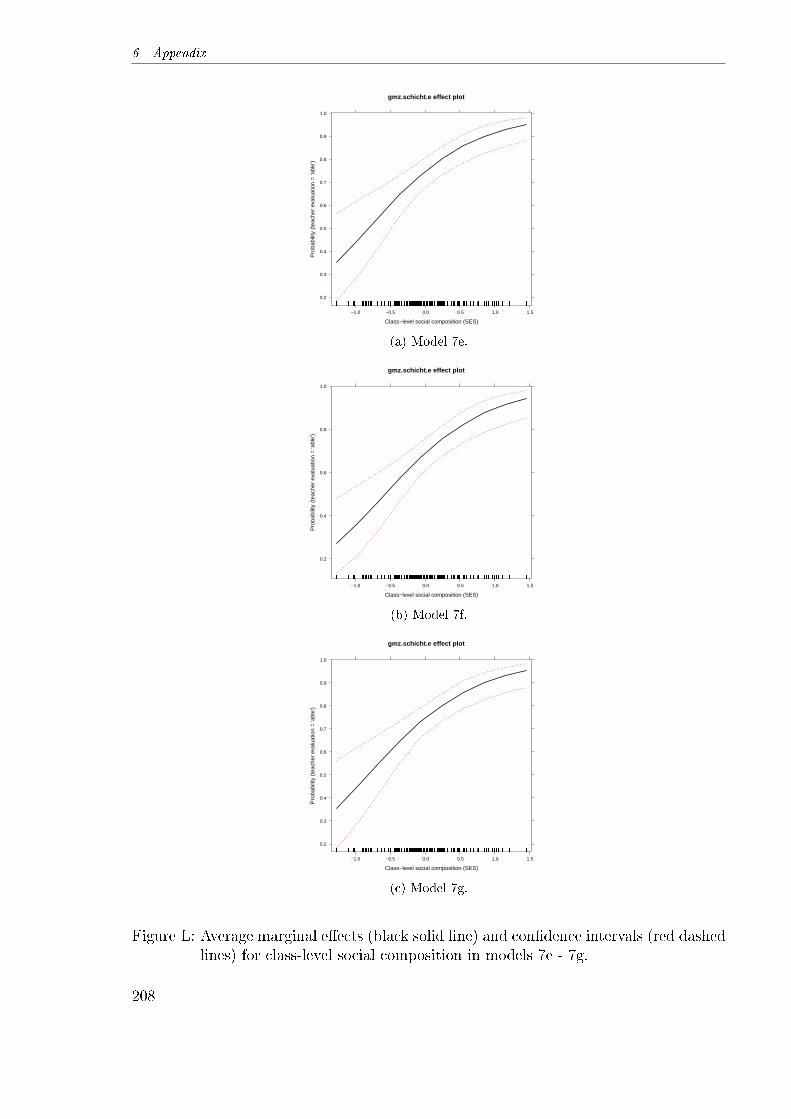
6 Appendix
gmz.schicht.e effect plot
Class−level social composition (SES)
Pro
babi
lity
(tea
cher
eva
luat
ion
= 'a
ble'
)
0.2
0.3
0.4
0.5
0.6
0.7
0.8
0.9
1.0
−1.0 −0.5 0.0 0.5 1.0 1.5
(a) Model 7e.
gmz.schicht.e effect plot
Class−level social composition (SES)
Pro
babi
lity
(tea
cher
eva
luat
ion
= 'a
ble'
)
0.2
0.4
0.6
0.8
1.0
−1.0 −0.5 0.0 0.5 1.0 1.5
(b) Model 7f.
gmz.schicht.e effect plot
Class−level social composition (SES)
Pro
babi
lity
(tea
cher
eva
luat
ion
= 'a
ble'
)
0.2
0.3
0.4
0.5
0.6
0.7
0.8
0.9
1.0
−1.0 −0.5 0.0 0.5 1.0 1.5
(c) Model 7g.
Figure L: Average marginal e�ects (black solid line) and con�dence intervals (red dashedlines) for class-level social composition in models 7e - 7g.
208
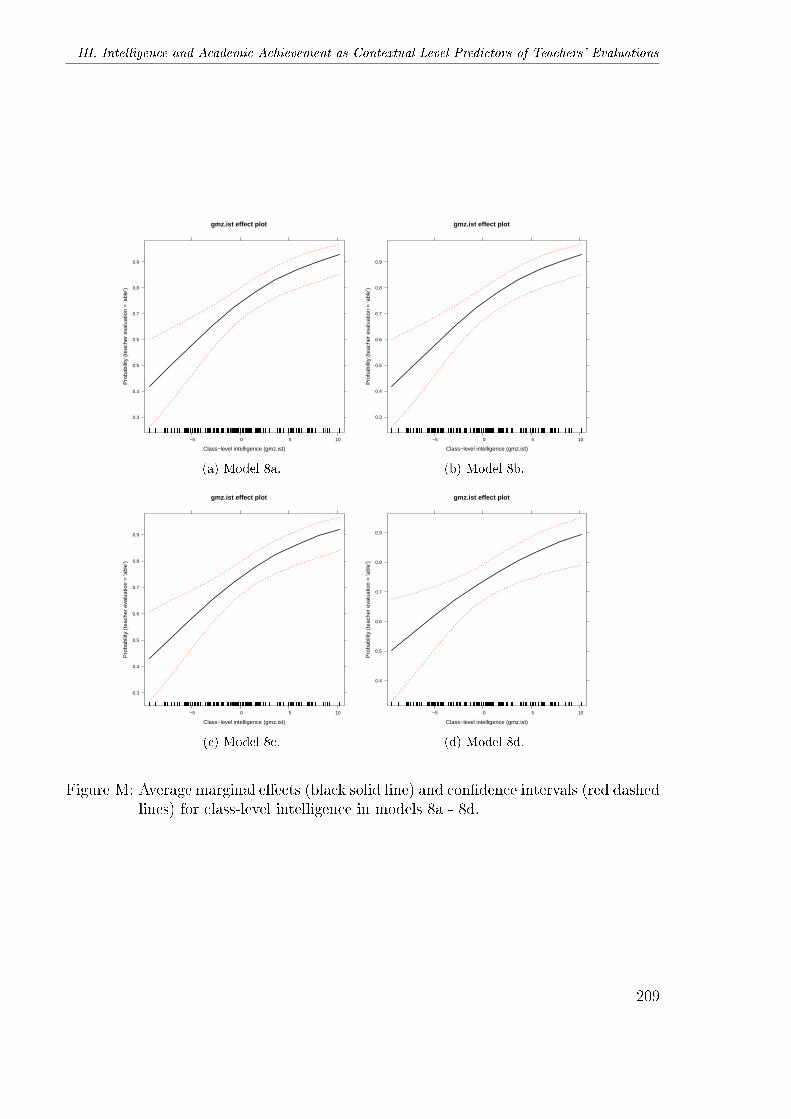
III. Intelligence and Academic Achievement as Contextual-Level Predictors of Teachers' Evaluations
gmz.ist effect plot
Class−level intelligence (gmz.ist)
Pro
babi
lity
(tea
cher
eva
luat
ion
= 'a
ble'
)
0.3
0.4
0.5
0.6
0.7
0.8
0.9
−5 0 5 10
(a) Model 8a.
gmz.ist effect plot
Class−level intelligence (gmz.ist)
Pro
babi
lity
(tea
cher
eva
luat
ion
= 'a
ble'
)
0.3
0.4
0.5
0.6
0.7
0.8
0.9
−5 0 5 10
(b) Model 8b.
gmz.ist effect plot
Class−level intelligence (gmz.ist)
Pro
babi
lity
(tea
cher
eva
luat
ion
= 'a
ble'
)
0.3
0.4
0.5
0.6
0.7
0.8
0.9
−5 0 5 10
(c) Model 8c.
gmz.ist effect plot
Class−level intelligence (gmz.ist)
Pro
babi
lity
(tea
cher
eva
luat
ion
= 'a
ble'
)
0.4
0.5
0.6
0.7
0.8
0.9
−5 0 5 10
(d) Model 8d.
Figure M: Average marginal e�ects (black solid line) and con�dence intervals (red dashedlines) for class-level intelligence in models 8a - 8d.
209
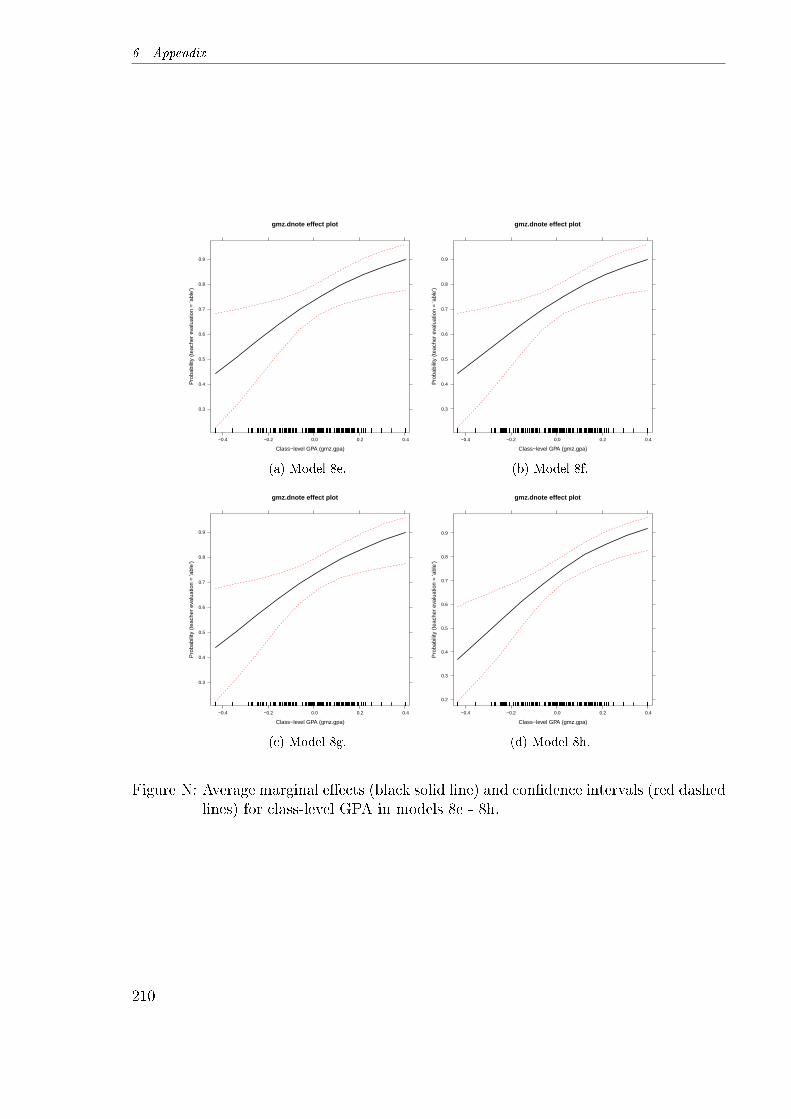
6 Appendix
gmz.dnote effect plot
Class−level GPA (gmz.gpa)
Pro
babi
lity
(tea
cher
eva
luat
ion
= 'a
ble'
)
0.3
0.4
0.5
0.6
0.7
0.8
0.9
−0.4 −0.2 0.0 0.2 0.4
(a) Model 8e.
gmz.dnote effect plot
Class−level GPA (gmz.gpa)
Pro
babi
lity
(tea
cher
eva
luat
ion
= 'a
ble'
)
0.3
0.4
0.5
0.6
0.7
0.8
0.9
−0.4 −0.2 0.0 0.2 0.4
(b) Model 8f.
gmz.dnote effect plot
Class−level GPA (gmz.gpa)
Pro
babi
lity
(tea
cher
eva
luat
ion
= 'a
ble'
)
0.3
0.4
0.5
0.6
0.7
0.8
0.9
−0.4 −0.2 0.0 0.2 0.4
(c) Model 8g.
gmz.dnote effect plot
Class−level GPA (gmz.gpa)
Pro
babi
lity
(tea
cher
eva
luat
ion
= 'a
ble'
)
0.2
0.3
0.4
0.5
0.6
0.7
0.8
0.9
−0.4 −0.2 0.0 0.2 0.4
(d) Model 8h.
Figure N: Average marginal e�ects (black solid line) and con�dence intervals (red dashedlines) for class-level GPA in models 8e - 8h.
210
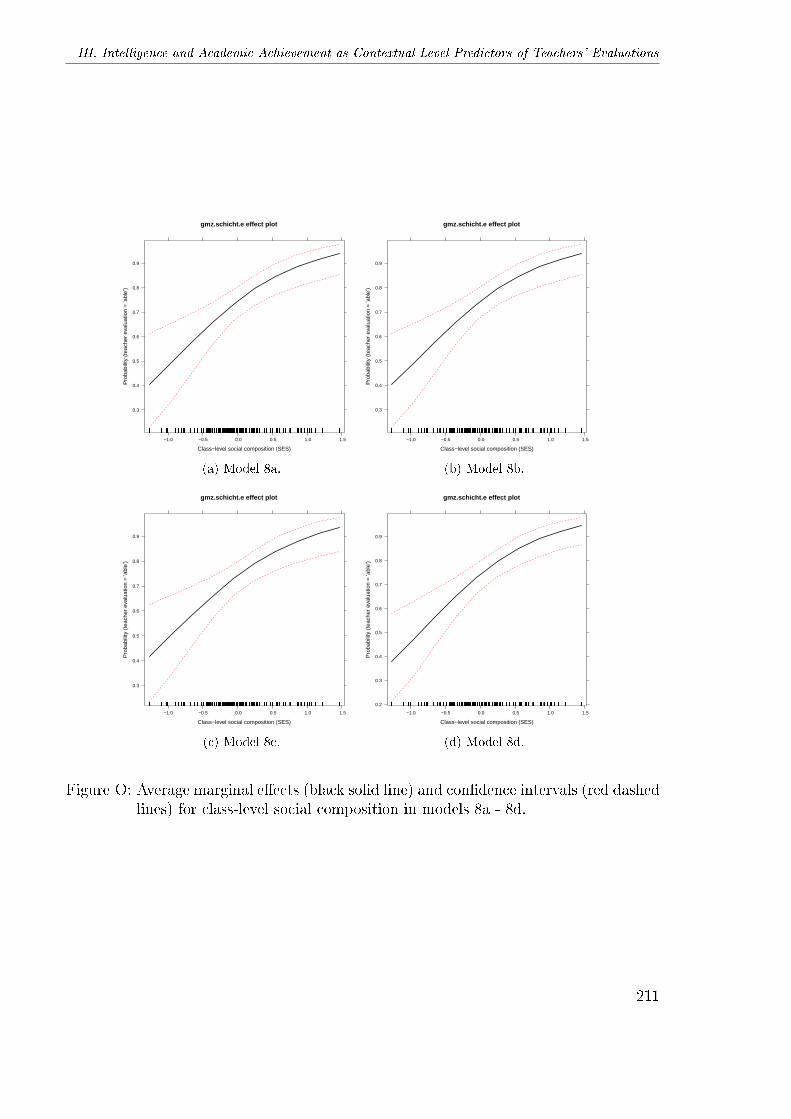
III. Intelligence and Academic Achievement as Contextual-Level Predictors of Teachers' Evaluations
gmz.schicht.e effect plot
Class−level social composition (SES)
Pro
babi
lity
(tea
cher
eva
luat
ion
= 'a
ble'
)
0.3
0.4
0.5
0.6
0.7
0.8
0.9
−1.0 −0.5 0.0 0.5 1.0 1.5
(a) Model 8a.
gmz.schicht.e effect plot
Class−level social composition (SES)
Pro
babi
lity
(tea
cher
eva
luat
ion
= 'a
ble'
)
0.3
0.4
0.5
0.6
0.7
0.8
0.9
−1.0 −0.5 0.0 0.5 1.0 1.5
(b) Model 8b.
gmz.schicht.e effect plot
Class−level social composition (SES)
Pro
babi
lity
(tea
cher
eva
luat
ion
= 'a
ble'
)
0.3
0.4
0.5
0.6
0.7
0.8
0.9
−1.0 −0.5 0.0 0.5 1.0 1.5
(c) Model 8c.
gmz.schicht.e effect plot
Class−level social composition (SES)
Pro
babi
lity
(tea
cher
eva
luat
ion
= 'a
ble'
)
0.2
0.3
0.4
0.5
0.6
0.7
0.8
0.9
−1.0 −0.5 0.0 0.5 1.0 1.5
(d) Model 8d.
Figure O: Average marginal e�ects (black solid line) and con�dence intervals (red dashedlines) for class-level social composition in models 8a - 8d.
211
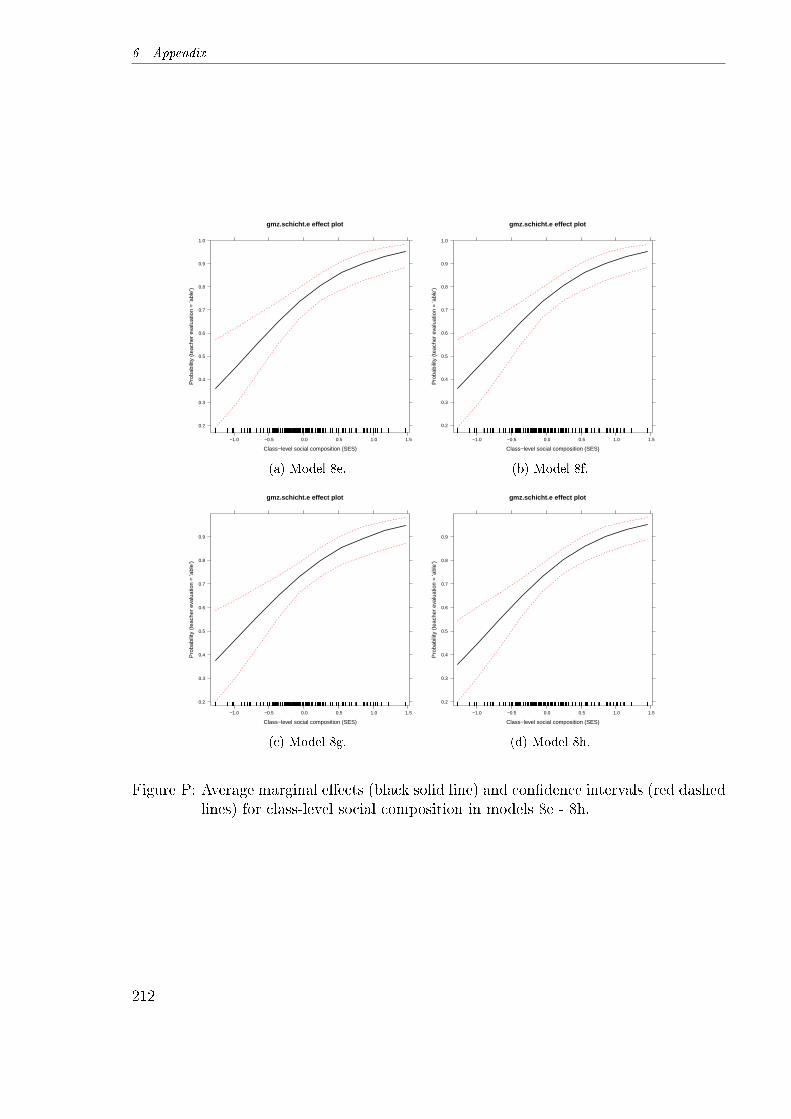
6 Appendix
gmz.schicht.e effect plot
Class−level social composition (SES)
Pro
babi
lity
(tea
cher
eva
luat
ion
= 'a
ble'
)
0.2
0.3
0.4
0.5
0.6
0.7
0.8
0.9
1.0
−1.0 −0.5 0.0 0.5 1.0 1.5
(a) Model 8e.
gmz.schicht.e effect plot
Class−level social composition (SES)
Pro
babi
lity
(tea
cher
eva
luat
ion
= 'a
ble'
)0.2
0.3
0.4
0.5
0.6
0.7
0.8
0.9
1.0
−1.0 −0.5 0.0 0.5 1.0 1.5
(b) Model 8f.
gmz.schicht.e effect plot
Class−level social composition (SES)
Pro
babi
lity
(tea
cher
eva
luat
ion
= 'a
ble'
)
0.2
0.3
0.4
0.5
0.6
0.7
0.8
0.9
−1.0 −0.5 0.0 0.5 1.0 1.5
(c) Model 8g.
gmz.schicht.e effect plot
Class−level social composition (SES)
Pro
babi
lity
(tea
cher
eva
luat
ion
= 'a
ble'
)
0.2
0.3
0.4
0.5
0.6
0.7
0.8
0.9
−1.0 −0.5 0.0 0.5 1.0 1.5
(d) Model 8h.
Figure P: Average marginal e�ects (black solid line) and con�dence intervals (red dashedlines) for class-level social composition in models 8e - 8h.
212
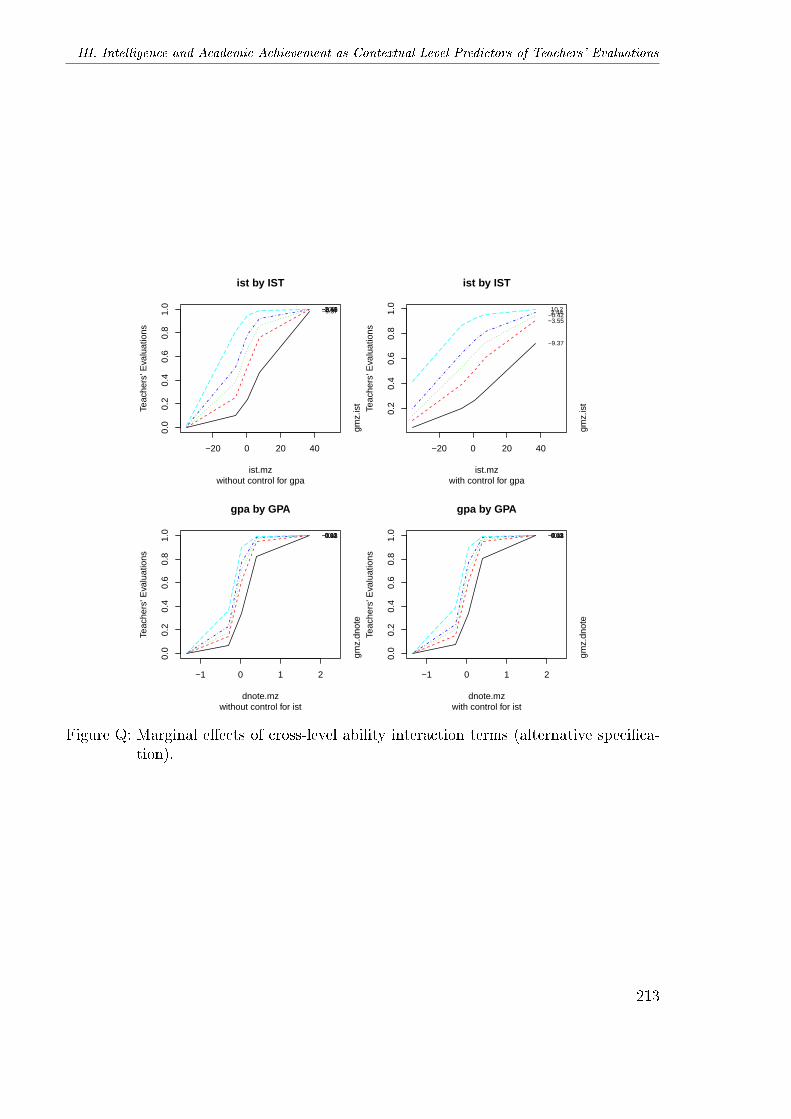
III. Intelligence and Academic Achievement as Contextual-Level Predictors of Teachers' Evaluations
−20 0 20 40
0.0
0.2
0.4
0.6
0.8
1.0
ist.mz
Teac
hers
' Eva
luat
ions
−9.37−3.55−0.422.4410.2
gmz.
ist
ist by IST
without control for gpa
−20 0 20 40
0.2
0.4
0.6
0.8
1.0
ist.mz
Teac
hers
' Eva
luat
ions
−9.37
−3.55−0.422.4410.2
gmz.
ist
ist by IST
with control for gpa
−1 0 1 2
0.0
0.2
0.4
0.6
0.8
1.0
dnote.mz
Teac
hers
' Eva
luat
ions
−0.43−0.110.020.130.4
gmz.
dnot
e
gpa by GPA
without control for ist
−1 0 1 2
0.0
0.2
0.4
0.6
0.8
1.0
dnote.mz
Teac
hers
' Eva
luat
ions
−0.43−0.110.020.130.4
gmz.
dnot
e
gpa by GPA
with control for ist
Figure Q: Marginal e�ects of cross-level ability interaction terms (alternative speci�ca-tion).
213


IV. The Impact of Teachers'
Expectations on Students'
Educational Opportunities in the
Life CourseAn Empirical Test of A Subjective-Expected-Utility Explanation
The objective of this paper is to integrate the idea of Pygmalion or self-ful�llingprophecy research (Rosenthal and Jacobson, 1968; Jussim and Harber, 2005) intothe subjective expected utility framework of inequality in educational opportuni-ties (Esser, 1999). In the theoretical section, a formal model about the impactof teachers' expectations on students' educational transitions in sense of a self-ful�lling prophecy is developed. In the empirical section, I test this model to pre-dict both students' educational success (in terms of high school graduation) andtheir university transitions. Analyses control for both sample selection bias andunobserved heterogeneity. I �nd that in the underlying operationalization, teach-ers' expectations show signi�cant e�ects on both educational success and universitytransitions. While the conditional decision problem of university transitions mightlead to a selection bias, unobserved heterogeneity would have to be disturbinglyhigh to a�ect the stability of self-ful�lling prophecy estimates.
1 Introduction
School surely is the �rst and by that way also the most important branching pointin everybody's life course at least in industrialized countries. According to structuralfunctionalists, the function of school is �to internalize in its pupils both the commitmentsand the capacities for successful performance of their future adult roles, and second(...) to allocate these human resources within the role-structure of the adult society�(Parsons, 1959, p. 298; also see Davis and Moore, 1945). Economic literature providesnumerous examples for the relationship between schooling and labor market income (e.g.Boissiere et al., 1985; Ashenfelter et al., 1999). Moreover, there is even evidence that inthe long run human capital � measured by labor-force quality � may in�uence nations'productivity and economic growth (Bishop, 1989; Hanushek and Kimko, 2000). However,
215
1 Introduction
although the importance of schooling and its quality is undisputed, there is still roomto re�ne social science theories on social inequality in educational opportunities (IEO).
On the one hand, powerful conclusions can be drawn from the theoretical frameworkthat has been provided by social inequality theory based on rational-choice or subjectiveexpected utility (SEU) assumptions. One of its main strengths lies in allowing us todistinguish between primary and secondary e�ects of social inequality, i.e. betweene�ects of socialization and e�ects of aspirations. Furthermore, SEU theory convention-ally implies that research assumptions have to be formalized. This facilitates both thecomparison of di�erent hypotheses and their operationalization into empirical models.
On the other hand, social psychologists have impressively revealed how teachers' ex-pectations can in�uence students' future performance beyond their (or their parents')mere cost-bene�t considerations. This phenomenon has been labeled the Pygmalione�ect of self-ful�lling underestimations and the Golem e�ect of self-ful�lling overestima-tions (Rosenthal and Jacobson, 1968). Moreover, Pygmalion research showed that thevariance of this e�ect can partially be explained by social background variables (Jussimand Harber, 2005).
The substantial aim of this paper is to integrate the main idea of Pygmalion or self-ful�lling prophecy research into the general subjective expected utility framework ofIEO. In particular, I will refer to Esser's (1999) SEU-IEO that has been proposed incourse of a concatenation of related theoretical accounts (Erikson and Jonsson, 1996;Goldthorpe, 1996; Breen and Goldthorpe, 1997). Furthermore, while many � not all �applications of this model have considered educational transition decisions from primaryto secondary school, in this study I will focus on students' probability of achieving ahigh school degree, and on their propensity of beginning academic studies, respectively.The research design will follow the model proposed by Becker (2003) which includescontrols for selection bias (Heckman, 1979). Additionally, I will perform a sensitivityanalysis for all self-ful�lling prophecy indicators to test their robustness against a vectorof unobserved covariates (Buis, 2007, 2010, 2011).
This paper will be structured as follows: First, the basic assumptions of both theSEU-IEO model and Pygmalion will be discussed. Then I will outline to what extentPygmalion's implications require us to rebuild the present SEU-IEO model in orderto specify the endogeneity of students' subjective expected probability of educationalsuccess more adequately. After a short description of the dataset and the variables, aseries of stepwise logit models both without and with controls for selection bias willbe presented and discussed. These models are amended by sensitivity analyses for theself-ful�lling prophecy indicators. The paper ends with a conclusion and provides anoutlook on potential extensions of the model.
216
IV. The Impact of Teachers' Expectations on Students' Educational Opportunities in The Life Course
2 Theory and Hypotheses
2.1 Inequality in Educational Opportunities: Educational
Transition Models
One of the most in�uential theoretical components of Boudon's (1974, p. 29�.) mono-graph for contemporary quantitatively-oriented IEO research is its distinction betweenprimary and secondary e�ects of social inequality.The primary e�ect of educational inequality states that the lower educational suc-
cess of lower-SES children may be due to their lower capabilities � be they de�ned aseducational interests, intellectual skills, e�ort, or motivation (Jackson et al., 2007; alsosee Müller-Benedict, 2007). Part of the primary e�ect may in fact be genetic, but an-other, presumably greater part of the above-mentioned characteristics is acquired duringsocialization (Erikson and Jonsson, 1996, p. 10f.).The secondary e�ect, contrarily, operates via stratum-speci�c di�erences in educa-
tional decision making due to di�erential opportunity-cost structures, and Boudon'scrucial assumption is that secondary e�ects still take place once primary e�ects havebeen controlled for (Boudon, 1974, p. 29�.; for a critique see Nash, 2003).1 The ideathat utility considerations may shape students' (or their parents') educational decisionswas taken on in a series of consecutive theoretical models proposed by Goldthorpe (1996),Erikson and Jonsson (1996), Breen and Goldthorpe (1997) as well as Esser (1999). Acommon proposition of these models relates to the idea that it is simpler (i.e. moreparsimonious) to assume that there is no class-speci�c variation in either aspirationstowards education per se or in potentially underlying value systems. Instead, educa-tion is regarded as an investment good the costs and bene�ts of which vary by socialclasses. Each family will strive to avoid downward mobility, but unsurprisingly, for lower-educated parents, this goal will be reached already for lower educational quali�cationsof their children � while for higher-educated parents, a far higher degree will have tobe obtained. Moreover, for the o�spring of parents in less advantageous positions, eachfailed attempt of trying a higher educational alternative will be more serious in its con-sequences concerning both monetary (earnings foregone; loss of �nancial support) andtransactional costs (a loss in itself; the risk of dropping out of the educational system).Erikson and Jonsson (1996) introduce a simple 3-parameter model postulating that
students' utility of continuing education (or opting for the comparably higher educationaltrack) can be regarded as a function of the product of educational bene�t B and theexpected probability of educational success P, minus expected costs of education C(U = PB − C). Esser (1999, p. 165-175) takes up these crucial parameters in order todevelop a model according to the logic of subjective expected utility theory. This morecomplex model is elaborated on in the next paragraph.2
1Some authors also subsume class-sensitive structural conditions at the school level � e.g. in terms ofthe variance of teachers' school track recommendations by parental social class (Pietsch and Stubbe,2007) among secondary e�ects of social inequality as well (e.g. Müller-Benedict, 2007).
2While the model by Erikson and Jonsson (1996) shows the highest theoretical proximity to the Esser(1999) model, also the theoretical accounts by Meulemann (1979) and Breen and Goldthorpe (1997)
217
2 Theory and Hypotheses
Esser's' Subjective-Expected-Utility model Esser (1999) uses a subjective-expected-utility (henceforth referred to as SEU ) model to explain the mechanisms of parentaleducational choices at the end of primary school education. The expected utility EU forthe alternatives at hand, to continue onto lower secondary school (An) or to continueonto intermediate or upper secondary school tracks (Ab) will be as follows:
EU(An) = Psd(−SD) (1)
EU(Ab) = PepB + (1− Pep)Psd(−SD)− C. (2)
Here, SD is the value of status decline with Psd as its impact (in terms of a subjectiveprobability) on parental decisions; B is the bene�t of higher education (e.g. in terms oflabour market prospects); Pep is the subjective probability of successfully completing thechosen school track; and C are the expected costs of education (also see Becker, 2003;Pietsch and Stubbe, 2007). By simple linear transformations, Esser (1999) shows that
EU(Ab) > EU(An) ⇐⇒ B + PsdSD > C/Pep, (3)
while the term B + PsdSD can be denoted as the educational motivation and the termC/Pep as the investment risk. Thus, a higher level of education will be aspired if theeducational motivation to continue somehow exceeds the underlying investment risk.Since in case of low Pep, educational motivation has to be very high to exceed the criticalthreshold of the investment risk, the model can also account for the fact of persistinginequality in educational opportunities (Esser, 1999, p. 270).Among educational transition models, both the Breen-Goldthorpe- and the Esser
model have been tested most comprehensively (Jonsson, 1999; Breen and Jonsson, 2000;Becker, 2003; Stocké, 2007; Schneider, 2008). However, in terms of methodology, Becker's(2003) operationalization controlling for selection bias via �Heckit� correction (Heckman,1979) was referred to being the best available test of Esser's (1999) model (Stocké, 2007,p. 508). In this model, �rst the impact of parental social class on each of the indicatorsB, −SD, Psd, Pep and C is used to correct for sample selection bias in the explanation ofthe choice of upper secondary school. Second, these e�ects are again used to control forselection bias in the explanation of the transition to particular school tracks (see section3.4 for a more formal description of the Heckit correction).Becker (2003) justi�es his three-step method by the endogeneity of the causal struc-
ture. However, the next subsection will provide arguments for the presence of anotherendogeneity that apparently has been neglected so far but is worth considering: theimpact of teachers' expectations on the students' probability of successfully completingthe chosen school track, Pep.
2.2 Pygmalion in the Classroom
The idea of a self-ful�lling prophecy was �rst established by Robert Merton (1948). Inthis seminal paper he showed how prejudices towards out-groups (e.g. African Ameri-cans) or speci�c attitudes about a certain situation (e.g. the rumor of a bank's illiquidity)
evidently capture similar ideas.
218
IV. The Impact of Teachers' Expectations on Students' Educational Opportunities in The Life Course
might become true simply as a consequence of the former judgments: "The prophecy ofcollapse led to its own ful�llment" (Merton, 1948, p. 195). Following the well-knownstudy of Rosenthal and Jacobson (1968), the e�ect of misled teacher expectations onstudents future school achievement has been labeled as the Pygmalion e�ect.3 The ideabehind the metaphor holds that teachers' too high or too low expectations can have animpact on the teacher-student interaction, which, in turn, might in�uence the studentsto adopt their motivations and aspirations according to their teachers' expectations. Inthe words of Merton, teachers' expectations, which had originally been misled, would inturn lead to their own ful�llment.
The classical Pygmalion In the original study, Rosenthal and Jacobson (1968) ad-ministered a nonverbal intelligence test to elementary school children. However, they didnot tell the teachers that this was an intelligence test but claimed that it was a new toolto identify 'late bloomers', i.e. children who were likely to show a sudden and dramaticintellectual spurt over the upcoming school year. Although the 'late bloomers' wereactually selected randomly, Rosenthal and Jacobson (1968) observed that in an IQ testwhich was administered one year later they gained signi�cantly better test scores than thecontrol-group students. Thus, the false expectations of the teachers (who had been ledto believe in the arti�cially created group of late bloomers) had become true.4 Whereasmany social psychologists took Pygmalion as a con�rmation of their thesis that socialreality is mainly created by one's own expectations, educational psychologists were muchmore skeptical with regard to Pygmalion's methodological prerequisites and the possibil-ity of alternative explanations which, according to them, Rosenthal and Jacobson (1968)have not su�ciently controlled for (Jussim and Harber, 2005, 139).5
Trying to refute his critics, Rosenthal became one of the pioneers in meta-analyses.His and Rubin's (Rosenthal and Rubin, 1978) meta-analysis of the �rst 345 studiesfrom various research categories (reaction time, inkblot tests, animal learning, labora-tory interviews, psycho-physical judgments, learning and ability, person perception, andeveryday life situations) concluded that self-ful�lling prophecies do exist and show ef-fect sizes between d = .14 up to d = 1.73 and r = .07 up to r = .65 (Rosenthal andRubin, 1978, table 1).6 A second meta-analysis based on a more narrowly de�ned set
3According to the Greek myth as it is narrated by Ovid (Metamorphoses, X ), the Cypriot sculptorPygmalion carved a woman out of ivory. This statue was so beautiful that he fell in love with it.Due to his caress, the statue �nally gets alive, they marry and have a son.
4While social psychology di�erentiates between the Pygmalion e�ect of self-ful�lling over -estimationsand the Golem e�ect of self-ful�lling under -estimations, I use the more common term of Pygmalionto capture both types of self-ful�lling prophecies.
5Critics remarked that both groups of children � late bloomers and controls � showed IQ gains overthe next year. The di�erences between the gains of the two groups (four percentage points) aresigni�cant, but less 'dramatic' than the gross IQ gain of 12 percent of the experimental groupstudents would suggest. For this and other critiques with regard to the original Rosenthal andJacobson (1968) study see Thorndike (1968), Jensen (1969), Snow (1969), Elasho� and Snow (1971),Wineburg (1987), Roth (1995), and Jussim and Harber (2005).
6Both d and r are measures of meta-analytic e�ect sizes. E�ect size r can be obtained from t, F , χ2,and Z statistics. E�ect size d is a linear transformation of r. For a more elaborate discussion see
219
2 Theory and Hypotheses
of Pygmalion studies examined that the e�ect of teachers' expectations on students' IQscores was .16 by average (Smith, 1980). Raudenbush (1984) found an e�ect size of .11by average and additionally revealed that the e�ect of teachers' expectations at t0 onlater IQ scores at t1 highly depends on how long the teachers have already been teachinga particular class.7
Although critics like Wineburg (1987) refused to accept an impact of teachers' expecta-tions on students' intelligence scores, Raudenbush (1994) re-analyzed the 18 experimentsof his earlier study (Raudenbush, 1984) based on random e�ect models and now foundan e�ect size even of r=.20.
Need for mediators and moderators Given these results, one evident weakness ofPygmalion regardless of its operationalization lies in an insu�cient control of both stu-dent and teacher background variables as either mediators or moderators.8 In particular,more research is obviously needed with regard to students' social backgrounds (Jussimand Harber, 2005). Concretely, there are only three studies who explicitly consideredthese e�ects: First, Madon et al. (1997) found that self-ful�lling prophecies appear to bestronger among students who had a 'prior history of low-achievement', which was opera-tionalized as their standardized results in a test that had been administered prior to theactual experiment. Basically, the authors' operationalization of self-ful�lling propheciesas teachers' over- and underestimations appears to be very promising (and will thus alsobe used in the study at hand): Whereas in experimental studies such as the originalPygmalion study (Rosenthal and Jacobson, 1968), the researcher can expose a teacherto false information in order to ensure that her expectations are really inaccurate, innaturalistic (such as survey data) studies, this is not equally possible (Jussim, 1986). Toovercome this problem, Madon et al. (1997) �rst regressed teachers' expectations (relatedto students' performance, talent and e�ort) on a set of student background variables. Ina second step, they used the residuals of these regressions � re�ecting a student's over-or underestimation by her teacher � as new variables to ensure that a teacher's expec-tation is, to some extent, actually inaccurate. However, for their purpose of identifyingmoderator variables their model unfortunately su�ers from a methodological weakness.9
Second, Jussim et al. (1996) found evidence that self-ful�lling prophecies are moder-
Rosenthal and DiMatteo (2001).7A duration of less than 5 weeks yielded an e�ect size of up to .55, whereas a duration of 24 weeksled to an e�ect size of -.13 (Raudenbush, 1984, p. 91). Thus, the longer a teacher is teaching in aparticular class, the better she knows her students and the lesser are the consequences of possiblemisjudgments.
8Among the few exceptions of empirical studies taking moderator e�ects into account, the meta-analysis by Raudenbush (1984) which found that the e�ect size of self-ful�lling prophecies varies byteachers' duration in class has already been mentioned. Moreover, in the same study Raudenbush(1984) found that the e�ect also varies by grade level. And �nally, self-ful�lling prophecies appearto be weaker in more 'di�erential' teacher treatment contexts (Brattesani et al., 1984).
9Concretely, among the set of background variables that was used to identify teachers' over- andunderestimations, we can �nd students' 5th grade math test scores � which were also used to identifylow and high achievers (Madon et al., 1997, p. 798). Therefore, it is not surprising that the authors�nd a variation in the e�ect size of self-ful�lling prophecies based on this variable.
220
IV. The Impact of Teachers' Expectations on Students' Educational Opportunities in The Life Course
ated by both social class and ethnicity-related variables. In their study, the standardizedrelationship between teachers' perceptions and students' future test scores was about .25for students of parents with a lower education, and .03 for students of parents with ahigher education. In the United States, similar di�erences could be detected betweenCaucasian students and African-American ones in terms of a standardized e�ect size of.14 and .37, respectively. Third, Madon et al. (1998) noted that teachers' perceptionsof students' performance and talent (but not of their ability) correlate bivariately withstudents' social class (operationalized as an index of parental education and parental in-come). However, these bivariate associations diminish when additional predictors suchas students' school grades, intelligence test scores and their motivation are introduced inmultivariate analyses. Hence, the largest share of the di�erences that teachers identifybetween social groups corresponds closely to actual di�erences in previous grades andachievement tests.
Implications What does this overall mixed evidence suggest? First, the phenomenon ofa self-ful�lling prophecy is hard to identify analytically. As we saw, not only experimental-group students achieved a gain in their IQ test scores but also control-group students(Rosenthal and Jacobson, 1968). Second, one can note that one solution might be tocompute a 'net' e�ect of self-ful�lling prophecies in the way of Madon et al. (1997).Although those strategies evidently are not without pitfalls, they might be helpful inseparating self-ful�lling prophecy e�ects from other intervening mechanisms. Third, andmost important, we saw that self-ful�lling prophecy research lacks of a su�cient consid-eration of student background variables. This is precisely where the SEU-IEO frameworkcomes back in: Just as self-ful�lling prophecy research depends on considering studentbackground variables, the SEU-IEO framework lacks the consideration of exactly thatendogeneity concerning students' probability of educational success which is the mainpoint of all Pygmalion studies. The task in the next section will be to integrate themain idea of a 'net' e�ect of a self-ful�lling prophecy into the SEU-IEO framework.
2.3 Development of an SEU Model of Self-Ful�lling Prophecies
Given the utility relations of the conventional SEU-IEO model as outlined in section2.1, educational decisions would be a direct function of net utility. However, this seemsto be only half the truth, for it would neglect the idea of a self-ful�lling prophecy in theclassroom. In line with the main idea of Pygmalion, claiming that a teacher's expecta-tions may have a distinct e�ect on students' later school achievement implies that the'real' transition rates are not only a result of 'subjective' parental utility comparisons,but also of 'objective' interactions in the classroom: �A shortcoming of the standardeconomic approach to decision making is that it ignores the endogeneity of preferences- that students' preferences are socially constructed through interaction with peers andother signi�cant persons� (Lauen, 2007, 183). The consequence of admitting an endo-
221

2 Theory and Hypotheses
geneity of preferences in the classroom is to also assume an endogeneity of pep10, i.e. of
the subjective expected probability of successfully completing the chosen school track.Following both Breen and Goldthorpe (1997, p. 285) as well as Esser (1999, p. 272f.),the subjective probability of educational success depends on students' objective schoolperformance. In accordance with Esser's notation, this reads
pep = f(AP ), (4)
while AP denotes students' academic performance. Claiming that teachers' expectationsin terms of a 'net' e�ect of self-ful�lling prophecies (Madon et al., 1997) at time t, TEt,may in�uence students' academic outcomes at a later time t+ 1 can be formalized as
APt+1 = g(TEt). (5)
For pept+1thus holds
pept+1= f(g(TEt)) (6)
� meaning that subjective probability assumptions are a function of students' objectiveschool performance which is, in terms of a self-ful�lling prophecy, dependent on teachers'earlier expectations. Notably, in self-ful�lling prophecy research, many studies stressthat the crucial mechanism of teacher expectancy e�ects also operates via students' self-concept and their aspirations (Jussim, 1989; Gill and Reynolds, 1999; Muller et al., 1999;Mechtenberg, 2009; Mistry et al., 2009).11
Will APt+1 be the only variable that a�ects pept+1? Certainly not. Concretely, I
assume that equation (6) can be decomposed into
pept+1= h(pept , APt+1, ε). (7)
Equation (7) expresses that students' subjective expected probability of educationalsuccess is a function of her preceding subjective expected success probability, her ac-tual academic performance and an unspeci�ed teacher treatment e�ect ε that capturesclassroom praise, bilateral encouragement, and similar mechanisms (without making anyassumptions about the functional form of this relation).We should now apply this idea on Esser's (1999) formal model by tracking the logic of a
SFP in its appropriate survey-data framework of teachers' over- and underestimations.12
Let δ ∈ {0, 1} indicate whether a student has been underestimated (δ = 0) or overesti-mated (δ = 1) by her teacher. Restricting the other SEU parameters to remain constantover time, let further pep• = pept + ∆pep to get rid of time indices (see Jaeger and Holm,
10To appreciate that this term and psd refer to subjective expected probabilities, I will use lowercase pin the following.
11? propose a formal model of Pygmalion e�ects applied to management science which also highlightsthe importance of subjective success probability assumptions; but since this model is neither tangentto the �eld of educational transitions nor to the respective rational action model, I do not discuss itin more detail.
12In section 3.3, I will measure teachers' over- and underestimations by the residuals of a regression ofteachers' evaluations on both students' performance and their motivation, (see Madon et al., 1997).
222
IV. The Impact of Teachers' Expectations on Students' Educational Opportunities in The Life Course
2011, for a similar analytic strategy) � that is, pep• captures students' initial subjectiveexpected probability of educational success plus (or minus) the additional gain (or loss)∆pep that is due to an over- (or under-)estimation as sketched in (7).13 If �nally pep− andpep+ denote the under- and overestimated students' corresponding subjective expectedprobability of successfully completing the chosen school track, respectively, then we canrewrite equation (3) as follows:
EU(Ab) > EU(An) ⇐⇒ B + psdSD >C
[δ · pep+ + (1− δ) · pep− ](8)
As the argument goes, on average pept+1|δ=1> pept+1|δ=0
since on the one hand, APt+1|δ=1 >APt+1|δ=0, and on the other hand, εδ=1 > εδ=0. Holding constant for pept , it follows thatpep+ > pep− . Since the denominator of the right-hand side of equation (8) then is largerfor δ = 1 than for δ = 0, it follows that
EUδ=1(Ab) > EUδ=0(Ab), (9)
that is, other things being equal, students who had been overestimated by their teachersshould have a higher expected utility of choosing the next higher-level school-track thanstudents who had been underestimated.
Model identi�cation In the above-sketched model I assume that self-ful�lling prophe-cies directly enter the students' utility function. However, it has to be clari�ed which typeof rationality students' utility function relies on. A student who has been overestimatedby her teacher will dispose of a higher subjective expected probability of educationalsuccess not only because of her better grades, but also because of more subtle teachertreatment e�ects (above referred to as ε) that may be understood quite similarly tothe 'caress' e�ect in Ovid's metamorphoses. As Morgan (1998, p. 136) writes, students�adopt the expectations that others have of them and add these to their own expectationsformed independently through their own rational self-re�ection�. Adding expectationsof teachers in their role as signi�cant others (Sewell et al., 1969, 1970; Morgan, 1998,2002) may be an unconscious endeavor, but in altering a crucial parameter of the utilityfunction, they might also a�ect quite rational utility considerations.The question is now how the crucial parameters can be estimated in an empirical
model. My answer is that the current framework in social psychology of residualizingteachers' expectations (Madon et al., 1997, 2006) is very helpful for identi�cation pur-poses. The assumption is that when teachers' expectations are residualized for students'achievement, their motivation and self-concept at t1, the relations that are addressed in(7) can be approximated also in case of lacking empirical measures. While pept can bemeasured from the data at hand (see section 3), I do not have indicators for APt+1 andε. But I assume that by regressing teachers' evaluations on a set of performance andmotivation variables, di�erences in students' academic performance between t and t+ 1
13To some extent, my theoretical model resembles the value-added approach in school e�ectivenessresearch (Ladd and Walsh, 2002; Rivkin et al., 2005).
223
2 Theory and Hypotheses
as well as unobserved teacher treatment factors that exceed (or undershoot) students'motivation and their self-concept at t (and thereby take e�ect as a causative factor for∆pep) can, if admittedly not entirely isolated, at least be approximated.Hence, I assume that residualizing teachers' expectations as proposed by Madon et al.
(1997, 2006) provides a useful tool for approximating the unobserved mechanisms thatenter students' rational utility function by both consciously and unconsciously in�uenc-ing a crucial parameter thereof.
2.4 Hypotheses
After these theoretical considerations my main hypothesis is easily outlined: I postulatethat via their prognostic nature, teachers' expectations have distinct e�ects on students'educational transitions in terms of a self-ful�lling prophecy. By 'distinct e�ects' I meanthat they will have a signi�cant impact apart from the convenient theoretical conceptsof the SEU-IEO model (Esser, 1999). Since a major claim of rational-action theories ofeducational transitions is that secondary e�ects of social inequality do not only a�ectthe actual transition decisions but also the decision for or against continuing the chosenschool track (Breen and Goldthorpe, 1997), as a �rst step I aim to analyze the probabilityof German 10th class Gymnasium students to achieve a high school degree ('Abitur').This certi�cate all along used to be and still is the crucial prerequisite for access totertiary education. When surveyed mid of 10th grade, German Gymnasium students arestill facing a crucial decision: They could continue education in secondary school level II('Gymnasiale Oberstufe') that would be successfully �nished by obtaining Abitur after(at that time consistently) three years � or they could quit secondary school immediatelyat the end of 10th grade, or thereafter, without having passed Abitur. As Schneider (2008,�gure 2b) recently observed by using GSOEP data, even after 9 years of secondary-schooleducation, for students from the salariat, the survivor function modeling the probabilityof not dropping out from Gymnasium lies remarkably above the corresponding survivorfunction for students from working class. Hence, one can assume that secondary schoolcost-bene�t considerations as postulated by Esser (1999), inter alia, are equally an issuefor passing Abitur.In a second step, I will also model students' transition propensities to tertiary edu-
cation in terms of starting academic studies. Becker and Hecken (2009a,b) argue thatutility considerations as re�ected in Esser's (1999) SEU model are also pivotal for uni-versity transitions. One social mechanism that could account for transition di�erencesbetween the social strata at this comparably later point in students' educational lifecourse is that their respective time horizon might di�er, too. The impending costs ofhigher education are accompanied by merely uncertain returns � which may be moresigni�cant for students from the lower social classes than for those from the salariat(Becker and Hecken, 2009b, p. 235f.). Therefore, the former can be expected to makethat transition less frequently than the latter.Due to the fact that rational-action theories on IEO in general have proven useful also
in predicting higher-level transitions (Jonsson, 1999; Need and De Jong, 2001; Beckerand Hecken, 2009a,b; Hillmert and Jacob, 2010), I take the SEU model as given in order
224
IV. The Impact of Teachers' Expectations on Students' Educational Opportunities in The Life Course
to keep the number of hypotheses reasonably small for avoiding di�culties in causalidenti�cation of my models. Therefore, according to the formal model of self-ful�llingprophecies I have proposed above, there remain only two (nonetheless important) hy-potheses to test:
H1 : Apart from the SEU-model indicators, students' probability of achieving a high schooldegree increases with (positive) self-ful�lling prophecies, SFP .
H2 : Apart from the SEU-model indicators, students' probability of starting academic studies
increases with (positive) self-ful�lling prophecies, SFP .
As indicated above, due to data restrictions, I am not able to test for a direct im-pact of teacher expectations on students' future school performance (as Pygmalion inits initial form would require). However, I assume that given the (in my view) adequateoperationalization of SFP in terms of over- and underestimations � approximating thefactors that a�ect student di�erences in their subjective expected probability of educa-tional success ∆pep�, we can identify an estimate that gets quite close to the unobservedmechanisms of the 'real' self-ful�lling prophecy.14 The next section will provide an in-sight into which measures will be used concretely.
3 Operationalization
3.1 Data
All analyses will be based on a German panel dataset which is known as the 'KölnerGymnasiasten-Panel' (Engl. 'Cologne High School Panel', henceforth referred to asCHiSP). The CHiSP consists of an initial (student-level) survey from 1969 (Gesis-No.:ZA0600) with N = 3385 10th-grade Gymnasium15 students in North Rhine-Westphaliawith three re-surveys in 1985 (Gesis-No.: ZA1441; N = 1987), 1996/97 (Gesis-No.:ZA4228; N=1596), and 2010 (N = 1301; no Gesis-No. available yet). In the initialsurvey, students were asked about issues like their performance, interests and plansin school and about their social background and their relationship to their parents.Simultaneously to the initial survey, the students took part in an Intelligence S tructureT est (IST) containing four sub-scales developed by Amthauer (1957). At the same time,also the students' teachers (Gesis-No.: ZA0640; N=1701) and their parents (Gesis-No.:ZA0639; N=2646) have been surveyed. The main items of the parent questionnaire were
14In this context, one could also refer to the distinction between substantive and empirical statisticalmodels (Cox, 1990), or between scienti�c models presented in statistical form and statistical modelsper se (Rogosa, 1987; Sø rensen, 1998). The point is that the former �are intended to representreal processes that have causal force (whether or not directly observable)� while the latter �arethose which sociologists normally use and are concerned with relations among variables that maybe determined through techniques of rather general applicability� (Goldthorpe, 2001, p. 14).
15For more detailed descriptions of the German educational system see Jürges and Schneider (2006),Pietsch and Stubbe (2007), and Schneider (2008).
225
3 Operationalization
about their social background, their style of raising children and their aspirations fortheir children. Amongst others, teachers were asked about several evaluative and otherpedagogic issues. In an investigation of the Central Archive for Empirical Research inCologne (today known as Gesis - Leibniz Institute for the Social Sciences), the 10th classand Abitur grades (if passed) could be examined and were merged with the data. In thetwo re-surveys, the former students provided detailed information on their educationaland occupational careers until the age of 43. I chose this admittedly older data, becauseto the best of my knowledge, it is the only available longitudinal dataset that containsappropriate measures of both indicators of the SEU model outlined by Esser (1999) andof teachers' expectations that are required to construct over- and underestimations inorder to operationalize self-ful�lling prophecies adequately. The latter indicator will bedescribed in the next but one paragraph.
3.2 Variables
Dependent variables In the hypotheses section I identi�ed two dependent variables.The �rst dependent variable is de�ned by whether the students have achieved a highschool degree (Abitur) or not. While the CHiSP also includes information about whetherthe former students have ever achieved Abitur in their later life, I will focus on thosestudents only who achieved Abitur during the regular schooling time. This appears tobe logically consistent since secondary e�ects of social inequality can also be understoodas a decision for vs. against continuing higher education (Breen and Goldthorpe, 1997;Schneider, 2008). Hence, I want to focus on those students only who passed Abitur onthe �rst try (event=1) using all observations that did not achieve Abitur within 3 yearsafter the 10th class survey in 1969 as a reference (event=0).16 The second dependentvariable is given by whether the former students have ever started academic studies.Since my analyses will be based on panel data, I have to take into account that from atheoretical point of view, it would be possible for the former students to start academicstudies at any later point in time � including data points set after the last survey of theCHiSP (currently 2010). This problem will be solved empirically in section 4.1.
Independent variables The expected bene�t of education, B, is operationalized bystudents' appraisement if Abitur were to be considered a necessity in order for themto reach their aim in life. Students had the following reply options: 1 'yes, necessary';2 'useful, but not necessary'; and 3 'not important'. I dichotomized this variable intothe two categories 0 'not important' and 1 'useful or necessary'. The value of statusdecline, −SD, is measured by parents' disappointment if their child did not pass Abitur.The categories of this variables are 1 'not much'; 2 'little'; 3 'very disappointed'; 4'would be the worst'. I dichotomized this variable as follows: 0 'not much / little'; 1'very disappointed / would be the worst'. I operationalize the expected status decline,
16Since the zero point of counting has been backdated to January 1967 and I do not want to excludestudents who had to participate in makeup exams, I set the cut-o� value to 80 months beginningfrom the starting point.
226
IV. The Impact of Teachers' Expectations on Students' Educational Opportunities in The Life Course
psd by parents' assessments about the importance of good Abitur grades for students'later occupational success. The original categories of this variable (1 'little'; 2 'not thatmuch'; 3 'big'; 4 'very big') were dichotomized into 0 'little / not much' and 1 'big /very big'. Students' subjective educational performance pep is measured by a probabilityassumption of the parents whether their o�spring is able to complete the chosen schooltrack. The original variable (1 'de�nitely'; 2 'probably'; 3 'don't know'; 4 'probablynot') is recoded as follows: 0 'probably not/don't know'; 1 'probably/de�nitely'. Theexpected costs of education, C, are operationalized by parents' assessment if they had tomake �nancial sacri�ces in order to o�er higher education to their children. Again, theoriginal categories of the variable (1 'no', 2 'little' and 3 'yes') are recoded into a dummyvariable: 0 'no/little'; 1 'yes' (see Becker, 2003, for a comparable operationalization ofthe SEU predictors).17 To keep results comparable with previous tests of the SEU model(Becker, 2003; Becker and Hecken, 2009a,b), I follow these authors in presenting both anadditive SEU model as well as the interaction terms for students' educational motivationand their investment risk as required by the Esser (1999) model.Self-ful�lling prophecies, SFP , should adequately be operationalized based on teach-
ers' expectations. In the CHiSP the latter are measured by a speci�c form of teachers'evaluations: Teachers were asked to evaluate by a dichotomous decision whom studentsthey suppose to be able for academic studies, and whom of them not. Since the questionwas phrased openly, teachers could mention students as being able, being not able, ornot at all.This data structure causes two problems. First, each student could be evaluated by
more than one teacher, and each teacher could evaluate more than one student. Ananalysis of the intra-class correlations (ICC) revealed a considerable variance of multipleevaluations for each student (not shown, available upon request). Second, the opennessof the question is not without problems, because it has to be clari�ed whether the'missing' category really can be treated technically as a missing value, or if we were toloose substantive information when proceeding on this assumption.To overcome the �rst problem, analyses reported below will focus on class teachers'
evaluations only. I expect that the intra-individual variance of teachers' evaluationspartially depends on the quality of teacher-student relationships. I assume that classteachers have a more intense relationship to and a better knowledge of their studentsthan 'ordinary' teachers. Thus, looking only at class teachers' evaluations will bothsimplify the data structure and overcome the problem of inter-teacher variance.18 Inorder to overcome the second problem, as a preliminary analysis, two logistic regressions
17Dichotomization of all SEU predictors follows both a theoretical and a methodological directive.Regarding theory, the SEU model explicitly demands certain terms such as pep or psd to be 0-1 coded (Esser, 1999, p. 269). Regarding methodology, the application of techniques correctingfor sample selection bias (Heckman, 1979) requires to estimate a probit model in the �rst step �necessitating a dichotomous outcome.
18As regards social mechanisms, I further expect that class teachers' evaluations might very well be anapproximation of teachers' evaluations in general: There is good reason to presume a notable amountof communication between teachers, e.g. in the teachers' lounge, and especially class teachers couldbe agenda setters in terms of shaping other teachers' expectations in a �grading continuation game�(Mechtenberg, 2009, p. 1437f.).
227
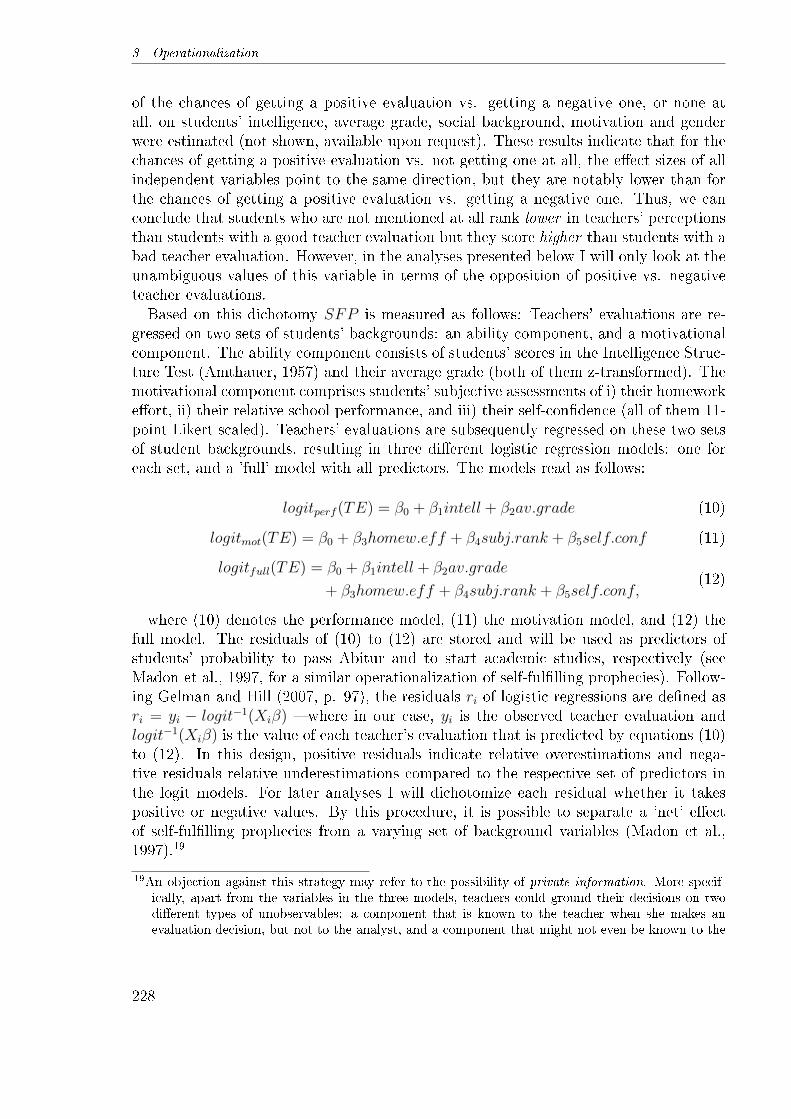
3 Operationalization
of the chances of getting a positive evaluation vs. getting a negative one, or none atall, on students' intelligence, average grade, social background, motivation and genderwere estimated (not shown, available upon request). These results indicate that for thechances of getting a positive evaluation vs. not getting one at all, the e�ect sizes of allindependent variables point to the same direction, but they are notably lower than forthe chances of getting a positive evaluation vs. getting a negative one. Thus, we canconclude that students who are not mentioned at all rank lower in teachers' perceptionsthan students with a good teacher evaluation but they score higher than students with abad teacher evaluation. However, in the analyses presented below I will only look at theunambiguous values of this variable in terms of the opposition of positive vs. negativeteacher evaluations.Based on this dichotomy SFP is measured as follows: Teachers' evaluations are re-
gressed on two sets of students' backgrounds: an ability component, and a motivationalcomponent. The ability component consists of students' scores in the Intelligence Struc-ture Test (Amthauer, 1957) and their average grade (both of them z-transformed). Themotivational component comprises students' subjective assessments of i) their homeworke�ort, ii) their relative school performance, and iii) their self-con�dence (all of them 11-point Likert scaled). Teachers' evaluations are subsequently regressed on these two setsof student backgrounds, resulting in three di�erent logistic regression models: one foreach set, and a 'full' model with all predictors. The models read as follows:
logitperf (TE) = β0 + β1intell + β2av.grade (10)
logitmot(TE) = β0 + β3homew.eff + β4subj.rank + β5self.conf (11)
logitfull(TE) = β0 + β1intell + β2av.grade
+ β3homew.eff + β4subj.rank + β5self.conf,(12)
where (10) denotes the performance model, (11) the motivation model, and (12) thefull model. The residuals of (10) to (12) are stored and will be used as predictors ofstudents' probability to pass Abitur and to start academic studies, respectively (seeMadon et al., 1997, for a similar operationalization of self-ful�lling prophecies). Follow-ing Gelman and Hill (2007, p. 97), the residuals ri of logistic regressions are de�ned asri = yi − logit−1(Xiβ) � where in our case, yi is the observed teacher evaluation andlogit−1(Xiβ) is the value of each teacher's evaluation that is predicted by equations (10)to (12). In this design, positive residuals indicate relative overestimations and nega-tive residuals relative underestimations compared to the respective set of predictors inthe logit models. For later analyses I will dichotomize each residual whether it takespositive or negative values. By this procedure, it is possible to separate a 'net' e�ectof self-ful�lling prophecies from a varying set of background variables (Madon et al.,1997).19
19An objection against this strategy may refer to the possibility of private information. More specif-ically, apart from the variables in the three models, teachers could ground their decisions on twodi�erent types of unobservables: a component that is known to the teacher when she makes anevaluation decision, but not to the analyst, and a component that might not even be known to the
228
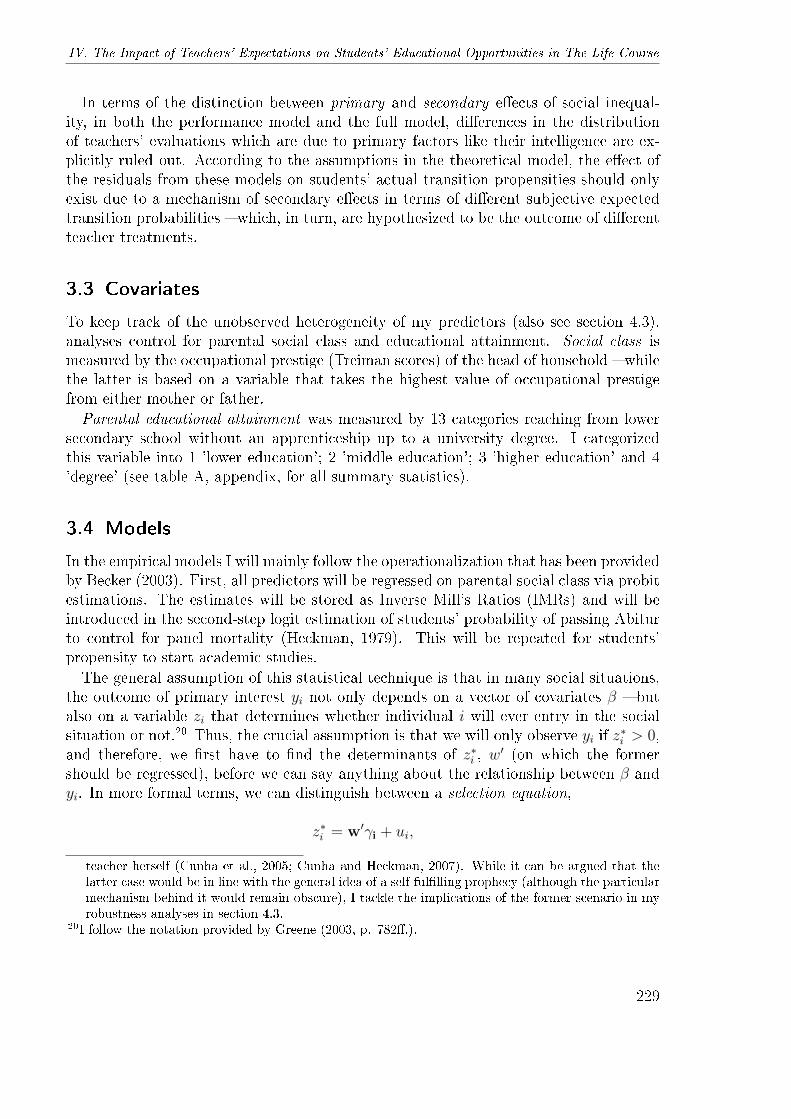
IV. The Impact of Teachers' Expectations on Students' Educational Opportunities in The Life Course
In terms of the distinction between primary and secondary e�ects of social inequal-ity, in both the performance model and the full model, di�erences in the distributionof teachers' evaluations which are due to primary factors like their intelligence are ex-plicitly ruled out. According to the assumptions in the theoretical model, the e�ect ofthe residuals from these models on students' actual transition propensities should onlyexist due to a mechanism of secondary e�ects in terms of di�erent subjective expectedtransition probabilities � which, in turn, are hypothesized to be the outcome of di�erentteacher treatments.
3.3 Covariates
To keep track of the unobserved heterogeneity of my predictors (also see section 4.3),analyses control for parental social class and educational attainment. Social class ismeasured by the occupational prestige (Treiman scores) of the head of household � whilethe latter is based on a variable that takes the highest value of occupational prestigefrom either mother or father.
Parental educational attainment was measured by 13 categories reaching from lowersecondary school without an apprenticeship up to a university degree. I categorizedthis variable into 1 'lower education'; 2 'middle education'; 3 'higher education' and 4'degree' (see table A, appendix, for all summary statistics).
3.4 Models
In the empirical models I will mainly follow the operationalization that has been providedby Becker (2003). First, all predictors will be regressed on parental social class via probitestimations. The estimates will be stored as Inverse Mill's Ratios (IMRs) and will beintroduced in the second-step logit estimation of students' probability of passing Abiturto control for panel mortality (Heckman, 1979). This will be repeated for students'propensity to start academic studies.
The general assumption of this statistical technique is that in many social situations,the outcome of primary interest yi not only depends on a vector of covariates β � butalso on a variable zi that determines whether individual i will ever entry in the socialsituation or not.20 Thus, the crucial assumption is that we will only observe yi if z
∗i > 0,
and therefore, we �rst have to �nd the determinants of z∗i , w′ (on which the former
should be regressed), before we can say anything about the relationship between β andyi. In more formal terms, we can distinguish between a selection equation,
z∗i = w′γi + ui,
teacher herself (Cunha et al., 2005; Cunha and Heckman, 2007). While it can be argued that thelatter case would be in line with the general idea of a self-ful�lling prophecy (although the particularmechanism behind it would remain obscure), I tackle the implications of the former scenario in myrobustness analyses in section 4.3.
20I follow the notation provided by Greene (2003, p. 782�.).
229
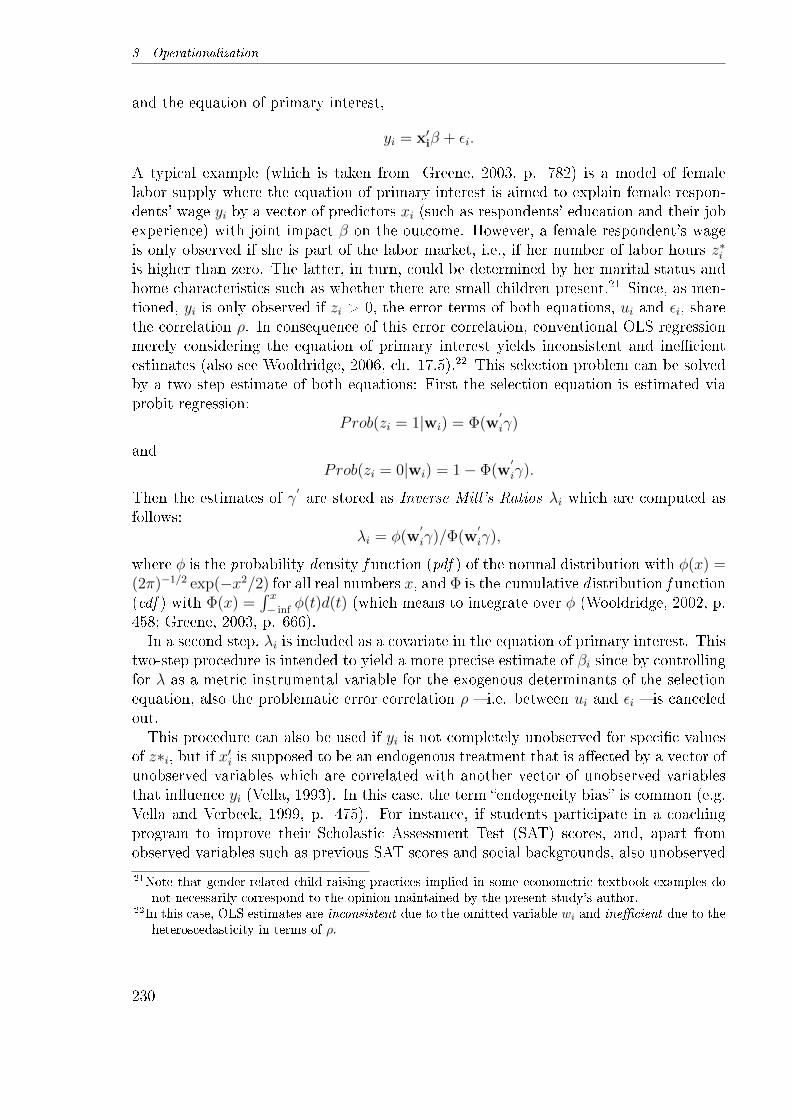
3 Operationalization
and the equation of primary interest,
yi = x′iβ + εi.
A typical example (which is taken from Greene, 2003, p. 782) is a model of femalelabor supply where the equation of primary interest is aimed to explain female respon-dents' wage yi by a vector of predictors xi (such as respondents' education and their jobexperience) with joint impact β on the outcome. However, a female respondent's wageis only observed if she is part of the labor market, i.e., if her number of labor hours z∗iis higher than zero. The latter, in turn, could be determined by her marital status andhome characteristics such as whether there are small children present.21 Since, as men-tioned, yi is only observed if zi > 0, the error terms of both equations, ui and εi, sharethe correlation ρ. In consequence of this error correlation, conventional OLS regressionmerely considering the equation of primary interest yields inconsistent and ine�cientestimates (also see Wooldridge, 2006, ch. 17.5).22 This selection problem can be solvedby a two step estimate of both equations: First the selection equation is estimated viaprobit regression:
Prob(zi = 1|wi) = Φ(w′
iγ)
andProb(zi = 0|wi) = 1− Φ(w
′
iγ).
Then the estimates of γ′are stored as Inverse Mill's Ratios λi which are computed as
follows:λi = φ(w
′
iγ)/Φ(w′
iγ),
where φ is the probability density f unction (pdf ) of the normal distribution with φ(x) =(2π)−1/2 exp(−x2/2) for all real numbers x, and Φ is the cumulative d istribution f unction(cdf ) with Φ(x) =
∫ x− inf
φ(t)d(t) (which means to integrate over φ (Wooldridge, 2002, p.458; Greene, 2003, p. 666).In a second step, λi is included as a covariate in the equation of primary interest. This
two-step procedure is intended to yield a more precise estimate of βi since by controllingfor λ as a metric instrumental variable for the exogenous determinants of the selectionequation, also the problematic error correlation ρ � i.e. between ui and εi � is canceledout.This procedure can also be used if yi is not completely unobserved for speci�c values
of z∗i, but if x′i is supposed to be an endogenous treatment that is a�ected by a vector ofunobserved variables which are correlated with another vector of unobserved variablesthat in�uence yi (Vella, 1993). In this case, the term �endogeneity bias� is common (e.g.Vella and Verbeek, 1999, p. 475). For instance, if students participate in a coachingprogram to improve their Scholastic Assessment Test (SAT) scores, and, apart fromobserved variables such as previous SAT scores and social backgrounds, also unobserved
21Note that gender-related child-raising practices implied in some econometric textbook examples donot necessarily correspond to the opinion maintained by the present study's author.
22In this case, OLS estimates are inconsistent due to the omitted variable wi and ine�cient due to theheteroscedasticity in terms of ρ.
230
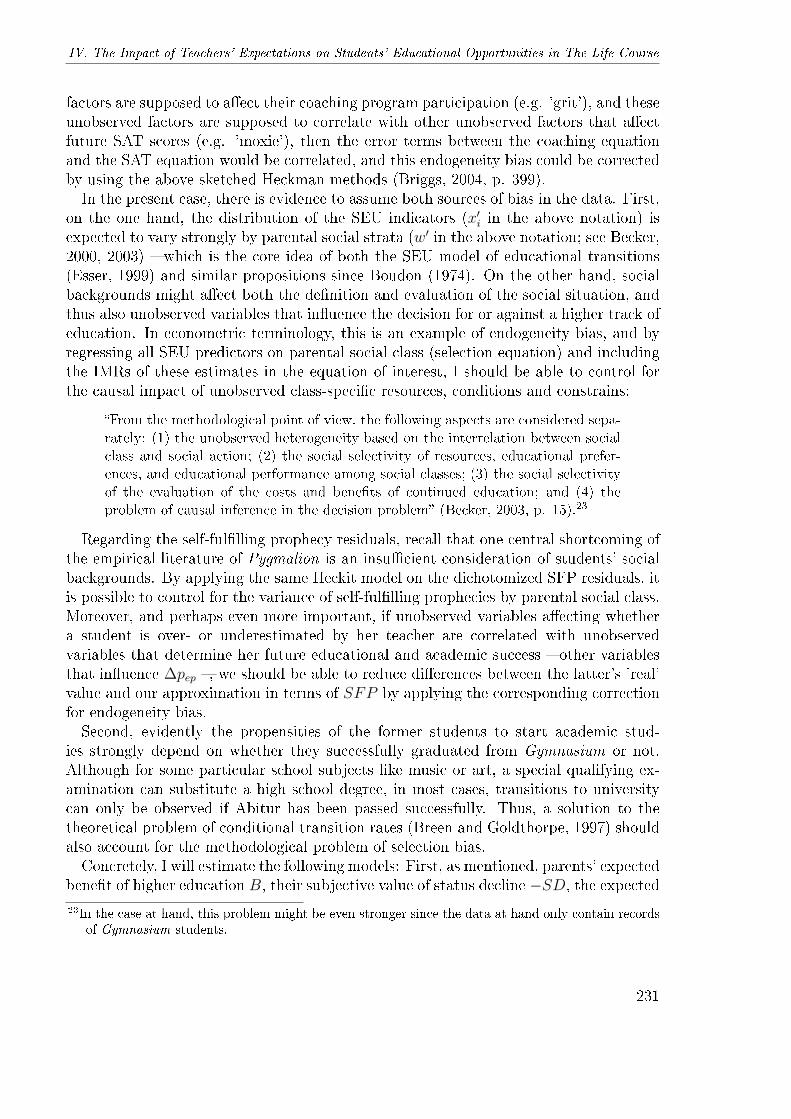
IV. The Impact of Teachers' Expectations on Students' Educational Opportunities in The Life Course
factors are supposed to a�ect their coaching program participation (e.g. 'grit'), and theseunobserved factors are supposed to correlate with other unobserved factors that a�ectfuture SAT scores (e.g. 'moxie'), then the error terms between the coaching equationand the SAT equation would be correlated, and this endogeneity bias could be correctedby using the above-sketched Heckman methods (Briggs, 2004, p. 399).In the present case, there is evidence to assume both sources of bias in the data. First,
on the one hand, the distribution of the SEU indicators (x′i in the above notation) isexpected to vary strongly by parental social strata (w′ in the above notation; see Becker,2000, 2003) � which is the core idea of both the SEU model of educational transitions(Esser, 1999) and similar propositions since Boudon (1974). On the other hand, socialbackgrounds might a�ect both the de�nition and evaluation of the social situation, andthus also unobserved variables that in�uence the decision for or against a higher track ofeducation. In econometric terminology, this is an example of endogeneity bias, and byregressing all SEU predictors on parental social class (selection equation) and includingthe IMRs of these estimates in the equation of interest, I should be able to control forthe causal impact of unobserved class-speci�c resources, conditions and constrains:
�From the methodological point of view, the following aspects are considered sepa-rately: (1) the unobserved heterogeneity based on the interrelation between socialclass and social action; (2) the social selectivity of resources, educational prefer-ences, and educational performance among social classes; (3) the social selectivityof the evaluation of the costs and bene�ts of continued education; and (4) theproblem of causal inference in the decision problem� (Becker, 2003, p. 15).23
Regarding the self-ful�lling prophecy residuals, recall that one central shortcoming ofthe empirical literature of Pygmalion is an insu�cient consideration of students' socialbackgrounds. By applying the same Heckit model on the dichotomized SFP residuals, itis possible to control for the variance of self-ful�lling prophecies by parental social class.Moreover, and perhaps even more important, if unobserved variables a�ecting whethera student is over- or underestimated by her teacher are correlated with unobservedvariables that determine her future educational and academic success � other variablesthat in�uence ∆pep �, we should be able to reduce di�erences between the latter's 'real'value and our approximation in terms of SFP by applying the corresponding correctionfor endogeneity bias.Second, evidently the propensities of the former students to start academic stud-
ies strongly depend on whether they successfully graduated from Gymnasium or not.Although for some particular school subjects like music or art, a special qualifying ex-amination can substitute a high school degree, in most cases, transitions to universitycan only be observed if Abitur has been passed successfully. Thus, a solution to thetheoretical problem of conditional transition rates (Breen and Goldthorpe, 1997) shouldalso account for the methodological problem of selection bias.Concretely, I will estimate the following models: First, as mentioned, parents' expected
bene�t of higher education B, their subjective value of status decline −SD, the expected
23In the case at hand, this problem might be even stronger since the data at hand only contain recordsof Gymnasium students.
231
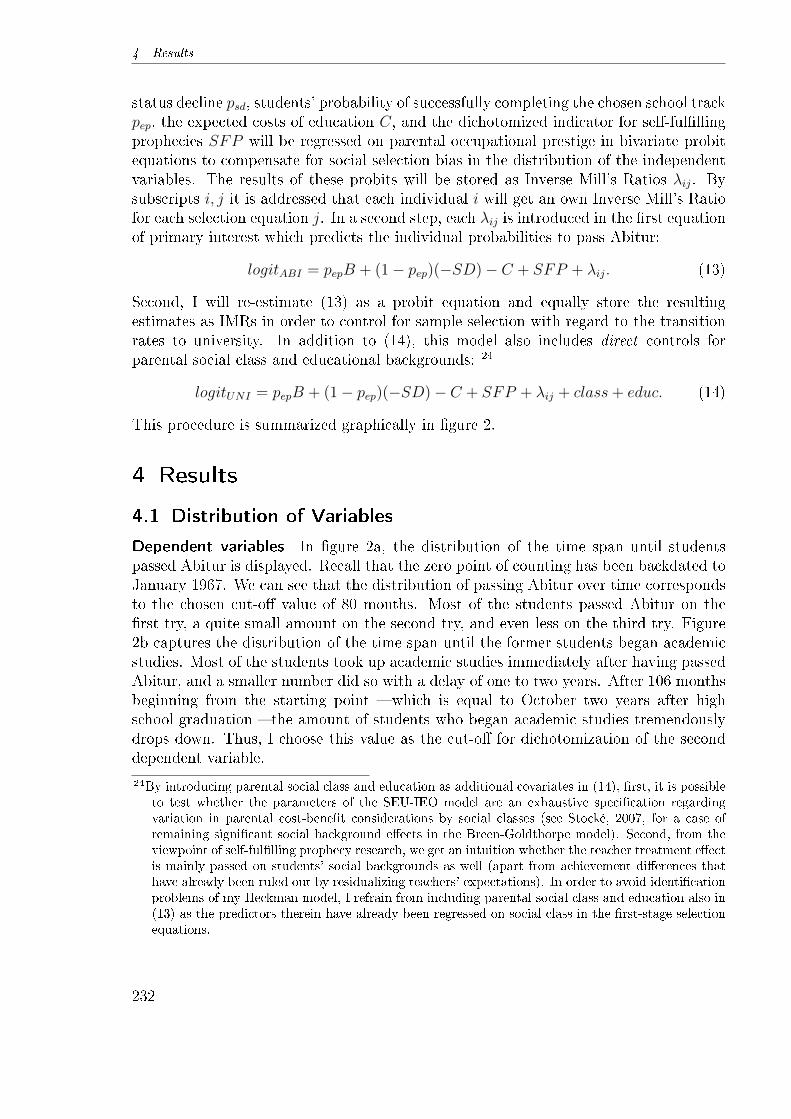
4 Results
status decline psd, students' probability of successfully completing the chosen school trackpep, the expected costs of education C, and the dichotomized indicator for self-ful�llingprophecies SFP will be regressed on parental occupational prestige in bivariate probitequations to compensate for social selection bias in the distribution of the independentvariables. The results of these probits will be stored as Inverse Mill's Ratios λij. Bysubscripts i, j it is addressed that each individual i will get an own Inverse Mill's Ratiofor each selection equation j. In a second step, each λij is introduced in the �rst equationof primary interest which predicts the individual probabilities to pass Abitur:
logitABI = pepB + (1− pep)(−SD)− C + SFP + λij. (13)
Second, I will re-estimate (13) as a probit equation and equally store the resultingestimates as IMRs in order to control for sample selection with regard to the transitionrates to university. In addition to (14), this model also includes direct controls forparental social class and educational backgrounds: 24
logitUNI = pepB + (1− pep)(−SD)− C + SFP + λij + class+ educ. (14)
This procedure is summarized graphically in �gure 2.
4 Results
4.1 Distribution of Variables
Dependent variables In �gure 2a, the distribution of the time span until studentspassed Abitur is displayed. Recall that the zero point of counting has been backdated toJanuary 1967. We can see that the distribution of passing Abitur over time correspondsto the chosen cut-o� value of 80 months. Most of the students passed Abitur on the�rst try, a quite small amount on the second try, and even less on the third try. Figure2b captures the distribution of the time span until the former students began academicstudies. Most of the students took up academic studies immediately after having passedAbitur, and a smaller number did so with a delay of one to two years. After 106 monthsbeginning from the starting point � which is equal to October two years after highschool graduation � the amount of students who began academic studies tremendouslydrops down. Thus, I choose this value as the cut-o� for dichotomization of the seconddependent variable.
24By introducing parental social class and education as additional covariates in (14), �rst, it is possibleto test whether the parameters of the SEU-IEO model are an exhaustive speci�cation regardingvariation in parental cost-bene�t considerations by social classes (see Stocké, 2007, for a case ofremaining signi�cant social background e�ects in the Breen-Goldthorpe model). Second, from theviewpoint of self-ful�lling prophecy research, we get an intuition whether the teacher treatment e�ectis mainly passed on students' social backgrounds as well (apart from achievement di�erences thathave already been ruled out by residualizing teachers' expectations). In order to avoid identi�cationproblems of my Heckman model, I refrain from including parental social class and education also in(13) as the predictors therein have already been regressed on social class in the �rst-stage selectionequations.
232
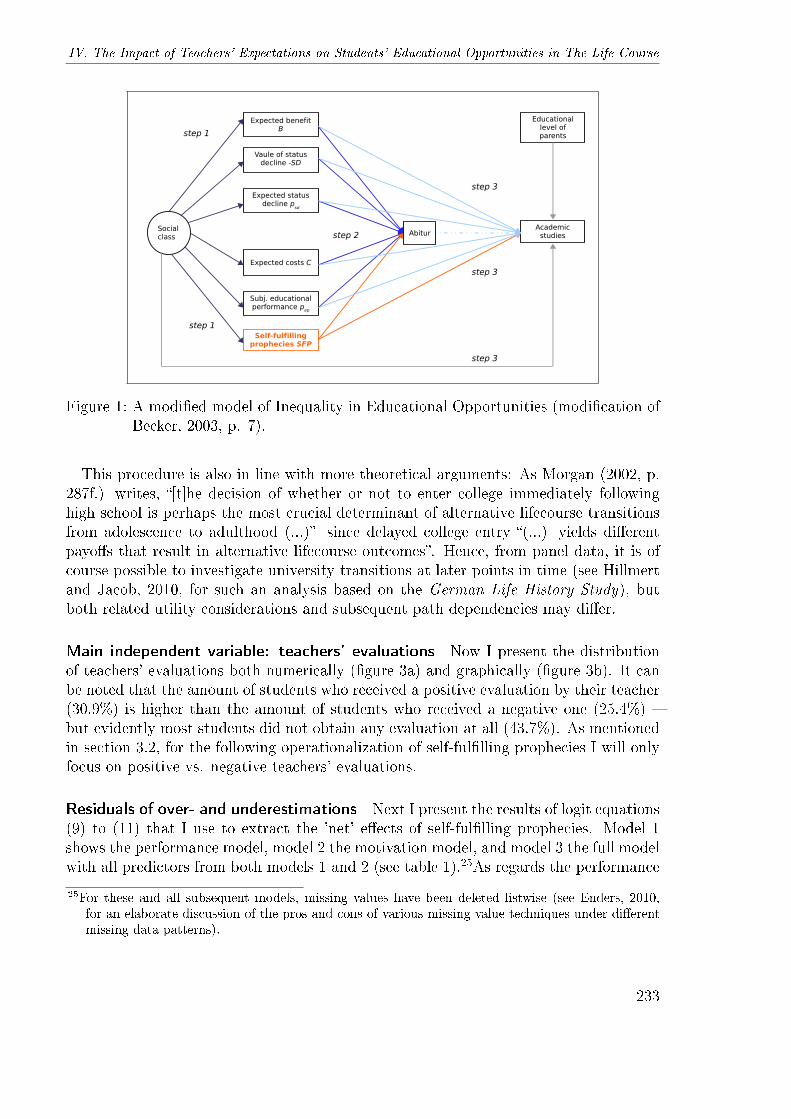
IV. The Impact of Teachers' Expectations on Students' Educational Opportunities in The Life Course
Expected benefit B
Vaule of status decline -SD
Expected status decline p
sd
Subj. educational performance pep
Expected costs C
Social class
Self-fulfilling prophecies SFP
Educational level of parentsstep 1
step 3
step 3
step 1
step 2Academic studiesAbitur
step 3
Figure 1: A modi�ed model of Inequality in Educational Opportunities (modi�cation ofBecker, 2003, p. 7).
This procedure is also in line with more theoretical arguments: As Morgan (2002, p.287f.) writes, �[t]he decision of whether or not to enter college immediately followinghigh school is perhaps the most crucial determinant of alternative lifecourse transitionsfrom adolescence to adulthood (...)� since delayed college entry �(...) yields di�erentpayo�s that result in alternative lifecourse outcomes�. Hence, from panel data, it is ofcourse possible to investigate university transitions at later points in time (see Hillmertand Jacob, 2010, for such an analysis based on the German Life History Study), butboth related utility considerations and subsequent path dependencies may di�er.
Main independent variable: teachers' evaluations Now I present the distributionof teachers' evaluations both numerically (�gure 3a) and graphically (�gure 3b). It canbe noted that the amount of students who received a positive evaluation by their teacher(30.9%) is higher than the amount of students who received a negative one (25.4%) �but evidently most students did not obtain any evaluation at all (43.7%). As mentionedin section 3.2, for the following operationalization of self-ful�lling prophecies I will onlyfocus on positive vs. negative teachers' evaluations.
Residuals of over- and underestimations Next I present the results of logit equations(9) to (11) that I use to extract the 'net' e�ects of self-ful�lling prophecies. Model 1shows the performance model, model 2 the motivation model, and model 3 the full modelwith all predictors from both models 1 and 2 (see table 1).25As regards the performance
25For these and all subsequent models, missing values have been deleted listwise (see Enders, 2010,for an elaborate discussion of the pros and cons of various missing value techniques under di�erentmissing data patterns).
233
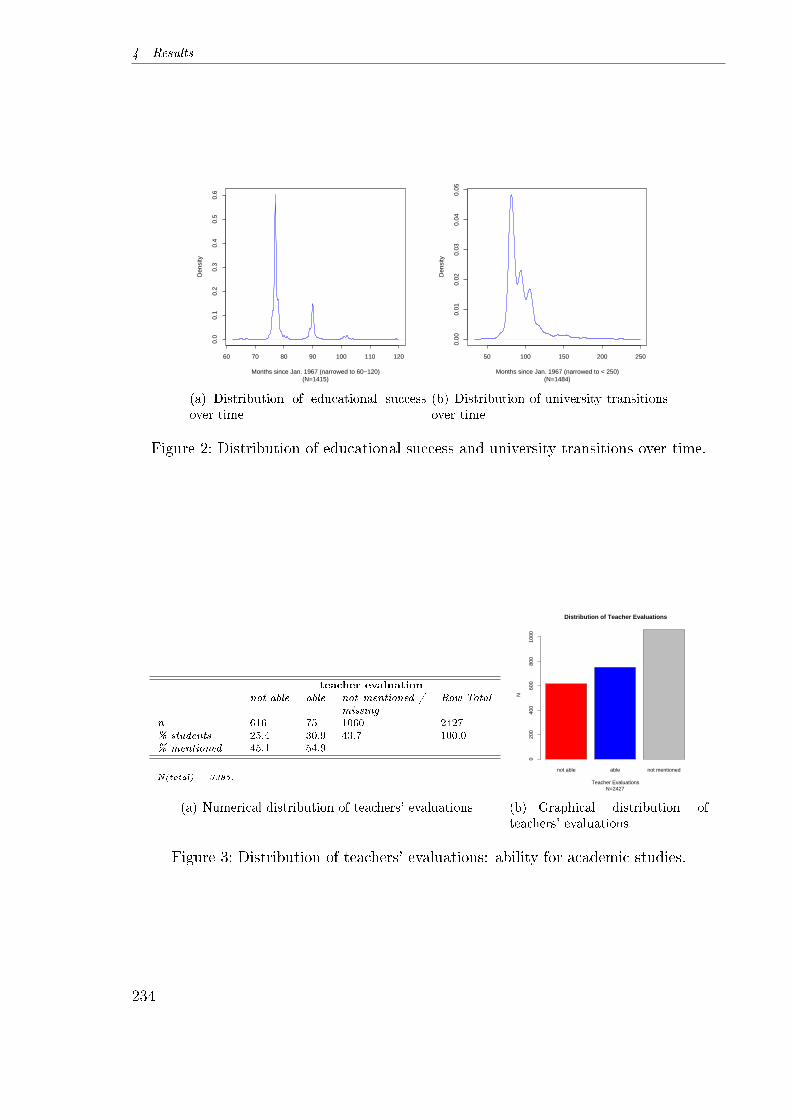
4 Results
60 70 80 90 100 110 120
0.0
0.1
0.2
0.3
0.4
0.5
0.6
(N=1415)Months since Jan. 1967 (narrowed to 60−120)
Den
sity
(a) Distribution of educational successover time
50 100 150 200 250
0.00
0.01
0.02
0.03
0.04
0.05
(N=1484)Months since Jan. 1967 (narrowed to < 250)
Den
sity
(b) Distribution of university transitionsover time
Figure 2: Distribution of educational success and university transitions over time.
teacher evaluation
not able able not mentioned /missing
Row Total
n 616 751 1060 2427% students 25.4 30.9 43.7 100.0% mentioned 45.1 54.9 - -
N(total) = 3385.
(a) Numerical distribution of teachers' evaluations
not able able not mentioned
Distribution of Teacher Evaluations
N=2427Teacher Evaluations
N
020
040
060
080
010
00
(b) Graphical distribution ofteachers' evaluations
Figure 3: Distribution of teachers' evaluations: ability for academic studies.
234

IV. The Impact of Teachers' Expectations on Students' Educational Opportunities in The Life Course
model (model 1), we can observe that both students' intelligence and their school gradessigni�cantly predict teachers' evaluations. The R2 of this model is remarkably high.However, except the measure of students' relative school performance, in the motivationmodel, the z-values are much lower (self-con�dence) or do not even reach statisticalsigni�cance (homework e�ort). This also results in an R2 not much more than half ashigh as for the performance model. Considering the predictors of both models together,in the full model, except students' relative school performance, only performance-modelindicators remain signi�cant � while the explained variance of the full model is onlyslightly higher than for the performance model. Thus, we can conclude that for theirteachers, students' performance is far more important than their motivation.
Table 1: Logistic regression of teachers' evaluations on students' performance andmotivation
Performance Model Motivation Model Full Model
eb∗sd/z -value eb∗sd/z -value eb∗sd/z -value
intelligence 1.76*** 1.79***(7.00) (6.90)
average grade 0.15*** 0.20***(-16.79) (-14.01)
homework e�ort 1.03 1.08(0.50) (0.88)
relative school performance 2.74*** 1.85***(11.11) (5.65)
self-con�dence 1.22* 1.10(2.46) (1.01)
Nagelkerke's R2 0.52 0.27 0.55N 1309 1294 1287
All coe�cients are standardized odds ratios. Z-values in parentheses. Signi�cance values:* (p < .05); ** (p < .01); *** (p < .001).
As mentioned, I now store the residuals in order to use them as indicators of a 'net'e�ect of self-ful�lling prophecies. Figure 4 displays the distribution of the residuals fromthe three di�erent logit models. Positive residuals indicate an overestimation relativeto the predictors of the logit models, negative residuals a relative underestimation. Inaccordance with the predictive power of the performance model, the residuals in �gure 4amainly follow a normal distribution: Most students obtain an evaluation that is roughlyon par with their intelligence and school grades � leading to a residuum of zero. Ifwe compare this distribution with the one of the residuals from the motivation model(�gure 4b), we can note that students' motivation hardly suits to solely predict teachers'evaluations: Two local maxima can be found at 0.5 and -0.5, respectively � indicatingthat based on these background variables, the prediction of teachers' evaluations does notbecome more precise than simply by guessing. Finally, when we look at the distributionof the full-model residuals (�gure 4c), we see that the curve gets slightly distorted, butis still very close to the normal distribution. As mentioned above, I dichotomized each
235
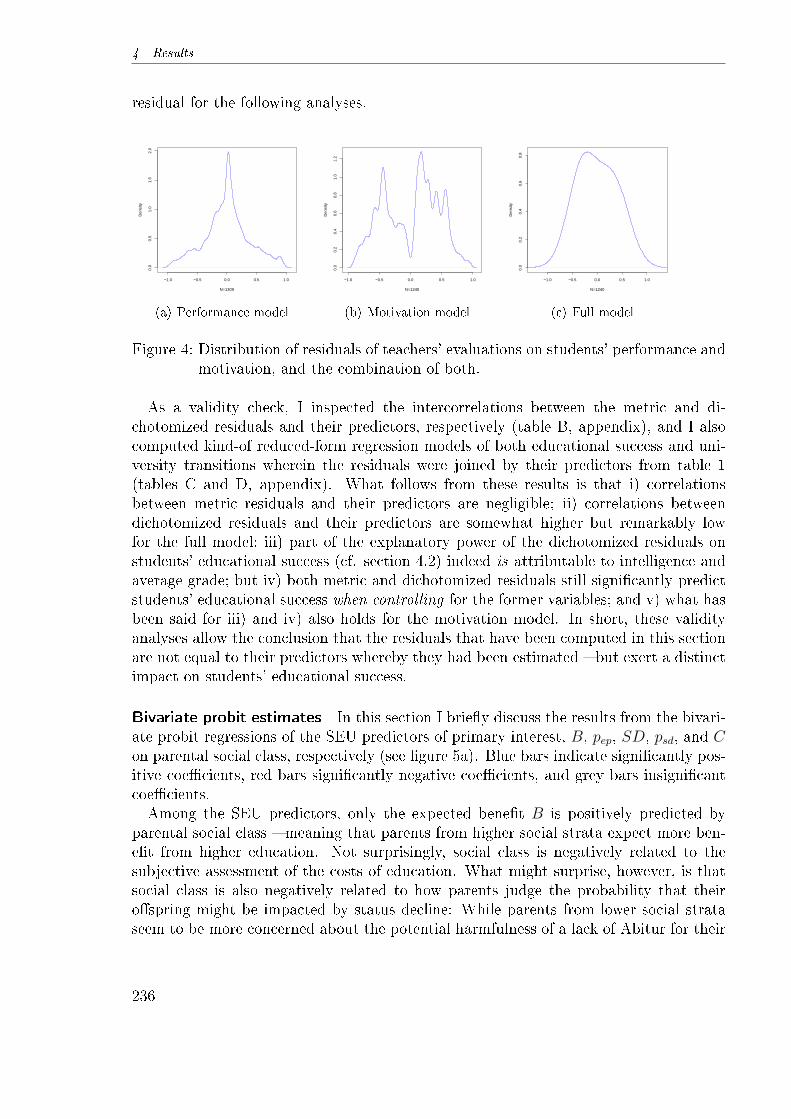
4 Results
residual for the following analyses.
−1.0 −0.5 0.0 0.5 1.0
0.0
0.5
1.0
1.5
2.0
N=1309
Den
sity
(a) Performance model
−1.0 −0.5 0.0 0.5 1.0
0.0
0.2
0.4
0.6
0.8
1.0
1.2
N=1245
Den
sity
(b) Motivation model
−1.0 −0.5 0.0 0.5 1.0
0.0
0.2
0.4
0.6
0.8
N=1240
Den
sity
(c) Full model
Figure 4: Distribution of residuals of teachers' evaluations on students' performance andmotivation, and the combination of both.
As a validity check, I inspected the intercorrelations between the metric and di-chotomized residuals and their predictors, respectively (table B, appendix), and I alsocomputed kind-of reduced-form regression models of both educational success and uni-versity transitions wherein the residuals were joined by their predictors from table 1(tables C and D, appendix). What follows from these results is that i) correlationsbetween metric residuals and their predictors are negligible; ii) correlations betweendichotomized residuals and their predictors are somewhat higher but remarkably lowfor the full model; iii) part of the explanatory power of the dichotomized residuals onstudents' educational success (cf. section 4.2) indeed is attributable to intelligence andaverage grade; but iv) both metric and dichotomized residuals still signi�cantly predictstudents' educational success when controlling for the former variables; and v) what hasbeen said for iii) and iv) also holds for the motivation model. In short, these validityanalyses allow the conclusion that the residuals that have been computed in this sectionare not equal to their predictors whereby they had been estimated � but exert a distinctimpact on students' educational success.
Bivariate probit estimates In this section I brie�y discuss the results from the bivari-ate probit regressions of the SEU predictors of primary interest, B, pep, SD, psd, and Con parental social class, respectively (see �gure 5a). Blue bars indicate signi�cantly pos-itive coe�cients, red bars signi�cantly negative coe�cients, and grey bars insigni�cantcoe�cients.Among the SEU predictors, only the expected bene�t B is positively predicted by
parental social class � meaning that parents from higher social strata expect more ben-e�t from higher education. Not surprisingly, social class is negatively related to thesubjective assessment of the costs of education. What might surprise, however, is thatsocial class is also negatively related to how parents judge the probability that theiro�spring might be impacted by status decline: While parents from lower social strataseem to be more concerned about the potential harmfulness of a lack of Abitur for their
236
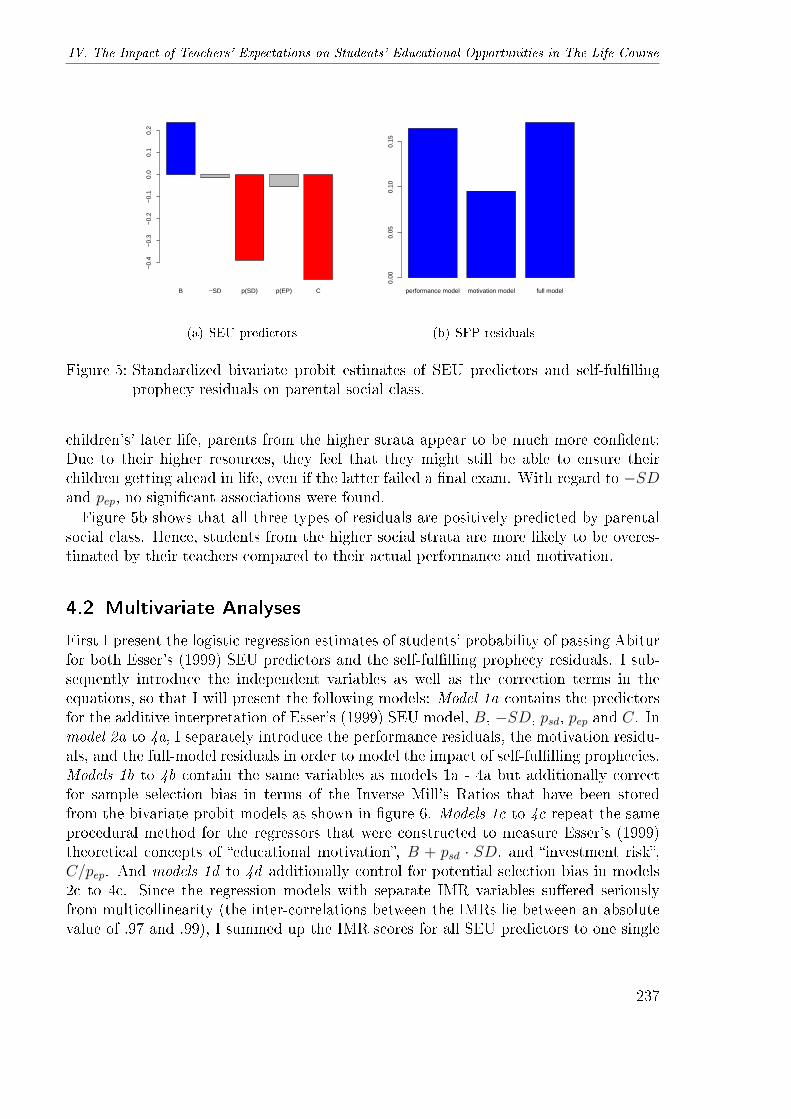
IV. The Impact of Teachers' Expectations on Students' Educational Opportunities in The Life Course
B −SD p(SD) p(EP) C
−0.
4−
0.3
−0.
2−
0.1
0.0
0.1
0.2
(a) SEU predictors
performance model motivation model full model
0.00
0.05
0.10
0.15
(b) SFP residuals
Figure 5: Standardized bivariate probit estimates of SEU predictors and self-ful�llingprophecy residuals on parental social class.
children's' later life, parents from the higher strata appear to be much more con�dent:Due to their higher resources, they feel that they might still be able to ensure theirchildren getting ahead in life, even if the latter failed a �nal exam. With regard to −SDand pep, no signi�cant associations were found.
Figure 5b shows that all three types of residuals are positively predicted by parentalsocial class. Hence, students from the higher social strata are more likely to be overes-timated by their teachers compared to their actual performance and motivation.
4.2 Multivariate Analyses
First I present the logistic regression estimates of students' probability of passing Abiturfor both Esser's (1999) SEU predictors and the self-ful�lling prophecy residuals. I sub-sequently introduce the independent variables as well as the correction terms in theequations, so that I will present the following models: Model 1a contains the predictorsfor the additive interpretation of Esser's (1999) SEU model, B, −SD, psd, pep and C. Inmodel 2a to 4a, I separately introduce the performance residuals, the motivation residu-als, and the full-model residuals in order to model the impact of self-ful�lling prophecies.Models 1b to 4b contain the same variables as models 1a - 4a but additionally correctfor sample selection bias in terms of the Inverse Mill's Ratios that have been storedfrom the bivariate probit models as shown in �gure 6. Models 1c to 4c repeat the sameprocedural method for the regressors that were constructed to measure Esser's (1999)theoretical concepts of �educational motivation�, B + psd · SD, and �investment risk�,C/pep. And models 1d to 4d additionally control for potential selection bias in models2c to 4c. Since the regression models with separate IMR variables su�ered seriouslyfrom multicollinearity (the inter-correlations between the IMRs lie between an absolutevalue of .97 and .99), I summed up the IMR scores for all SEU predictors to one single
237
4 Results
IMR score.26
Second, in models 5a to 8d I present the estimates of another series of logistic regres-sions of students' transitions to university. The setup of these models is the same asin models 1a to 4d, except that models 5b to 8b and 5d to 8d now include the InverseMill's Ratios for the estimates of a probit version of models 1b-4b and 1d-4d, respectively.Since the results for the self-ful�lling prophecy residual estimates do not substantivelydi�er when the SEU interaction terms instead of the additive model interpretation areintroduced in the model, the tables with the interaction terms are not discussed in depthhere but are reported in the appendix (tables E and F).
Passing Abitur As table 2 shows, in the baseline model lacking both the self-ful�llingprophecy indicators and controls for potential sample selection bias, all SEU parametersexcept the perceived costs of education C have a signi�cant impact on students' educa-tional success in terms of passing Abitur. It is possible that costs do not come into playin this model because of mechanisms in line with the life course or selection hypothesis(Blossfeld and Shavit, 1993; Mare, 1980, 1993; Müller and Karle, 1993) which postulatesthat the e�ects of social inequality decrease in the course of students' education. How-ever, students' chance of high school graduation still varies by the expected bene�t ofgraduation, the expected amount of status decline and its expected impact, and by thesubjective probability of educational success.Interestingly, when introducing the SFP residuals from the performance model (model
2a), the latter are highly signi�cant while the e�ects of B, −SD and psd are canceledout, and the signi�cance level of the estimate of pep drops down from the 99.9% levelto the 95% level.27 In the theoretical section I have argued that pep = f(SFP ) (8), andalthough, admittedly, I am not able to model this impact over time, the drop-down inboth e�ect size and signi�cance of pep may strengthen this proposition. Moreover, for thecase of the operationalization of self-ful�lling prophecies according to the performancemodel, we can conclude that they have a signi�cant impact on students' educationalsuccess in terms of passing Abitur: With regard to content, the probability to graduateimmediately on the �rst try and with no class repetition is almost 2.9 times as high forstudents who have been overestimated by their teachers with regard to their 10th classacademic performance compared to students who have been underestimated.In model 3a we can see that the residuals from the motivation model of table 1 also
signi�cantly predict students' educational success. However, and in line with the lowpredictive power of the motivation model, both e�ect size and t-value are lower compared
26The scale reliability of the IMR sum score is about Cronbach's α = .84. Because in all cases, theinter-correlations between the single IMR scores are near to one, the assumption of equal weights asit is always implied in simple sum scores is appropriate. For multicollinearity problems with lowerinter-correlations, a latent variable approach with free factor loadings for the IMR scores would bemore adequate (Cohen et al., 2003). However, in the present case, a con�rmatory factor analysiswith factor loadings around .99 (not shown; available upon request) also strengthens the assumptionof equal weights.
27A re-analysis of model 1a where observations with missing values on the self-ful�lling prophecy resid-uals are excluded shows that this drop-down in signi�cance cannot be attributed to the reducedsample size in models 2a � 4a (cf. appendix, table G).
238
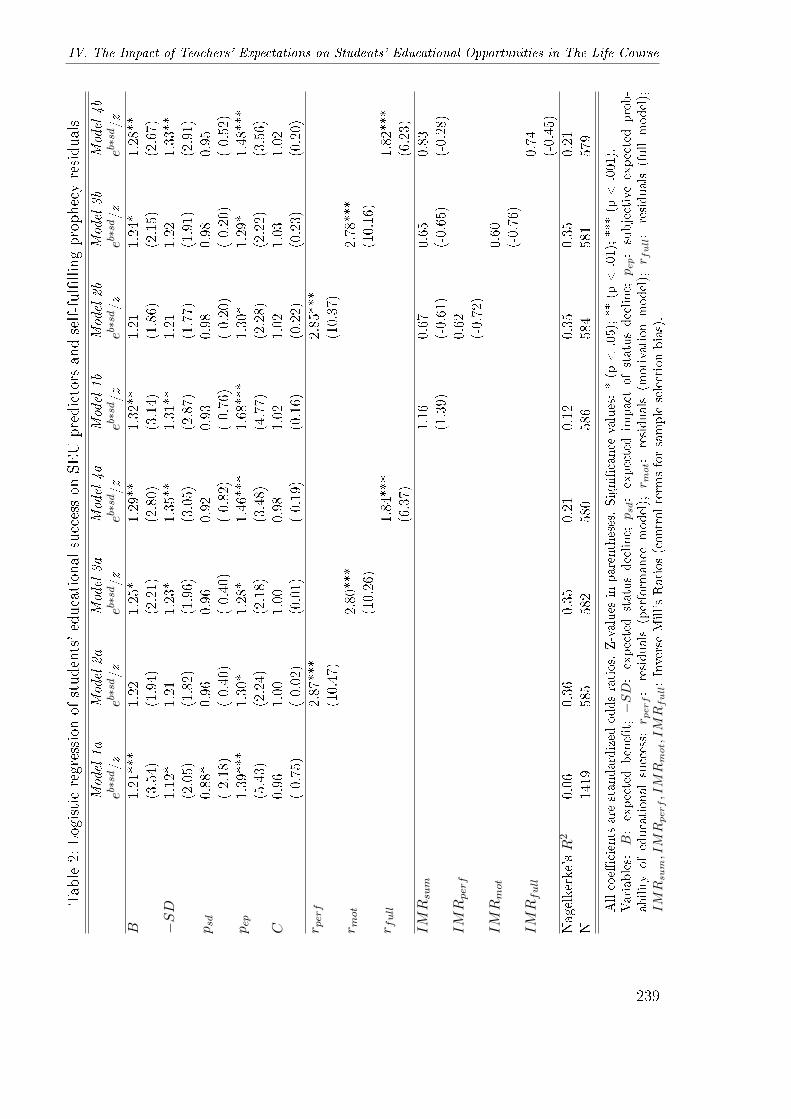
IV. The Impact of Teachers' Expectations on Students' Educational Opportunities in The Life Course
Table2:
Logisticregression
ofstudents'educational
successon
SEUpredictors
andself-ful�llingprophecyresiduals
Model
1a
Model
2a
Model
3a
Model
4a
Model
1b
Model
2b
Model
3b
Model
4b
eb∗sd/z
eb∗sd/z
eb∗sd/z
eb∗sd/z
eb∗sd/z
eb∗sd/z
eb∗sd/z
eb∗sd/z
B1.21***
1.22
1.25*
1.29**
1.32**
1.21
1.24*
1.28**
(3.54)
(1.94)
(2.21)
(2.80)
(3.14)
(1.86)
(2.15)
(2.67)
−SD
1.12*
1.21
1.23*
1.35**
1.31**
1.21
1.22
1.33**
(2.05)
(1.82)
(1.96)
(3.05)
(2.87)
(1.77)
(1.91)
(2.91)
psd
0.88*
0.96
0.96
0.92
0.93
0.98
0.98
0.95
(-2.18)
(-0.40)
(-0.40)
(-0.82)
(-0.76)
(-0.20)
(-0.20)
(-0.52)
pep
1.39***
1.30*
1.28*
1.46***
1.68***
1.30*
1.29*
1.48***
(5.43)
(2.24)
(2.18)
(3.48)
(4.77)
(2.28)
(2.22)
(3.56)
C0.96
1.00
1.00
0.98
1.02
1.02
1.03
1.02
(-0.75)
(-0.02)
(0.01)
(-0.19)
(0.16)
(0.22)
(0.23)
(0.20)
r perf
2.87***
2.85***
(10.47)
(10.37)
r mot
2.80***
2.78***
(10.26)
(10.16)
r full
1.84***
1.82***
(6.37)
(6.23)
IMRsum
1.16
0.67
0.65
0.83
(1.39)
(-0.61)
(-0.65)
(-0.28)
IMRperf
0.62
(-0.72)
IMRmot
0.60
(-0.76)
IMRfull
0.74
(-0.45)
Nagelkerke'sR
20.06
0.36
0.35
0.21
0.12
0.35
0.35
0.21
N1419
585
582
580
586
584
581
579
Allcoe�
cients
are
standardized
oddsratios.
Z-values
inparentheses.Signi�cance
values:*(p
<.05);**(p
<.01);***(p
<.001).
Variables:
B:expectedbene�t;−SD:expectedstatusdecline;psd:expectedim
pact
ofstatusdecline;pep:subjectiveexpectedprob-
abilityofeducationalsuccess;r p
erf:
residuals
(perform
ance
model);r m
ot:
residuals
(motivationmodel);r f
ull:
residuals
(fullmodel);
IMR
sum,IMR
perf,IMR
mot,IMR
full:Inverse
Mill'sRatios(controlterm
sforsampleselectionbias).
239
4 Results
to model 2a. Therefore, a teacher's evaluation nearly as a thing in itself, i.e. withno signi�cant reduction in variation caused by its predictors, also signi�cantly a�ectsstudents' educational success. Yet, this e�ect increases when controlling for substantialover- and underestimations. As opposed to model 2a, the subjective expected bene�tand the expected amount of status decline remain signi�cant in model 3a.
Model 4a shows that the residuals of the full model containing both performance andmotivation predictors not only have a lower estimate and t-value compared to models2a and 3a, but also lead to a decrease in model �t. Thus, if a teacher's evaluation iscontrolled for both students' performance and their motivation, over- and underestima-tions explain less of the variance of students' academic success. Moreover, if students'motivation is considered, di�erences in the SEU parameters in their additive empiricalform remain important.
When controls for sample selection are introduced inModels 1b-4d, the main di�erenceto the a-models is that in two models, pep loses its signi�cant impact on students'educational success. However, it is important to note that none of the self-ful�llingprophecy residuals are a�ected by sample selection correction. Since I indexed theInverse Mills Ratios for the SEU predictors, I assume that this particular robustnessis not an artifact of multicollinearity. Hence, while at least the distribution of successexpectations may be explained by issues of social selectivity, it appears that for the caseof educational success, the impact of over- and underestimations remains stable againstsocial selectivity.
Starting academic studies In table 3, the regression of students' transition propen-sities to university on both the SEU predictors and the self-ful�lling prophecy residualsis presented. Additionally to table 2, and according to the model by Becker (2003), theanalyses also control for parental social class and education.
In contrast to table 2, in model 5a, only the expected bene�t, B, and the subjectiveexpected probability of successfully completing the chosen school track, pep, have apositive impact on students' propensity to start academic studies. Both indicators forthe expected status decline as well as expected costs of education remain insigni�cant.
As in table 2, the e�ects for B are partialed out when self-ful�lling prophecies areintroduced in models 6a - 8a � while the coe�cient of pep remains stable. Again, theestimate for the performance-model residuals (model 6a) has the highest impact on thedependent variable, and the estimate for the full-model residuals the lowest (model 8a).However, compared to the estimates in models 1a-4a, the e�ect sizes diminish between11.5 (full model) and 13.8 (motivation model) percent, and also the R2 statistics arenotably lower now. Thus, the e�ects of self-ful�lling prophecies seem to decrease withinstudents' educational life course.28 Neither parental social class nor education exert asigni�cant e�ect, and the results do not di�er when either one were removed from the
28Lucas (2001) suggests to rely on predicted probabilities rather than on regression coe�cients whencomparing changes of social background e�ects in the educational life course. Table H (Appendix)indicates that the above trend also holds for the predicted probabilities of high school graduationsand university transitions, respectively (see corrected model).
240
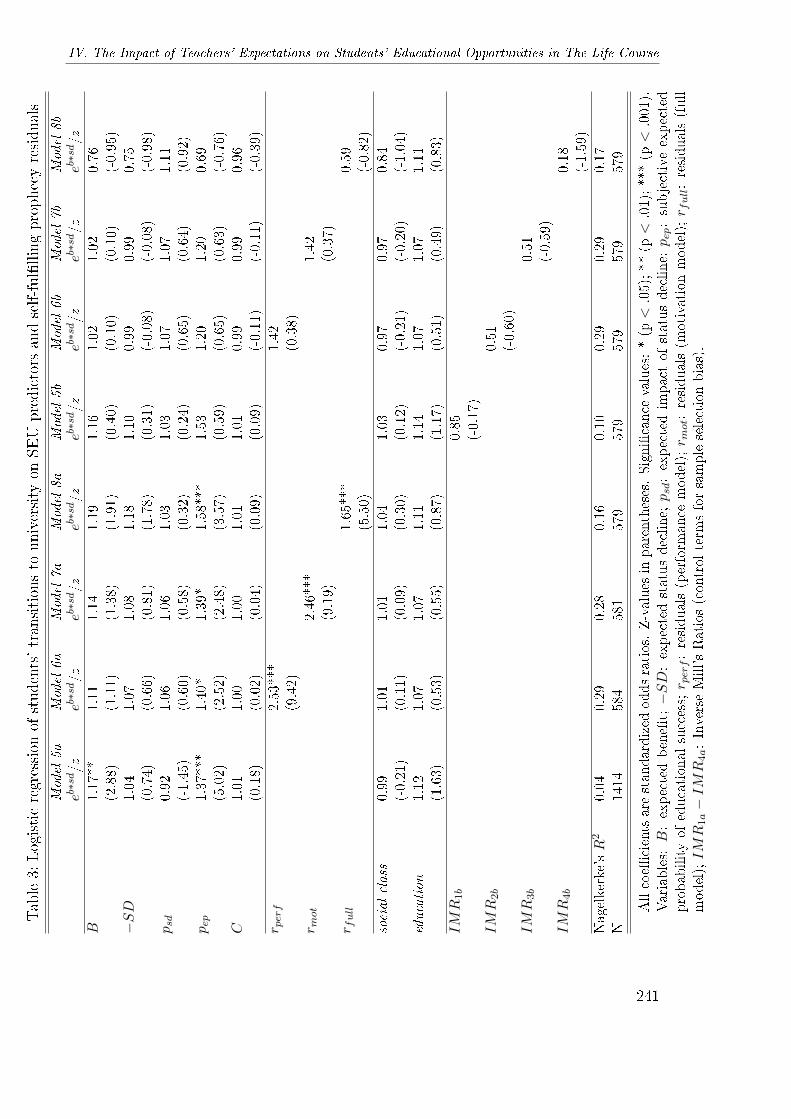
IV. The Impact of Teachers' Expectations on Students' Educational Opportunities in The Life Course
Table3:
Logisticregression
ofstudents'transitionsto
university
onSEUpredictors
andself-ful�llingprophecyresiduals
Model
5a
Model
6a
Model
7a
Model
8a
Model
5b
Model
6b
Model
7b
Model
8b
eb∗sd/z
eb∗sd/z
eb∗sd/z
eb∗sd/z
eb∗sd/z
eb∗sd/z
eb∗sd/z
eb∗sd/z
B1.17**
1.11
1.14
1.19
1.16
1.02
1.02
0.76
(2.88)
(1.11)
(1.38)
(1.91)
(0.40)
(0.10)
(0.10)
(-0.95)
−SD
1.04
1.07
1.08
1.18
1.10
0.99
0.99
0.75
(0.74)
(0.66)
(0.81)
(1.78)
(0.31)
(-0.08)
(-0.08)
(-0.98)
psd
0.92
1.06
1.06
1.03
1.03
1.07
1.07
1.11
(-1.45)
(0.60)
(0.58)
(0.32)
(0.24)
(0.65)
(0.64)
(0.92)
pep
1.37***
1.40*
1.39*
1.58***
1.53
1.20
1.20
0.69
(5.02)
(2.52)
(2.48)
(3.57)
(0.59)
(0.65)
(0.63)
(-0.76)
C1.01
1.00
1.00
1.01
1.01
0.99
0.99
0.96
(0.18)
(0.02)
(0.04)
(0.09)
(0.09)
(-0.11)
(-0.11)
(-0.39)
r perf
2.53***
1.42
(9.42)
(0.38)
r mot
2.46***
1.42
(9.19)
(0.37)
r full
1.65***
0.59
(5.50)
(-0.82)
socialclass
0.99
1.01
1.01
1.04
1.03
0.97
0.97
0.84
(-0.21)
(0.11)
(0.09)
(0.30)
(0.12)
(-0.21)
(-0.20)
(-1.04)
education
1.12
1.07
1.07
1.11
1.14
1.07
1.07
1.11
(1.63)
(0.53)
(0.55)
(0.87)
(1.17)
(0.51)
(0.49)
(0.83)
IMR
1b
0.85
(-0.17)
IMR
2b
0.51
(-0.60)
IMR
3b
0.51
(-0.59)
IMR
4b
0.18
(-1.59)
Nagelkerke'sR
20.04
0.29
0.28
0.16
0.10
0.29
0.29
0.17
N1414
584
581
579
579
579
579
579
Allcoe�
cients
arestandardized
oddsratios.Z-values
inparentheses.Signi�cance
values:*(p<
.05);**
(p<
.01);***(p<
.001).
Variables:B:expectedbene�t;−SD:expectedstatusdecline;psd:expectedim
pactof
statusdecline;pep:subjectiveexpected
probabilityof
educational
success;r perf:residuals(perform
ance
model);r m
ot:
residuals(m
otivationmodel);r full:residuals(full
model);IMR
1a−IMR
4a:InverseMill'sRatios(control
term
sforsampleselectionbias).
241
4 Results
models (not shown, available upon request).Finally, in models 5b - 8b, I replicated models 5a to 8a with controls for sample
selection. Therefore, I re-estimated the models from tables 2 in a probit equation (notshown, available upon request), stored the estimates as Inverse Mill's Ratios and includedthem in the models from tables 5. Although none of the Inverse Mill's Ratio coe�cientsin table 2 was signi�cant, controlling for them a�ected the z-statistics of pep. Thus,to achieve more conservative estimates in the second-stage selection equation, I alsocontrolled for the Inverse Mill's ratios from the �rst-stage selection equation.
Note that in table 3, each model 5b-8b is associated its own IMR1a - IMR4a. Theresults show that although the IMR scores themselves are not signi�cant, they do cancelout the signi�cant e�ects of both B and psd as well as those of the three residuals frommodels 5a � 8a. Hence, while in the case of the prediction of students' probability ofeducational success only one of the 'conventional' SEU predictors su�ered from sampleselection bias, if students' propensity of university transitions is controlled for the selec-tivity of the sub-sample, also the estimates of teachers' over- and underestimations lackstatistical signi�cance.29
4.3 Sensitivity Analyses
One justi�able objection against the antecedent Heckit models (and, likewise, alsoagainst the models of Becker, 2003) addresses the predictors in the selection equations.In particular in the second-step selection equation (passing Abitur), the Inverse Mill'sRatios that had been stored from the �rst step might not perfectly su�ce the exclusionrestriction (for a similar line of arguing cf. Jürges and Schneider, 2006) for the third-stepequation of interest (transition to university): Recall that in the third step, parental so-cial class is again introduced as a covariate in the logit equation - while it had alreadybeen used as an instrument to identify the �rst-stage selection equation in the �rst step.Hence, the problem could arise that the third-step equation of interest might su�er froman identi�cation problem because it includes a variable that also a�ects the instrument,i.e. the IMR control terms in the second-step selection equation.To be precise, if exactly the same set of predictors is used in the selection equation as it
is in the equation of primary interest, the model is still identi�ed but only by functionalform assumptions regarding the Inverse Mill's Ratios (Briggs, 2004). More concretely,
29Since the number of observations for the two model sets with and without sample selection equationare not equal, I repeated the analyses for models 5a-8a without the observations that did not havea valid value for the Inverse Mill's Ratios. The results of the self-ful�lling prophecy residuals arerobust against these modi�cations (appendix, table I). Furthermore, the validity analysis for theresiduals indicated that the results might be sensitive against using metric residuals rather thantheir dichotomized counterparts. When I re-estimated all (uncorrected) models by using metricresiduals, both the regression coe�cients and z-values tended to be a bit lower than in case ofusing dichotomized residuals, but without losing signi�cance (not shown, available upon request). Asimilar story holds when instead of the logit residuals, the generalized probit residuals (Gourierouxet al., 1987) are used � which are by construction uncorrelated with the predictor variables (Vella,1998, p. 136) �; and even when the latter residuals are used to estimate a bivariate probit model(Holm and Jæ ger, 2011) rather than a 'manual' Heckit (not shown; available upon request).
242
IV. The Impact of Teachers' Expectations on Students' Educational Opportunities in The Life Course
the error term of the selection equation has to be normally distributed in order to ensurethat the second equation is identi�ed via the non-linearity of the Inverse Mill's Ratiosobtained from the �rst-stage probit equation (Olsen, 1980; Duncan and Leigh, 1985).This kind of identi�cation is sometimes referred to as weak identi�cation (Vella, 1998,p. 135), because the linearity assumption could be violated (Winship and Mare, 1992,p. 341f.). For instance, Gronau (1974) observed that sample selection correction via theinclusion of Inverse Mill's Ratios does not work if a mutually exclusive and exhaustiveset of dummy variables is included in both the selection equation and the equation ofprimary interest.
Therefore, it is recommended to over identify the model by including at least one ad-ditional regressor in the selection equation that is not part of the equation of primaryinterest (the exclusion restriction; also see Breen, 1996, p. 43f.). Ideally, the exclusionrestriction should also be ensured to be uncorrelated with the outcome in the equationof primary interest in theoretical terms. Thus, even in the case of students' proba-bility to pass Abitur as the equation of primary interest, parental social class as theselection-equation exclusion restriction might not perfectly ful�ll a strong identi�cationassumption.30
A strategy for situations wherein issues such as selection and unobserved heterogeneitymight arise but good instruments that are not correlated with the outcome are not avail-able31 has been proposed by Buis (2010, 2011). The basic idea behind his suggestion isthat unobserved variables u, which might a�ect both the main independent variable andthe dependent variable over several transition points k, are captured by a weighted sumof random variables νk = βuku that in turn is approximated by a normal distribution.32
To re�ect a variety of scenarios regarding the distribution of this random variable, dif-ferent values for the standard deviation of ν are assumed. If sd(ν) = 0, the assumptionof unobserved heterogeneity is completely discarded � which is the standard case inconventional OLS (or logit/probit) regressions. The higher the standard deviation of ν,the stronger the e�ect that is allowed for unobserved heterogeneity. In the present case,I will examine how the e�ects of all self-ful�lling prophecy residuals obtained beforechange with sd(ν) = 0, sd(ν) = 0.5, sd(ν) = 1, and sd(ν) = 2, respectively.
In more formal terms, the two-step Heckit estimates of section 4.2 are supplementedby a sequential logit model wherein the probability of university transitions is conditional
30Sartori (2003) proposes a bivariate probit estimator identifying a model that uses the same predictorsfor both the selection equation and the equation of primary interest by imposing the restriction thatthe error terms for both equations are equal. However, since we have in total six di�erent selectionequations to estimate, we would need a multivariate probit estimator with an equal error constraintfor all six equations � which would involve extremely complex estimation procedures.
31While educational economists have proposed instruments such as students' birth quarter (Angrist andKrueger, 1991) or the distance to university (Card, 2001) to control for unobserved heterogeneitywhen measuring the returns of education, I believe that for the hypothesized e�ect of teachers'expectations on students' educational opportunities, it is considerably more challenging to �nd agood instrument that does a�ect the former but not the latter due to the e�cacy of the self-ful�llingprophecy.
32Note that the notations in Buis (2010) and Buis (2011) di�er. I here rely on the notation in Buis(2011).
243
4 Results
on the sub-sample of those who have passed Abitur (Buis, 2010, 2011):
p1 =exp(β01 + β11SEU + β21SFP )
1 + exp(β01 + β11SEU + β21SFP )(15)
and
p2 =exp(β02 + β12SEU + β22SFP )
1 + exp(β02 + β12SEU + β22SFP )if pass1 = 1. (16)
Here β0k is the intercept, β1k is the regression coe�cient for the vector of SEU predictors,and β2k is the regression coe�cient for the vector of self-ful�lling prophecy residuals foreach transition equation. Note that equation (16) is only estimated for those 'at risk',i.e. for students having passed the �rst transition and successfully graduated from highschool by obtaining the degree of Abitur, which is captured by the term pass1 = 1.Let Λ(·) = exp(·)
1+exp(·) denote the general functional form of the sequential logit model.Let further A,B,C refer to the three possible educational outcomes in the data at hand:leaving after high school without Abitur (A), passing Abitur but dropping out of theeducational system (B), and passing Abitur and making the transition to university asde�ned above (C). If now the weighted sum of unobserved covariates at each transition,νk, is introduced, the expected probabilities of passing the two transitions averaged overνk read:
Eν1(Pr[y ∈ {B,C}|SEU, SFP, ν1]) = Eε(Λ(β01 + β11 + β21 + βu1u︸︷︷︸ν1
)) (17)
Eν2(Pr[y ∈ {C}|SEU, SFP, ν2, y ∈ {B,C}]) = Eε(Λ(β02 + β12 + β22 + βu2u︸︷︷︸ν2
)) (18)
The left-hand side of both equations can be understood as follows: In (17), the prob-ability of passing Abitur without any statement about whether or not to leave furthereducation thereafter is modeled for both SEU indicators and the SFP residuals. In(18), the probability of making the transition to university conditional on having passedAbitur is modeled for the same predictors as in (17).In a second step, we can also relax the restriction that this unobserved covariate is
not a confounding variable � meaning that it is not correlated with the main predictorof interest, i.e. the self-ful�lling prophecy residuals. Just as we can approximate thepotential impact of the unobserved covariate on the outcome by simulating di�erentvalues for the standard deviation of the random variable, we can also approximate thepotential impact of the unobserved covariate on the self-ful�lling prophecy residuals byassuming di�erent values for the correlation ρ between the two variables.I assume that by this technique I not only control for selectivity issues that may
arise in a sequence of educational transitions, but I also tackle the objection of 'privateinformation' that may be part of the teachers' evaluation heuristic without being re-�ected in the estimated self-ful�lling prophecy residuals. Because the scenarios, whichare simulated for the weighted sum of unobserved covariates, also 'control' for a possible
244

IV. The Impact of Teachers' Expectations on Students' Educational Opportunities in The Life Course
correlation with a speci�ed independent variable, this may lead us to arrive at a betterunderstanding about the direction that this private information may take.
Equations (17) and (18) have to be solved by means of numerical integration usingmaximum simulated likelihood (Train, 2003) which has already been implemented in theseqlogit package (Buis, 2007) in Stata (StataCorp, 2009). Figure 7 presents the sen-sitivity analyses for all three self-ful�lling prophecy residuals at both transition points.Each point on each single line represents a separate equation. For instance, the verticalaxis of the line plot on the upper left shows the parameter estimates and their 95%con�dence intervals of the three residuals for students' probability of passing Abitur forthe scenario that the correlation between the unobserved covariate and each residualwould be zero. On the horizontal axis, however, these estimates are plotted against dif-ferent hypothesized values for the standard deviation of the random variable that shouldapproximate the unobservables, namely sd = 0 (the case of no unobserved covariate),sd = 0.5, sd = 1, and sd = 2. In the other three plots in the �rst line of the graph, therestriction of no correlation between the unobservable and the residuals is subsequentlyrelaxed unto a correlation of ρ = 0.5. In the plots in the second line of the graph, thisprocedure is repeated for the estimates (and their 95% con�dence intervals) of students'propensity of university transitions � conditional on previously having passed Abitur.Hence, the plots in �gure 7 are based on 3 * 4 * 4 * 2 = 96 equations in total: three foreach residual, four for each standard deviation, four for each value of ρ, and two for eachtransition point.33 Starting with the �rst set of equations predicting students' probabil-ity of passing Abitur, we see that in case of a zero or low (0.1) correlation between theunobservables and the residuals, an unobservable that a�ects the outcome might leadto an increase in the coe�cients of the self-ful�lling prophecy residuals. Only if boththe impact of the unobservable on the outcome and its correlation with the residualsare relatively strong, it might de�ate the latter's estimates and likewise decrease theirsigni�cance.
The same tendency holds for the parameter estimates of students' propensity of uni-versity transitions. Just like in the selection model of table 3, the results lack statisticalsigni�cance for the case of ρ = 0 and sd = 0. If the correlation between ν and theresiduals is not too large, an increase in its standard deviation could be associated withan increase in the parameter estimates which may shift their con�dence intervals aboveor next to the 95% signi�cance level. However, if both the impact of the unobservable onthe outcome and its correlation with the residuals are relatively strong again, it mightlead to a decrease in both the estimates and their signi�cance levels again. Yet, in thatcase the model would surely be impaired by multicollinearity, which would forestall anunambiguous interpretation (Farrar and Glauber, 1967).
In sum, we can conclude that in order to weaken the estimates and/or signi�cancelevels of the self-ful�lling prophecy residuals, the prerequisites for an unobserved variablehave to be relatively strong. Neither the strength of its impact on the outcome, norits correlation with the variables of interest is a su�cient condition for de�ating its
33The coe�cients and z-statistics of the variables of interest for these equations are listed in tables J(passing Abitur) and K (university transitions) in the appendix.
245
5 Conclusion
predictive power. Only if both conditions held up to a relatively large extent, the resultswould not be robust. Since I would expect this to be an issue of multicollinearity, I donot expect the latter phenomenon to thwart my main �ndings.
5 Conclusion
The objective of this paper was to provide both theoretical and empirical evidence for thedistinct e�ect of self-ful�lling prophecies, which goes beyond the conventional subjective-expected-utility (SEU) model of inequality in educational opportunities (IEO). My aimwas �rst to develop a formal model, and second to test this model in order to predictstudents' probability to graduate from high school (Abitur) as well as their subsequentuniversity transitions.In the theoretical section, I started with summarizing the basic assumptions of the
SEU-IEO model by Esser (1999, pp. 265-275). After a literature review of Pygmalionand self-ful�lling prophecy research (Rosenthal and Jacobson, 1968; Madon et al., 1997;Jussim and Harber, 2005), I brought in the argument that its main �nding, i.e. thatteachers' expectations may in�uence students' academic performance, requires an ex-tension of the present SEU-IEO model. I thus proposed an integration of self-ful�llingprophecies in the formal SEU-IEO model by Esser (1999) in terms of a teacher treatmente�ect on students' subjective expected probability of educational success.Methodologically, self-ful�lling prophecies were operationalized as the residuals of a
regression of a speci�c form of teachers' evaluations on a performative and a motivationalset of variables (also see Madon et al., 1997). However, in the empirical section itturned out that the performance model was able to predict teachers' evaluations moresatisfactory than the motivation model.In my multivariate analyses that were based on the Cologne High School Panel
(CHiSP), I found that the predictive power of the conventional SEU-IEO model is byaverage weaker than in previous studies (e.g. Becker, 2003; Becker and Hecken, 2009a,b).This could be a corroboration of the life-course hypothesis (Mare, 1980, 1993; Müllerand Karle, 1993) which indicates that the e�ects of social inequality decrease duringstudents' educational career.In contrast, at least in the baseline model, the self-ful�lling prophecy residuals were
able to signi�cantly predict both students' educational success in terms of passing Abiturand their university transition propensities. Thus, the tentative conclusion from thesemodels would be that self-ful�lling prophecies have indeed distinct e�ects apart fromthe conventional SEU predictors. Moreover, since the e�ect sizes of the residuals arelower for students' university transitions than for their educational success, this couldbe another demonstration of life course e�ects.As the variance of students' resources and preferences by social class, and the condi-
tionality of their transition decisions brought up a selectivity problem, I replicated allmodels with corrections for sample selection bias (Heckman, 1979). It turned out thatin case of the prediction of students' educational success the results remain stable, whilewith respect to the prediction of their university transitions all self-ful�lling prophecy
246
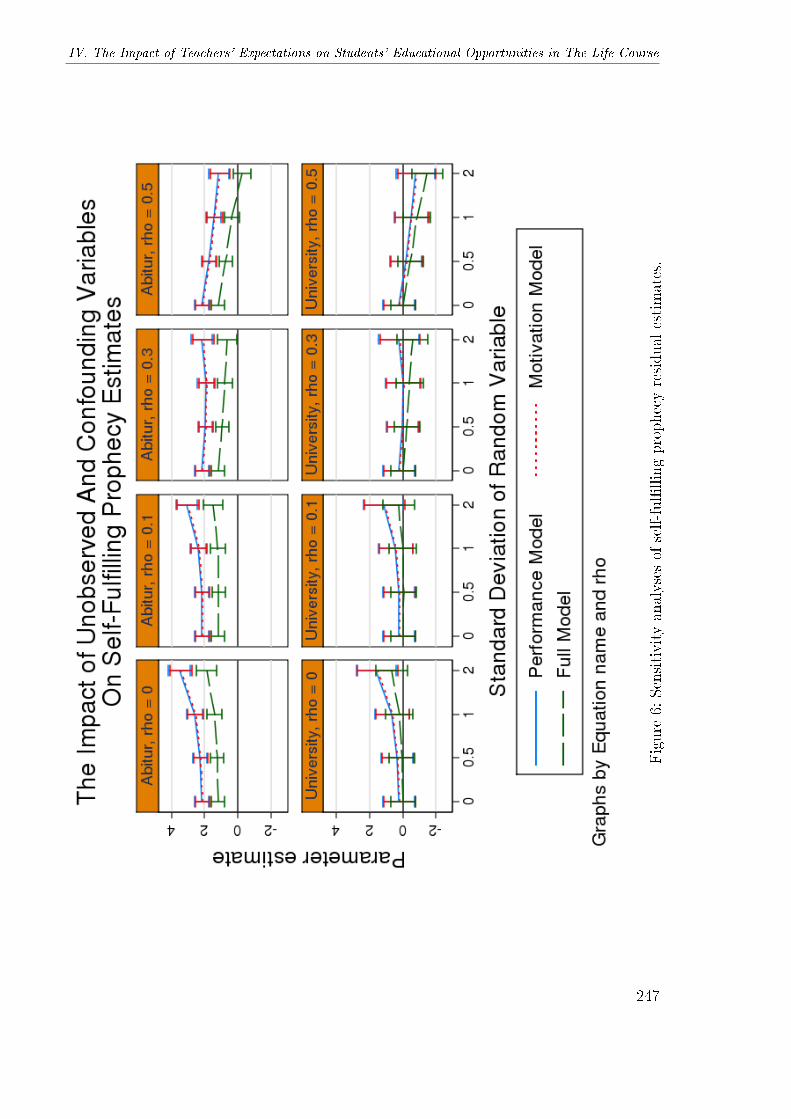
IV. The Impact of Teachers' Expectations on Students' Educational Opportunities in The Life Course
Figure
6:Sensitivityanalysesof
self-ful�llingprophecyresidual
estimates.
247

References
residuals lost their signi�cance. This indicates that there is little evidence that the ef-�cacy of self-ful�lling prophecies could mainly be explained by students' social class.Notwithstanding this particular stability, there is no reason to assume that self-ful�llingprophecies might a�ect students' propensity of university transitions conditional on hav-ing passed Abitur. This suggests that the e�ect of teachers' expectations is limited onstudents' success in school, and that it does not in�uence their decision for or againststarting academic studies.
Because of several methodological objections that could be raised against the qualityof the instruments in the selection models, and in order to tackle the argument thatteachers might have private information at their disposal which is not captured by thevariables in the three residual models, a sensitivity analysis was performed. In partic-ular, I additionally allowed for unobserved heterogeneity which was approximated by arandom variable that could take di�erent values on both its standard deviations and itscorrelation with the self-ful�lling prophecy residuals. It became apparent that only ifrelatively high values on both parameters are allowed for simultaneously, the residualestimates might not be robust. However, since this would go in line with the problemof multicollinearity, I do not expect my main �ndings to be challenged by this issue.
Nonetheless, further analyses should consider additional variables. Remember thatone major theoretical shortcoming of Pygmalion concerns an insu�cient considerationof moderators such as students' grade level or teachers' duration of teaching in a par-ticular class. Thus, future studies should also include potential covariates apart fromthe standard SEU predictors to ensure a better understanding of the social mechanismsbehind the e�cacy of self-ful�lling prophecies. This holds in particular if the empiricalmodel per se is, as in the case of my data at hand, only an approximation of the theoret-ical or substantive model. Considering both teacher- and student-level variables wouldrequire to estimate a cross-classi�ed hierarchical model (Snijders and Bosker, 1999; Hox,2002) wherein teachers' evaluations as the lowest unit are nested in both teacher andstudent contexts. To be sure, this might also necessitate a re�ned operationalization ofself-ful�lling prophecies.
References
Amthauer R (1957) Intelligenz-Struktur-Test. Göttingen: Hogrefe.
Angrist JD and Krueger AB (1991) Does compulsory school attendance a�ect schoolingand earnings? The Quarterly Journal of Economics 106(4): 979�1014.
Ashenfelter O; Harmon C and Oosterbeek H (1999) A review of estimates of the school-ing/earnings relationship, with tests for publication bias. Labour Economics 6(4):453�470.
Becker R (2000) Klassenlage und Bildungsentscheidungen - Eine empirische Anwendungder Wert-Erwartungstheorie. Zeitschrift für Soziologie 52(3): 450�474.
248
IV. The Impact of Teachers' Expectations on Students' Educational Opportunities in The Life Course
Becker R (2003) Educational expansion and persistent inequalities of education. Euro-pean Sociological Review 19(1): 1�24.
Becker R and Hecken AE (2009a) Higher education or vocational training? An empir-ical test of the rational action model of educational choices suggested by Breen andGoldthorpe and Esser. Acta Sociologica 52(1): 25�45.
Becker R and Hecken AE (2009b) Why are working-class children diverted from univer-sities? An empirical assessment of the diversion thesis. European Sociological Review25(2): 233�250.
Bishop JH (1989) Is the test score decline responsible for the productivity growth decline?The American Economic Review 79(1): 178�197.
Blossfeld HP and Shavit Y (1993) Persisting barriers. In: Blossfeld HP and Shavit Y(eds.) Persistent Inequality - Changing Educational Attainment in Thirteen Countries,1�23. Boulder, CO: Westview Press.
Boissiere M; Knight JB and Sabot RH (1985) Earnings, schooling, ability, and cognitiveskills. The American Economic Review 75(5): 1016�1030.
Boudon R (1974) Education, Opportunity and Social Inequality: Changing Prospects inWestern Society. New York: John Wiley & Sons.
Brattesani KA; Weinstein RS and Marshall HH (1984) Student perceptions of di�erentialteacher treatment as moderators of teacher expectation e�ects. Journal of EducationalPsychology 76(2): 236�247.
Breen R (1996) Regression Models: Censored, Sample Selected or Truncated Data. Thou-sand Oaks, CA: Sage Publications.
Breen R and Goldthorpe JH (1997) Explaining educational di�erentials: towards a for-mal rational action theory. Rationality and Society 9(3): 275�305.
Breen R and Jonsson JO (2000) Analyzing educational careers: a multinomial transitionmodel. American Sociological Review 65(5): 754�772.
Briggs DC (2004) Causal inference and the Heckman model. Journal of Educational andBehavioral Statistics 29(4): 397�420.
Buis ML (2007) SEQLOGIT: Stata module to �t a sequential logit model.URL: http://ideas.repec.org/c/boc/bocode/s456843.html
Buis ML (2010) Inequality of Educational Outcome and Inequality of Educational Op-portunity in the Netherlands during the 20th Century. Disseration thesis, Vrije Uni-versiteit Amsterdam.
Buis ML (2011) The consequences of unobserved heterogeneity in a sequential logitmodel. Research in Social Strati�cation and Mobility 29(3): 247�262.
249
References
Card D (2001) Estimating the return to schooling: progress on some persistent economet-ric problems. Econometrica: Journal of the Econometric Society 69(5): 1127�1160.
Cohen J; Cohen P; West SG et al. (2003) Applied Multiple Regression / CorrelationAnalysis for the Behavioral Sciences. Mahwah, NJ: Lawrence Erlbaum.
Cox DR (1990) Role of models in statistical analysis. Statistical Science 5(3): 169�174.
Cunha F and Heckman JJ (2007) Identifying and estimating the distributions of ex postand ex ante returns to schooling. Labour Economics 14(6): 870�893.
Cunha F; Heckman JJ and Navarro S (2005) Separating uncertainty from heterogeneityin life cycle earnings. Oxford Economic Papers 57(2): 191�261.
Davis K and Moore WE (1945) Some principles of strati�cation. American SociologicalReview 10(2): 242�249.
Duncan GM and Leigh DE (1985) The endogeneity of union status: an empirical test.Journal of Labor Economics 3(3): 385�402.
Elasho� JD and Snow RE (1971) Pygmalion Reconsidered: A Case Study in StatisticalInference: Reconsideration of the Rosenthal-Jacobson Data on Teacher Expectancy.Worthington, Ohio: CA Jones Pub. Co.
Enders CK (2010) Applied Missing Data Analysis. New York: The Guilford Press.
Erikson RS and Jonsson JO (1996) Introduction: explaining class inequality in educa-tion: the Swedish test case. In: Erikson RS and Jonsson JO (eds.) Can EducationBe Equalized? The Swedish Case in Comparative Perspective, 1�63. Boulder, CO:Westview Press.
Esser H (1999) Soziologie. Spezielle Grundlagen. Bd. 1: Situationslogik und Handeln.Frankfurt / New York: Campus Verlag.
Farrar DE and Glauber RR (1967) Multicollinearity in regression analysis: the problemrevisited. The Review of Economic and Statistics 49(1): 92�107.
Gelman A and Hill J (2007) Data Analysis Using Regression and Multilevel/HierarchicalModels. Cambridge: Cambridge University Press.
Gill S and Reynolds AJ (1999) Educational expectations and school achievement ofurban African American children. Journal of School Psychology 37(4): 403�424.
Goldthorpe JH (1996) Class analysis and the reorientation of class theory: the case ofpersisting di�erentials in educational attainment. British Journal of Sociology 47(3):481�505.
Goldthorpe JH (2001) Causation, statistics, and sociology. European Sociological Review17(1): 1�20.
250
IV. The Impact of Teachers' Expectations on Students' Educational Opportunities in The Life Course
Gourieroux C; Monfort A; Renault E et al. (1987) Generalised residuals. Journal ofEconometrics 34(1-2): 5�32.
Greene WH (2003) Econometric Analysis. Upper Saddle River, NJ: Prentice Hall.
Gronau R (1974) Wage comparisons - a selectivity bias. Journal of Political Economy82(6): 1119�1143.
Hanushek EA and Kimko DD (2000) Schooling, labor-force quality, and the growth ofnations. The American Economic Review 90(5): 1184�1208.
Heckman JJ (1979) Sample selection bias as a speci�cation error. Econometrica: Journalof the Econometric Society 47(1): 153�161.
Hillmert S and Jacob M (2010) Selections and social selectivity on the academic track:a life-course analysis of educational attainment in Germany. Research in Social Strat-i�cation and Mobility 28(1): 59�76.
Holm A and Jæ ger MM (2011) Dealing with selection bias in educational transitionmodels: The bivariate probit selection model. Research in Social Strati�cation andMobility 29(3): 311�322.
Hox JJ (2002) Multilevel analysis: Techniques and applications. Mahwah, NJ: LawrenceErlbaum.
Jackson M; Erikson RS; Goldthorpe JH et al. (2007) Primary and secondary e�ects inclass di�erentials in educational attainment. Acta Sociologica 50(3): 211�229.
Jaeger MM and Holm A (2011) Relative Risk Aversion and Educational DecisionMaking: A Dynamic Model with Ability Updating and Heterogeneous RRA behavior.Paper presented at the 2011 Spring Meeting of the ISA RC28, 13th-16th April 2011,University of Essex, UK .URL: http://www.iser.essex.ac.uk/uploads/paper/document/38/rc28_jaeger_holm.pdf
Jensen AR (1969) How much can we boost IQ and scholastic achievement. HarvardEducational Review 39(1): 1�123.
Jonsson JO (1999) Explaining sex di�erences in educational choice: an empirical assess-ment of a rational choice model. European Sociological Review 15(4): 391�404.
Jürges H and Schneider K (2006) Age at school entry and teachers' recommendations forsecondary school track choice in Germany. Paper presented at the 20th annual ESPEconference, 22 - 24 June, 2006, Verona .
Jussim L (1986) Self-ful�lling prophecies: a theoretical and integrative review. Psycho-logical Review 93(4): 429�445.
Jussim L (1989) Teacher expectations: self-ful�lling prophecies, perceptual biases, andaccuracy. Journal of Personality and Social Psychology 57(3): 469�480.
251
References
Jussim L; Eccles J and Madon S (1996) Social perception, social stereotypes, and teacherexpectations: accuracy and the quest for the powerful self-ful�lling prophecy. In:Zanna MP (ed.) Advances in Experimental Social Psychology, vol. 28, 281�388. SanDiego: Academic Press.
Jussim L and Harber KD (2005) Teacher expectations and self-ful�lling prophecies:knowns and unknowns, resolved and unresolved controversies. Personality and SocialPsychology Review 9(2): 131�155.
Ladd HF and Walsh RP (2002) Implementing value-added measures of school e�ective-ness: getting the incentives right. Economics of Education review 21(1): 1�17.
Lauen DL (2007) Contextual explanations of school choice. Sociology of Education 80(3):179�209.
Lucas SR (2001) E�ectively maintained Iinequality: education transitions, track mobil-ity, and social background e�ects. American Journal of Sociology 106(6): 1642�1690.
Madon S; Jussim L and Eccles J (1997) In search of the powerful self-ful�lling prophecy.Journal of Personality and Social Psychology 72(4): 791�809.
Madon S; Jussim L; Keiper S et al. (1998) The accuracy and power of sex, social class,and ethnic stereotypes: a naturalistic study in person perception. Personality andSocial Psychology Bulletin 24(12): 1304�1318.
Madon S; Willard J; Guyll M et al. (2006) Self-ful�lling prophecy e�ects of mothers'beliefs on children's alcohol use: accumulation, dissipation, and stability over time.Journal of personality and social psychology 90(6): 911�926.
Mare RD (1980) Social background and school continuation decisions. Journal of theAmerican Statistical Association 75(370): 295� 305.
Mare RD (1993) Educational strati�cation on observed and unobserved componentsof family background. In: Blossfeld HP and Shavit Y (eds.) Persistent Inequality- Changing Educational Attainment in Thirteen Countries, 351�376. Boulder, CO:Westview Press.
Mechtenberg L (2009) Cheap talk in the classroom: How biased grading at school ex-plains gender di�erences in achievements, career choices and wages. Review of Eco-nomic Studies 76(4): 1431�1459.
Merton RK (1948) The self-ful�lling prophecy. Antioch Review 8(2): 193�210.
Meulemann H (1979) Klassenlage, Entscheidungsfeld und Bildungsaspirationen - EinVersuch zur theoretischen Präzisierung und kausalen Erklärung von Zusammenhängenzwischen sozialer Struktur und individueller Lebensplanung. Zeitschrift für Soziologie8(4): 391�414.
252
IV. The Impact of Teachers' Expectations on Students' Educational Opportunities in The Life Course
Mistry RS; White ES; Benner AD et al. (2009) A longitudinal study of the simultaneousin�uence of mothers' and teachers' educational expectations on low-income youth'sacademic achievement. Journal of Youth and Adolescence 38(6): 826�838.
Morgan SL (1998) Adolescent educational expectations. Rationality and Society 10(2):131�162.
Morgan SL (2002) Modeling preparatory commitment and non-repeatable decisions.Rationality and Society 14(4): 387�429.
Muller C; Katz SR and Dance LJ (1999) Investing in teaching and learning: dynamicsof the teacher-student relationship from each actor's perspective. Urban Education34(3): 292�337.
Müller W and Karle W (1993) Social selection in educational systems in Europe. Euro-pean Sociological Review 9(1): 1�23.
Müller-Benedict V (2007) Wodurch kann die soziale Ungleichheit des Schulerfolgs amstärksten verringert werden? Kölner Zeitschrift für Soziologie und Sozialpsychologie59(4): 615�639.
Nash R (2003) Inequality/di�erence in education: is a real explanation of primary andsecondary e�ects possible? The British Journal of Sociology 54(4): 433�451.
Need A and De Jong U (2001) Educational di�erentials in the Netherlands. Rationalityand Society 13(1): 71�98.
Olsen RJ (1980) A least squares correction for selectivity bias. Econometrica: Journalof the Econometric Society 48(7): 1815�1820.
Parsons T (1959) The school class as a social system: some of its functions in Americansociety. Harvard Educational Review 29(4): 297�318.
Pietsch M and Stubbe TC (2007) Inequality in the transition from primary to secondaryschool: school choices and educational disparities in Germany. European EducationalResearch Journal 6(4): 424�445.
Raudenbush SW (1984) Magnitude of teacher expectancy e�ects on pupil IQ as a func-tion of the credibility of expectancy induction: a synthesis of �ndings from 18 exper-iments. Journal of Educational Psychology 76(1): 85�97.
Raudenbush SW (1994) Random e�ects models. In: Cooper H and Hedges LV (eds.)The handbook of research synthesis, 301�321. New York: Sage.
Rivkin SG; Hanushek EA and Kain JF (2005) Teachers, schools, and academic achieve-ment. Econometrica: Journal of the Econometric Society 73(2): 417�458.
Rogosa D (1987) Casual models do not support scienti�c conclusions: a comment insupport of Freedman. Journal of Educational Statistics 12(2): 185�195.
253
References
Rosenthal R and DiMatteo MR (2001) Meta-analysis: recent developments in quantita-tive methods for literature reviews. Annual Review of Psychology 52: 59�82.
Rosenthal R and Jacobson L (1968) Pygmalion in the Classroom: Teacher Expectationand Pupils' Intellectual Development. New York: Holt, Rinehart & Winston.
Rosenthal R and Rubin DB (1978) Interpersonal expectancy e�ects: the �rst 345 studies.Behavioral and Brain Sciences 1(3): 377�415.
Roth BM (1995) We can throw teacher expactations on the IQ scrap heap. New YorkTimes A25.
Sartori AE (2003) An estimator for some binary-outcome selection models without ex-clusion restrictions. Political Analysis 11(2): 111�138.
Schneider T (2008) Social inequality in educational participation in the German schoolsystem in a longitudinal perspective: pathways into and out of the most prestigiousschool track. European Sociological Review 24(4): 511�526.
Sewell WH; Haller AO and Ohlendorf GW (1970) The educational and early occupationalstatus attainment process: replication and revision. American Sociological Review35(6): 1014�1027.
Sewell WH; Haller AO and Portes A (1969) The educational and early occupationalattainment process. American Sociological Review 34(1): 82�92.
Smith ML (1980) Meta-analysis of research in teacher expectation. Evaluation in Edu-cation 4: 53�56.
Snijders TAB and Bosker RJ (1999) Multilevel Analysis: An Introduction to Basic andAdvanced Multilevel Modeling. London: Sage Publications Ltd.
Snow RE (1969) Un�nished pygmalion. Contemporary Psychology 14(4): 197�199.
Sø rensen AB (1998) Theoretical mechanisms and the empirical study of social processes.In: Hedström P and Swedberg R (eds.) Social Mechanisms: An Analytical Approachto Social Theory, 238�266. Cambridge: Cambridge University Press.
StataCorp (2009) Stata Statistical Software: Release 11. College Station, TX: StataCorpLP.
Stocké V (2007) Explaining educational decision and e�ects of families' social classposition: an empirical test of the Breen Goldthorpe model of educational attainment.European Sociological Review 23(4): 505�519.
Thorndike RL (1968) Review of Pygmalion in the classroom. American EducationalResearch Journal 5(4): 708�711.
254

IV. The Impact of Teachers' Expectations on Students' Educational Opportunities in The Life Course
Train KA (2003) Discrete Choice Methods with Simulation. Cambridge: CambridgeUniversity Press.
Vella F (1993) A simple estimator for simultaneous models with censored endogenousregressors. International Economic Review 34(2): 441�457.
Vella F (1998) Estimating models with sample selection bias: a survey. Journal ofHuman Resources 33(1): 127�169.
Vella F and Verbeek M (1999) Estimating and interpreting models with endogenoustreatment e�ects. Journal of Business & Economic Statistics 17(4): 473�478.
Wineburg SS (1987) The self-ful�llment of the self-ful�lling prophecy. Educational Re-searcher 16(9): 28�37.
Winship C and Mare RD (1992) Models for sample selection bias. Annual Review ofSociology 18: 327�350.
Wooldridge JM (2002) Econometric Analysis of Cross-Section and Panel Data. Cam-bridge, Mass.: MIT Press.
Wooldridge JM (2006) Introductory Econometrics. Cincinnati, Ohio: South-WesternCollege Publ.
255
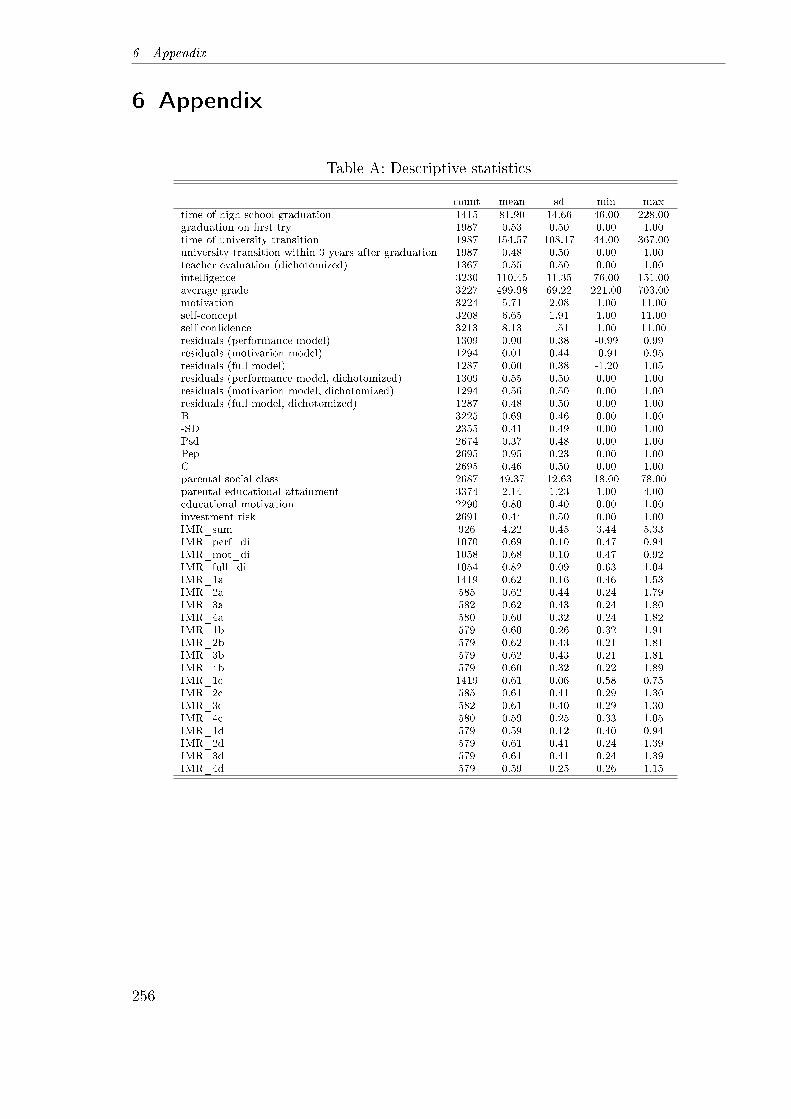
6 Appendix
6 Appendix
Table A: Descriptive statistics
count mean sd min maxtime of high school graduation 1415 81.90 14.66 46.00 228.00graduation on �rst try 1987 0.53 0.50 0.00 1.00time of university transition 1987 154.57 108.17 44.00 367.00university transition within 3 years after graduation 1987 0.48 0.50 0.00 1.00teacher evaluation (dichotomized) 1367 0.55 0.50 0.00 1.00intelligence 3230 110.45 11.35 76.00 151.00average grade 3227 499.98 69.22 221.00 703.00motivation 3224 5.71 2.08 1.00 11.00self-concept 3208 6.65 1.91 1.00 11.00self-con�dence 3213 8.13 1.51 1.00 11.00residuals (performance model) 1309 0.00 0.38 -0.99 0.99residuals (motivarion model) 1294 0.01 0.44 -0.91 0.95residuals (full model) 1287 0.00 0.38 -1.20 1.05residuals (performance model, dichotomized) 1309 0.55 0.50 0.00 1.00residuals (motivarion model, dichotomized) 1294 0.56 0.50 0.00 1.00residuals (full model, dichotomized) 1287 0.48 0.50 0.00 1.00B 3225 0.69 0.46 0.00 1.00-SD 2355 0.41 0.49 0.00 1.00Psd 2674 0.37 0.48 0.00 1.00Pep 2695 0.95 0.23 0.00 1.00C 2695 0.46 0.50 0.00 1.00parental social class 2687 49.37 12.63 18.00 78.00parental educational attainment 3374 2.14 1.23 1.00 4.00educational motivation 2290 0.80 0.40 0.00 1.00investment risk 2691 0.44 0.50 0.00 1.00IMR_sum 926 4.22 0.45 3.44 5.33IMR_perf_di 1070 0.69 0.10 0.47 0.94IMR_mot_di 1058 0.68 0.10 0.47 0.92IMR_full_di 1054 0.82 0.09 0.63 1.04IMR_1a 1419 0.62 0.16 0.46 1.53IMR_2a 585 0.62 0.44 0.24 1.79IMR_3a 582 0.62 0.43 0.24 1.80IMR_4a 580 0.60 0.32 0.24 1.82IMR_1b 579 0.60 0.26 0.32 1.91IMR_2b 579 0.62 0.43 0.21 1.81IMR_3b 579 0.62 0.43 0.21 1.81IMR_4b 579 0.60 0.32 0.22 1.89IMR_1c 1419 0.61 0.06 0.58 0.75IMR_2c 585 0.61 0.41 0.29 1.30IMR_3c 582 0.61 0.40 0.29 1.30IMR_4c 580 0.59 0.25 0.33 1.05IMR_1d 579 0.59 0.12 0.40 0.94IMR_2d 579 0.61 0.41 0.24 1.39IMR_3d 579 0.61 0.41 0.24 1.39IMR_4d 579 0.59 0.25 0.26 1.15
256
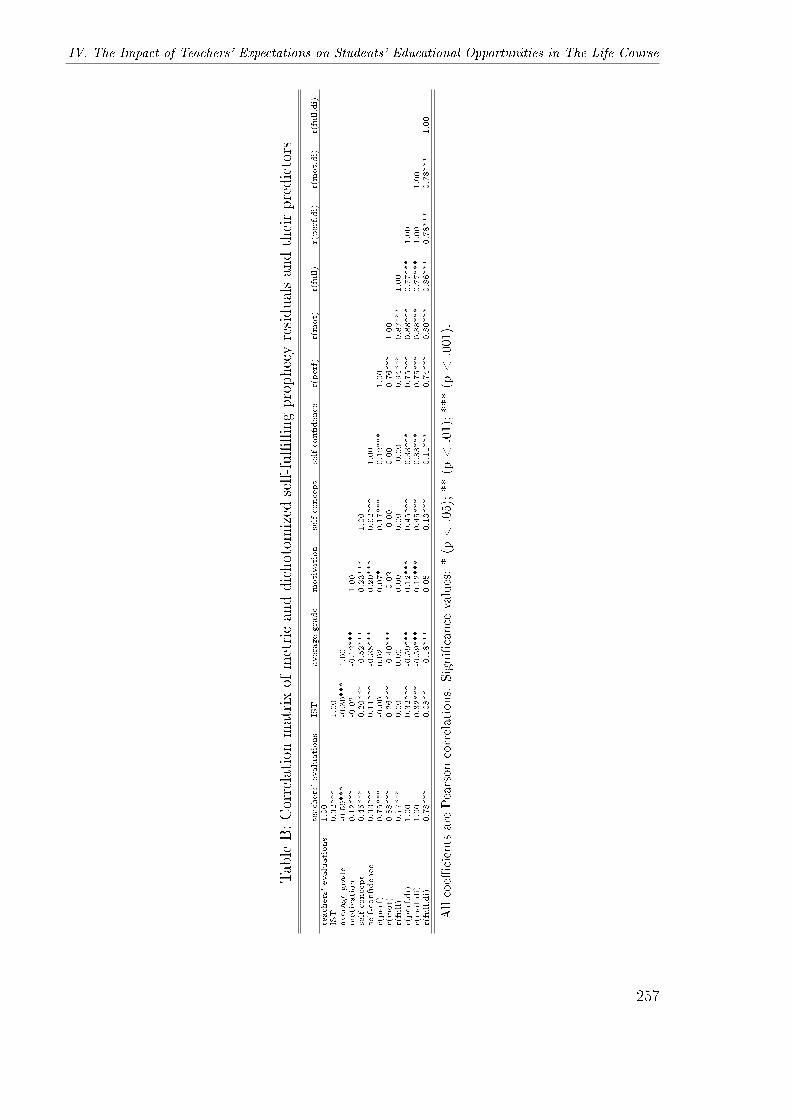
IV. The Impact of Teachers' Expectations on Students' Educational Opportunities in The Life Course
TableB:Correlation
matrixof
metricanddichotom
ized
self-ful�llingprophecyresidualsandtheirpredictors
teachers'evaluations
IST
averagegrade
motivation
self-concept
self-con�dence
r(perf)
r(mot)
r(full)
r(perf.di)
r(mot.di)
r(full.di)
teachers'evaluations
1.00
IST
0.32***
1.00
averagegrade
-0.59***
-0.30***
1.00
motivation
0.12***
-0.02
-0.12***
1.00
self-concept
0.45***
0.20***
-0.52***
0.23***
1.00
self-con�dence
0.33***
0.11***
-0.38***
0.20***
0.62***
1.00
r(perf)
0.75***
-0.00
0.02
0.07*
0.17***
0.12***
1.00
r(mot)
0.88***
0.26***
-0.40***
-0.02
-0.00
0.00
0.76***
1.00
r(full)
0.77***
0.00
0.00
0.00
0.00
-0.00
0.94***
0.87***
1.00
r(perf.di)
1.00
0.32***
-0.59***
0.12***
0.45***
0.33***
0.75***
0.88***
0.77***
1.00
r(mot.di)
1.00
0.32***
-0.59***
0.12***
0.45***
0.33***
0.75***
0.88***
0.77***
1.00
1.00
r(full.di)
0.78***
0.08**
-0.18***
0.05
0.13***
0.11***
0.74***
0.80***
0.86***
0.78***
0.78***
1.00
Allcoe�
cients
are
Pearsoncorrelations.
Signi�cance
values:*(p
<.05);**(p
<.01);***(p
<.001).
257
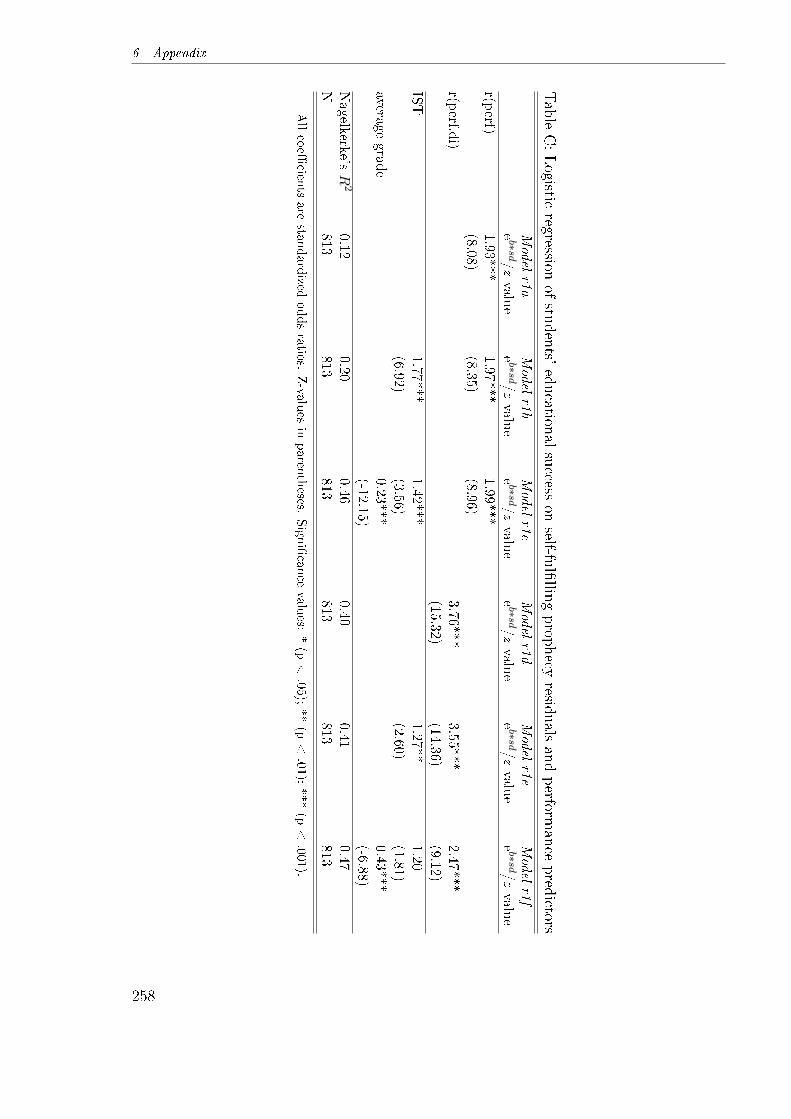
6 Appendix
TableC:Logistic
regressionof
students'
education
alsuccess
onself-fu
l�llin
gprop
hecy
residuals
andperform
ance
pred
ictors
Model
r1a
Model
r1b
Model
r1c
Model
r1d
Model
r1e
Model
r1f
eb∗sd/
z-valu
eeb∗sd/
z-valu
eeb∗sd/
z-valu
eeb∗sd/
z-valu
eeb∗sd/
z-valu
eeb∗sd/
z-valu
e
r(perf)
1.93***1.97***
1.99***(8.08)
(8.35)(8.96)
r(perf.d
i)3.76***
3.55***2.47***
(15.32)(14.36)
(9.12)
IST
1.77***1.42***
1.27**1.20
(6.92)(3.56)
(2.60)(1.81)
averagegrad
e0.23***
0.43***(-12.15)
(-6.88)
Nagelkerke's
R2
0.120.20
0.460.40
0.410.47
N813
813813
813813
813
Allcoe�
cients
are
standardized
oddsratio
s.Z-va
lues
inparen
theses.
Signi�cance
values:
*(p
<.05);**(p
<.01);***(p
<.001).
258

IV. The Impact of Teachers' Expectations on Students' Educational Opportunities in The Life Course
TableD:Logisticregression
ofstudents'educational
successon
self-ful�llingprophecyresidualsandmotivationpredictors
Model
r2a
Model
r2b
Model
r2c
Model
r2d
Model
r2e
Model
r2f
Model
r2g
Model
r2h
eb∗sd/z
eb∗sd/z
eb∗sd/z
eb∗sd/z
eb∗sd/z
eb∗sd/z
eb∗sd/z
eb∗sd/z
r(mot)
2.68***
2.72***
2.73***
2.72***
(11.45)
(11.62)
(12.34)
(12.32)
r(mot.di)
3.64***
3.59***
3.12***
3.10***
(15.01)
(14.77)
(12.48)
(12.39)
motivation
1.47***
1.28**
1.27**
1.31**
1.23*
1.23*
(4.79)
(2.76)
(2.59)
(3.07)
(2.33)
(2.23)
self-concept
2.60***
2.34***
1.53***
1.44**
(9.68)
(7.39)
(4.26)
(3.16)
self-con�dence
1.20
1.12
(1.66)
(1.00)
Nagelkerke'sR
20.24
0.27
0.42
0.42
0.39
0.40
0.42
0.42
N804
804
804
804
804
804
804
804
Allcoe�
cients
are
standardized
oddsratios.
Z-values
inparentheses.Signi�cance
values:*(p
<.05);**(p
<.01);***(p
<.001).
259
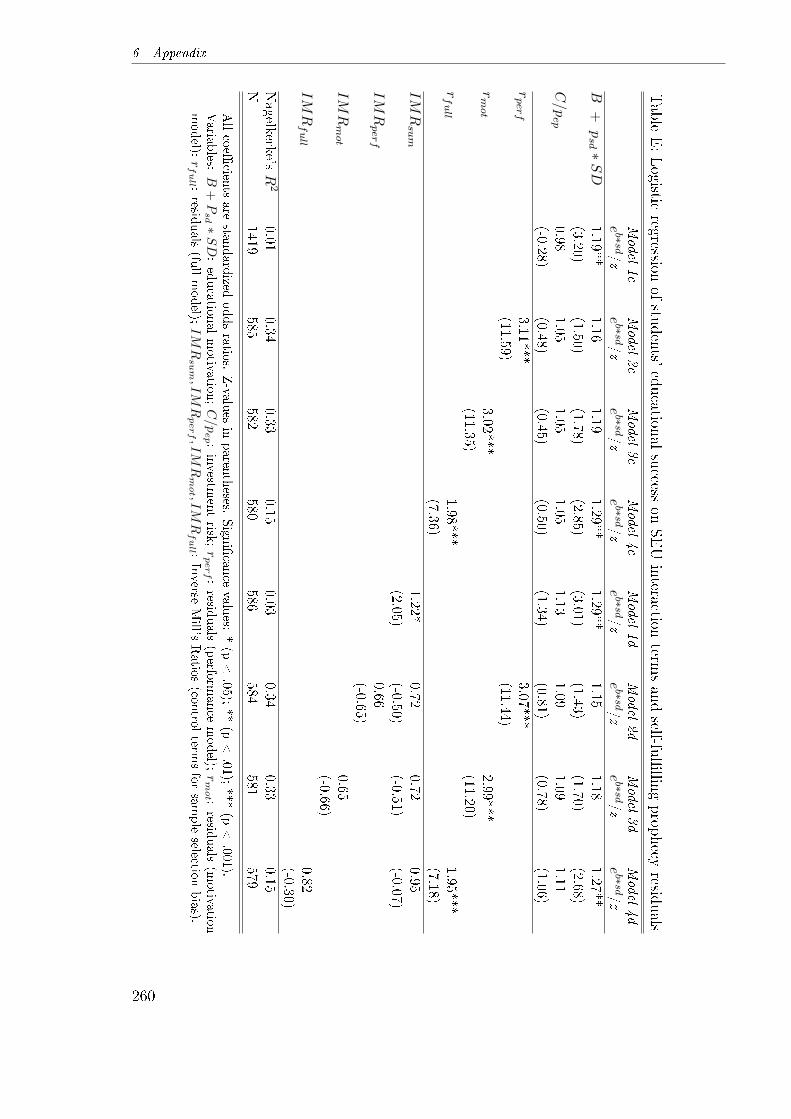
6 Appendix
TableE:Logistic
regressionof
students'
education
alsuccess
onSEUinteraction
termsandself-fu
l�llin
gprop
hecy
residuals
Model
1c
Model
2c
Model
3c
Model
4c
Model
1d
Model
2d
Model
3d
Model
4d
eb∗sd/
zeb∗sd/
zeb∗sd/
zeb∗sd/
zeb∗sd/
zeb∗sd/
zeb∗sd/
zeb∗sd/
z
B+
psd ∗
SD
1.19**1.16
1.191.29**
1.29**1.15
1.181.27**
(3.20)(1.50)
(1.78)(2.85)
(3.01)(1.43)
(1.70)(2.68)
C/pep
0.981.05
1.051.05
1.131.09
1.091.11
(-0.28)(0.48)
(0.45)(0.50)
(1.34)(0.81)
(0.78)(1.06)
rperf
3.11***3.07***
(11.59)(11.44)
rmot
3.02***2.99***
(11.35)(11.20)
rfull
1.98***1.95***
(7.36)(7.18)
IMRsum
1.22*0.72
0.720.95
(2.05)(-0.50)
(-0.51)(-0.07)
IMRperf
0.66(-0.65)
IMRmot
0.65(-0.66)
IMRfull
0.82(-0.30)
Nagelkerke's
R2
0.010.34
0.330.15
0.030.34
0.330.15
N1419
585582
580586
584581
579
Allcoe�
cients
are
standardized
oddsratio
s.Z-va
lues
inparen
theses.
Signi�cance
values:
*(p
<.05);**(p
<.01);***(p
<.001).
Varia
bles:
B+Psd∗SD:educatio
nalmotiva
tion;C/pep :
investm
entrisk
;rperf:resid
uals(perfo
rmance
model);
rm
ot :
residuals(m
otiva
tion
model);
rfull :
residuals(fu
llmodel);
IMR
sum,IMR
perf,IMR
mot ,I
MR
full :
Inverse
Mill's
Ratio
s(co
ntro
lterm
sforsampleselectio
nbias).
260

IV. The Impact of Teachers' Expectations on Students' Educational Opportunities in The Life Course
TableF:Logisticregression
ofstudents'transitionsto
university
onSEUinteractionterm
sandself-ful�llingprophecyresid-
ualswithcontrolsforsampleselection
Model
5c
Model
6c
Model
7c
Model
8c
Model
5d
Model
6d
Model
7d
Model
8d
eb∗sd/z
eb∗sd/z
eb∗sd/z
eb∗sd/z
eb∗sd/z
eb∗sd/z
eb∗sd/z
eb∗sd/z
B+
psd∗SD
1.12*
1.04
1.07
1.16
1.00
0.85
0.85
0.70
(2.16)
(0.44)
(0.70)
(1.68)
(-0.01)
(-0.84)
(-0.85)
(-1.14)
C/pep
1.06
1.10
1.10
1.13
1.07
0.97
0.97
0.90
(1.03)
(0.91)
(0.89)
(1.23)
(0.39)
(-0.19)
(-0.18)
(-0.61)
r perf
2.73***
0.48
(10.46)
(-0.53)
r mot
2.65***
0.48
(10.22)
(-0.55)
r full
1.77***
0.47
(6.47)
(-0.96)
socialclass
1.01
1.03
1.02
1.05
0.96
0.89
0.89
0.79
(0.09)
(0.22)
(0.18)
(0.47)
(-0.16)
(-0.69)
(-0.70)
(-1.17)
education
1.14
1.05
1.06
1.10
1.14
1.07
1.07
1.10
(1.91)
(0.42)
(0.45)
(0.86)
(1.18)
(0.48)
(0.48)
(0.79)
IMR
1d
0.80
(-0.53)
IMR
2d
0.17
(-1.25)
IMR
3d
0.17
(-1.30)
IMR
4d
0.22
(-1.67)
Nagelkerke'sR
20.01
0.27
0.26
0.12
0.02
0.27
0.27
0.12
N1414
584
581
579
579
579
579.00
579
Allcoe�
cients
arestandardized
oddsratios.Z-values
inparentheses.Signi�cance
values:*(p<
.05);**
(p<
.01);***(p<
.001).
Variables:B:expectedbene�t;−SD:expectedstatusdecline;psd:expectedim
pactof
statusdecline;pep:subjectiveexpected
probabilityof
educational
success;r perf:residuals(perform
ance
model);r m
ot:
residuals(m
otivationmodel);r full:residuals(full
model);IMR
1a−IMR
4a:InverseMill'sRatios(control
term
sforsampleselectionbias).
261

6 Appendix
TableG:Logistic
regressionofstu
dents'
education
alsuccess
onSEUpred
ictorsandself-fu
l�llin
gprop
hecy
residuals
(reduced
samplesize
models)
Model
1a
Model
1a(red
.for
perf.)
Model
1a(red
.for
mot.)
Model
1a(red
.for
full)
eb∗sd/z-valu
eeb∗sd/z-valu
eeb∗sd/z-valu
eeb∗sd/z-valu
e
B1.21***
1.33**1.36***
1.34***(3.54)
(3.21)(3.45)
(3.35)-SD
1.12*1.32**
1.32**1.32**
(2.05)(2.97)
(3.00)(2.94)
psd
0.88*0.89
0.900.90
(-2.18)(-1.20)
(-1.17)(-1.18)
pep
1.39***1.66***
1.63***1.63***
(5.43)(4.71)
(4.57)(4.58)
C0.96
0.960.97
0.96(-0.75)
(-0.40)(-0.36)
(-0.39)
Nagelkerke's
R2
0.060.12
0.120.12
N1419
585582
580
Allcoe�
cients
arestan
dard
izedoddsratios.
Z-valu
esin
paren
theses.
Sign
i�can
cevalu
es:*(p<
.05);**
(p<
.01);***
(p<
.001).Variab
les:B:expected
bene�t;−SD:expected
statusdeclin
e;psd :
expected
impact
ofstatu
sdeclin
e;pep :
subjective
expected
prob
ability
ofeducation
alsuccess.
262
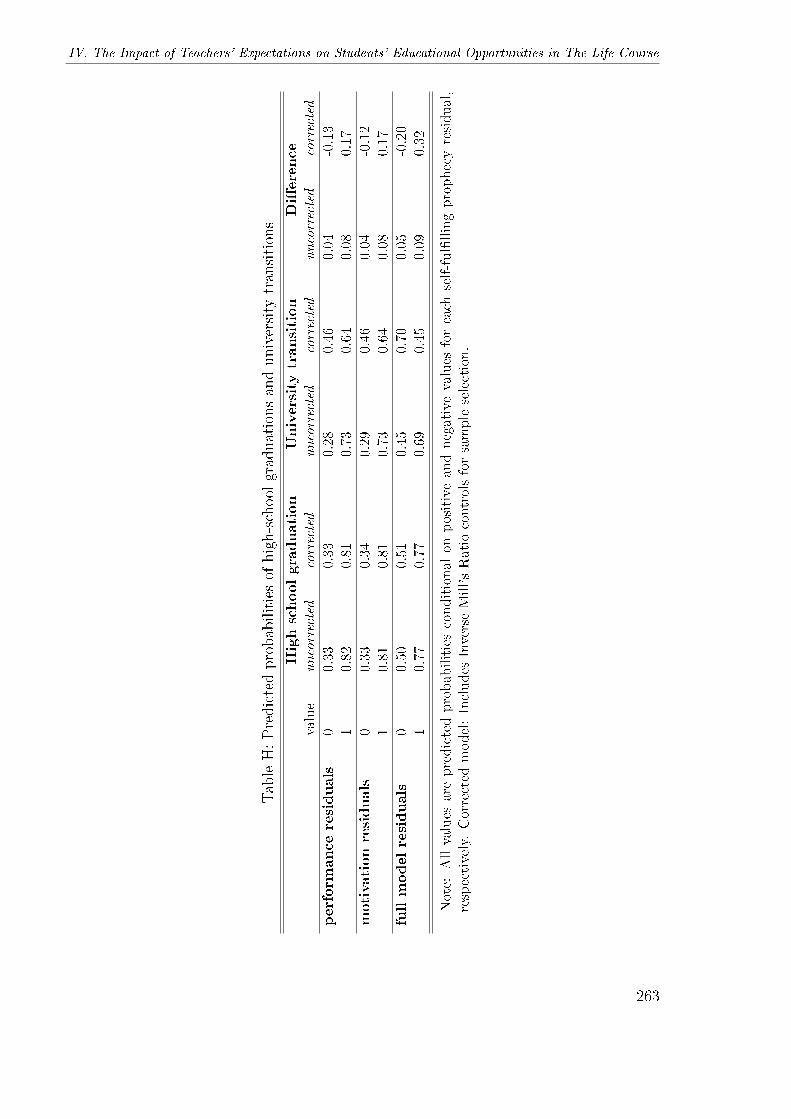
IV. The Impact of Teachers' Expectations on Students' Educational Opportunities in The Life Course
TableH:Predictedprobabilitiesof
high-school
graduationsanduniversity
transitions
Highschoolgraduation
University
transition
Di�erence
value
uncorrected
corrected
uncorrected
corrected
uncorrected
corrected
performanceresiduals
00.33
0.33
0.28
0.46
0.04
-0.13
10.82
0.81
0.73
0.64
0.08
0.17
motivationresiduals
00.33
0.34
0.29
0.46
0.04
-0.12
10.81
0.81
0.73
0.64
0.08
0.17
fullmodelresiduals
00.50
0.51
0.45
0.70
0.05
-0.20
10.77
0.77
0.69
0.45
0.09
0.32
Note:
Allvalues
arepredictedprobabilitiesconditional
onpositiveandnegativevalues
foreach
self-ful�llingprophecyresidual,
respectively.Corrected
model:Includes
InverseMill'sRatio
controlsforsampleselection.
263
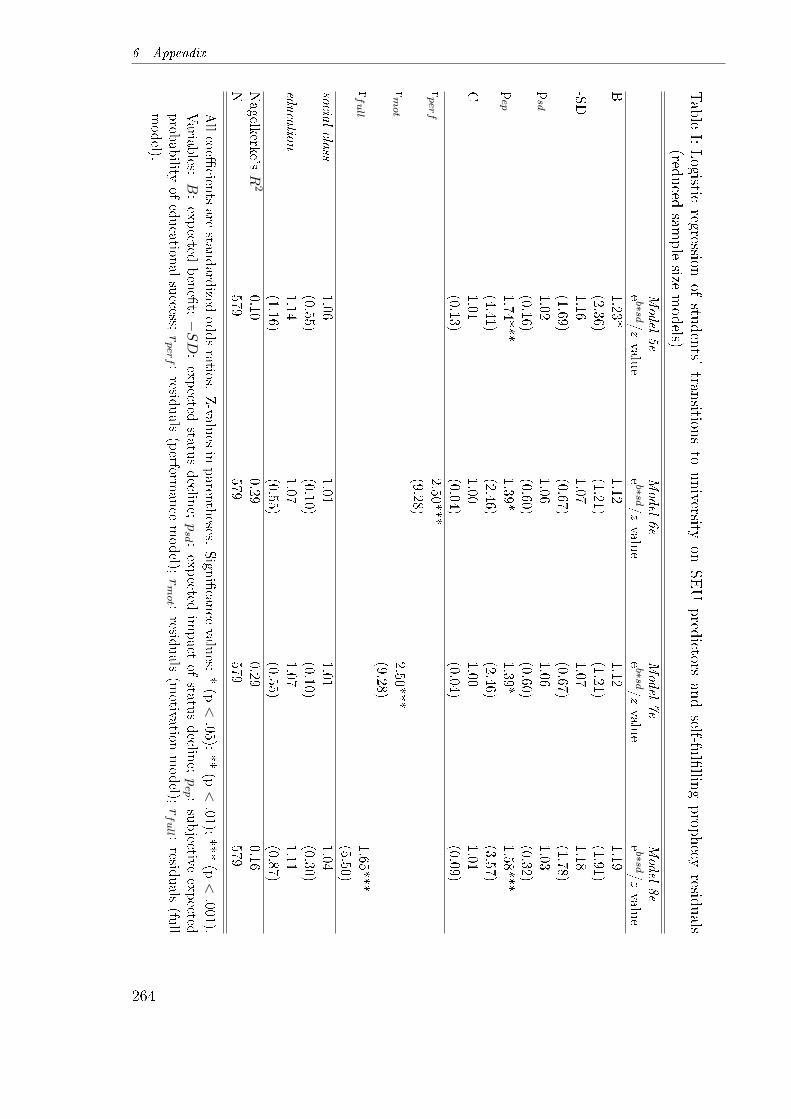
6 Appendix
TableI:Logistic
regressionof
students'
transition
sto
university
onSEU
pred
ictorsandself-fu
l�llin
gprop
hecy
residuals
(reduced
samplesize
models)
Model
5e
Model
6e
Model
7e
Model
8e
eb∗sd/
z-valu
eeb∗sd/
z-valu
eeb∗sd/
z-valu
eeb∗sd/
z-valu
e
B1.23*
1.121.12
1.19(2.36)
(1.21)(1.21)
(1.91)-SD
1.161.07
1.071.18
(1.69)(0.67)
(0.67)(1.78)
psd
1.021.06
1.061.03
(0.16)(0.60)
(0.60)(0.32)
pep
1.74***1.39*
1.39*1.58***
(4.41)(2.46)
(2.46)(3.57)
C1.01
1.001.00
1.01(0.13)
(0.04)(0.04)
(0.09)
rperf
2.50***(9.28)
rmot
2.50***(9.28)
rfull
1.65***(5.50)
socialcla
ss1.06
1.011.01
1.04(0.55)
(0.10)(0.10)
(0.30)educatio
n1.14
1.071.07
1.11(1.16)
(0.55)(0.55)
(0.87)
Nagelkerke's
R2
0.100.29
0.290.16
N579
579579
579
Allcoe�
cients
arestan
dard
izedoddsratios.
Z-valu
esin
paren
theses.
Sign
i�can
cevalu
es:*(p<
.05);**
(p<
.01);***
(p<
.001).Variab
les:B:expected
bene�t;−SD:expected
statusdeclin
e;psd :
expected
impact
ofstatu
sdeclin
e;pep :
subjective
expected
prob
ability
ofeducation
alsuccess;
rperf :
residuals
(perform
ance
model);
rmot :
residuals
(motivation
model);
rfull :
residuals
(full
model).
264
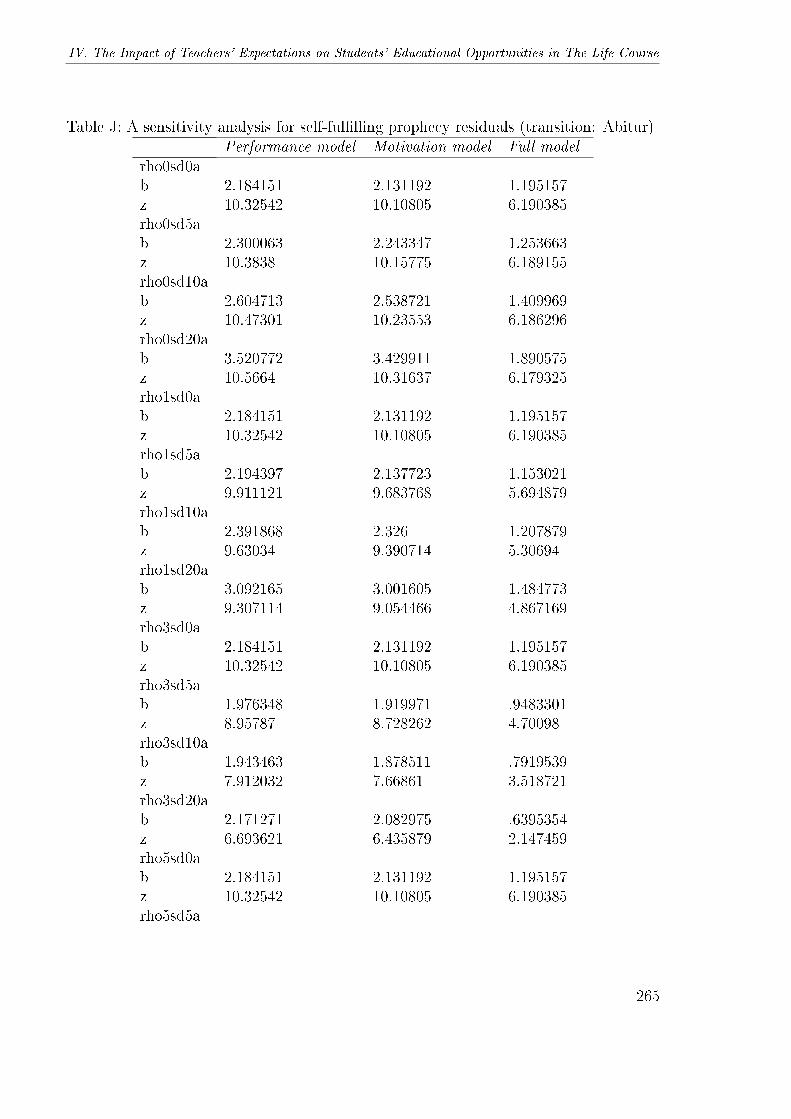
IV. The Impact of Teachers' Expectations on Students' Educational Opportunities in The Life Course
Table J: A sensitivity analysis for self-ful�lling prophecy residuals (transition: Abitur)Performance model Motivation model Full model
rho0sd0ab 2.184151 2.131192 1.195157z 10.32542 10.10805 6.190385rho0sd5ab 2.300063 2.243347 1.253663z 10.3838 10.15775 6.189155rho0sd10ab 2.604713 2.538721 1.409969z 10.47301 10.23553 6.186296rho0sd20ab 3.520772 3.429911 1.890575z 10.5664 10.31637 6.179325rho1sd0ab 2.184151 2.131192 1.195157z 10.32542 10.10805 6.190385rho1sd5ab 2.194397 2.137723 1.153021z 9.911121 9.683768 5.694879rho1sd10ab 2.391868 2.326 1.207879z 9.63034 9.390714 5.30694rho1sd20ab 3.092165 3.001605 1.484773z 9.307114 9.054466 4.867169rho3sd0ab 2.184151 2.131192 1.195157z 10.32542 10.10805 6.190385rho3sd5ab 1.976348 1.919971 .9483301z 8.95787 8.728262 4.70098rho3sd10ab 1.943463 1.878511 .7919539z 7.912032 7.66861 3.518721rho3sd20ab 2.171271 2.082975 .6395354z 6.693621 6.435879 2.147459rho5sd0ab 2.184151 2.131192 1.195157z 10.32542 10.10805 6.190385rho5sd5a
265
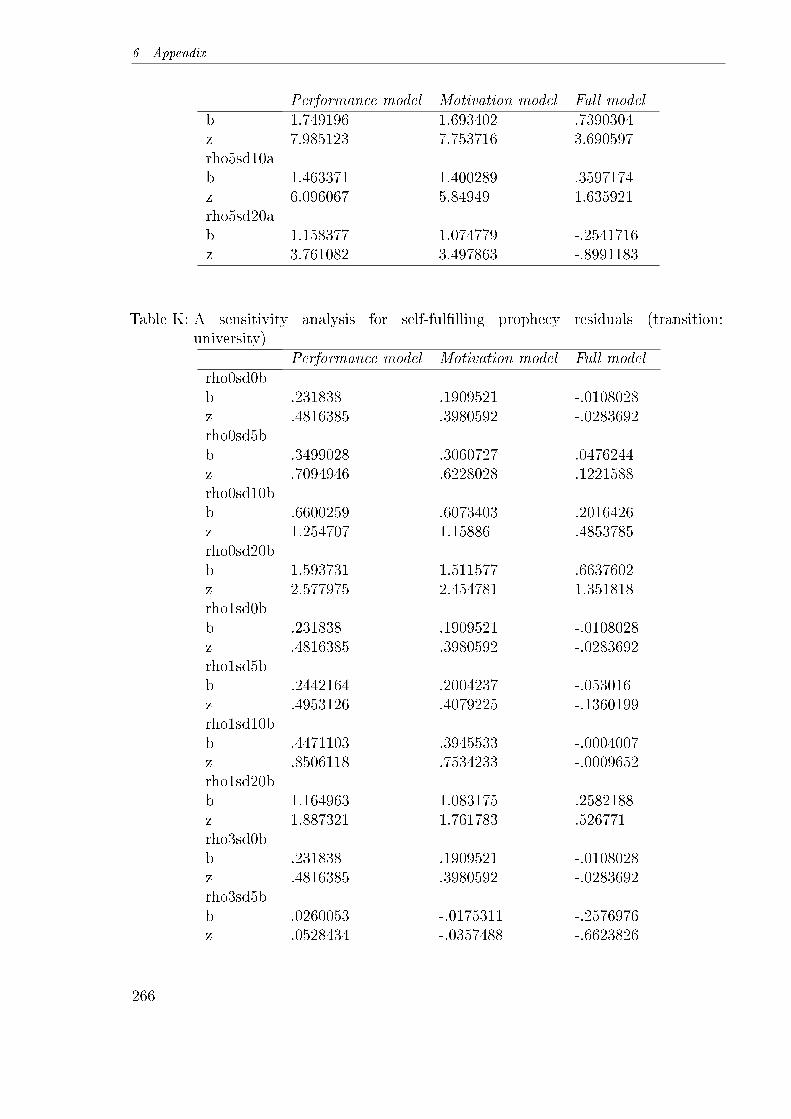
6 Appendix
Performance model Motivation model Full modelb 1.749196 1.693402 .7390304z 7.985123 7.753716 3.690597rho5sd10ab 1.463371 1.400289 .3597174z 6.096067 5.84949 1.635921rho5sd20ab 1.158377 1.074779 -.2541716z 3.761082 3.497863 -.8991183
Table K: A sensitivity analysis for self-ful�lling prophecy residuals (transition:university)
Performance model Motivation model Full modelrho0sd0bb .231838 .1909521 -.0108028z .4816385 .3980592 -.0283692rho0sd5bb .3499028 .3060727 .0476244z .7094946 .6228028 .1221588rho0sd10bb .6600259 .6073403 .2016426z 1.254707 1.15886 .4853785rho0sd20bb 1.593731 1.511577 .6637602z 2.577975 2.454781 1.351818rho1sd0bb .231838 .1909521 -.0108028z .4816385 .3980592 -.0283692rho1sd5bb .2442164 .2004237 -.053016z .4953126 .4079225 -.1360199rho1sd10bb .4471103 .3945533 -.0004007z .8506118 .7534233 -.0009652rho1sd20bb 1.164963 1.083175 .2582188z 1.887321 1.761783 .526771rho3sd0bb .231838 .1909521 -.0108028z .4816385 .3980592 -.0283692rho3sd5bb .0260053 -.0175311 -.2576976z .0528434 -.0357488 -.6623826
266
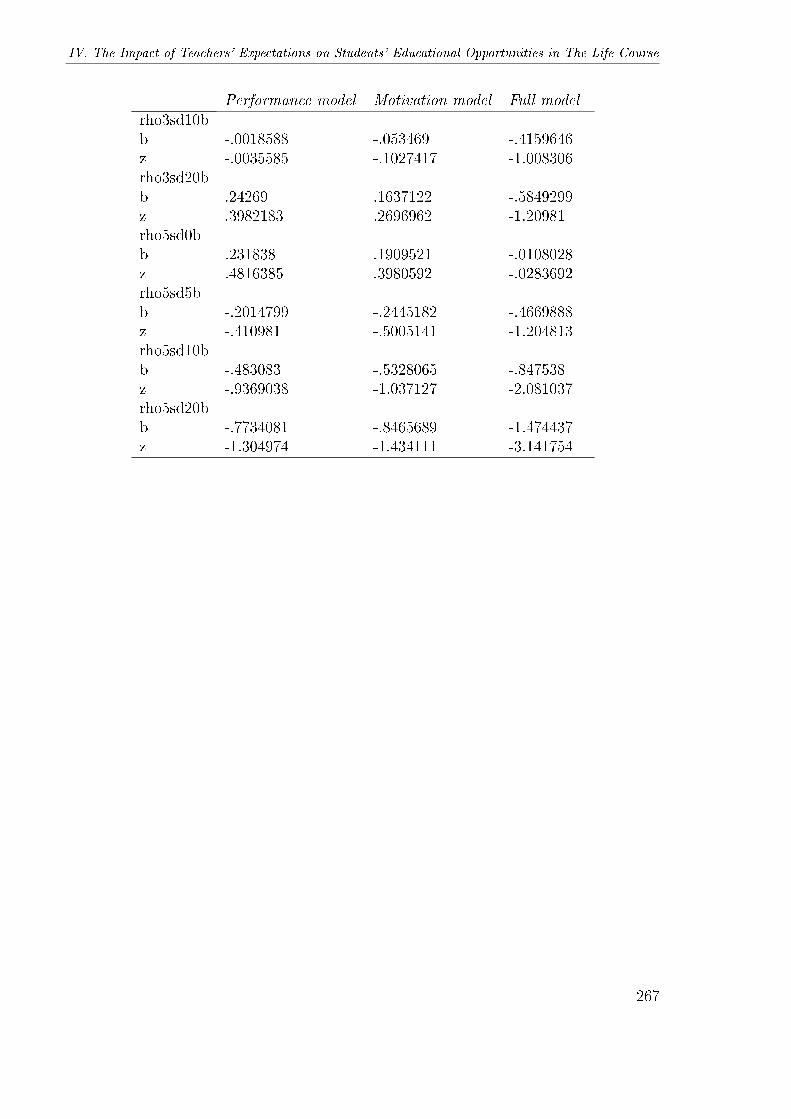
IV. The Impact of Teachers' Expectations on Students' Educational Opportunities in The Life Course
Performance model Motivation model Full modelrho3sd10bb -.0018588 -.053469 -.4159646z -.0035585 -.1027417 -1.008306rho3sd20bb .24269 .1637122 -.5849299z .3982183 .2696962 -1.20981rho5sd0bb .231838 .1909521 -.0108028z .4816385 .3980592 -.0283692rho5sd5bb -.2014799 -.2445182 -.4669888z -.410981 -.5005141 -1.204813rho5sd10bb -.483083 -.5328065 -.847538z -.9369038 -1.037127 -2.081037rho5sd20bb -.7734081 -.8465689 -1.474437z -1.304974 -1.434111 -3.141754
267

V. Does The E�ect of Teachers'
Expectations On Students'
Educational Opportunities Decrease
Over Educational Transitions?A statistical matching approach
Various theoretical propositions suggest that social inequalities in educa-tional opportunities (IEO) would decrease over students' educational tran-sitions ('cross-grade patterns'; Lucas, 2009), but empirical analyses usuallyremain restricted to tests of student- or parent-level cost-bene�t assessments.In this paper, I build on a subjective expected utility explanation of howteachers' expectations towards their students should a�ect the latter's tran-sition propensities via their subjective expected probability of educationalsuccess, and I deduce hypotheses about decreasing teacher expectancy ef-fects over students' educational course of life by referring to a mechanism ofBayesian updating.Having outlined how my theoretical model suits the important conditional
independence assumption, I test my hypotheses by means of a sequentiallogit model (with additional robustness analyses) based on an arti�cial stu-dent cohort that has been created via the technique of statistical matching(Rubin, 1986; D'Orazio et al., 2006). Results suggest that i) the predictedprobabilities of educational transitions onto higher-level tracks are higherfor students of whom their teachers hold more positive expectations, ii) thesize of short-time expectancy e�ects decreases over educational transitions,and iii) short-term expectancy e�ects are larger than long-term expectancye�ects.
1 Introduction
On the one hand, we �nd a variety of theoretical explanations such as the Life CoursePerspective (LCP ; Müller and Karle, 1993), M aximally M aintained Inequality (MMI ;
269
1 Introduction
Raftery and Hout, 1993), Relative Risk Aversion (RRA; Breen and Goldthorpe, 1997) orE�ectively M aintained Inequality (EMI ; Lucas, 2001) which all suggest that the e�ectof students' social backgrounds on their propensity to take the next higher node in theeducational decision tree should decrease over educational transitions. This phenomenonwhich has been identi�ed in many empirical studies (Mare, 1980, 1981; Smith and Che-ung, 1986; Cobalti, 1990; Müller and Karle, 1993; Tolsma et al., 2007) was referred torepresent cross-grade patterns (Lucas, 2009) � in contrast to the cross-cohort patterns(i.e. lower social background e�ects for later birth cohorts) that some of these theorieseither primarily or additionally aim to explain.Although only one of the above-quoted theoretical propositions, namely RRA (Breen
and Goldthorpe, 1997), was originally written down in a formal way, re-formalization ofboth MMI and EMI (Lucas, 2009) reveals that all three of them predominantly remainrestricted to student- or parent-level cost-bene�t analyses.On the other hand, even in educational sociology it has already been criticized that
standard economic approaches ignore the endogeneity of students' preferences in terms ofan interaction with signi�cant persons in the classroom (Lauen, 2007, p. 183) � althoughthe latter circumstance had already been re�ected in the early Wisconsin model of statusattainment (Sewell et al., 1969, 1970; also see Morgan, 2002).In the social-psychological literature, over four decades of Pygmalion (Rosenthal and
Jacobson, 1968) and self-ful�lling prophecy research indicate that teachers' expecta-tions can have considerable e�ects on students' educational achievement (for researchoverviews see Raudenbush, 1984; Jussim, 1986; Rosenthal, 1994; Jussim and Harber,2005). This should, at least, result in path-dependency e�ects regarding students' educa-tional transitions. Most notably, a great number of studies predominantly found teacherexpectancy e�ects also to decrease over students' educational course of life (Rosenthaland Jacobson, 1968; Rist, 1970; West and Anderson, 1976; Frieze et al., 1991; Smithet al., 1999; Madon et al., 2006; Mistry et al., 2009; Hinnant et al., 2009; de Boer et al.,2010). These �ndings nicely coincide with the results for parental background e�ectsobtained by educational sociologists.Thus, the theoretical objective of this paper is �rst to build on an existing subjective
expected utility (henceforth referred to as SEU ) explanation of how teachers' expec-tations towards their students should a�ect students' transition propensities via theirsubjective expected probabilities of educational success. Second, to deduce hypothe-ses about decreasing teacher expectancy e�ects over students' educational transitions, Ipoint to a mechanism of Bayesian updating (Breen, 1999; Breen and García-Peñalosa,2002; Morgan, 2005, ch. 5): Conditional on being over- or underestimated by theirteacher, and conditional on having passed an educational transition or not, students ei-ther upwardly or downwardly update their beliefs according to the Bayesian rule. Basedon a simpli�ed decision tree, I elaborate on three di�erent updating scenarios to clarifythe argument.From the perspective of conventional SEU explanations, the teacher side of classroom
interaction is now explicitly considered. From the perspective of the current researchstatus in teacher expectancy studies, I make use of a repeated belief model (Madon et al.,2006) that measures teachers' expectations at two distinct points in time; and I compute
270
V. Does the E�ect of Teachers' Expectations on Students' Educational Opportunities Decrease?
residualized indicators for teachers' expectations to construct over- and underestimationswith regard to students' backgrounds such as their academic performance and theirmotivation (Madon et al., 1997, 2006; Hinnant et al., 2009; de Boer et al., 2010). Thejusti�cation for this procedure is that unlike in experimental studies where perceivers'expectations can be manipulated by exposing them to biased information, in naturalistic(i.e. survey data) studies, only methodological techniques such as residualizing teachers'expectations can ensure them to be actually inaccurate to some extent.
The empirical contribution of the paper at hand is to discuss how the technique ofstatistical matching (Rubin, 1986) can be used to create arti�cial student cohorts for theanalysis of social inequalities in educational opportunities (IEO) when suitable data isunavailable (also see Schubert and Becker, 2010). Since I do not dispose of one singledata �le comprising convincing measures of both teachers' expectations at di�erent ed-ucational transition points and conventional SEU indicators, I use the distance hot deckmatching method (D'Orazio et al., 2006) in order to combine one �le containing teach-ers' expectations in primary school (Gesis-No. ZA893) with another one that containsteachers' expectations in 10th grade (Gesis-No. ZA640). In the methodological section,I elaborate in more detail on what the important conditional independence assumption(CIA) requires from the theoretical distribution of the data and how my theoreticalmodel can be assumed to suit this prerequisite.
The impact of teachers' expectations on students' IEO is then analyzed in the frame-work of a sequential logit model with additional robustness checks such as controls forunobserved heterogeneity (Buis, 2007, 2010, 2011), additional covariates and a com-parison with analyses based on the British Cohort Study. Results suggest that i) thepredicted probabilities of educational transitions onto higher-level tracks are higher forstudents of whom their teachers hold more positive expectations, and ii) that the strengthof this e�ect decreases over students' educational life course.
2 Theory and Hypotheses
In the theoretical section, I �rst give a brief overview on both rational-choice and subjec-tive expected utility explanations of inequality in educational opportunities (2.1). I thensummarize the various theoretical propositions such as LCP, MMI, RRA and EMI thatmake statements about the waning coe�cients pattern over students' educational tran-sitions (2.2). Having described the general idea of Pygmalion or self-ful�lling prophecyresearch (2.3), I sketch my theoretical model regarding the e�ect of teachers' expecta-tions on students' educational transitions (2.4). The theoretical section concludes byformulating falsi�able hypotheses deduced from the theoretical model that address howthis e�ect can be assumed to decrease over educational transitions (2.5).
271
2 Theory and Hypotheses
2.1 Inequality in Educational Opportunities: Rational Choice
Approaches
The distinction between primary and secondary e�ects of social inequality (Boudon,1974) is probably the most in�uential theoretical proposition to explain inequalities ineducational opportunities at least in quantitatively-oriented educational sociology. Thecore idea is that primary e�ects are related to the impact of parental social backgroundson their o�spring's academic ability, while secondary e�ects refer to both structural andorganizational conditions of the school as well as to the lower educational aspirationsof the students themselves, or of their parents (also see Nash, 2003; Müller-Benedict,2007). Di�erences in aspirations among social classes are then regarded to be the crucialfactor explaining di�erences in educational opportunities even if di�erences in academicabilities were invariant among the social strata.
The Breen-Goldthorpe model Breen and Goldthorpe (1997) proposed a rationalchoice model to explain di�erences in educational transitions among social classes. Con-cretely, transitions are modeled as a function of subjective cost assessments c, the subjec-tive likelihood of successfully completing the chosen school track π, and the utility thatis attached to di�erent educational outcomes. When α, β and γ denote the respectiveprobabilities of having access to service class conditional on whether a student i) stayedand succeeded in school; ii) stayed and failed in school; or iii) left school, the probabilityof service-class children to remain in service class is given by
pis =πiα + (1− πi)β1
πiα + (1− πi)β1 + γ1(1)
� while the corresponding probability of working-class children is given by
piw =πi + (1− πi)(β1 + β2)
πi + (1− πi)(β1 + β2) + (γ1 + γ2). (2)
Breen and Goldthorpe (1997) show that pis > piw for any value of π less than one(p. 284). By content, this means that children from service class will be more willing tocontinue a high level of education than children from working class.Apart from di�erences in resources, Breen and Goldthorpe (1997) highlight the con-
ditional dependence of students' subjective probability of successfully completing thechosen school track, πi, on their actual academic ability ai: πi = g(ai) (Breen andGoldthorpe, 1997, p. 285). This assumption has already proven useful for developinga formal model about the impact of self-ful�lling prophecies on students' educationalopportunities (Becker, 2010a).However, while the previous equations merely relate to class entry probabilities de-
pending on a simple single-choice decision model, Breen and Goldthorpe (1997) ac-knowledge reality to be more complex. To be more precise, in most � if not all � cases ofeducational transition decisions, a multiple transition model approximates reality moreclosely. In this latter model, the number of parameters increases as there are now two
272
V. Does the E�ect of Teachers' Expectations on Students' Educational Opportunities Decrease?
transition choices that lead to di�erent educational outcomes. First, we have two param-eters of subjective expected educational success, π1 and π2, previous to each educationalchoice. Second, we have more parameters for students' probabilities of entering one ofthe three outcome classes: Let γ denote the probability of having access to service classafter having left education at choice 1, β the corresponding probability after choosingto continue at choice 1 but failing thereafter, δ the probability after a successful waythrough education after choice 1 but after then deciding to leave at choice 2, ε the prob-ability after a failure following the second transition, and Φ the probability of havingaccess to service class after two successful educational transitions. Breen and Goldthorpe(1997) propose to set up the equation for the second transition decision �rst:
pis2 =πi2Φ + (1− πi2)ε
πi2Φ + (1− πi2)ε+ δ(3)
Then, under the assumption that at the time when the decision for transition choice 1 ismade the subjective expectations for transition 2 have already been shaped, Breen andGoldthorpe (1997) suggest to solve for α in equation 1 via backward induction:1
αi = qi2(πi2Φ + (1− πi2)ε) + (1− qi2)δ, (4)
where qi2 is a function of the subjective probabilities for the second transition, pi2 (Breenand Goldthorpe, 1997, p. 289). Thus, the expected probability of entering service classconditional on succeeding in education after the �rst transition choice is modeled as afunction of students' expected probabilities after choice 2.
Esser's subjective expected utility model Esser (1999) takes up various ideas ofboth the Breen-Goldthorpe (1997) model and an earlier account by Erikson and Jonsson(1996) in introducing two additional terms that di�erentiate more precisely between theexpected bene�t of education, the expected amount of status decline and its impact onactual decisions. In this model, students' or parents' expected utility of continuing ontolower secondary school (An) is determined by
EU(An) = Psd(−SD), (5)
while the expected utility of continuing onto higher secondary school is determined by
EU(Ab) = PepB + (1− Pep)Psd(−SD)− C. (6)
Here, SD is the expected amount of status decline with Psd as its impact on parentaldecisions; B is the bene�t of higher education (e.g. in terms of labor market prospects);Pep is the subjective probability of successfully completing the chosen school track; andC are the expected costs of education (also see Becker, 2003; Pietsch and Stubbe, 2007).
1Note that the model of Bayesian belief updating proposed by Breen (1999) holds exactly the oppositeview in that students' beliefs are supposed to change conditional on passing an educational transition.It is the latter position that I use to argue in favor of decreasing teacher expectancy e�ects in section2.4.
273
2 Theory and Hypotheses
By a series of linear transformations, Esser (1999) shows that EU(Ab) > EU(An) ifB + PsdSD > C/Pep. Adopting his terminology, this relation means by content thata higher level of education will be aspired if the educational motivation to continuesomehow exceeds the underlying investment risk.Although Esser's model doesn't make a statement about conditional educational tran-
sition decisions, its higher conceptual accuracy shall be adopted in the theoretical modelof self-ful�lling prophecies sketched below.
2.2 The 'Waning Coe�cients Pattern'
This section is aimed to give an overview of the theoretical approaches that try to explainwhy in numerous studies (Mare, 1980, 1981; Smith and Cheung, 1986; Cobalti, 1990;Müller and Karle, 1993; Tolsma et al., 2007), social background e�ects were observed todecrease in the course of students' educational transitions. Since most of these theoriesprimarily intend to explain the phenomenon of waning coe�cients over student cohortsrather than over educational transitions, the following allusions are far from exhaustive.
Life course perspective (LCP) In their study of the nine European nations partici-pating in the CASMIN (Comparative Analysis of SocialM obility in Industrial N ations)project, Müller and Karle (1993) stressed that in order to explain the variance in socialinequality between countries, scholars are advised to consider also the di�erent class-speci�c survival patterns across transitions and nations. While France was found to bethe most exclusive country, in Hungary the odds of completing secondary education arebetter than in most other countries (Müller and Karle, 1993, p. 9). However, for thepurpose of the paper at hand, another one of their �ndings is much more important,which leads us to �gure 1.In this graph, Müller and Karle (1993) plot the estimates of a conditional logistic
regression model of educational transitions on parental social class with varying suc-cess rates across both transition points and nations. The reference category of all linesare students from higher service-class families. Results show that at later transitions,class di�erentials tend to become smaller � resulting in a decrease in the relative risk oflower-class students not to pass the respective transition. This overall trend, in�ectionssuch as stronger social origin e�ects at transition T2 compared to T1 as well as otherpeculiar patterns are explained by the relation between the importance of di�erent tran-sition steps for the educational career and the variance of educational aspirations in theeducational life courses among social strata.
Maximally maintained inequality (MMI) The crucial idea of the proposition ofmaximally maintained inequality (MMI ) can be summarized in the statement that�transition rates and inequality (as measured by odds ratios) remain constant unlessforced to change by increasing enrollments� (Raftery and Hout, 1993, p. 42). By meansof a cohort analysis of both the Irish Mobility Study and the Drumcondra Study ofEducational Achievement, Raftery and Hout (1993) indeed �nd by trend decreasing so-
274
V. Does the E�ect of Teachers' Expectations on Students' Educational Opportunities Decrease?
cial background e�ects at later educational transitions � but they also observe that thisphenomenon is in turn sensitive to the progress of educational expansion: As enroll-ment rates to school increase, less margin for class di�erentials in entering secondaryeducation is left (Raftery and Hout, 1993, 55f.). Thus, the di�erence between early andlate transition background e�ects decreases for later cohorts as enrollment rates increase(�gure 2).2
Relative risk aversion (RRA) Breen and Goldthorpe's explanation of relative r iskaversion (RRA) builds on their model of educational di�erentials due to varying aspira-tions and resources among social classes. Coming back to equations (3) and (4), Breenand Goldthorpe (1997) deduce that under the assumption that the parameters δ, ε, andφ do not vary by social classes, transition choices at higher levels will be less a�ectedby social class than transition choices at lower levels: First, the situation of consecutivedecisions will have reduced class di�erences in ability, and second, every higher-leveltransition decision is less risky in terms of suspected status decline than the precedingone. For instance, Breen and Goldthorpe (1997) assume that if secondary educationhad already been successfully �nished, for working-class parents, a higher-level decision,say, for or against tertiary education would not be associated with the risk of demotionto the underclass anymore. As a result, class di�erentials concerning this decision maystill persist but should be lessened compared to the preceding one(s) due to the lowerperceived risk of downward mobility.
E�ectively maintained inequality (EMI) The major advancement of Lucas' theo-rem of e�ectively maintained inequality is that it also considers that education maybe tracked, and that students' selection into di�erent school tracks may in turn varyby parental social backgrounds. That is, while MMI claims that socioeconomic di�er-ences will be canceled out when a certain level of schooling becomes universal, EMIposits that the socioeconomically advantaged will strive to secure qualitative di�erences(in terms of tracking) at the given quantitative level of schooling. In addition to thistheoretical contribution, Lucas (2001) promoted IEO research also methodologically bydemanding the analysis of predicted probabilities of educational transitions rather thanof regression coe�cients (or odds ratios) since the latter cannot reveal whether socialbackground moves people over thresholds.3 In an ordered probit model, Lucas (2001)
2The main di�erence between MMI and LCP is that �(...) LCP emphasizes that as children age theybecome more and more independent of parents, whereas MMI implies that adolescents' independenceitself depends on the sociopolitical context and the support for particular levels of education� (Lucas,2001, p. 1647).
3Apart from the statistical reason that distribution-insensitive predicted probabilities are robustagainst the criticism that was brought in by Cameron and Heckman (1998) and posits that theobserved decline in odds ratios is only due to (unjusti�ed) functional form assumptions of the un-derlying logit equations, Lucas (2001, 2009) also sees a substantive reason that speaks in favor ofthe analysis of predicted probabilities: Whereas odds ratios merely describe the association betweenpredictor variables and their outcomes, only predicted probabilities consider �whether advantagedpersons exceed pivotal thresholds to enter categorical positions that provide advantages� (Lucas,2009, p. 490f.).
275
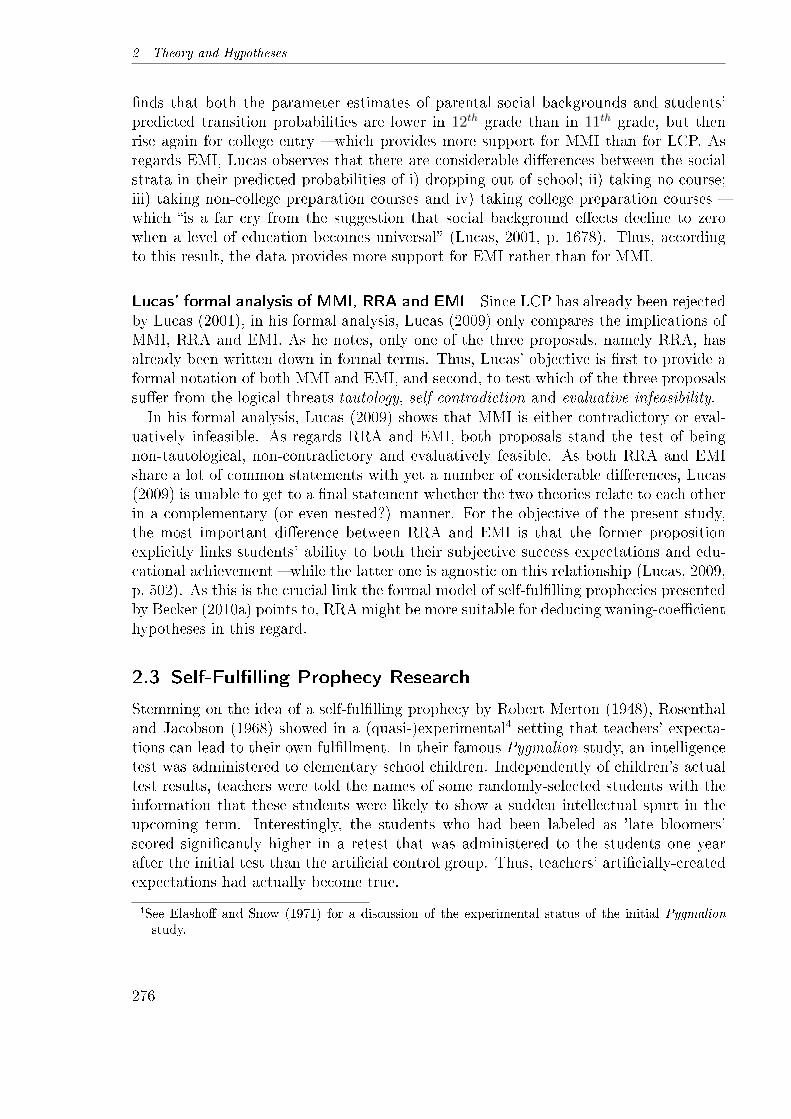
2 Theory and Hypotheses
�nds that both the parameter estimates of parental social backgrounds and students'predicted transition probabilities are lower in 12th grade than in 11th grade, but thenrise again for college entry � which provides more support for MMI than for LCP. Asregards EMI, Lucas observes that there are considerable di�erences between the socialstrata in their predicted probabilities of i) dropping out of school; ii) taking no course;iii) taking non-college preparation courses and iv) taking college preparation courses �which �is a far cry from the suggestion that social background e�ects decline to zerowhen a level of education becomes universal� (Lucas, 2001, p. 1678). Thus, accordingto this result, the data provides more support for EMI rather than for MMI.
Lucas' formal analysis of MMI, RRA and EMI Since LCP has already been rejectedby Lucas (2001), in his formal analysis, Lucas (2009) only compares the implications ofMMI, RRA and EMI. As he notes, only one of the three proposals, namely RRA, hasalready been written down in formal terms. Thus, Lucas' objective is �rst to provide aformal notation of both MMI and EMI, and second, to test which of the three proposalssu�er from the logical threats tautology, self-contradiction and evaluative infeasibility.In his formal analysis, Lucas (2009) shows that MMI is either contradictory or eval-
uatively infeasible. As regards RRA and EMI, both proposals stand the test of beingnon-tautological, non-contradictory and evaluatively feasible. As both RRA and EMIshare a lot of common statements with yet a number of considerable di�erences, Lucas(2009) is unable to get to a �nal statement whether the two theories relate to each otherin a complementary (or even nested?) manner. For the objective of the present study,the most important di�erence between RRA and EMI is that the former propositionexplicitly links students' ability to both their subjective success expectations and edu-cational achievement � while the latter one is agnostic on this relationship (Lucas, 2009,p. 502). As this is the crucial link the formal model of self-ful�lling prophecies presentedby Becker (2010a) points to, RRA might be more suitable for deducing waning-coe�cienthypotheses in this regard.
2.3 Self-Ful�lling Prophecy Research
Stemming on the idea of a self-ful�lling prophecy by Robert Merton (1948), Rosenthaland Jacobson (1968) showed in a (quasi-)experimental4 setting that teachers' expecta-tions can lead to their own ful�llment. In their famous Pygmalion study, an intelligencetest was administered to elementary school children. Independently of children's actualtest results, teachers were told the names of some randomly-selected students with theinformation that these students were likely to show a sudden intellectual spurt in theupcoming term. Interestingly, the students who had been labeled as 'late bloomers'scored signi�cantly higher in a retest that was administered to the students one yearafter the initial test than the arti�cial control group. Thus, teachers' arti�cially-createdexpectations had actually become true.
4See Elasho� and Snow (1971) for a discussion of the experimental status of the initial Pygmalion
study.
276
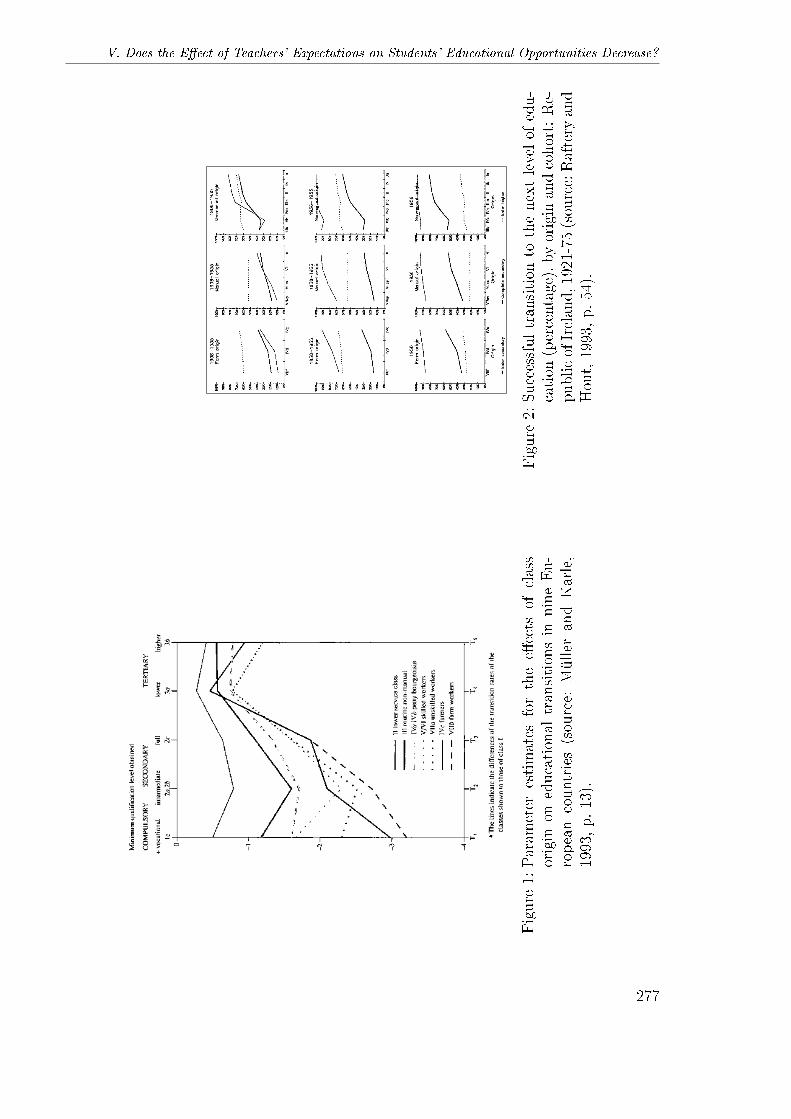
V. Does the E�ect of Teachers' Expectations on Students' Educational Opportunities Decrease?
Figure1:Param
eter
estimates
forthee�ects
ofclass
origin
oneducationaltransitionsin
nine
Eu-
ropeancountries(source:
MüllerandKarle,
1993,p.
13).
Figure2:Successful
transition
tothenext
levelof
edu-
cation
(percentage),byoriginandcohort:Re-
publicofIreland,1921-75(source:Raftery
and
Hout,1993,p.
54).
277
2 Theory and Hypotheses
Due to fundamental critics brought in by educational psychologists, Rosenthal becameone of the pioneers in meta-analysis in order to defend his main idea of a self-ful�llingprophecy in the classroom. In a �rst meta-analytic review of the �rst 345 Pygmalionstudies, Rosenthal and Rubin (1978) found an overall e�ect size of teachers' expectationson students' intelligence between d = .14 up to d = 1.73 and r = .07 up to r = .65. Latermeta-analyses observed e�ect sizes between .11 (Raudenbush, 1984) and .16 (Smith,1980).5 Compared to the loads of basic Pygmalion and self-ful�lling prophecy studies,only few studies have bothered with searching for potential moderator e�ects6 or withtesting if e�ect sizes do accumulate, diminish, or remain stable over time. Concerning thelatter question, following the review by Smith et al. (1999), until 1993, only four studiesexplicitly dealt with this question. First, Rosenthal and Jacobson (1968) themselvesnoted that the randomly-selected late bloomers gained more IQ points in the �rst yearof the study than in the second year. Second, using table assignment as a criterion foridentifying self-ful�lling prophecies, Rist (1970) noticed that di�erences between initialtable assignment of the students in kindergarten and ability grouping by the teachersdeclined from �rst to second grade. Third, West and Anderson (1976) observed that thepath coe�cient relating teachers' expectations in students' freshman-year of high schoolto student achievement was higher for students' sophomore-year achievement than forstudents' senior-year achievement. Yet, fourth, Frieze et al. (1991) discovered that the(positive) relationship between facial attractiveness of MBA graduates and their salariesincreased over time.7
Smith et al. (1999) themselves analyzed the e�ect of teacher perceptions in 6th and7th grade on both students' �nal marks and standardized test scores in 7th, 10th and12th grade. As an advancement over the existing literature, they distinguished betweensingle-perceiver models (comparing expectancy e�ects of the same teacher) and multiple-perceiver models (comparing expectancy e�ects of di�erent teachers). Three out ofseven di�erent multiple-perceiver (i.e. teacher) analyses (all of them with marks asan outcome) give support for the dissipation hypothesis, another three analyses (twoof them with marks, and one of them with standardized test scores as an outcome)give support for the stability hypothesis8, and one analysis did not show self-ful�llingprophecy e�ects at all. The single-perceiver analysis also gave support for the dissipationhypotheses. Yet, Smith et al. (1999) noted that teachers' perceptions were able to predictstudent achievement up to seven years. Thus, although no support for the accumulationhypothesis was observed, self-ful�lling prophecies were considered to be long lasting.In the last decade, about as much studies tested for potential changes in the self-
ful�lling prophecy e�ect sizes over time than during the preceding three decades of
5See Rosenthal and DiMatteo (2001) for an explanation of common meta-analytical measures.6See Jussim and Harber (2005) for a summary of research about moderators of self-ful�lling prophecies.7However, note that Madon et al. (2006) consider neither the study by Frieze et al. (1991) nor theone by Rist (1970) to be 'real' self-ful�lling prophecy analyses since perceivers' beliefs have not beenmeasured explicitly.
8In fact, the three analyses that Smith et al. (1999) named to give support for the stability hypothesisalso showed declining coe�cients for later achievement measures (which is at least suggestive in termsof the dissemination hypothesis), but the respective χ2 di�erence tests lacked statistical signi�cance.
278
V. Does the E�ect of Teachers' Expectations on Students' Educational Opportunities Decrease?
Pygmalion and self-ful�lling prophecy research. In this context, the perhaps most pro-found study is the work by Madon et al. (2006). The main contribution of their paperis to test a repeated belief model measuring mothers' expectations about their children'salcohol consumption at di�erent time points, and to examine potential changes in e�ectsizes over time. Whereas all above-cited studies only used 'gross' expectations to test forself-ful�lling prophecies, Madon et al. (2006) referred to the operationalization of Madonet al. (1997) who used residualized perceivers' expectations to construct over- and un-derestimations that are to a certain extent inaccurate.9 They noted an accumulation ofself-ful�lling prophecies for a combination of unfavorable expectations of mothers withregard to their children's alcohol consumption. However, Madon et al. (2006) did nottreat the context of teachers' expectations on students' educational achievement.Mistry et al. (2009) simultaneously tested the e�ects of both parents' and teachers'
(unresidualized) expectations � both measured at two distinct time points � on students'achievement in the early school years. In several auto-regressive cross-lagged path mod-els, Mistry et al. (2009) found stability of both adults' expectations and youths' testscores, but having controlled for teachers' expectations at t2, no signi�cant direct e�ectsof teachers' expectations at t1 on student achievement were found.Hinnant et al. (2009) tested for e�ects of (residualized) �rst and third grade teachers'
expectations on students' third and �fth grade reading and math abilities. Whereasthey found no signi�cant e�ect of teachers' expectations on students' reading abilitiesin neither third nor �fth grade, �rst grade teachers' expectations showed signi�cantresults on students' third and �fth grade math achievement, and third grade teachers'expectations also signi�cantly predicted students' �fth grade math achievement.10 Asregards longitudinal comparisons, Hinnant et al. (2009) discovered that the e�ect of �rstgrade teachers' expectations on students' third grade math achievement was larger thanthe e�ect of the former on students' �fth grade math achievement. The latter e�ect, inturn, was larger than the e�ect of third grade teachers' expectations on students' �fthgrade math achievement.And �nally, de Boer et al. (2010) analyzed the e�ect of primary-school teachers' (resid-
ualized) recommendations regarding their students' secondary school track choice on thelatter's performance up to �ve years later.11 They found that in the �rst two years,teachers' expectancy bias partly dissipated but after that remained quite stable over
9In contrast to experimental studies such as the one by Rosenthal and Jacobson (1968) who directlyexposed teachers to biased information and thus aroused biased expectations, naturalistic (i.e. surveydata) studies have to ensure that perceivers' high or low expectations are actually inaccurate (alsosee Jussim, 1986). Madon et al. (1997) proposed to identify inaccurate expectations by regressingthe respective indicator on a set of student achievement and motivation variables in order to usethe residuals of these regressions as a measure of over- and underestimations with regard to thechosen set of predictor variables. Unfortunately, Madon et al. (1997) did not test for the stabilityof self-ful�lling prophecy e�ects over time.
10However, these results have to be interpreted with caution because Hinnant et al. (2009) additionallycontrolled for a teacher-based measure of students' social skills that could be correlated with teachers'expectations of students' achievements.
11As a methodological innovation, de Boer et al. (2010) applied a multilevel analysis in the �rst stepand summed up the residuals of both levels for second-step self-ful�lling prophecy analysis.
279
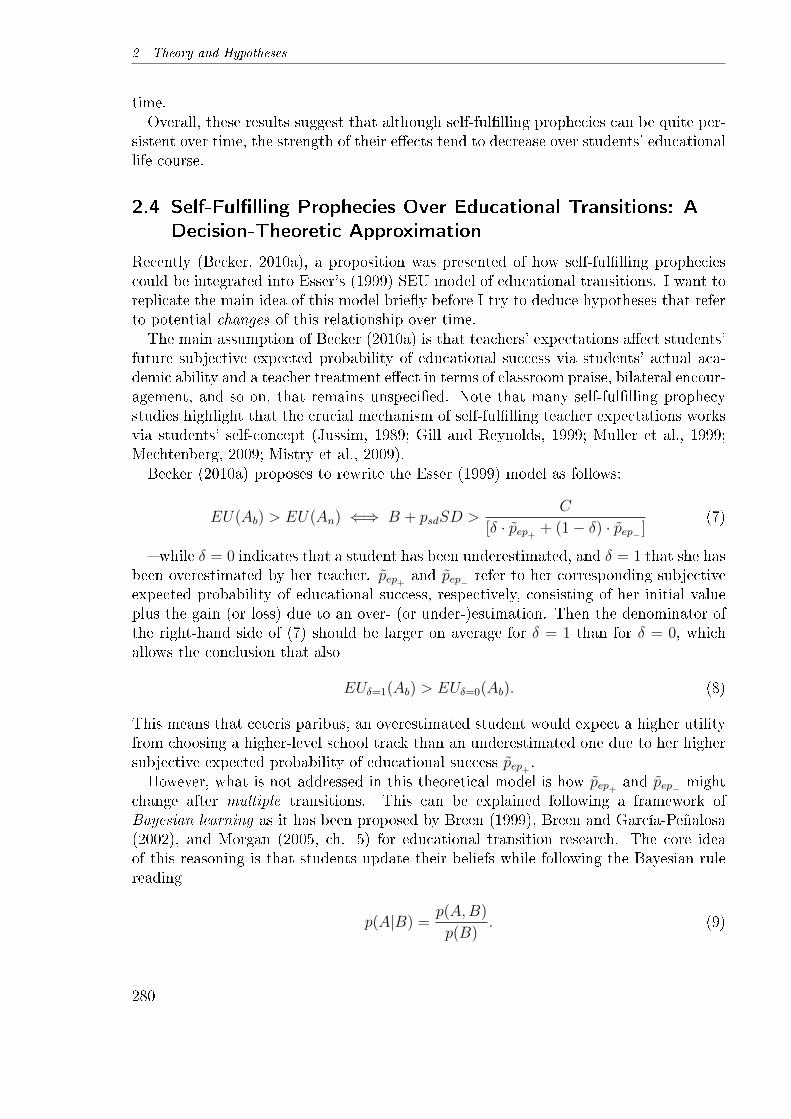
2 Theory and Hypotheses
time.Overall, these results suggest that although self-ful�lling prophecies can be quite per-
sistent over time, the strength of their e�ects tend to decrease over students' educationallife course.
2.4 Self-Ful�lling Prophecies Over Educational Transitions: A
Decision-Theoretic Approximation
Recently (Becker, 2010a), a proposition was presented of how self-ful�lling propheciescould be integrated into Esser's (1999) SEU model of educational transitions. I want toreplicate the main idea of this model brie�y before I try to deduce hypotheses that referto potential changes of this relationship over time.The main assumption of Becker (2010a) is that teachers' expectations a�ect students'
future subjective expected probability of educational success via students' actual aca-demic ability and a teacher treatment e�ect in terms of classroom praise, bilateral encour-agement, and so on, that remains unspeci�ed. Note that many self-ful�lling prophecystudies highlight that the crucial mechanism of self-ful�lling teacher expectations worksvia students' self-concept (Jussim, 1989; Gill and Reynolds, 1999; Muller et al., 1999;Mechtenberg, 2009; Mistry et al., 2009).Becker (2010a) proposes to rewrite the Esser (1999) model as follows:
EU(Ab) > EU(An) ⇐⇒ B + psdSD >C
[δ · pep+ + (1− δ) · pep− ](7)
� while δ = 0 indicates that a student has been underestimated, and δ = 1 that she hasbeen overestimated by her teacher. pep+ and pep− refer to her corresponding subjectiveexpected probability of educational success, respectively, consisting of her initial valueplus the gain (or loss) due to an over- (or under-)estimation. Then the denominator ofthe right-hand side of (7) should be larger on average for δ = 1 than for δ = 0, whichallows the conclusion that also
EUδ=1(Ab) > EUδ=0(Ab). (8)
This means that ceteris paribus, an overestimated student would expect a higher utilityfrom choosing a higher-level school track than an underestimated one due to her highersubjective expected probability of educational success pep+ .However, what is not addressed in this theoretical model is how pep+ and pep− might
change after multiple transitions. This can be explained following a framework ofBayesian learning as it has been proposed by Breen (1999), Breen and García-Peñalosa(2002), and Morgan (2005, ch. 5) for educational transition research. The core ideaof this reasoning is that students update their beliefs while following the Bayesian rulereading
p(A|B) =p(A,B)
p(B). (9)
280
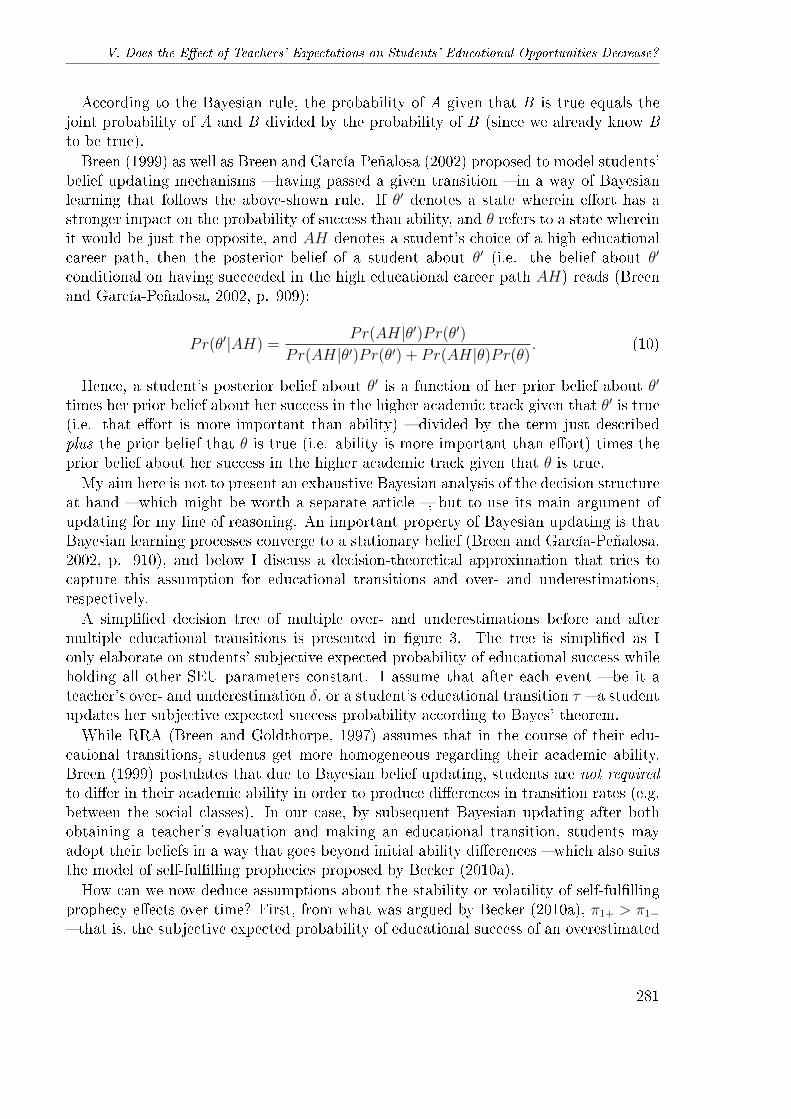
V. Does the E�ect of Teachers' Expectations on Students' Educational Opportunities Decrease?
According to the Bayesian rule, the probability of A given that B is true equals thejoint probability of A and B divided by the probability of B (since we already know Bto be true).Breen (1999) as well as Breen and García-Peñalosa (2002) proposed to model students'
belief updating mechanisms � having passed a given transition � in a way of Bayesianlearning that follows the above-shown rule. If θ′ denotes a state wherein e�ort has astronger impact on the probability of success than ability, and θ refers to a state whereinit would be just the opposite, and AH denotes a student's choice of a high educationalcareer path, then the posterior belief of a student about θ′ (i.e. the belief about θ′
conditional on having succeeded in the high educational career path AH) reads (Breenand García-Peñalosa, 2002, p. 909):
Pr(θ′|AH) =Pr(AH|θ′)Pr(θ′)
Pr(AH|θ′)Pr(θ′) + Pr(AH|θ)Pr(θ). (10)
Hence, a student's posterior belief about θ′ is a function of her prior belief about θ′
times her prior belief about her success in the higher academic track given that θ′ is true(i.e. that e�ort is more important than ability) � divided by the term just describedplus the prior belief that θ is true (i.e. ability is more important than e�ort) times theprior belief about her success in the higher academic track given that θ is true.My aim here is not to present an exhaustive Bayesian analysis of the decision structure
at hand � which might be worth a separate article �, but to use its main argument ofupdating for my line of reasoning. An important property of Bayesian updating is thatBayesian learning processes converge to a stationary belief (Breen and García-Peñalosa,2002, p. 910), and below I discuss a decision-theoretical approximation that tries tocapture this assumption for educational transitions and over- and underestimations,respectively.A simpli�ed decision tree of multiple over- and underestimations before and after
multiple educational transitions is presented in �gure 3. The tree is simpli�ed as Ionly elaborate on students' subjective expected probability of educational success whileholding all other SEU parameters constant. I assume that after each event � be it ateacher's over- and underestimation δ, or a student's educational transition τ � a studentupdates her subjective expected success probability according to Bayes' theorem.While RRA (Breen and Goldthorpe, 1997) assumes that in the course of their edu-
cational transitions, students get more homogeneous regarding their academic ability,Breen (1999) postulates that due to Bayesian belief updating, students are not requiredto di�er in their academic ability in order to produce di�erences in transition rates (e.g.between the social classes). In our case, by subsequent Bayesian updating after bothobtaining a teacher's evaluation and making an educational transition, students mayadopt their beliefs in a way that goes beyond initial ability di�erences � which also suitsthe model of self-ful�lling prophecies proposed by Becker (2010a).How can we now deduce assumptions about the stability or volatility of self-ful�lling
prophecy e�ects over time? First, from what was argued by Becker (2010a), π1+ > π1−� that is, the subjective expected probability of educational success of an overestimated
281

2 Theory and Hypotheses
student is larger than the corresponding parameter for an underestimated student. Sec-ond, following Breen (1999) and Breen and García-Peñalosa (2002), students who havesuccessfully passed the �rst transition will update their subjective expected probabilityof educational success upwardly. Hence, π2+|δ1 = 1 > π1+, and π2+|δ1 = 0 > π1−.12
Being over- and underestimated again, students will once more update their beliefs ac-cording to this teacher treatment.
π0
δ1 = 1
τ1 = 1
δ2 = 1τ2 = 1
τ2 = 01− π2+
π2+
δ2 = 0τ2 = 1
τ2 = 01− π2−
π2−
τ1 = 0
1−π1+
π1+
δ1 = 0
τ1 = 1
δ2 = 1τ2 = 1
τ2 = 01− π2+
π2+
δ2 = 0τ2 = 1
τ2 = 01− π2−
π2−
τ1 = 0
1−π1−
π1−
Figure 3: Decision tree.
As a starting point, let us assume that students have an initial subjective expectedsuccess probability of π0 = 0.5. Let us further assume that in case of an overestimation,π increases by .1, and likewise, in case of an underestimation, π decreases also by .1.Moreover, assume that after a successful transition τ1, the remaining students updatetheir beliefs by +.1. The resulting subjective expected probability estimates before thesecond transition are listed in table 1 in the column that is labeled Scenario 1. Viaan implied mechanism of Bayesian updating, a student who has been overestimatedtwice would �nally show a subjective probability of .8; and a student who has beenunderestimated twice but nonetheless made the �rst transition would show a value of .4.Looking only at the �nal probabilities of students' who have been overestimated beforethe �rst transition (δ1 = 1) regardless of what happened later, we can average over
π|(δ1 = 1) =π2+|(δ1 = 1, δ2 = 1) + π2−|(δ1 = 1, δ2 = 1)
2=
0.8 + 0.6
2= 0.7. (11)
12Note that with the data at hand, students having not passed the �rst transition will drop out of thesample � which is why there is no need to bother with the beliefs in case of τ1 = 0.
282
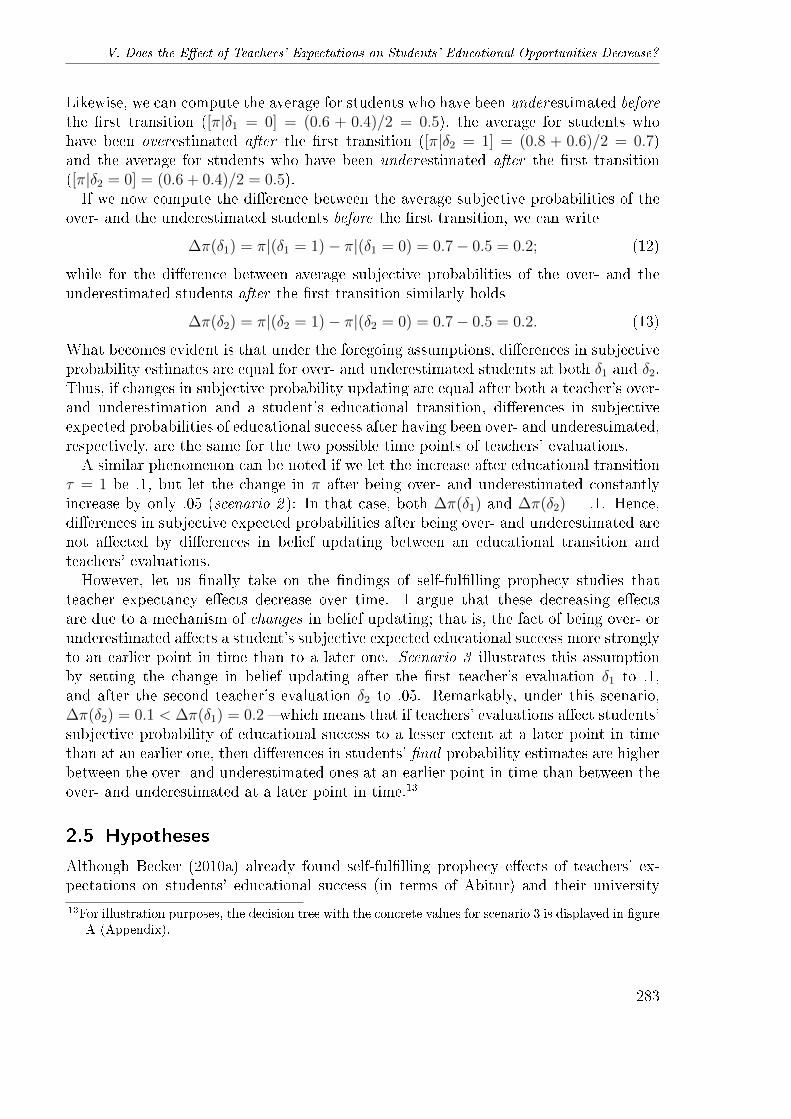
V. Does the E�ect of Teachers' Expectations on Students' Educational Opportunities Decrease?
Likewise, we can compute the average for students who have been underestimated beforethe �rst transition ([π|δ1 = 0] = (0.6 + 0.4)/2 = 0.5), the average for students whohave been overestimated after the �rst transition ([π|δ2 = 1] = (0.8 + 0.6)/2 = 0.7)and the average for students who have been underestimated after the �rst transition([π|δ2 = 0] = (0.6 + 0.4)/2 = 0.5).If we now compute the di�erence between the average subjective probabilities of the
over- and the underestimated students before the �rst transition, we can write
∆π(δ1) = π|(δ1 = 1)− π|(δ1 = 0) = 0.7− 0.5 = 0.2; (12)
while for the di�erence between average subjective probabilities of the over- and theunderestimated students after the �rst transition similarly holds
∆π(δ2) = π|(δ2 = 1)− π|(δ2 = 0) = 0.7− 0.5 = 0.2. (13)
What becomes evident is that under the foregoing assumptions, di�erences in subjectiveprobability estimates are equal for over- and underestimated students at both δ1 and δ2.Thus, if changes in subjective probability updating are equal after both a teacher's over-and underestimation and a student's educational transition, di�erences in subjectiveexpected probabilities of educational success after having been over- and underestimated,respectively, are the same for the two possible time points of teachers' evaluations.A similar phenomenon can be noted if we let the increase after educational transition
τ = 1 be .1, but let the change in π after being over- and underestimated constantlyincrease by only .05 (scenario 2 ): In that case, both ∆π(δ1) and ∆π(δ2) = .1. Hence,di�erences in subjective expected probabilities after being over- and underestimated arenot a�ected by di�erences in belief updating between an educational transition andteachers' evaluations.However, let us �nally take on the �ndings of self-ful�lling prophecy studies that
teacher expectancy e�ects decrease over time. I argue that these decreasing e�ectsare due to a mechanism of changes in belief updating; that is, the fact of being over- orunderestimated a�ects a student's subjective expected educational success more stronglyto an earlier point in time than to a later one. Scenario 3 illustrates this assumptionby setting the change in belief updating after the �rst teacher's evaluation δ1 to .1,and after the second teacher's evaluation δ2 to .05. Remarkably, under this scenario,∆π(δ2) = 0.1 < ∆π(δ1) = 0.2 � which means that if teachers' evaluations a�ect students'subjective probability of educational success to a lesser extent at a later point in timethan at an earlier one, then di�erences in students' �nal probability estimates are higherbetween the over- and underestimated ones at an earlier point in time than between theover- and underestimated at a later point in time.13
2.5 Hypotheses
Although Becker (2010a) already found self-ful�lling prophecy e�ects of teachers' ex-pectations on students' educational success (in terms of Abitur) and their university
13For illustration purposes, the decision tree with the concrete values for scenario 3 is displayed in �gureA (Appendix).
283
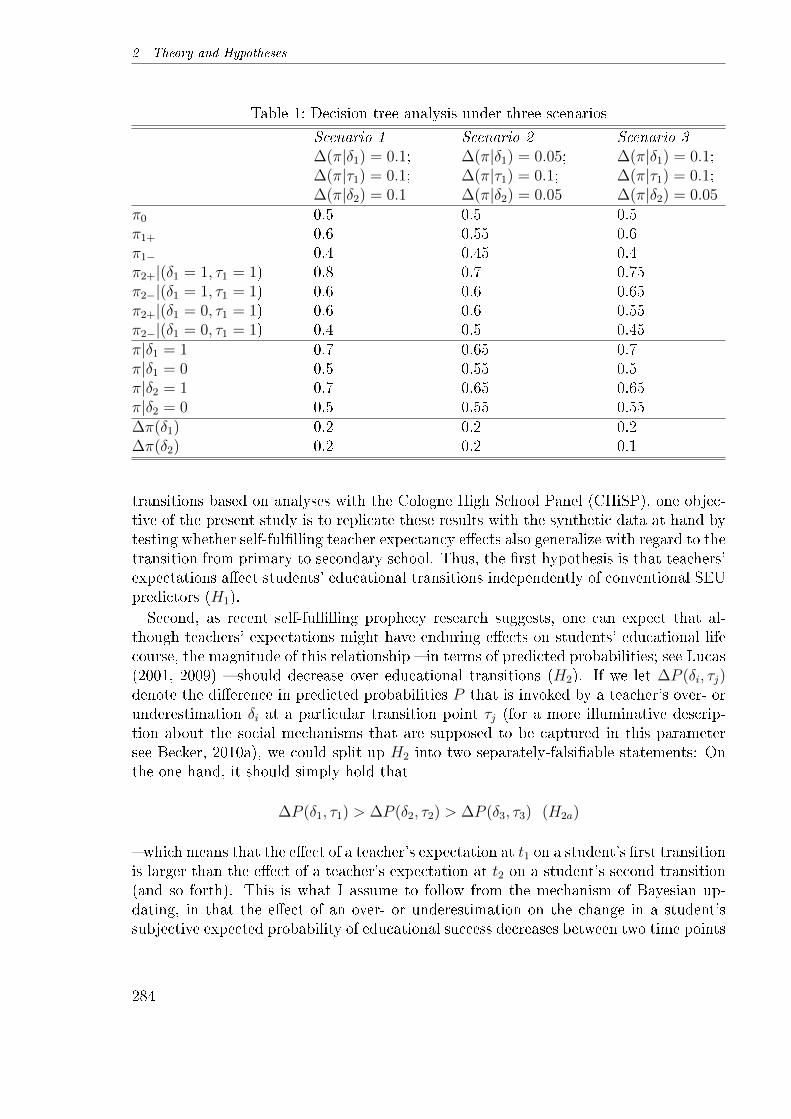
2 Theory and Hypotheses
Table 1: Decision tree analysis under three scenarios
Scenario 1 Scenario 2 Scenario 3∆(π|δ1) = 0.1; ∆(π|δ1) = 0.05; ∆(π|δ1) = 0.1;∆(π|τ1) = 0.1; ∆(π|τ1) = 0.1; ∆(π|τ1) = 0.1;∆(π|δ2) = 0.1 ∆(π|δ2) = 0.05 ∆(π|δ2) = 0.05
π0 0.5 0.5 0.5π1+ 0.6 0.55 0.6π1− 0.4 0.45 0.4π2+|(δ1 = 1, τ1 = 1) 0.8 0.7 0.75π2−|(δ1 = 1, τ1 = 1) 0.6 0.6 0.65π2+|(δ1 = 0, τ1 = 1) 0.6 0.6 0.55π2−|(δ1 = 0, τ1 = 1) 0.4 0.5 0.45π|δ1 = 1 0.7 0.65 0.7π|δ1 = 0 0.5 0.55 0.5π|δ2 = 1 0.7 0.65 0.65π|δ2 = 0 0.5 0.55 0.55∆π(δ1) 0.2 0.2 0.2∆π(δ2) 0.2 0.2 0.1
transitions based on analyses with the Cologne High School Panel (CHiSP), one objec-tive of the present study is to replicate these results with the synthetic data at hand bytesting whether self-ful�lling teacher expectancy e�ects also generalize with regard to thetransition from primary to secondary school. Thus, the �rst hypothesis is that teachers'expectations a�ect students' educational transitions independently of conventional SEUpredictors (H1).Second, as recent self-ful�lling prophecy research suggests, one can expect that al-
though teachers' expectations might have enduring e�ects on students' educational lifecourse, the magnitude of this relationship � in terms of predicted probabilities; see Lucas(2001, 2009) � should decrease over educational transitions (H2). If we let ∆P (δi, τj)denote the di�erence in predicted probabilities P that is invoked by a teacher's over- orunderestimation δi at a particular transition point τj (for a more illuminative descrip-tion about the social mechanisms that are supposed to be captured in this parametersee Becker, 2010a), we could split up H2 into two separately-falsi�able statements: Onthe one hand, it should simply hold that
∆P (δ1, τ1) > ∆P (δ2, τ2) > ∆P (δ3, τ3) (H2a)
� which means that the e�ect of a teacher's expectation at t1 on a student's �rst transitionis larger than the e�ect of a teacher's expectation at t2 on a student's second transition(and so forth). This is what I assume to follow from the mechanism of Bayesian up-dating, in that the e�ect of an over- or underestimation on the change in a student'ssubjective expected probability of educational success decreases between two time points
284
V. Does the E�ect of Teachers' Expectations on Students' Educational Opportunities Decrease?
of evaluations. On the other hand, one could expect that
∆P (δ1, τ2) < ∆P (δ2, τ2); ∆P (δ1, τ3) < ∆P (δ2, τ2) (H2b)
� which means that long-term e�ects of teachers' expectation are smaller than short-term e�ects. According to table 1, this is what follows from the previously-describedmechanism for the �nal average probability di�erences between over- and underestimatedstudents at two evaluation points.In both cases, I assume that di�erences in subjective expected probabilities in educa-
tional success a�ect students' utility function as argued by Esser (1999) and thus alsoin�uence their actual transition decisions.
3 Operationalization
To the best of my knowledge, there exist no data that simultaneously collected bothconvincing measures of teachers' expectations at two di�erent time points as well astolerably accurate indicators for the SEU terms. Therefore, two di�erent data sets haveto be combined. The present paper will make use of the method of statistical matching(Rubin, 1986; D'Orazio et al., 2006) to create an arti�cial student cohort based on thestatistical twins from two distinct data sources.14 Before I elaborate on this method inmore detail, a short description of the data and indicators available so far appears to befruitful.
3.1 Data
The only data set known to me containing a measure of teachers' expectations in sec-ondary school as well as reliable SEU indicators is the Cologne High School Panel(CHiSP ; Gesis-No. ZA640). In the initial survey from 1969/70, N=3385 10th-gradeGymnasium students in North Rhine-Westphalia were asked about issues such as theirperformance, interests and plans in school and about their social origin and their rela-tionship to their parents. At about the same time, students' teachers (N=1701) andparents (N=2646) have also been surveyed.15
Taking this data set as a reference, we have to look for adequate primary-school datathat were surveyed before CHiSP and provide the required information. A promisingcandidate is a data set named �Elternhaus und Bildungschancen� (Parental H ome andEducational Opportunities, henceforth abbreviated as PHEO ; Gesis-No. ZA893). In1968, a population of N=1729 parents of 5th grade students from Baden-Wuerttembergwhose children passed from primary to secondary school were surveyed. An additional
14In the empirical section, I will carry out additional robustness analyses based on the British CohortStudy data. But since some of the indicators therein are measured less precisely, I still see need forperforming statistical matching of two �les with better measures.
15Three re-surveys of the former students in 1984/85 (N=1987) 1996/97 (N=1596) and 2010 (N=1301)added private backgrounds and occupational careers of the former students' until age 30, age 43,and age 56, respectively.
285
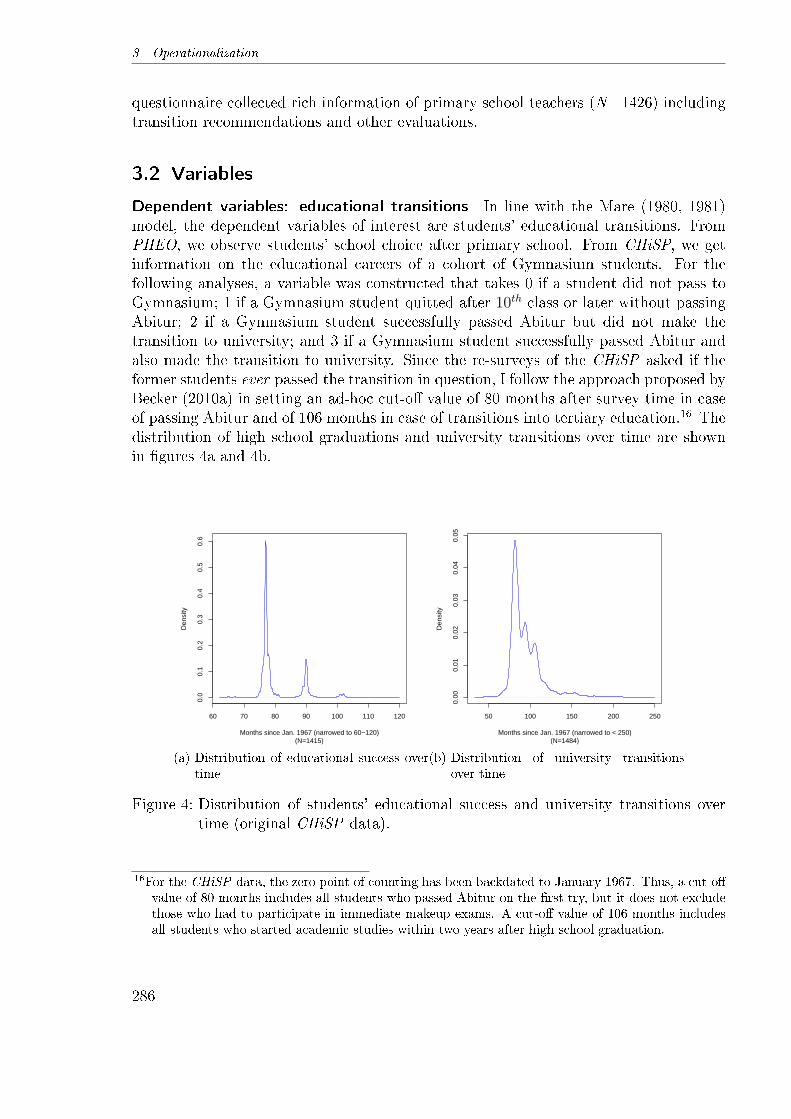
3 Operationalization
questionnaire collected rich information of primary school teachers (N=1426) includingtransition recommendations and other evaluations.
3.2 Variables
Dependent variables: educational transitions In line with the Mare (1980, 1981)model, the dependent variables of interest are students' educational transitions. FromPHEO, we observe students' school choice after primary school. From CHiSP, we getinformation on the educational careers of a cohort of Gymnasium students. For thefollowing analyses, a variable was constructed that takes 0 if a student did not pass toGymnasium; 1 if a Gymnasium student quitted after 10th class or later without passingAbitur; 2 if a Gymnasium student successfully passed Abitur but did not make thetransition to university; and 3 if a Gymnasium student successfully passed Abitur andalso made the transition to university. Since the re-surveys of the CHiSP asked if theformer students ever passed the transition in question, I follow the approach proposed byBecker (2010a) in setting an ad-hoc cut-o� value of 80 months after survey time in caseof passing Abitur and of 106 months in case of transitions into tertiary education.16 Thedistribution of high school graduations and university transitions over time are shownin �gures 4a and 4b.
60 70 80 90 100 110 120
0.0
0.1
0.2
0.3
0.4
0.5
0.6
(N=1415)Months since Jan. 1967 (narrowed to 60−120)
Den
sity
(a) Distribution of educational success overtime
50 100 150 200 250
0.00
0.01
0.02
0.03
0.04
0.05
(N=1484)Months since Jan. 1967 (narrowed to < 250)
Den
sity
(b) Distribution of university transitionsover time
Figure 4: Distribution of students' educational success and university transitions overtime (original CHiSP data).
16For the CHiSP data, the zero point of counting has been backdated to January 1967. Thus, a cut-o�value of 80 months includes all students who passed Abitur on the �rst try, but it does not excludethose who had to participate in immediate makeup exams. A cut-o� value of 106 months includesall students who started academic studies within two years after high school graduation.
286
V. Does the E�ect of Teachers' Expectations on Students' Educational Opportunities Decrease?
Independent variables The main independent variables of interest are primary schoolteachers' transition recommendations concerning their students' secondary school trackchoice (taken from PHEO), and secondary school teachers' 10th class assessments whomof their students they consider to be able to complete academic studies successfully(taken from CHiSP). In PHEO, teachers could give a recommendation for Hauptschule(the lowest German secondary school track), for Realschule (the mid-level track) and forGymnasium. I computed a new variable which was set to one if a teacher recommendedGymnasium and zero otherwise. In CHiSP, teachers could explicitly name studentswhom they considered to be able for academic studies, and of whom they considered tolack this prerequisite. I formed a new variable which was set to one if a student obtaineda positive evaluation, and zero if she obtained a negative one. Students without an ex-plicit evaluation were set to missing.17 Leaning on the work by Madon et al. (1997, 2006),Hinnant et al. (2009) and de Boer et al. (2010), the appropriate setup for naturalistic,i.e. survey data self-ful�lling prophecy studies is to construct a measure of perceivers'over- and underestimations to ensure that their expectations are actually inaccurate.While the CHiSP data provides a great deal of promising regressors for teachers' expec-tations, the PHEO data is, unfortunately, less rich. For instance, in contrast to CHiSP,PHEO did not measure students' intelligence, which makes it more di�cult to iden-tify inaccurate teacher expectations. Instead, we have to rely on parents' assessmentsof students' school performance and motivation. To measure primary school students'performance in PHEO, I took the average of parents' statements about their children'sgrades in arithmetic, spelling, and literature (the only available grade information inthat data). As a measure of their motivation, I controlled for parents' assessments ofwhether their children generally liked learning in school and of their children's estimatedTV consumption time.In CHiSP, we have more accurate measures of both students' school achievement
and their motivation � but to keep the degree of 'accuracy' of the resulting over- andunderestimations in both data sets comparable, I tried to use similar indicators alsoin CHiSP.18 Concerning students' achievement, I also computed the average19 of theirgrades in math and German classes; and with regard to their motivation, I controlledfor their reported homework e�ort as well as for their self-con�dence.To construct inaccurate over- and underestimations, teachers' expectations at both
time points were regressed on students' achievement20 and their motivation. The resid-uals of these models were then stored as a new variable in order to use them as apredictor of students' educational transitions in the subsequent analyses. In total, Icomputed three di�erent models that regressed teachers' expectations i) on performance
17For both a multinomial logistic regression and an ordinal structural equation model with teachers'evaluations as measured in CHiSP as an outcome that considers this 'missing' category, see Beckerand Birkelbach (2011).
18For an operationalization of teachers' over- and underestimations based on a more precise set ofstudents' achievement and motivation indicators taken from CHiSP data see Becker (2010a).
19If one of the grade variables was missing for a student, I computed the average of the remaining ones.20Since in the German school system, lower grade points refer to a higher achievement, I have inverted
the grades before computing the average.
287
3 Operationalization
indicators only; ii) on motivation indicators only; and iii) on both performance and mo-tivation indicators together. For each of these three models, a separate residual variablewas computed.21
Covariates According to my hypotheses, appropriate indicators of the SEU terms haveto be controlled for. Once again, the precision of measurement is higher in the CHiSPdata; hence, we should begin with a description of the respective variables therein interms of an 'ideal state of a�airs' to which the PHEO indicators have to measure up.In CHiSP, students' expected bene�t of eduction, B, was measured by the question
if Abitur would be necessary for students to reach their aim in life ( 1 'yes, necessary';2 'useful, but not necessary'; and 3 'not important'). I recoded this variable into 0 'notimportant'; 1 'useful, but not necessary'; and 2 'yes, necessary'. The value of statusdecline, −SD, can be operationalized as parents' disappointment if their child wouldnot pass Abitur (1 'not much'; 2 'little'; 3 'very disappointed'; 4 'would be the worst'). Icategorized this variable into 0 'very disappointed/would be the worst'; and 1 'little/notmuch'. Concerning the expected probability of status decline, psd, parents' should assessthe importance of good Abitur grades for their o�spring's occupational success (1 'little';2 'not that much'; 3 'big'; 4 'very big'). This indicator was dichotomized into 0 'little/notthat much' and 1 'big/very big'. The subjective probability of educational success, pep,was measured by parents' response if their child was able to complete Gymnasium (0'probably not/don't know'; 1 'probably/de�nitely'). The expected costs of education,C, can be operationalized by parents' answer if they had to make �nancial sacri�ces inorder to o�er higher education to their children (1 'no', 2 'little' and 3 'yes'). Once againI dichotomized the variable into 0 'no/little' and 1 'yes'.In the PHEO data, the situation is a bit more di�cult. A measure of the expected
bene�t of eduction, B, can be taken from several questions about the importance of thechosen school track and the aspired certi�cate for the intended occupational positionand/or potential academic studies (0 'low'; 1 'average'; 2 'high').22
Instead of using Becker's (2003) operationalization of the value of status decline −SDin terms of the di�erence between parental occupational prestige and the occupationanticipated for the o�spring � which I consider not to su�ce the prerequisite of measuringparental expectations in terms of subjective probabilities (Manski, 2004; also see Becker
21Tables A and B (appendix) show the estimates of the underlying logistic regressions.22A low expected bene�t was assigned to i) Hauptschule students whose parents had no idea about
the utility of a General Certi�cate of Secondary Education (Realschulabschluss) or Abitur at all;ii) Hauptschule students whose parents wanted their child to take a job for which manual skills aremost important; iii) Realschule students whose parents explicitly stated that Abitur would not beimportant for their o�spring's future job; and iv) Gymnasium students whose parents only strovefor a General Certi�cate of Secondary Education (Realschulabschluss). A high expected bene�twas assigned to i) Realschule students whose parents aspired to move up to Gymnasium later on(surveyed by two di�erent questions); ii) Gymnasium students whose parents said that Abitur isnecessary for the occupation aspired for their o�spring, or iii) in general improves her odds on the jobmarket. Unfortunately, from the PHEO data it is not possible to generate a high estimated bene�tfor parents of Hauptschule students. Thus, the coe�cient of B on the actual transition decisionsmay be slightly overestimated.
288
V. Does the E�ect of Teachers' Expectations on Students' Educational Opportunities Decrease?
and Hecken, 2007, 2009a,b) �, I use two variables which indicate parents' concern thatthe chosen school track might be valueless. Students of both Haupt- and Realschulewhose parents suspected that a General Certi�cate of Secondary Education might beuseless were assigned a high amount of concern (1), while all others were assigned a lowone (0). Similarly, Gymnasium students whose parents worried that Abitur might beuseful only in the case of subsequent academic studies were assigned a high amount ofconcern (1), while all others were assigned a low one (0).The expected impact of status decline, psd, can be measured more precisely, since
there are questions about the general importance of school for achieving something inlife in general and for occupational success in particular (0 'low'; 1 'high').23
The operationalization of the subjective expected probability of educational success,pep, is more problematic: While Becker (2010b) (and as far as I can see, this measurewas also applied in Becker, 2003) speci�ed to have used students' average grades inliterature, spelling, and math � these indicators have to be discarded for this purposein the present study since they have already been used for the identi�cation of over-and underestimations. Instead, I use a combination of parents' indication whether theirchild had di�culties in primary school (0 'none'; 1 'a bit'; 2 'pretty') and their certaintyabout their decision of sending their o�spring either to Realschule or Gymnasium. Forparents who sent their children to Hauptschule, I additionally draw on an a questionwhich asked whether this decision was due to low achievement of their o�spring in somesubjects.24
Fortunately, the expected costs of education C can be measured more straightfor-wardly: All parents were asked about the frequency of thoughts about getting along withtheir disposable money. Additionally, all parents of students who went to Hauptschulewere asked about the expected costs of upper secondary school tracks as well as aboutthe expected amount of these costs. Parents who said that they often worry if theyhad enough money until a month's end or how they should portion their money for theforthcoming week were assigned to experience high �nancial burdens (1), and zero oth-erwise. Furthermore, students of Hauptschule whose parents indicated that they wouldhave expected much higher costs of education at a higher school track were also assigneda value of one.According to Becker (2003), I additionally control for parental social class in terms of
their occupational prestige and for parental educational attainment in order to capturepotential social background e�ects on educational transitions that are not exhaustivelymodeled by the SEU indicators. In the CHiSP data, parental social class was measured
23I assume that the chosen indicators for psd capture more general attitudes towards the signi�cance ofschool for success in life, while the selected variables for −SD refer more to parental status concerns.
24I believe that this operationalization of pep in PHEO has two advantages: First, it ensures to usesubjective measures of students' expected success that are not at con�ict with the (more objective)indicators intended to be used for the identi�cation of over- and underestimations. Second, althoughparents were surveyed at the beginning of secondary school, the temporal scope of the given questionsaims at parents' expectations at primary school. Thus, potential di�culties in causality that couldarise if one used secondary-school expectations to explain transitions from primary to secondaryschool should be attenuated.
289
3 Operationalization
by the Treiman occupational prestige scores of the head of each household; and parentaleducational attainment was measured by 13 categories reaching from lower secondaryschool without an apprenticeship up to a university degree. For harmonization purposes,I recoded this variable into four categories (0 'no General Certi�cate of Secondary Ed-ucation'; 1 'General Certi�cate of Secondary Education but not more'; 2 'vocational orhigh school diploma'; 3 '�nished tertiary education').In the PHEO data, comparable scales of the head of household's occupation and
education were formed.25
3.3 Method: Statistical Matching
Since I do not dispose of a single data �le with convincing indicators for teachers' ex-pectations measured before two distinct transition points, I use the method of statisticalmatching of the above-sketched PHEO and CHiSP data in order to create an arti�-cial student cohort that su�ces this prerequisite. In this subsection, I �rst allude tothe Conditional Independence Assumption (CIA) as the crucial condition for performingstatistical matching, and I defend how my theoretical model suits this condition. Afterthat, I describe the matching algorithm that I used in practice.26
The Conditional Independence Assumption Let (X,Y,Z) be a random variablewith density f(x,y, z),x ∈ X ,y ∈ Y , z ∈ Z. Assume that A and B are two samplesconsisting of nA and nB independent and identically distributed observations generatedfrom f(x,y, z). Let the units in A have Z missing, and the units in B have Y missing.Then the Conditional Independence Assumption (CIA) would mean an independence ofY and Z given X.For ease of understanding, start with the conditional distribution of Y given X and
Z:
f(Y | X,Z) (14)
Then the CIA just postulates that
f(Y | X,Z) = f(Y | X) (15)
(cf D'Orazio et al., 2006, p. 13).By content, this means that the distribution of Y given X and Z equals the distribu-
tion of Y given only X if f(Y | X,Z) does not depend on Z. In that case, we can say
25While parental education as measured in PHEO could easily be harmonized to the variable that wascomputed in CHiSP, I had to assign Treiman scores (Ganzeboom and Treiman, 1996) to parents'answers about their �eld of occupation and their position therein by myself. Table C (appendix)lists the observed combinations of occupational situs and status in PHEO and with the assignedprestige scores.
26For all following formal issues concerning statistical matching see D'Orazio et al. (2006). Also cf.Rässler (2002).
290

V. Does the E�ect of Teachers' Expectations on Students' Educational Opportunities Decrease?
train strike
Martin late
Norman late
Figure 5: The Conditional Independence Assumption: An everyday-life example.
that Y is conditionally independent of Z given X. To provide a more illustrative exam-ple27, consider the following situation: Imagine that two men, Norman and Martin, areinhabitants of the same city but live in two distant districts. Furthermore, they choosedi�erent tra�c means to get to work (say Norman takes the train while Martin comesby car). Now X could denote the event �Norman comes late to work�, and Z couldrefer to �Martin comes late to work�. It might now appear that X and Z are completelyindependent from each other since the two actors are assumed to live on opposite sidesof the city and do not use the same tra�c means. However, there could be situationssuch as a train strike which accounts for both Norman coming late and also for heavytra�c volume on the streets leading also to Martin coming late (see �gure 5).A well-known problem is that the CIA can never be tested (let alone be proved).
Thus, a cautious application of the CIA on the given research question has to revealif the underlying theoretical model is in line with it.28 In our case, Y and Z wouldbe teachers' expectations in primary school and in 10th class, respectively, as well asstudents' actual transition decisions. X would be the vector of SEU predictors andadditional covariates. Do we �nd good reasons to defend the assumption that teachers'expectations at several points in time and students' transition decisions at several pointsin time do not in�uence each other, respectively, once the vector of SEU predictors isknown? I hold the view that we do:First, the crucial assumption of the SEU model (Esser, 1999) is that students' transi-
tion decisions can be explained by the vector of SEU predictors in the respective data set.
27I found this example on http://www.eecs.qmul.ac.uk/~norman/BBNs/Independence_and_
conditional_independence.htm.28Although the CIA is not less crucial for the application of propensity score matching when analyzing
so-called treatment e�ects, it is often merely presupposed rather than justi�ed on solid theoreticalconsiderations (for instance in Caliendo and Kopeinig, 2008, p. 32).
291
3 Operationalization
That is, once we have controlled for parental utility considerations, two given educationaltransitions should be independent from each other according to theory.Second, following the theoretical model outlined by Becker (2010a), and according
to the above extension onto multiple evaluations that are separated from each otherby a student's educational transition, a teacher's evaluation at t1 should a�ect anotherteacher's evaluation at t2 only via its impact on a student's subsequent subjective ex-pected probability of successfully completing the chosen school track. The latter pa-rameter is supposed to be a function of the student's preceding subjective expectedprobability of educational success, her actual academic performance, and an unspeci�edteacher treatment e�ect capturing classroom praise, bilateral encouragement, and soforth (Becker, 2010a, p. 10). Once we control for a suitable indicator of pep at both timepoints, intercorrelations between both teacher expectancy indicators should be substan-tively reduced.29 This is why I would defend the assumption that for the given researchquestion, the CIA should hold.30
Matching algorithms Basically, statisticians distinguish between parametric and non-parametric matching algorithms. Regarding parametric approaches, the most commonone is conditional mean matching � though only working for normally distributed contin-uous variables. The idea of conditional mean matching is the prediction of two regressionequations:
zAa = αZ + βZXxAa (16)
yBb = αY + βyXxBb (17)
Then each missing item in A is substituted with its expected value given the observedvariables in B � and vice versa. For instance, assume that in �le A, we observe respon-dents' education and their income, and in �le B respondents' education and their workexperience measured in years. Then we would regress work experience on education, andwe would plug in the estimated mean value for a given value of education as obtainedfrom B for all respondents with the same value of education in �le A. However, as Littleand Rubin (2002) note, this approach su�ers from two serious drawbacks: First, some ofthe values of zAa and yBb may never be observed; and second, the variance estimators arenot consistent. Therefore, I will directly turn to the explanation of the non-parametricapproaches.
29Note that statistical matching researchers consider moderate relations between Y and Z, given X
not as being consequential for statistical matching purposes (see e.g. Ingram et al., 2000, p. 5).30Admittedly, in the present case, the validity of the CIA strongly hinges on the question if the SEU
predictors in both data sets are reliable matching indicators. The demonstration of some measure-ment di�erences in both data sets might have led some readers to the conclusion that they arenot. However, note that one elementary intention of the SEU model is to unveil the social mecha-nism providing an understanding explanation of how di�erences in educational transitions by socialstrata arise (Esser, 1999, p. 263). In other words, if the measurement of some SEU indicators in thePHEO data were too imprecise to predict students' transition decisions, then the predictive powerof both parental education and their occupational prestige would disproportionally increase. Thus,by matching on the latter indicators, the CIA could still be maintained. Also see footnote 29.
292

V. Does the E�ect of Teachers' Expectations on Students' Educational Opportunities Decrease?
Non-parametric matching approaches usually rely on some kind of hot deck method. Inrandom hot deck matching, the idea is to randomly choose a donor record for each recordin the recipient �le after having grouped both �les into homogeneous subsets (donationclasses). For example, records in �les A and B could �rst be grouped according torespondents' gender in order to ensure that women are always assigned to women, andmen to men, after which they could be randomly matched.Rank hot deck matching presumes that the units in both �les are ranked separately
according to the values of an ordinal matching variable (e.g. age categories). Then theyoungest respondent of �le B is assigned to the youngest respondent in �le A, the secondyoungest observation in �le B to the second youngest observation in �le A, and so on.And �nally, the distance hot deck method matches each record in the recipient �le with
the closest record in the donor �le according to a distance measure based on matchingvariables X. The basic decision rule is that
dab = |xaa − xBb | = min|xAa − xBb |; (18)
that is, each observation in �le B is matched to her closest mate in �le A accordingto the chosen set of matching variables and a prede�ned distance function. Dependingon the measurement level of the matching variables, the concrete distance function willbe one of the corresponding measures such as the Euclidean metric, the Mahalanobisdistance, the Gower dissimilarity coe�cient, etc.Another important distinction in this respect is the di�erence between constrained
and unconstrained matching which touches the question whether a donor record shallbe used more than once. Similar to an urn problem as it is well-known in elementarycombinatorics, when performing statistical matching, each observation could either 'dropout' after it has been used once, or it can go back into the pool of records.Furthermore, if the number of matching variables is large, additional donation classes
can be prede�ned to decrease computational e�ort. That means that also when hotdeck distance matching gets the researcher's vote, she can prede�ne '�xed' classes suchas respondents' gender or their education wherein distances between all observations ofthe two �les are minimized separately.
Data harmonization and matching variables For the following analyses, PHEO andCHiSP shall be matched using an unconstrained distance hot deck technique with dona-tion classes. Distance hot deck matching is an approach that is superior to parametricmethods for the reason that
�(1) imputations tend to be realistic since they are based on values observedelsewhere; (2) imputations will not be outside the range of possible values;and (3) it is not necessary to de�ne an explicit model for the distribution ofthe missing values� (Siddique and Belin, 2008, p. 84).
As D'Orazio et al. (2006) note, several issues have to be considered when preparingdata in order to perform statistical matching. In particular, the two data sources can bebiased or inconsistent (also see van der Laan, 2000). Sources are biased if their samples
293
3 Operationalization
are characterized by di�erent reference periods or drawn from di�erent populations. Inour case, the given research question demands that the data refer to di�erent periodssince the aim is to construct an arti�cial student cohort. However, the reader mayhave noted that the respective survey times do not exactly correspond to the requestedyears. An additional problem arises with respect to the two samples' population: WhilePHEO consists of primary school parents in Baden-Wuerttemberg, CHiSP is composedof secondary school parents in North Rhine-Westphalia. Institutional factors in thetwo German Federal Lands may lead to di�culties in comparability, thus the followinganalyses have to be interpreted cautiously.The issue of inconsistency refers to the harmonization of matching variables. As
mentioned before, at least for some variables, measurement di�erences between the twosources are undeniable. Therefore, it has to be resolved if this does not result in loss inpredictive power.As D'Orazio et al. (2006) suggest, it has to be clari�ed that the matching variables X
are associated with the variables of interest, Y and Z. In case of categorical outcomes,this can be accomplished by means of a classi�cation tree (Breiman et al., 1984). Theidea of a classi�cation tree � and of its metric counterpart, the regression tree � is toexplain the variation in the response variable by repeatedly splitting the data into morehomogeneous subgroups. A deviance measure based on χ2 statistics is used to �nd thesplit that maximizes the dissimilarity among the resulting subjects (also see Hansenet al., 1996; De'ath and Fabricius, 2000). In contrast to conventional discriminant anal-ysis, classi�cation and regression trees do not follow a simultaneous partitioning logicbut pursue a hierarchical approach, wherein each subgroup � graphically representedby a tree node � will be split up according to a distinct criterion (for a review of moreelaborate classi�cation techniques see Prasad et al., 2006).Figures 6 shows the categorization trees for students educational transitions.31 We can
see that in case of the decision for or against the transition to Gymnasium, the expectedbene�t of education B is the most dominant predictor, while the value of status decline−SD comes second, followed by highest parental educational degree and the subjectiveexpected probability of successfully completing the chosen school track, pep.32
Contrarily, in the case of passing Abitur, pep is most prevalent while B comes second.Hence, as a preliminary result we can note that at a later educational transition i) lesspredictors su�ce to explain its variance (which corresponds to the waning coe�cientspattern); ii) subjective probability expectations are more important than considerationsof educational bene�t or status decline; and iii) the impact of parental social backgroundsdissipates (at least in a categorization tree model). However, since all of the selectedindicators in the classi�cation tree of the PHEO data are still bivariately associatedwith passing Abitur in the underlying χ2 tests (not shown, available upon request), I
31I used the tree package in R (Ripley, 2010) for both computation and graphical display of thecategorization tree. The minimum number of observations to be included in either child node wasset to 5 (which is also the default for the tree package).
32As mentioned before, the explanatory power of parental education in PHEO could be a hint thatsome of its SEU indicators might su�er from a loss in precision due to measurement di�culties.Therefore, it appears fruitful to ground the matching procedure also on parental education.
294
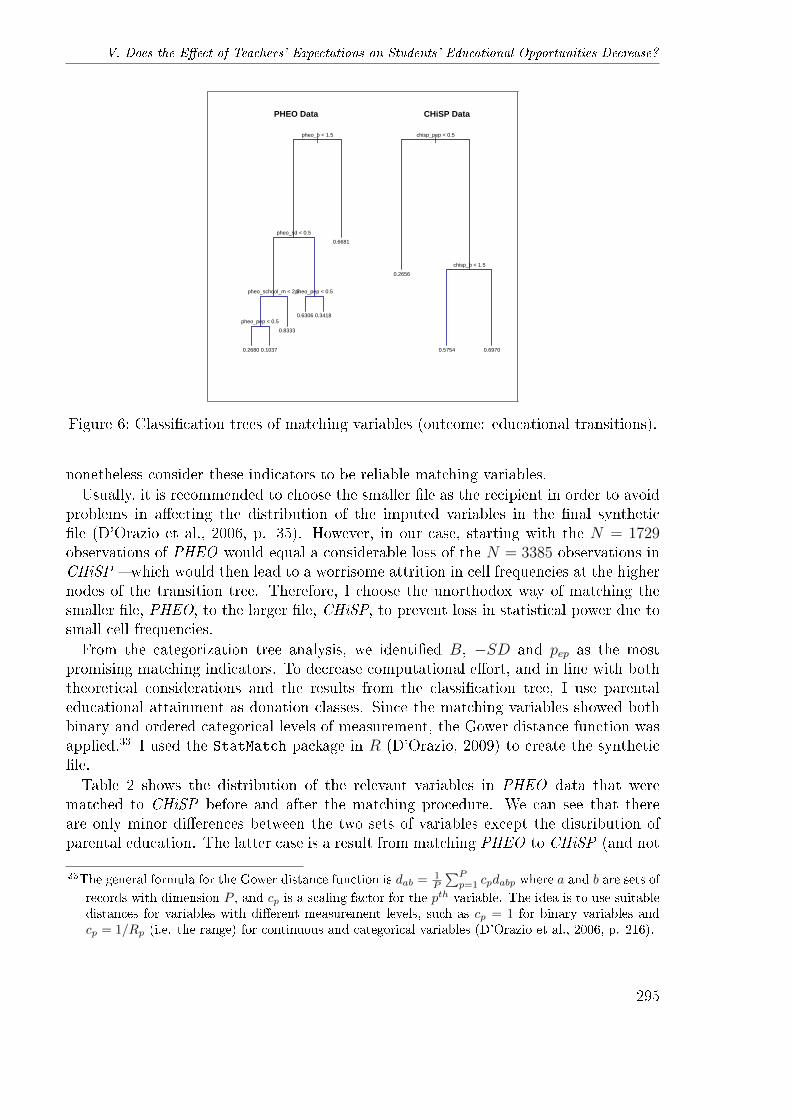
V. Does the E�ect of Teachers' Expectations on Students' Educational Opportunities Decrease?
|pheo_b < 1.5
pheo_sd < 0.5
pheo_school_m < 2.5
pheo_pep < 0.5
pheo_pep < 0.5
0.2680 0.1037
0.8333
0.6306 0.3418
0.6681
PHEO Data
|chisp_pep < 0.5
chisp_b < 1.5
0.2656
0.5754 0.6970
CHiSP Data
Figure 6: Classi�cation trees of matching variables (outcome: educational transitions).
nonetheless consider these indicators to be reliable matching variables.Usually, it is recommended to choose the smaller �le as the recipient in order to avoid
problems in a�ecting the distribution of the imputed variables in the �nal synthetic�le (D'Orazio et al., 2006, p. 35). However, in our case, starting with the N = 1729observations of PHEO would equal a considerable loss of the N = 3385 observations inCHiSP � which would then lead to a worrisome attrition in cell frequencies at the highernodes of the transition tree. Therefore, I choose the unorthodox way of matching thesmaller �le, PHEO, to the larger �le, CHiSP, to prevent loss in statistical power due tosmall cell frequencies.From the categorization tree analysis, we identi�ed B, −SD and pep as the most
promising matching indicators. To decrease computational e�ort, and in line with boththeoretical considerations and the results from the classi�cation tree, I use parentaleducational attainment as donation classes. Since the matching variables showed bothbinary and ordered categorical levels of measurement, the Gower distance function wasapplied.33 I used the StatMatch package in R (D'Orazio, 2009) to create the synthetic�le.Table 2 shows the distribution of the relevant variables in PHEO data that were
matched to CHiSP before and after the matching procedure. We can see that thereare only minor di�erences between the two sets of variables except the distribution ofparental education. The latter case is a result from matching PHEO to CHiSP (and not
33The general formula for the Gower distance function is dab =1P
∑Pp=1 cpdabp where a and b are sets of
records with dimension P , and cp is a scaling factor for the pth variable. The idea is to use suitabledistances for variables with di�erent measurement levels, such as cp = 1 for binary variables andcp = 1/Rp (i.e. the range) for continuous and categorical variables (D'Orazio et al., 2006, p. 216).
295

3 Operationalization
the other way round) since CHiSP � surveyed in the highest German secondary schooltrack � is more selective in parental composition than PHEO. But since the crucial SEUindicators are quite comparable between the two �les, this allows the conclusion thatthe matching procedure led to reasonably consistent results.34
3.4 Models: Sequential Logit Analyses With Unobserved
Heterogeneity
As a �rst step, I apply conventional logistic regression analysis to estimate the log-odds of primary school children to move on to Gymnasium. For this step, all variablesstem from PHEO. As a second step, I use sequential logit modeling (Buis, 2007, 2010,2011) to estimate the conditional log-odds of passing Abitur and university transitions,respectively. These �rst two steps cannot be uni�ed to a comprehensive sequential logitmodel since in the �rst case, I need explanatory variables from primary school, and inthe second case, secondary-school predictors are required.Yet, to test H2b, in a third step I analyze changes of primary-school predictors over
all subsequent educational transitions. Here, I can thoroughly analyze a comprehensivesequential transition model starting with the transition from primary to secondary schooland ending with the transition to university.The implied process of this arti�cial but comprehensive transition model is illustrated
graphically in �gure 7 (also see Buis, 2011, p. 3). Note that each capital letter does notdenote an educational transition but relates to a particular educational outcome.
A,B,C,D
B,C,D
CDD
C1− p3
p3
B1− p2
p2
A1− p1
p1
Figure 7: Educational transition process.
34A comparison of the regression coe�cients for secondary school choice as a binary outcome betweenthe variables of the original PHEO data and those that were matched to CHiSP will give furtherinsight in the reliability of the synthetic �le. A complete list of summary statistics for all independentvariables in the synthetic �le is given in table D (appendix).
296

V.Does
theE�ect
ofTeachers'
Expecta
tionsonStudents'
Educatio
nalOpportu
nities
Decrea
se?
Table 2: Descriptive results of donor data (PHEO) variables
count mean sd min maxB 1729 1.05 0.51 0.00 2.00-SD 1721 0.21 0.41 0.00 1.00p(sd) 1652 0.32 0.47 0.00 1.00C 1708 0.50 0.50 0.00 1.00p(ep) 1723 0.29 0.45 0.00 1.00par. occ. pres. 1650 45.31 12.68 18.00 72.00par. occ. pres. (dichot.) 1729 0.63 0.48 0.00 1.00par. educ. 1622 0.31 0.74 0.00 3.00transition recommendation 1737 0.37 0.48 0.00 1.00residual (perf.) 1549 0.00 0.44 -0.86 1.12residual (mot.) 1453 0.00 0.48 -0.48 0.83residual (full) 1393 -0.00 0.44 -0.86 1.13residual (perf, dichot). 1549 0.45 0.50 0.00 1.00residual (mot., dichot.) 1453 0.38 0.48 0.00 1.00residual (full, dichot.) 1393 0.44 0.50 0.00 1.00
(a) Before matching.
count mean sd min maxB 3374 1.13 0.52 0.00 2.00-SD 3358 0.24 0.43 0.00 1.00p(sd) 3244 0.32 0.46 0.00 1.00C 3339 0.48 0.50 0.00 1.00p(ep) 3367 0.26 0.44 0.00 1.00par. occ. pres. 3213 49.34 14.12 18.00 72.00par. occ. pres. (dichot.) 3374 0.70 0.46 0.00 1.00par. educ. 3374 1.14 1.23 0.00 3.00transition recommendation 3133 0.49 0.50 0.00 1.00residual (perf.) 3001 0.09 0.43 -0.86 1.12residual (mot.) 2748 0.10 0.49 -0.48 0.83residual (full) 2634 0.07 0.43 -0.86 1.13residual (perf, dichot.) 3001 0.56 0.50 0.00 1.00residual (mot., dichot.) 2748 0.47 0.50 0.00 1.00residual (full, dichot.) 2634 0.54 0.50 0.00 1.00
(b) After matching.
297

4 Results
Assume that A refers to the outcome of not making the transition from primary schoolto Gymnasium, B to making the transition to Gymnasium without passing Abitur on the�rst try, C to passing Abitur on the �rst try without starting academic studies after 106months, and D to starting academic studies after 106 months after having successfullypassed Abitur on the �rst try. The important assumption of the sequential logit modelis that the probability of each educational outcome is evaluated against the probabilityof all other possible educational outcomes, conditional on preceding transitions. Forexample, the probability of passing Abitur on the �rst try, p2 (with the possible optionof a subsequent university transition within 106 months after high school graduation),is evaluated against the probability of not passing Abitur on the �rst try, 1− p2. But ofcourse, it is taken into account that this step is conditional on having made the transitionfrom primary school to Gymnasium.Regarding modeling strategy, I �rst introduce the SEU predictors (Esser, 1999) in
their additive interpretation and then subsequently add each residual term (from theperformance model, the motivation model, and the full model, respectively) separately.I present the SEU terms in their additive interpretation since it might be of interest toassess the temporal stability of each single indicator � which would not be possible inthe constructed terms for what Esser (1999) calls educational motivation and investmentrisk. As Becker (2010a) observed, results for the self-ful�lling prophecy residual termsobtained from the full CHiSP sample are stable for both the additive and the multi-plicative reading of the SEU model. The same holds for analyses based on the synthetic�le (not shown, available upon request).Hence, for the arti�cial student cohort, the following models will be estimated (also
see Buis, 2011, p. 3):
p1 = Pr(y1 = 1|SEU,SFPi ,SES) =exp(β01 + β11SEU+ β21SFPi + β31SES)
1 + exp(β01 + β11SEU+ β21SFPi + β31SES)(19)
p2 = Pr(y2 = 1|SEU,SFPi ,SES, y1 = 1) =exp(β02 + β12SEU+ β22SFPi + β32SES)
1 + exp(β02 + β12SEU+ β22SFPi + β32SES)(20)
p3 = Pr(y3 = 1|SEU,SFPi ,SES, y2 = 1) =exp(β03 + β13SEU+ β23SFPi + β33SES)
1 + exp(β03 + β13SEU+ β23SFPi + β33SES)(21)
� where SEU refers to the vector of SEU parameters, SFPi to the three self-ful�llingprophecy residuals (introduced separately), and SES to controls for parental educationand their occupational prestige. The conditions y1 = 1 in (20) and y2 = 1 in (21) statethat the respective equation is estimated only for the students �at risk�, i.e. those whomade the preceding educational transition.
4 Results
After showing the univariate distribution of students' educational transitions in thesynthetic �le, I present the log-odds of the sequential logit models, and I also display therespective predicted probabilities. The analysis section ends with a robustness analysisof the current results.
298
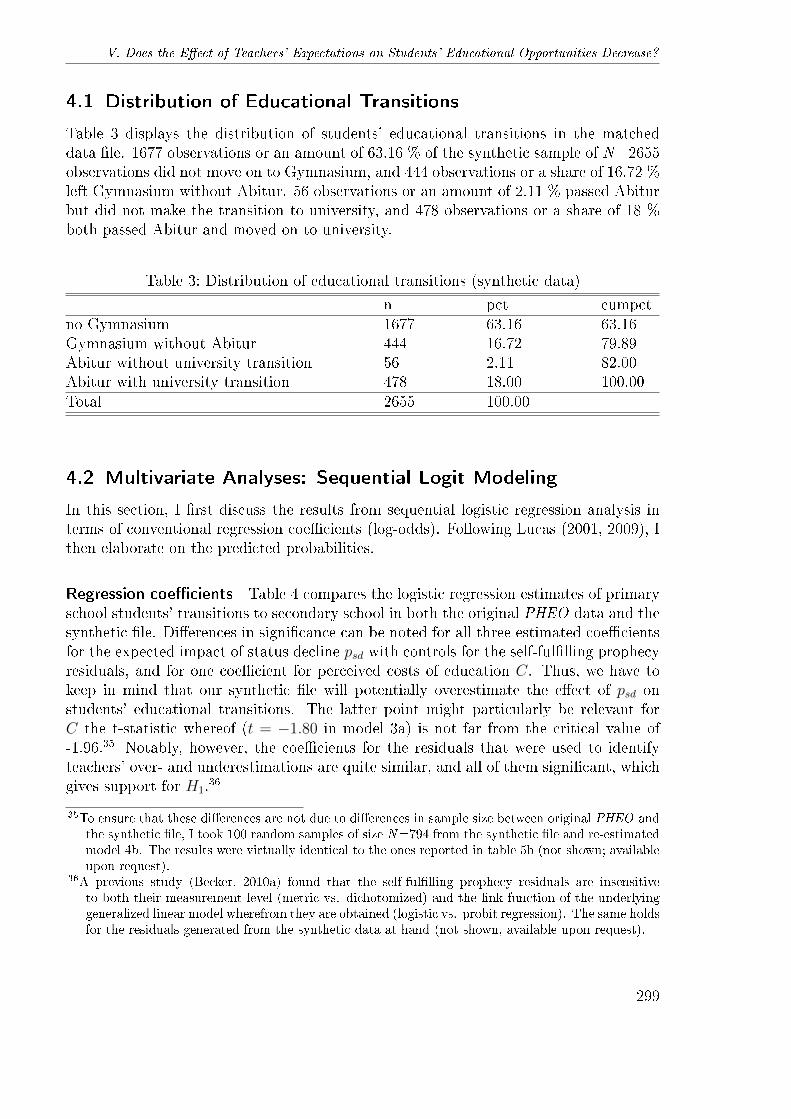
V. Does the E�ect of Teachers' Expectations on Students' Educational Opportunities Decrease?
4.1 Distribution of Educational Transitions
Table 3 displays the distribution of students' educational transitions in the matcheddata �le. 1677 observations or an amount of 63.16 % of the synthetic sample of N=2655observations did not move on to Gymnasium, and 444 observations or a share of 16.72 %left Gymnasium without Abitur. 56 observations or an amount of 2.11 % passed Abiturbut did not make the transition to university, and 478 observations or a share of 18 %both passed Abitur and moved on to university.
Table 3: Distribution of educational transitions (synthetic data)
n pct cumpctno Gymnasium 1677 63.16 63.16Gymnasium without Abitur 444 16.72 79.89Abitur without university transition 56 2.11 82.00Abitur with university transition 478 18.00 100.00Total 2655 100.00
4.2 Multivariate Analyses: Sequential Logit Modeling
In this section, I �rst discuss the results from sequential logistic regression analysis interms of conventional regression coe�cients (log-odds). Following Lucas (2001, 2009), Ithen elaborate on the predicted probabilities.
Regression coe�cients Table 4 compares the logistic regression estimates of primaryschool students' transitions to secondary school in both the original PHEO data and thesynthetic �le. Di�erences in signi�cance can be noted for all three estimated coe�cientsfor the expected impact of status decline psd with controls for the self-ful�lling prophecyresiduals, and for one coe�cient for perceived costs of education C. Thus, we have tokeep in mind that our synthetic �le will potentially overestimate the e�ect of psd onstudents' educational transitions. The latter point might particularly be relevant forC the t-statistic whereof (t = −1.80 in model 3a) is not far from the critical value of-1.96.35 Notably, however, the coe�cients for the residuals that were used to identifyteachers' over- and underestimations are quite similar, and all of them signi�cant, whichgives support for H1.36
35To ensure that these di�erences are not due to di�erences in sample size between original PHEO andthe synthetic �le, I took 100 random samples of size N=794 from the synthetic �le and re-estimatedmodel 4b. The results were virtually identical to the ones reported in table 5b (not shown; availableupon request).
36A previous study (Becker, 2010a) found that the self-ful�lling prophecy residuals are insensitiveto both their measurement level (metric vs. dichotomized) and the link function of the underlyinggeneralized linear model wherefrom they are obtained (logistic vs. probit regression). The same holdsfor the residuals generated from the synthetic data at hand (not shown, available upon request).
299
4 Results
Table 5 presents the results of a sequential logit model of students' educational tran-sitions. Models 5a to 8a refer to students' probability of passing Abitur, and models 9ato 12a to students' university transitions. In model 5a, only the SEU predictors wentinto the equation. We can see that students' expected educational bene�t B and theirsubjective expected probability of successfully completing Gymnasium pep are positivelyassociated with their probability of passing Abitur. These results dissipate in models6a and 7a when the residuals from the performance model and the motivation modelare introduced, respectively. From both models we can learn that the more a teacheroverestimates her student compared to her actual performance or motivation, the higherthe probability that she successfully passes Abitur. This result still holds when teachers'evaluations are regarded net of both students' performance and their motivation alto-gether (model 8a). The only di�erences we encounter compared to the two precedingmodels are that i) both e�ect size and z-value are a bit lower, and ii) students' sub-jective expected probability of successfully completing Gymnasium pep still signi�cantlypredicts their probability of passing Abitur. Thus, the results from these models stillprovide support for H1.Turning to models 9a to 12a that list the estimates for the prediction of students'
university transitions, we do not �nd any parameter that would be signi�cantly associ-ated with that outcome. Hence, the tentative conclusion up to now would be that boththe impact of the SEU predictors and the e�ect of self-ful�lling prophecies decrease overeducational transitions.In models 5b-8b (table 6), students' expected costs C is the only primary school SEU
indicator that signi�cantly predicts students' probability of passing Abitur (which onlyholds if the self-ful�lling prophecy residuals are part of the equation). However, wedo not �nd any signi�cant e�ect of either one of the self-ful�lling prophecy residualsthat capture teachers' primary school over- and underestimations � which is in line withhypothesis H2a.Likewise, in models 9b-10b, neither one of the SEU predictors nor the self-ful�lling
prophecy residuals are signi�cantly associated with students' propensities of universitytransitions. This result would give support to hypothesis H2b, but note that we stillhave to compare the predicted probabilities before drawing �nal conclusions.37
37For all self-ful�lling prophecy residuals and all except two SEU terms, the results of tables 5a - 6 arerobust against controls for both parental education and occupational prestige (see Appendix, tablesFa - G).
300

V.Does
theE�ect
ofTeachers'
Expecta
tionsonStudents'
Educatio
nalOpportu
nities
Decrea
se?
Table 4: Logit model of secondary school transitions
Model 1a Model 2a Model 3a Model 4a
log-odds/z
log-odds/z
log-odds/z
log-odds/z
B 2.43*** 2.32*** 2.02*** 2.37***(10.70) (8.48) (6.13) (8.13)
-SD 1.37*** 1.48*** 1.40*** 1.52***(6.93) (5.89) (4.65) (5.61)
p(sd) 0.02 0.07 -0.18 -0.02(0.13) (0.33) (-0.68) (-0.11)
C -0.49** -0.53** -0.45 -0.50*(-3.14) (-2.66) (-1.80) (-2.33)
p(ep) -1.58*** -1.40*** -0.98*** -1.57***(-9.21) (-6.59) (-3.74) (-6.85)
residuals (perfor-mance model)
2.67***
(12.90)residuals (moti-vation model)
4.09***
(14.63)residuals (fullmodel)
2.68***
(12.10)Nagelkerke's R2 0.41 0.60 0.74 0.61N 995 889 830 794
All coe�cients are unstandardized log-odds. Z-values in parenthe-ses. Signi�cance values: * (p <.05); ** (p <.01); *** (p <.001).Variables: B: expected bene�t; −SD: expected status decline;psd: expected impact of status decline; C: expected costs; pep:subjective expected probability of educational success.
(a) Original PHEO data.
Model 1b Model 2b Model 3b Model 4b
log-odds/z
log-odds/z
log-odds/z
log-odds/z
B 1.55*** 1.40*** 1.28*** 1.32***(16.79) (12.00) (9.64) (10.77)
-SD 1.61*** 1.51*** 1.42*** 1.51***(15.34) (10.79) (9.04) (10.06)
p(sd) -0.01 -0.24* -0.65*** -0.32**(-0.08) (-2.07) (-4.81) (-2.66)
C -0.47*** -0.61*** -0.52*** -0.65***(-5.83) (-5.67) (-4.25) (-5.65)
p(ep) -1.17*** -0.95*** -0.36* -1.02***(-12.02) (-7.58) (-2.51) (-7.64)
residuals (perfor-mance model)
3.10***
(27.42)residuals (moti-vation model)
3.77***
(28.08)residuals (fullmodel)
3.06***
(25.72)Nagelkerke's R2 0.31 0.60 0.67 0.59N 3206 2866 2621 2512
All coe�cients are unstandardized log-odds. Z-values in parenthe-ses. Signi�cance values: * (p <.05); ** (p <.01); *** (p <.001).Variables: B: expected bene�t; −SD: expected status decline;psd: expected impact of status decline; C: expected costs; pep:subjective expected probability of educational success.
(b) Synthetic �le.301
4 Results
Predicted probabilities Following the proposition made by Lucas (2001, 2009), forthe analysis of transition rate changes, predicted probabilities rather than regressioncoe�cients should be compared. Figure 8 plots the predicted probabilities for students'educational transitions conditional on their teachers' residualized expectations (with therespective SEU indicators held constant at their mean). The solid lines show students'predicted transition probabilities conditional on their primary school teachers' transi-tion recommendations, the dashed lines show students' predicted transition probabilitiesconditional on their secondary school teachers' evaluations. Apparently, di�erences intransition probabilities between students with primary school over- and underestima-tions, respectively, become smaller from transition 1 (+/- Gymnasium) to transition 2(+/- Abitur). Likewise, di�erences between students with secondary school over- andunderestimations, respectively, become smaller from transition 2 to transition 3 (+/-university transition). Both results provide support for hypothesis H2a.What does not suit this general trend is the �nding that di�erences between students
who had been over- and underestimated by their primary school teachers, respectively,seem to become larger again from transition 2 to transition 3; and that students whohad been underestimated by their primary school teachers have a higher predicted uni-versity transition probability on average than those who had been overestimated bytheir primary school teachers. Yet, we have to keep in mind that the underlying logitcoe�cients are not signi�cant � so this would still be weak evidence to reject both H1
and H2b in this respect.On the other hand, the predicted university transition probabilities of students who
had been overestimated at secondary school are still higher than the predicted proba-bilities of students who had been overestimated at primary school. This is well in linewith hypothesis H2b.
4.3 Robustness Analysis
In order to get an approximate intuition about the reliability of the results gained fromstatistical matching, I intend to perform a couple of robustness analyses. The latter coveri) a test for unobserved heterogeneity in terms of a potentially confounding variable;ii) additional secondary-school controls for the analysis of long-term primary schoolexpectancy e�ects; and iii) a comparison of the empirical patterns in the synthetic �lewith results from a 'real' panel study with all required indicators in the same �le (thoughless perfectly measured).
Are results robust against unobserved heterogeneity? First, I want to keep a checkon the robustness of the results against an unobserved but potentially confounding vari-able u. Following Buis (2010, 2011), this kind of unobserved heterogeneity can be sim-ulated by introducing a weighted sum of random variables νk = βuku � while k denotesseveral educational transition points � which is approximated by a normal distribution.The researcher can now simulate di�erent values for both the standard deviation sd(ν)of this random variable and its correlation ρ with the predictor of interest. I used theseqlogit package (Buis, 2007) in Stata to simulate a scenario of sd(ν) = 0 (the case
302
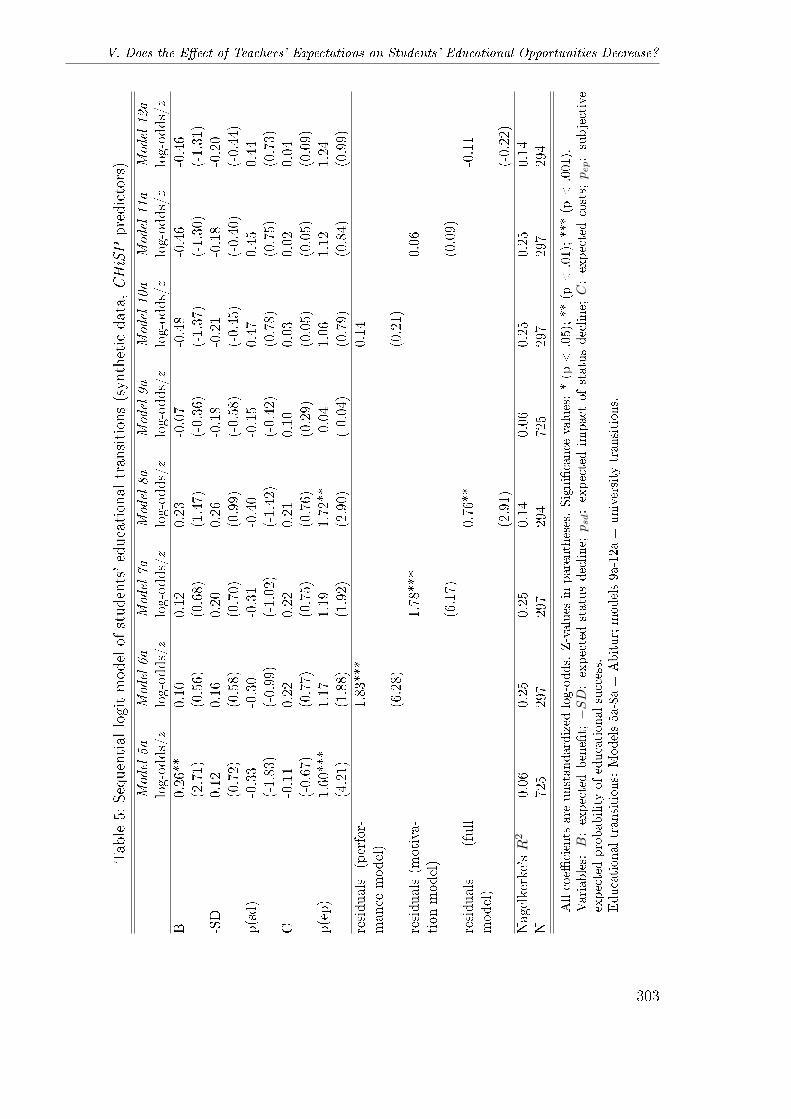
V. Does the E�ect of Teachers' Expectations on Students' Educational Opportunities Decrease?
Table5:Sequentiallogitmodelof
students'educationaltransitions(syntheticdata,CHiSPpredictors)
Model5a
Model6a
Model7a
Model8a
Model9a
Model10a
Model11a
Model12a
log-odds/z
log-odds/z
log-odds/z
log-odds/z
log-odds/z
log-odds/z
log-odds/z
log-odds/z
B0.26
**0.10
0.12
0.23
-0.07
-0.48
-0.46
-0.46
(2.71)
(0.56)
(0.68)
(1.47)
(-0.36
)(-1.37
)(-1.30
)(-1.31
)-SD
0.12
0.16
0.20
0.26
-0.18
-0.21
-0.18
-0.20
(0.72)
(0.58)
(0.70)
(0.99)
(-0.58
)(-0.45
)(-0.40
)(-0.44
)p(sd)
-0.33
-0.30
-0.31
-0.40
-0.15
0.47
0.45
0.44
(-1.83
)(-0.99
)(-1.02
)(-1.42
)(-0.42
)(0.78)
(0.75)
(0.73)
C-0.11
0.22
0.22
0.21
0.10
0.03
0.02
0.04
(-0.67
)(0.77)
(0.75)
(0.76)
(0.29)
(0.05)
(0.05)
(0.09)
p(ep)
1.60
***
1.17
1.19
1.72
**-0.04
1.06
1.12
1.24
(4.21)
(1.88)
(1.92)
(2.90)
(-0.04
)(0.79)
(0.84)
(0.99)
residuals
(perfor-
man
cemodel)
1.83
***
0.14
(6.28)
(0.21)
residuals(m
otiva-
tion
model)
1.78
***
0.06
(6.17)
(0.09)
residuals
(full
model)
0.76
**-0.11
(2.91)
(-0.22
)
Nag
elkerke'sR
20.06
0.25
0.25
0.14
0.06
0.25
0.25
0.14
N72
529
729
729
472
529
729
729
4
Allcoe�
cients
are
unstandardized
log-odds.
Z-values
inparentheses.Signi�cance
values:*(p
<.05);**(p
<.01);***(p
<.001).
Variables:B:expectedbene�t;−SD:expectedstatusdecline;psd:expectedim
pact
ofstatusdecline;C:expectedcosts;pep:subjective
expectedprobabilityofeducationalsuccess.
Educationaltransitions:
Models5a-8a=
Abitur;models9a-12a=
university
transitions.
303
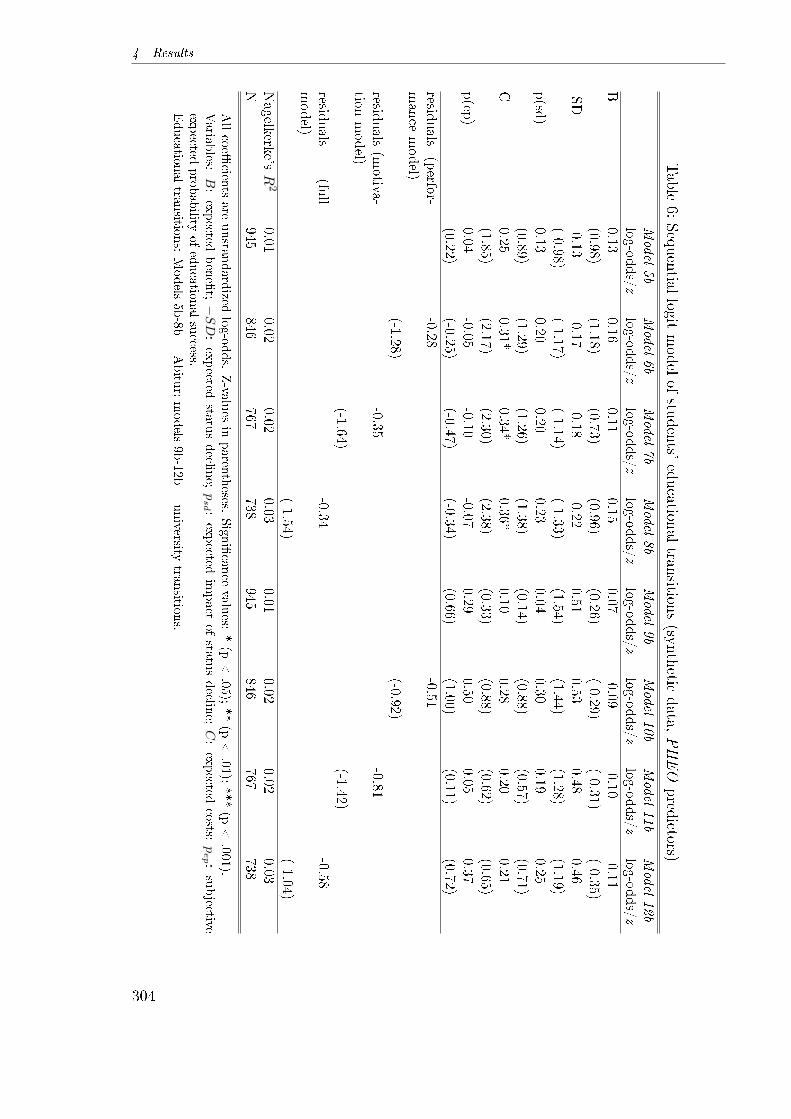
4 Results
Table
6:Sequential
logitmodel
ofstudents'
educationaltransitions
(syntheticdata,
PHEO
predictors)
Model5b
Model6b
Model7b
Model8b
Model9b
Model10b
Model11b
Model12b
log-odds/z
log-odds/z
log-odds/z
log-odds/z
log-odds/z
log-odds/z
log-odds/z
log-odds/z
B0.13
0.160.11
0.150.07
-0.09-0.10
-0.11(0.98)
(1.18)(0.73)
(0.96)(0.26)
(-0.29)(-0.31)
(-0.35)-SD
-0.13-0.17
-0.18-0.22
0.510.53
0.480.46
(-0.98)(-1.17)
(-1.14)(-1.33)
(1.54)(1.44)
(1.28)(1.19)
p(sd
)0.13
0.200.20
0.230.04
0.300.19
0.25(0.89)
(1.29)(1.26)
(1.38)(0.14)
(0.88)(0.57)
(0.71)C
0.250.31*
0.34*0.36*
0.100.28
0.200.21
(1.85)(2.17)
(2.30)(2.38)
(0.33)(0.88)
(0.62)(0.65)
p(ep
)0.04
-0.05-0.10
-0.070.29
0.500.05
0.37(0.22)
(-0.25)(-0.47)
(-0.34)(0.66)
(1.00)(0.11)
(0.72)
residuals
(perfor-
man
cemodel)
-0.28-0.51
(-1.28)(-0.92)
residuals
(motiva-
tionmodel)
-0.35-0.81
(-1.64)(-1.42)
residuals
(full
model)
-0.34-0.58
(-1.54)(-1.04)
Nagelkerke's
R2
0.010.02
0.020.03
0.010.02
0.020.03
N945
846767
738945
846767
738
Allcoe�
cients
are
unsta
ndardized
log-odds.
Z-va
lues
inparen
theses.
Signi�cance
values:
*(p
<.05
);**(p
<.01);***(p
<.001).
Varia
bles:
B:expected
bene�t;−SD:expected
statusdeclin
e;psd :
expected
impact
ofsta
tusdeclin
e;C:expected
costs;
pep :
subjective
expected
probability
ofeducatio
nalsuccess.
Educatio
naltra
nsitio
ns:
Models
5b-8b=
Abitu
r;models
9b-12b=
university
transitio
ns.
304
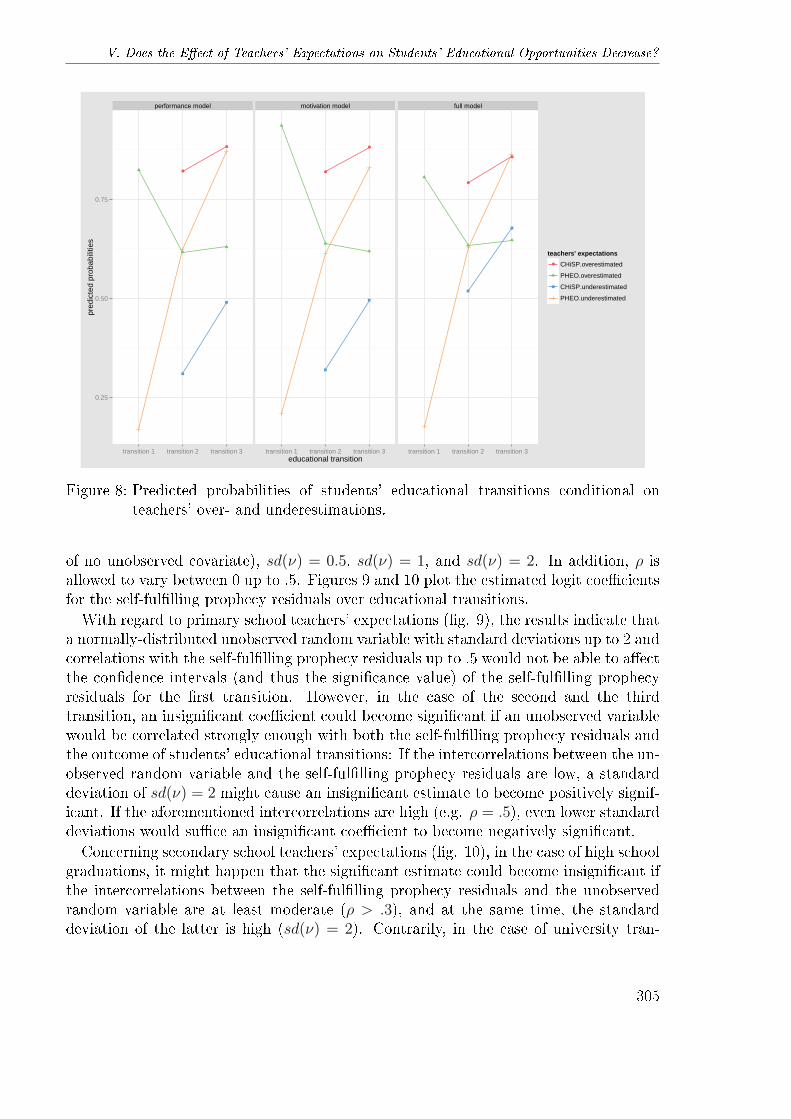
V. Does the E�ect of Teachers' Expectations on Students' Educational Opportunities Decrease?
performance model motivation model full model
●
●
●
●
●
●
0.25
0.50
0.75
transition 1 transition 2 transition 3 transition 1 transition 2 transition 3 transition 1 transition 2 transition 3educational transition
pred
icte
d pr
obab
ilitie
s
teachers' expectations
● CHiSP.overestimated
PHEO.overestimated
CHiSP.underestimated
PHEO.underestimated
Figure 8: Predicted probabilities of students' educational transitions conditional onteachers' over- and underestimations.
of no unobserved covariate), sd(ν) = 0.5, sd(ν) = 1, and sd(ν) = 2. In addition, ρ isallowed to vary between 0 up to .5. Figures 9 and 10 plot the estimated logit coe�cientsfor the self-ful�lling prophecy residuals over educational transitions.With regard to primary school teachers' expectations (�g. 9), the results indicate that
a normally-distributed unobserved random variable with standard deviations up to 2 andcorrelations with the self-ful�lling prophecy residuals up to .5 would not be able to a�ectthe con�dence intervals (and thus the signi�cance value) of the self-ful�lling prophecyresiduals for the �rst transition. However, in the case of the second and the thirdtransition, an insigni�cant coe�cient could become signi�cant if an unobserved variablewould be correlated strongly enough with both the self-ful�lling prophecy residuals andthe outcome of students' educational transitions: If the intercorrelations between the un-observed random variable and the self-ful�lling prophecy residuals are low, a standarddeviation of sd(ν) = 2 might cause an insigni�cant estimate to become positively signif-icant. If the aforementioned intercorrelations are high (e.g. ρ = .5), even lower standarddeviations would su�ce an insigni�cant coe�cient to become negatively signi�cant.Concerning secondary school teachers' expectations (�g. 10), in the case of high school
graduations, it might happen that the signi�cant estimate could become insigni�cant ifthe intercorrelations between the self-ful�lling prophecy residuals and the unobservedrandom variable are at least moderate (ρ > .3), and at the same time, the standarddeviation of the latter is high (sd(ν) = 2). Contrarily, in the case of university tran-
305
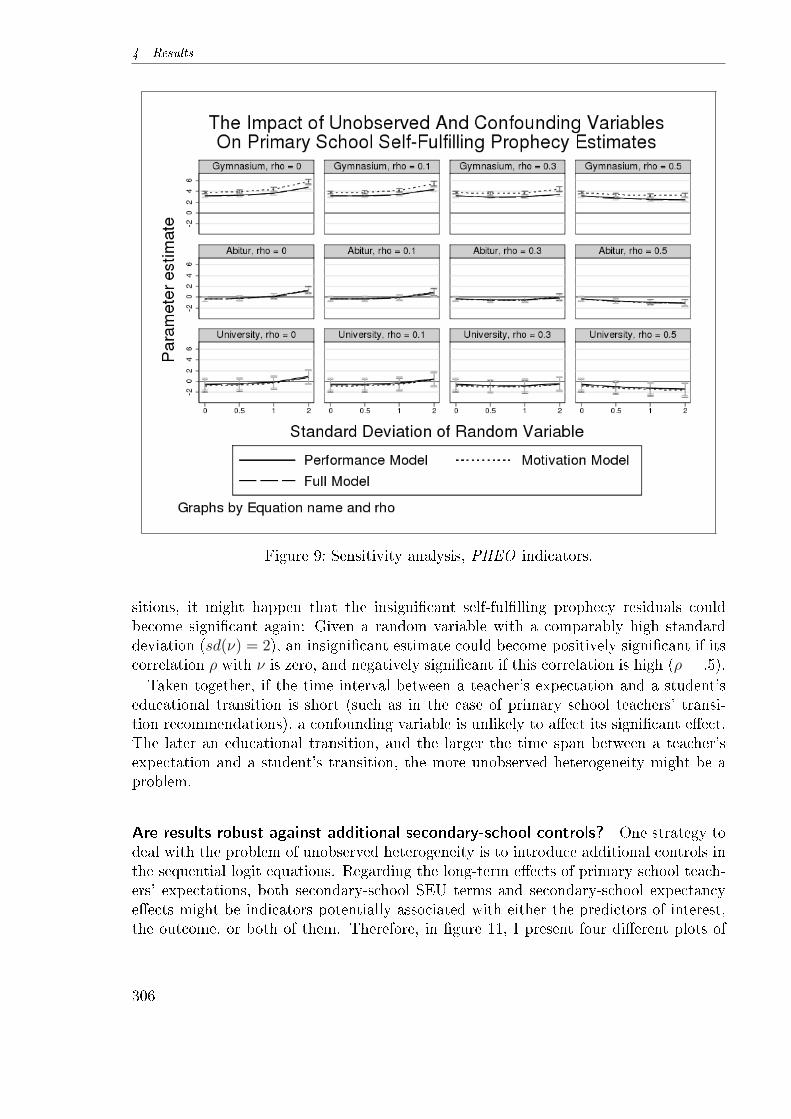
4 Results
Figure 9: Sensitivity analysis, PHEO indicators.
sitions, it might happen that the insigni�cant self-ful�lling prophecy residuals couldbecome signi�cant again: Given a random variable with a comparably high standarddeviation (sd(ν) = 2), an insigni�cant estimate could become positively signi�cant if itscorrelation ρ with ν is zero, and negatively signi�cant if this correlation is high (ρ = .5).Taken together, if the time interval between a teacher's expectation and a student's
educational transition is short (such as in the case of primary school teachers' transi-tion recommendations), a confounding variable is unlikely to a�ect its signi�cant e�ect.The later an educational transition, and the larger the time span between a teacher'sexpectation and a student's transition, the more unobserved heterogeneity might be aproblem.
Are results robust against additional secondary-school controls? One strategy todeal with the problem of unobserved heterogeneity is to introduce additional controls inthe sequential logit equations. Regarding the long-term e�ects of primary school teach-ers' expectations, both secondary-school SEU terms and secondary-school expectancye�ects might be indicators potentially associated with either the predictors of interest,the outcome, or both of them. Therefore, in �gure 11, I present four di�erent plots of
306
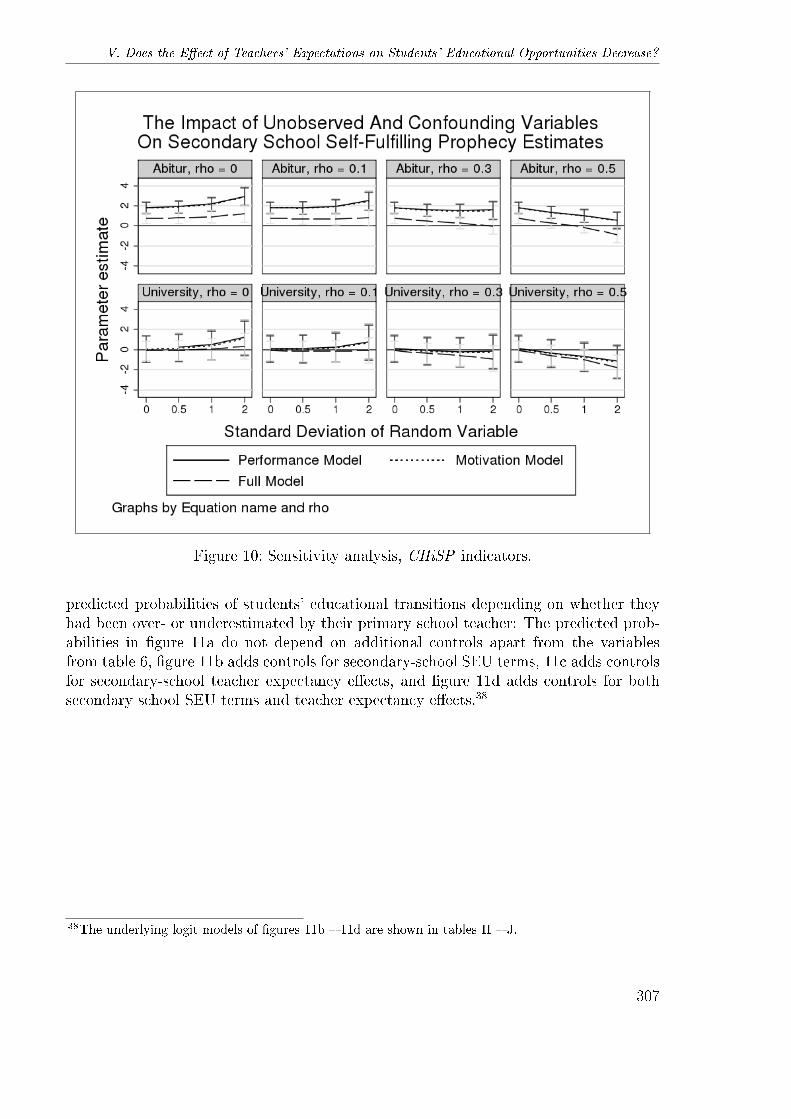
V. Does the E�ect of Teachers' Expectations on Students' Educational Opportunities Decrease?
Figure 10: Sensitivity analysis, CHiSP indicators.
predicted probabilities of students' educational transitions depending on whether theyhad been over- or underestimated by their primary school teacher: The predicted prob-abilities in �gure 11a do not depend on additional controls apart from the variablesfrom table 6, �gure 11b adds controls for secondary-school SEU terms, 11c adds controlsfor secondary-school teacher expectancy e�ects, and �gure 11d adds controls for bothsecondary school SEU terms and teacher expectancy e�ects.38
38The underlying logit models of �gures 11b � 11d are shown in tables H � J.
307
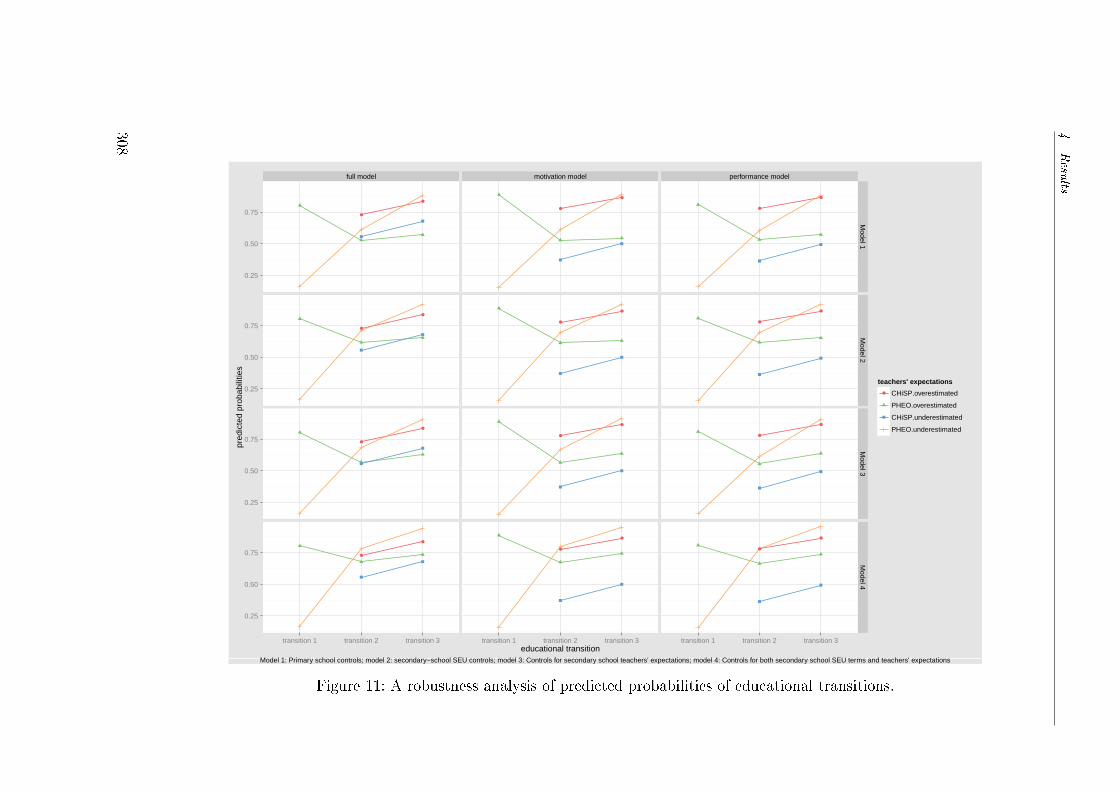
4Resu
lts
full model motivation model performance model
●
●
●
●
●
●
●
●
●
●
●
●
●
●
●
●
●
●
●
●
●
●
●
●
0.25
0.50
0.75
0.25
0.50
0.75
0.25
0.50
0.75
0.25
0.50
0.75
Model 1
Model 2
Model 3
Model 4
transition 1 transition 2 transition 3 transition 1 transition 2 transition 3 transition 1 transition 2 transition 3educational transition
pred
icte
d pr
obab
ilitie
s
teachers' expectations
● CHiSP.overestimated
PHEO.overestimated
CHiSP.underestimated
PHEO.underestimated
Model 1: Primary school controls; model 2: secondary−school SEU controls; model 3: Controls for secondary school teachers' expectations; model 4: Controls for both secondary school SEU terms and teachers' expectations
Figure 11: A robustness analysis of predicted probabilities of educational transitions.
308
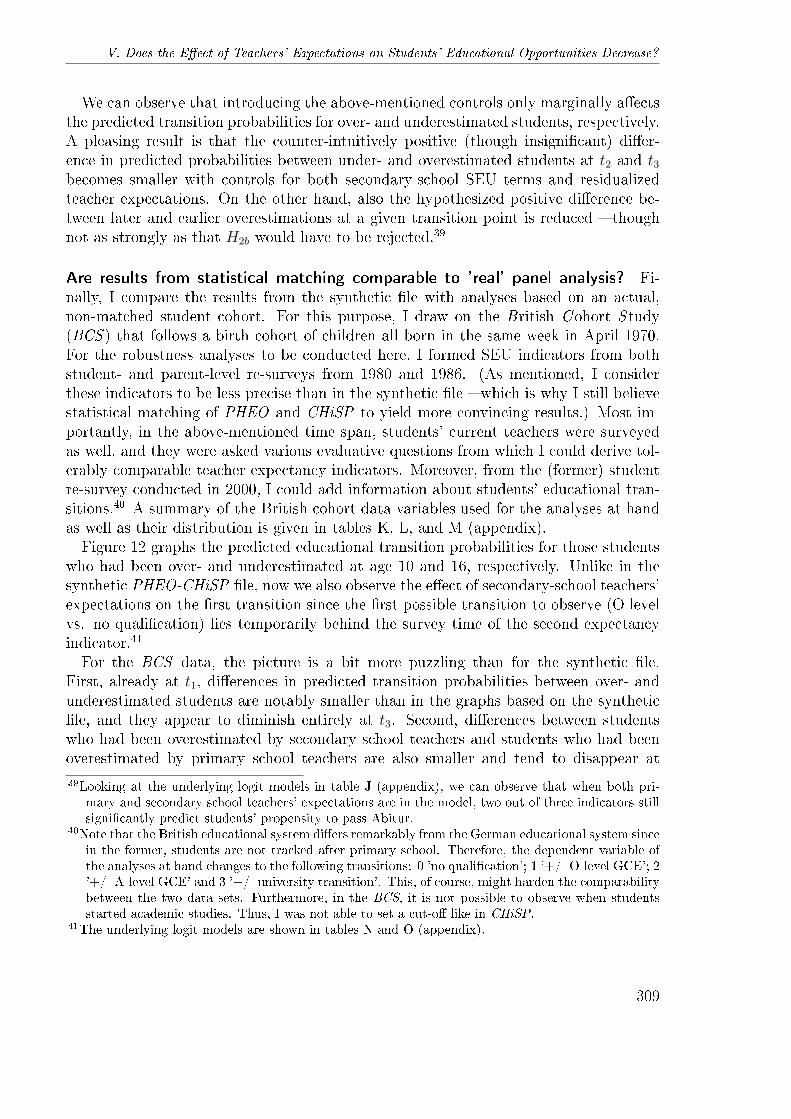
V. Does the E�ect of Teachers' Expectations on Students' Educational Opportunities Decrease?
We can observe that introducing the above-mentioned controls only marginally a�ectsthe predicted transition probabilities for over- and underestimated students, respectively.A pleasing result is that the counter-intuitively positive (though insigni�cant) di�er-ence in predicted probabilities between under- and overestimated students at t2 and t3becomes smaller with controls for both secondary-school SEU terms and residualizedteacher expectations. On the other hand, also the hypothesized positive di�erence be-tween later and earlier overestimations at a given transition point is reduced � thoughnot as strongly as that H2b would have to be rejected.39
Are results from statistical matching comparable to 'real' panel analysis? Fi-nally, I compare the results from the synthetic �le with analyses based on an actual,non-matched student cohort. For this purpose, I draw on the British Cohort S tudy(BCS ) that follows a birth cohort of children all born in the same week in April 1970.For the robustness analyses to be conducted here, I formed SEU indicators from bothstudent- and parent-level re-surveys from 1980 and 1986. (As mentioned, I considerthese indicators to be less precise than in the synthetic �le � which is why I still believestatistical matching of PHEO and CHiSP to yield more convincing results.) Most im-portantly, in the above-mentioned time span, students' current teachers were surveyedas well, and they were asked various evaluative questions from which I could derive tol-erably comparable teacher expectancy indicators. Moreover, from the (former) studentre-survey conducted in 2000, I could add information about students' educational tran-sitions.40 A summary of the British cohort data variables used for the analyses at handas well as their distribution is given in tables K, L, and M (appendix).Figure 12 graphs the predicted educational transition probabilities for those students
who had been over- and underestimated at age 10 and 16, respectively. Unlike in thesynthetic PHEO-CHiSP �le, now we also observe the e�ect of secondary-school teachers'expectations on the �rst transition since the �rst possible transition to observe (O levelvs. no quali�cation) lies temporarily behind the survey time of the second expectancyindicator.41
For the BCS data, the picture is a bit more puzzling than for the synthetic �le.First, already at t1, di�erences in predicted transition probabilities between over- andunderestimated students are notably smaller than in the graphs based on the synthetic�le, and they appear to diminish entirely at t3. Second, di�erences between studentswho had been overestimated by secondary school teachers and students who had beenoverestimated by primary school teachers are also smaller and tend to disappear at
39Looking at the underlying logit models in table J (appendix), we can observe that when both pri-mary and secondary school teachers' expectations are in the model, two out of three indicators stillsigni�cantly predict students' propensity to pass Abitur.
40Note that the British educational system di�ers remarkably from the German educational system sincein the former, students are not tracked after primary school. Therefore, the dependent variable ofthe analyses at hand changes to the following transitions: 0 'no quali�cation'; 1 '+/- O-level GCE'; 2'+/- A-level GCE' and 3 '+/- university transition'. This, of course, might harden the comparabilitybetween the two data sets. Furthermore, in the BCS, it is not possible to observe when studentsstarted academic studies. Thus, I was not able to set a cut-o� like in CHiSP.
41The underlying logit models are shown in tables N and O (appendix).
309
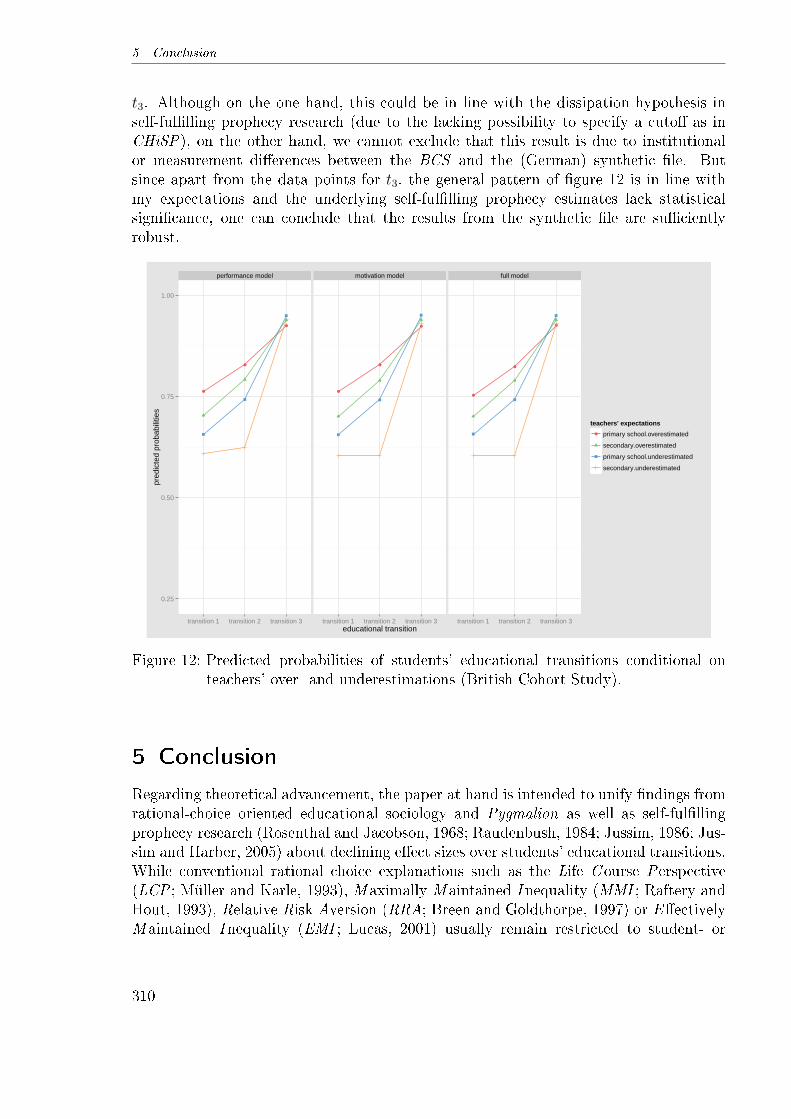
5 Conclusion
t3. Although on the one hand, this could be in line with the dissipation hypothesis inself-ful�lling prophecy research (due to the lacking possibility to specify a cuto� as inCHiSP), on the other hand, we cannot exclude that this result is due to institutionalor measurement di�erences between the BCS and the (German) synthetic �le. Butsince apart from the data points for t3, the general pattern of �gure 12 is in line withmy expectations and the underlying self-ful�lling prophecy estimates lack statisticalsigni�cance, one can conclude that the results from the synthetic �le are su�cientlyrobust.
performance model motivation model full model
●
●
●
●
●
●
●
●
●
0.25
0.50
0.75
1.00
transition 1 transition 2 transition 3 transition 1 transition 2 transition 3 transition 1 transition 2 transition 3educational transition
pred
icte
d pr
obab
ilitie
s
teachers' expectations
● primary school.overestimated
secondary.overestimated
primary school.underestimated
secondary.underestimated
Figure 12: Predicted probabilities of students' educational transitions conditional onteachers' over- and underestimations (British Cohort Study).
5 Conclusion
Regarding theoretical advancement, the paper at hand is intended to unify �ndings fromrational-choice oriented educational sociology and Pygmalion as well as self-ful�llingprophecy research (Rosenthal and Jacobson, 1968; Raudenbush, 1984; Jussim, 1986; Jus-sim and Harber, 2005) about declining e�ect sizes over students' educational transitions.While conventional rational choice explanations such as the Life Course Perspective(LCP ; Müller and Karle, 1993), M aximally M aintained Inequality (MMI ; Raftery andHout, 1993), Relative Risk Aversion (RRA; Breen and Goldthorpe, 1997) or E�ectivelyM aintained Inequality (EMI ; Lucas, 2001) usually remain restricted to student- or
310
V. Does the E�ect of Teachers' Expectations on Students' Educational Opportunities Decrease?
parent-level utility considerations, a main advantage of social-psychological theories,though less rich with respect to the former indicators, is their explicit consideration ofteacher expectancy e�ects. In the theoretical section, I �rst alluded to the main con-tributions from both disciplines to explain decreasing background e�ects over students'educational life course.Starting from a recent subjective expected utility (SEU) explanation of how teachers'
expectations of their students can be supposed to a�ect the latter's transition propen-sities via their subjective expected probabilities of educational success (Becker, 2010a;also see Esser, 1999), I then argued that via a mechanism of Bayesian updating (Breen,1999; Breen and García-Peñalosa, 2002; Morgan, 2005, ch. 5), students adjust theirbeliefs after both a teacher's evaluation and an educational transition. By means ofa simpli�ed decision tree, I endeavored to show how belief updating could explain theempirically-observed phenomenon of decreasing teacher expectancy e�ects over time �after which I deduced corresponding hypotheses suiting the conventional framework ofeducational transition analysis.Regarding methodological advancement, teacher expectancy e�ects were then oper-
ationalized as over- and underestimations (in terms of residualized expectations) in arepeated belief model (i.e. with measures at two distinct time points). As it has been ar-gued elsewhere (Becker, 2010a), these residuals can be understood as an approximationof the unobserved mechanisms that account for teacher treatment e�ects on students'subjective expected probability of educational success.Since I did not �nd a single �le that could have been used to test a repeated belief
model with convincing controls for conventional SEU terms, I used the distance hotdeck method (see D'Orazio et al., 2006) to create an arti�cial student cohort by meansof statistical matching (Rubin, 1986). Concretely, one source which measured teach-ers' transition recommendations at the end of primary school (Gesis-No. ZA893) wasmatched to a second source that surveyed teachers' secondary school evaluations of stu-dents' prospective academic ability (Gesis-No. ZA640). Before this was performed, Ijusti�ed how my theoretical model can be supposed to ful�ll the important conditionalindependence assumption (CIA).From several sequential logit models we could note that students who were overesti-
mated by their teachers in general have a signi�cantly higher propensity of taking thenext educational transition. This is well in line with conventional self-ful�lling prophecyand Pygmalion research (for research overviews see Raudenbush, 1984; Jussim, 1986;Rosenthal, 1994; Jussim and Harber, 2005) and its recent transformations on more so-ciological questions (Becker, 2010a). Regarding changes in this e�ect over time, I foundevidence that i) di�erences in predicted transition probabilities between students withprimary school over- and underestimations, respectively, become smaller from transition1 (+/- Gymnasium) to transition 2 (+/- Abitur); ii) di�erences in predicted transitionprobabilities between students with secondary school over- and underestimations, re-spectively, become smaller from transition 2 to transition 3 (+/- university transition);and iii) the predicted transition probabilities of students who had been overestimated atsecondary school to make the transition to university are still higher than the predictedtransition probabilities of students who had been overestimated at primary school. Re-
311
5 Conclusion
garding the implied mechanism of Bayesian updating that was postulated in section 2.4,it was illustrated that if di�erences in student beliefs after an over- or underestimationtended to decrease over their educational life course, one would be justi�ed to concludethat long-term teacher expectancy e�ects on student beliefs are smaller than short-terme�ects. Thus, by trend, the results at hand support my hypotheses.In several robustness analyses, I �rst noted that the later an educational transition,
and the more time falls between a teacher's expectation and a student's educationaltransition, the more the residualized teacher expectancy e�ects might stand at risk ofbeing a�ected by an unobserved but confounding variable. What goes in line withthat observation is that the counter-intuitive (though insigni�cant) result that studentswho had been underestimated at primary school show higher predicted probabilities ofuniversity transitions than students who had been overestimated was in part canceledout with additional controls for both secondary school teachers' expectations and studentSEU terms.With respect to the assumption of Bayesian updating, this result could be a hint
that the simpli�ed decision tree that was proposed in section 2.4 only provides a roughsketch of the social situation; and apart from regarding only isolated over- and under-estimations, the whole sequence of expectancy e�ects including students' cost-bene�tevaluations at all available measurement points should be considered.A �nal comparison with the British Cohort Study data (that I consider to entail
indicators less perfectly measured) showed that although teacher expectancy e�ects weregenerally lower than in the synthetic �le, the general pattern of declining e�ects overtime also undergirds the reliability of the results from the synthetic �le.Overall, these �ndings suggests the following improvements: From a theoretical point
of view, a comprehensive Bayesian analysis of the underlying educational decision treewould certainly be insightful, but would have gone far beyond the present study's scope.In my view, Breen (1999), Breen and García-Peñalosa (2002) and Morgan (2005, ch.5) have initiated an important theoretical advancement in educational sociology thatshould be generalized to include all relevant parameters a�ecting students' utility func-tion that may be subject to updating processes over their educational life course. Oncethis has been performed for teacher expectancy e�ects, the model could be �tted in acorresponding Bayesian probit model of choice making (Albert and Chib, 1993; Jackman,2009, ch. 8).Furthermore, as acknowledged in the operationalization section, all results have to
be evaluated cautiously. Concerning the statistical matching procedure, admittedly, thetwo sources stem from di�erent populations since in the �le �Parental Home and Educa-tional Opportunities� (PHEO), primary school students in Baden-Wuerttemberg weresurveyed, while in the Cologne High School Panel (CHiSP), secondary school studentsin North Rhine-Westphalia were interviewed. Thus, institutional factors in the two Ger-man Federal Lands may lead to di�culties in comparability since, in technical terms,the two sources are biased (van der Laan, 2000). A potential strategy to cope with thisproblem could be to use another measure of primary school teachers' expectations suchas general ability assessments which do not su�er from institutional dependencies. Asecond problem may arise due to measurement di�erences in the two data �les. In partic-
312
V. Does the E�ect of Teachers' Expectations on Students' Educational Opportunities Decrease?
ular, it was not possible to compute a high estimated bene�t of education for parents inPHEO � which may be an issue of inconsistency as admonished by van der Laan (2000)�, but a comparison of logistic regression estimates based on both original PHEO andPHEO indicators in the synthetic �le revealed di�erences in signi�cance also for othercoe�cients. Thus, I would still recommend to treat the present results with necessaryprudence � though the estimates obtained from the British Cohort study basically tendinto the same direction.A more technical recommendation relates to the choice of the concrete matching al-
gorithm. In the study at hand, I chose an unconstrained distance hot deck algorithmrelying on the Gower distance function for both binary and ordered categorical levelsof measurement. However, future studies should test whether results are reproducible ifalternative matching algorithms as reviewed in section 3.3 are applied.In the context of further improvements, a special situation could occur in terms of a
sequence of multiple underestimations: According to �ndings by Madon et al. (2006),it is be possible that self-ful�lling prophecies could accumulate rather than dissipateover time. Hence, in further analyses, it should also be tested if the predicted transitionprobabilities of students who had been underestimated by their teachers at di�erent timepoints are lower than they would be had only a single teacher expectation been consid-ered. Moreover, as some self-ful�lling prophecy studies suggest (Jussim and Harber,2005), additional interactions could also be formed with students' social backgrounds.And �nally, future studies should extend their analysis of changes in predicted probabil-ities of teachers' expectations over educational transitions across cohorts. Since most ofthe above-cited rational choice theories also address this issue, it would be an interestingbut neglected question also for self-ful�lling prophecy research. However, answering thisquestion would even more depend on data availability.
References
Albert JH and Chib S (1993) Bayesian analysis of binary and polychotomous responsedata. Journal of the American Statistical Association 88(422): 669�679.
Becker D (2010a) The impact of teachers' expectations on students' educational oppor-tunities in the life course. Cologne Graduate School Working Paper Series 1(7).URL: http://econpapers.repec.org/paper/cgrcgsser/01-07.htm
Becker D and Birkelbach K (2011) Teachers' evaluations and the de�nition of the socialsituation in the classroom. Cologne Graduate School Working Paper Series 2(4).URL: http://ideas.repec.org/p/cgr/cgsser/02-04.html
Becker R (2003) Educational expansion and persistent inequalities of education. Euro-pean Sociological Review 19(1): 1�24.
Becker R (2010b) Soziale Ungleichheit von Bildungschancen und Chancengerechtigkeit -eine Reanalyse mit bildungspolitischen Implikationen. In: Becker R and LauterbachW(eds.) Bildung als Privileg, 161�189. Wiesbaden: VS Verlag für Sozialwissenschaften.
313

References
Becker R and Hecken AE (2007) Studium oder Berufsausbildung? Eine empirischeÜberprüfung der Modelle zur Erklärung von Bildungsentscheidungen von Esser sowievon Breen und Goldthorpe. Zeitschrift für Soziologie 36(2): 100�117.
Becker R and Hecken AE (2009a) Higher education or vocational training? An empir-ical test of the rational action model of educational choices suggested by Breen andGoldthorpe and Esser. Acta Sociologica 52(1): 25�45.
Becker R and Hecken AE (2009b) Why are working-class children diverted from univer-sities? An empirical assessment of the diversion thesis. European Sociological Review25(2): 233�250.
Boudon R (1974) Education, Opportunity and Social Inequality: Changing Prospects inWestern Society. New York: John Wiley & Sons.
Breen R (1999) Beliefs, rational choice and bayesian learning. Rationality and Society11(4): 463�479.
Breen R and García-Peñalosa C (2002) Bayesian learning and gender segregation. Jour-nal of Labor Economics 20(4): 899�922.
Breen R and Goldthorpe JH (1997) Explaining educational di�erentials: towards a for-mal rational action theory. Rationality and Society 9(3): 275�305.
Breiman L; Friedman JH; Olshlen RA et al. (1984) Classi�cation and Regression Trees.Belmont, CA: Wadsworth.
Buis ML (2007) SEQLOGIT: Stata module to �t a sequential logit model.URL: http://ideas.repec.org/c/boc/bocode/s456843.html
Buis ML (2010) Inequality of Educational Outcome and Inequality of Educational Op-portunity in the Netherlands during the 20th Century. Disseration thesis, Vrije Uni-versiteit Amsterdam.
Buis ML (2011) The consequences of unobserved heterogeneity in a sequential logitmodel. Research in Social Strati�cation and Mobility 29(3): 247�262.
Caliendo M and Kopeinig S (2008) Some practical guidance for the implementation ofpropensity score matching. Journal of Economic Surveys 22(1): 31�72.
Cameron SV and Heckman JJ (1998) Life cycle schooling and dynamic selection bias:models and evidence for �ve cohorts of American males. Journal of Political Economy106(2): 262�333.
Cobalti A (1990) Schooling inequalities in Italy: trends over time. European SociologicalReview 6(3): 199�214.
314
V. Does the E�ect of Teachers' Expectations on Students' Educational Opportunities Decrease?
de Boer H; Bosker RJ and van der Werf MPC (2010) Sustainability of teacher expectationbias e�ects on long-term student performance. Journal of Educational Psychology102(1): 168�179.
De'ath G and Fabricius KE (2000) Classi�cation and regression trees: a powerful yetsimple technique for ecological data analysis. Ecology 81(11): 3178�3192.
D'Orazio M (2009) StatMatch: Statistical Matching. R package version 0.8.URL: http://cran.r-project.org/package=StatMatch
D'Orazio M; Di Zio M and Scanu M (2006) Statistical Matching - Theory and Practice.Chichester: John Wiley & Sons.
Elasho� JD and Snow RE (1971) Pygmalion Reconsidered: A Case Study in StatisticalInference: Reconsideration of the Rosenthal-Jacobson Data on Teacher Expectancy.Worthington, Ohio: CA Jones Pub. Co.
Erikson RS and Jonsson JO (1996) Introduction: explaining class inequality in educa-tion: the Swedish test case. In: Erikson RS and Jonsson JO (eds.) Can EducationBe Equalized? The Swedish Case in Comparative Perspective, 1�63. Boulder, CO:Westview Press.
Esser H (1999) Soziologie. Spezielle Grundlagen. Bd. 1: Situationslogik und Handeln.Frankfurt / New York: Campus Verlag.
Frieze IH; Olson JE and Russell J (1991) Attractiveness and income for men and womenin management. Journal of Applied Social Psychology 21(13): 1039�1057.
Ganzeboom HBG and Treiman DJ (1996) Internationally comparable measures of oc-cupational status for the 1988 International Standard Classi�cation of Occupations.Social Science Research 25(3): 201�239.
Gill S and Reynolds AJ (1999) Educational expectations and school achievement ofurban African American children. Journal of School Psychology 37(4): 403�424.
Hansen M; Dubayah R and DeFries R (1996) Classi�cation trees: an alternative totraditional land cover classi�ers. International Journal of Remote Sensing 17(5):1075�1081.
Hinnant JB; O'Brien M and Ghazarian SR (2009) The longitudinal relations of teacherexpectations to achievement in the early school years. Journal of Educational Psy-chology 101(3): 662�670.
Ingram DD; O'Hare J; Scheuren F et al. (2000) Statistical matching: a new validationcase study. Proceedings of the Survey Research Methods Section, American StatisticalAssociation 746�751.
Jackman S (2009) Bayesian Analysis for the Social Sciences. Chichester: Wiley.
315
References
Jussim L (1986) Self-ful�lling prophecies: a theoretical and integrative review. Psycho-logical Review 93(4): 429�445.
Jussim L (1989) Teacher expectations: self-ful�lling prophecies, perceptual biases, andaccuracy. Journal of Personality and Social Psychology 57(3): 469�480.
Jussim L and Harber KD (2005) Teacher expectations and self-ful�lling prophecies:knowns and unknowns, resolved and unresolved controversies. Personality and SocialPsychology Review 9(2): 131�155.
Lauen DL (2007) Contextual explanations of school choice. Sociology of Education 80(3):179�209.
Little RJA and Rubin DB (2002) Statistical Analysis With Missing Data. Hoboken (NJ):Wiley-Interscience .
Lucas SR (2001) E�ectively maintained Iinequality: education transitions, track mobil-ity, and social background e�ects. American Journal of Sociology 106(6): 1642�1690.
Lucas SR (2009) Strati�cation theory, socioeconomic background, and educational at-tainment. Rationality and Society 21(4): 459�511.
Madon S; Jussim L and Eccles J (1997) In search of the powerful self-ful�lling prophecy.Journal of Personality and Social Psychology 72(4): 791�809.
Madon S; Willard J; Guyll M et al. (2006) Self-ful�lling prophecy e�ects of mothers'beliefs on children's alcohol use: accumulation, dissipation, and stability over time.Journal of personality and social psychology 90(6): 911�926.
Manski CF (2004) Measuring expectations. Econometrica: Journal of the EconometricSociety 72(5): 1329�1376.
Mare RD (1980) Social background and school continuation decisions. Journal of theAmerican Statistical Association 75(370): 295� 305.
Mare RD (1981) Change and stability in educational strati�cation. American SociologicalReview 46(1): 72�87.
Mechtenberg L (2009) Cheap talk in the classroom: How biased grading at school ex-plains gender di�erences in achievements, career choices and wages. Review of Eco-nomic Studies 76(4): 1431�1459.
Merton RK (1948) The self-ful�lling prophecy. Antioch Review 8(2): 193�210.
Mistry RS; White ES; Benner AD et al. (2009) A longitudinal study of the simultaneousin�uence of mothers' and teachers' educational expectations on low-income youth'sacademic achievement. Journal of Youth and Adolescence 38(6): 826�838.
316

V. Does the E�ect of Teachers' Expectations on Students' Educational Opportunities Decrease?
Morgan SL (2002) Modeling preparatory commitment and non-repeatable decisions.Rationality and Society 14(4): 387�429.
Morgan SL (2005) On the Edge of Commitment. Stanford: Stanford University Press.
Muller C; Katz SR and Dance LJ (1999) Investing in teaching and learning: dynamicsof the teacher-student relationship from each actor's perspective. Urban Education34(3): 292�337.
Müller W and Karle W (1993) Social selection in educational systems in Europe. Euro-pean Sociological Review 9(1): 1�23.
Müller-Benedict V (2007) Wodurch kann die soziale Ungleichheit des Schulerfolgs amstärksten verringert werden? Kölner Zeitschrift für Soziologie und Sozialpsychologie59(4): 615�639.
Nash R (2003) Inequality/di�erence in education: is a real explanation of primary andsecondary e�ects possible? The British Journal of Sociology 54(4): 433�451.
Pietsch M and Stubbe TC (2007) Inequality in the transition from primary to secondaryschool: school choices and educational disparities in Germany. European EducationalResearch Journal 6(4): 424�445.
Prasad AM; Iverson LR and Liaw A (2006) Newer classi�cation and regression treetechniques: bagging and random forests for ecological prediction. Ecosystems 9(2):181�199.
Raftery AE and Hout M (1993) Maximally maintained inequality: expansion, reform,and opportunity in Irish education, 1921-75. Sociology of Education 66(1): 41�62.
Rässler S (2002) Statistical Matching: A Frequentist Theory, Practical Applications andAlternative Bayesian Approaches. Berlin: Springer.
Raudenbush SW (1984) Magnitude of teacher expectancy e�ects on pupil IQ as a func-tion of the credibility of expectancy induction: a synthesis of �ndings from 18 exper-iments. Journal of Educational Psychology 76(1): 85�97.
Ripley B (2010) tree: Classi�cation and regression trees. R package version 1.0-28. Tech.rep.URL: http://cran.r-project.org/package=tree
Rist RC (1970) Student social class and teacher expectations: the self-ful�lling prophecyin ghetto education. Harvard Educational Review 40(3): 411�451.
Rosenthal R (1994) Interpersonal expectancy e�ects: a 30-year perspective. CurrentDirections in Psychological Science 3(6): 176�179.
Rosenthal R and DiMatteo MR (2001) Meta-analysis: recent developments in quantita-tive methods for literature reviews. Annual Review of Psychology 52: 59�82.
317
References
Rosenthal R and Jacobson L (1968) Pygmalion in the Classroom: Teacher Expectationand Pupils' Intellectual Development. New York: Holt, Rinehart & Winston.
Rosenthal R and Rubin DB (1978) Interpersonal expectancy e�ects: the �rst 345 studies.Behavioral and Brain Sciences 1(3): 377�415.
Rubin DB (1986) Statistical matching using �le concatenation with adjusted weightsand multiple imputations. Journal of Business & Economic Statistics 4(1): 87�94.
Schubert F and Becker R (2010) Social inequality of reading literacy - a longitudinalanalysis with cross-sectional data of PIRLS 2001 and PISA 2000 utilizing the pair wisematching procedure. Research in Social Strati�cation and Mobility 28(1): 109�133.
Sewell WH; Haller AO and Ohlendorf GW (1970) The educational and early occupationalstatus attainment process: replication and revision. American Sociological Review35(6): 1014�1027.
Sewell WH; Haller AO and Portes A (1969) The educational and early occupationalattainment process. American Sociological Review 34(1): 82�92.
Siddique J and Belin TR (2008) Multiple imputation using an iterative hot-deck withdistance-based donor selection. Statistics in Medicine 27(1): 83�102.
Smith AE; Jussim L and Eccles J (1999) Do self-ful�lling prophecies accumulate, dissi-pate, or remain stable over time? Journal of Personality and Social Psychology 77(3):548�565.
Smith HL and Cheung PPL (1986) Trends in the e�ects of family background on educa-tional attainment in the Philippines. American Journal of Sociology 91(6): 1387�1408.
Smith ML (1980) Meta-analysis of research in teacher expectation. Evaluation in Edu-cation 4: 53�56.
Tolsma J; Coenders M and Lubbers M (2007) Trends in ethnic educational inequalitiesin the Netherlands: a cohort design. European Sociological Review 23(3): 325�339.
van der Laan P (2000) Integrating administrative registers and household surveys.Netherlands O�cial Statistics 15(special issue): 7�15.
West CK and Anderson TH (1976) The question of preponderant causation in teacherexpectancy research. Review of Educational Research 46(4): 613�630.
318
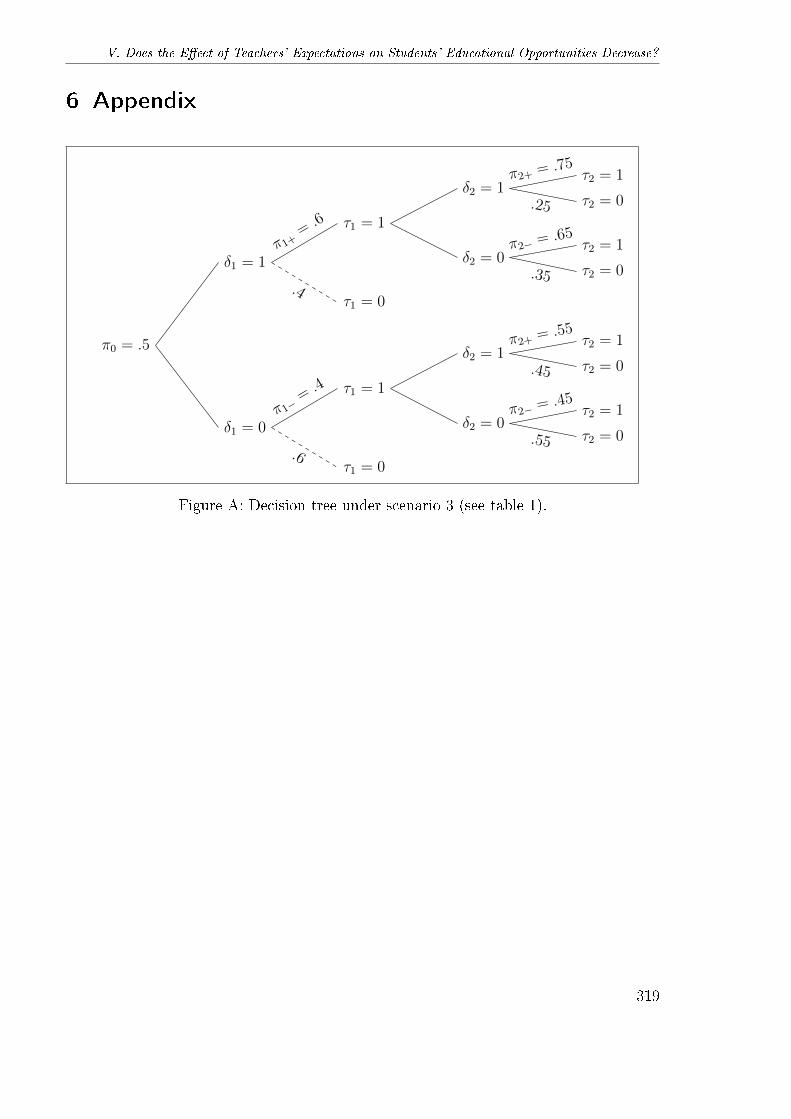
V. Does the E�ect of Teachers' Expectations on Students' Educational Opportunities Decrease?
6 Appendix
π0 = .5
δ1 = 1
τ1 = 1
δ2 = 1τ2 = 1
τ2 = 0.25
π2+ = .75
δ2 = 0τ2 = 1
τ2 = 0.35
π2− = .65
τ1 = 0.4
π1+=.6
δ1 = 0
τ1 = 1
δ2 = 1τ2 = 1
τ2 = 0.45
π2+ = .55
δ2 = 0τ2 = 1
τ2 = 0.55
π2− = .45
τ1 = 0.6
π1−=.4
Figure A: Decision tree under scenario 3 (see table 1).
319

6 Appendix
Table A: Logistic regression model of primary school teachers' recommendations on stu-dents' performance and motivation (original PHEO data)
Performance Model Motivation Model Full Model
eb∗sd/z -value eb∗sd/z -value eb∗sd/z -valueaverage grade 3.80*** 3.76***
(15.71) (14.41)learning motivation 1.37*** 0.98
(5.54) (-0.37)TV consumption 1.10 1.05
(1.80) (0.77)Nagelkerke's R2 0.29 0.03 0.29N 1549 1453 1393
All coe�cients are standardized odds ratios. Z-values in parentheses. Signi�cance values: * (p<.05); ** (p <.01); *** (p <.001).
Table B: Logistic regression model of secondary school teachers' evaluations on students'performance and motivation (original CHiSP data)
Performance Model Motivation Model Full Model
eb∗sd/z -value eb∗sd/z -value eb∗sd/z -valueaverage grade 8.40*** 7.45***
(17.63) (16.41)learning motivation 1.14* 1.11
(2.21) (1.37)self-concept 2.03*** 1.45***
(10.67) (4.52)Nagelkerke's R2 0.51 0.15 0.52N 1313 1304 1301
All coe�cients are standardized odds ratios. Z-values in parentheses. Signi�cance values: * (p<.05); ** (p <.01); *** (p <.001).
320
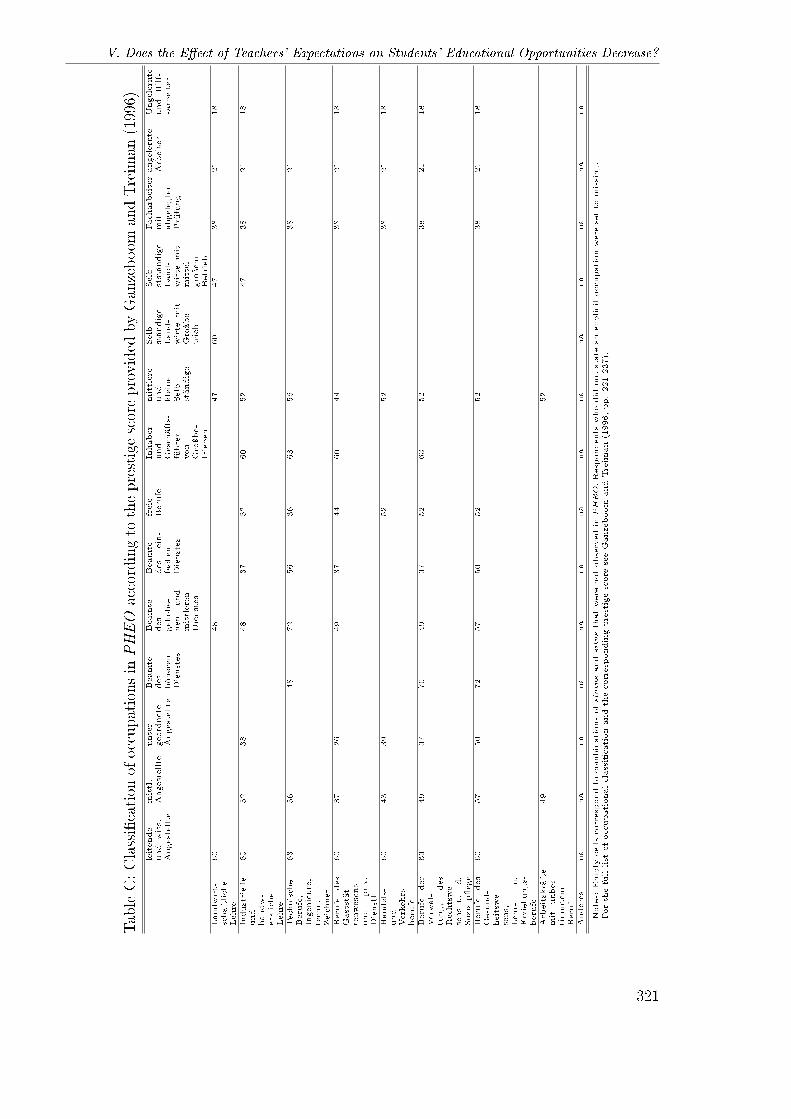
V. Does the E�ect of Teachers' Expectations on Students' Educational Opportunities Decrease?
TableC:Classi�cation
ofoccupationsin
PHEO
accordingto
theprestige
scoreprovided
byGanzeboom
andTreiman
(1996)
leitende
undwiss.
Angestellte
mittl.
Angestellte
unter-
geordnete
Angestellte
Beamte
des
höheren
Dienstes
Beamte
des
gehobe-
nen
und
mittleren
Dienstes
Beamte
des
ein-
fachen
Dienstes
freie
Berufe
Inhaber
und
Geschäfts-
führer
von
Groÿbe-
trieben
mittlere
und
kleine
Selb-
ständige
Selb-
ständige
Land-
wirte
mit
Groÿbe-
trieb
Selb-
stständige
Land-
wirte
mit
mittel-
groÿem
Betrieb
Facharbeiter
mit
abgelegter
Prüfung
angelernte
Arbeiter
Ungelernte
und
Hilf-
sarbeiter
Landwirt-
schaftliche
Lehre
60
48
47
60
47
38
21
18
Industrielle
und
handw-
erkliche
Lehre
60
52
38
48
37
52
60
52
47
38
21
18
Technische
Berufe,
Ingenieure,
techn.
Zeichner
63
56
48
72
56
36
63
56
38
21
Berufe
des
Gaststät-
tenwesens
und
priv.
Dienstl.
60
37
26
49
37
44
60
44
38
21
18
Handels-
und
Verkehrs-
berufe
60
43
39
52
52
38
21
18
Berufe
der
Verwal-
tung,
des
Rechtswe-
sensu.
d.
Sozialp�ege
63
49
37
70
49
37
52
63
52
38
21
18
Berufe
des
Gesund-
heitswe-
sens,
Lehr-
u.
Erziehungs-
berufe
60
57
50
72
57
50
52
52
38
21
18
Arbeitskräfte
mit
unbes-
timmtem
Beruf
49
52
Anderes
na
na
na
na
na
na
na
na
na
na
na
na
na
na
Notes:
Empty
cellscorrespondto
combinationsofstatusandsitusthatwere
notobservedin
PHEO.Respondents
whodid
notstate
anexplicitoccupationwere
setto
missing.
Forthefulllist
ofoccupationalclassi�cationandthecorrespondingprestigescore
seeGanzeboom
andTreim
an(1996,pp.221-237).
321
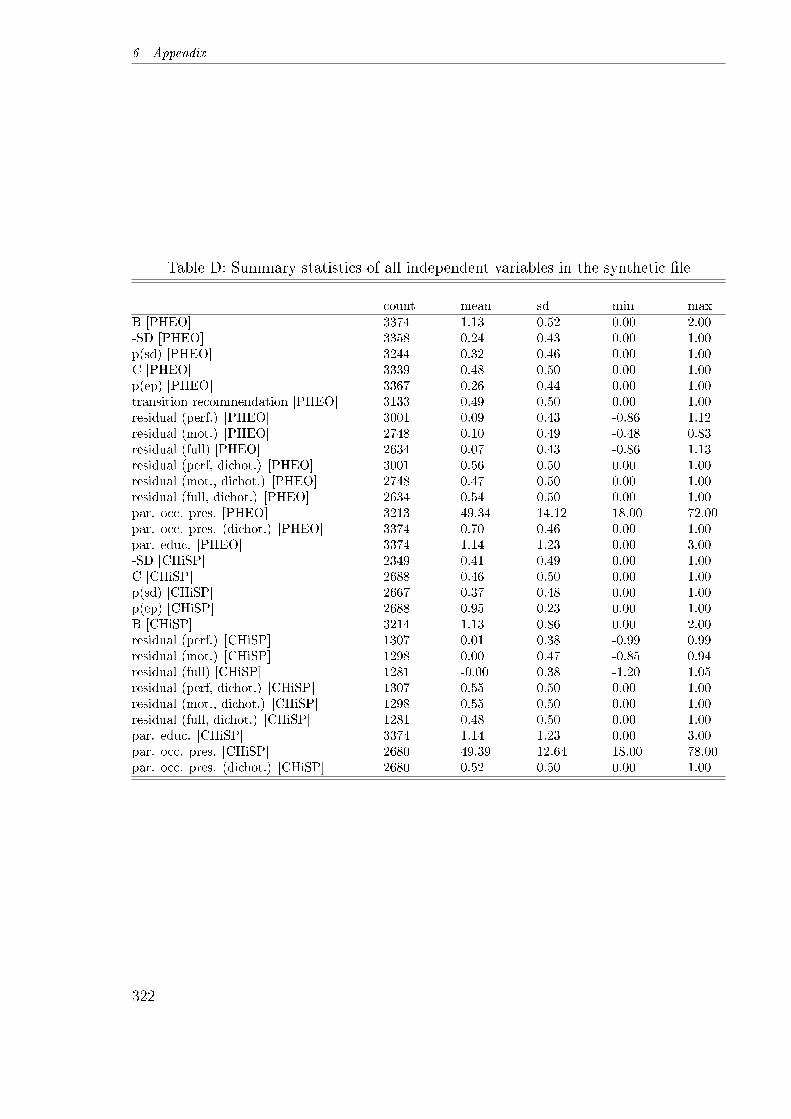
6 Appendix
Table D: Summary statistics of all independent variables in the synthetic �le
count mean sd min maxB [PHEO] 3374 1.13 0.52 0.00 2.00-SD [PHEO] 3358 0.24 0.43 0.00 1.00p(sd) [PHEO] 3244 0.32 0.46 0.00 1.00C [PHEO] 3339 0.48 0.50 0.00 1.00p(ep) [PHEO] 3367 0.26 0.44 0.00 1.00transition recommendation [PHEO] 3133 0.49 0.50 0.00 1.00residual (perf.) [PHEO] 3001 0.09 0.43 -0.86 1.12residual (mot.) [PHEO] 2748 0.10 0.49 -0.48 0.83residual (full) [PHEO] 2634 0.07 0.43 -0.86 1.13residual (perf, dichot.) [PHEO] 3001 0.56 0.50 0.00 1.00residual (mot., dichot.) [PHEO] 2748 0.47 0.50 0.00 1.00residual (full, dichot.) [PHEO] 2634 0.54 0.50 0.00 1.00par. occ. pres. [PHEO] 3213 49.34 14.12 18.00 72.00par. occ. pres. (dichot.) [PHEO] 3374 0.70 0.46 0.00 1.00par. educ. [PHEO] 3374 1.14 1.23 0.00 3.00-SD [CHiSP] 2349 0.41 0.49 0.00 1.00C [CHiSP] 2688 0.46 0.50 0.00 1.00p(sd) [CHiSP] 2667 0.37 0.48 0.00 1.00p(ep) [CHiSP] 2688 0.95 0.23 0.00 1.00B [CHiSP] 3214 1.13 0.86 0.00 2.00residual (perf.) [CHiSP] 1307 0.01 0.38 -0.99 0.99residual (mot.) [CHiSP] 1298 0.00 0.47 -0.85 0.94residual (full) [CHiSP] 1281 -0.00 0.38 -1.20 1.05residual (perf, dichot.) [CHiSP] 1307 0.55 0.50 0.00 1.00residual (mot., dichot.) [CHiSP] 1298 0.55 0.50 0.00 1.00residual (full, dichot.) [CHiSP] 1281 0.48 0.50 0.00 1.00par. educ. [CHiSP] 3374 1.14 1.23 0.00 3.00par. occ. pres. [CHiSP] 2680 49.39 12.64 18.00 78.00par. occ. pres. (dichot.) [CHiSP] 2680 0.52 0.50 0.00 1.00
322

V.Does
theE�ect
ofTeachers'
Expecta
tionsonStudents'
Educatio
nalOpportu
nities
Decrea
se?
Table E: Logit model of secondary school transitions with controls for parental occupational prestige and education
Model 1c Model 2c Model 3c Model 4c
log-odds/z log-odds/z log-odds/z log-odds/zB 2.12*** 2.16*** 1.88*** 2.19***
(9.00) (7.33) (5.40) (7.04)-SD 1.40*** 1.56*** 1.42*** 1.55***
(6.45) (5.68) (4.34) (5.33)p(sd) 0.09 0.22 -0.08 0.09
(0.47) (0.96) (-0.27) (0.36)C -0.47** -0.53* -0.46 -0.51*
(-2.75) (-2.45) (-1.66) (-2.22)p(ep) -1.72*** -1.58*** -1.05*** -1.65***
(-8.96) (-6.70) (-3.67) (-6.65)par. occ. pres. 0.02* 0.01 -0.00 0.01
(2.25) (0.74) (-0.05) (0.57)par. educ. 0.64*** 0.74*** 0.79*** 0.66***
(4.64) (4.08) (3.92) (3.50)residuals (perfor-mance model)
2.74***
(11.97)residuals (moti-vation model)
4.10***
(13.67)residuals (fullmodel)
2.67***
(11.13)Nagelkerke's R2 0.45 0.63 0.76 0.63N 876 783 727 694
All coe�cients are unstandardized log-odds. Z-values in parentheses.Signi�cance values: * (p < .05); ** (p < .01); *** (p < .001).Variables: B: expected bene�t; −SD: expected status decline; psd:expected impact of status decline; C: expected costs; pep: subjectiveexpected probability of educational success.
(a) Original PHEO data.
Model 1d Model 2d Model 3d Model 4d
log-odds/z log-odds/z log-odds/z log-odds/zB 1.07*** 0.92*** 0.75*** 0.87***
(10.47) (7.33) (5.23) (6.68)-SD 1.60*** 1.46*** 1.49*** 1.47***
(13.35) (9.63) (8.58) (9.39)p(sd) 0.05 -0.20 -0.58*** -0.28*
(0.49) (-1.54) (-3.89) (-2.17)C -0.34*** -0.46*** -0.38** -0.48***
(-3.63) (-3.84) (-2.79) (-3.89)p(ep) -1.29*** -1.09*** -0.57*** -1.06***
(-11.46) (-7.91) (-3.68) (-7.43)par. occ. pres. 0.04*** 0.03*** 0.03*** 0.02***
(10.33) (5.68) (5.13) (4.87)par. educ. 0.74*** 0.77*** 0.77*** 0.70***
(16.77) (12.63) (11.72) (11.30)residuals (perfor-mance model)
2.90***
(23.44)residuals (moti-vation model)
3.76***
(25.19)residuals (fullmodel)
2.87***
(22.45)Nagelkerke's R2 0.49 0.66 0.73 0.65N 3050 2721 2511 2405
All coe�cients are unstandardized log-odds. Z-values in parentheses.Signi�cance values: * (p < .05); ** (p < .01); *** (p < .001).Variables: B: expected bene�t; −SD: expected status decline; psd:expected impact of status decline; C: expected costs; pep: subjectiveexpected probability of educational success.
(b) Synthetic �le.
323
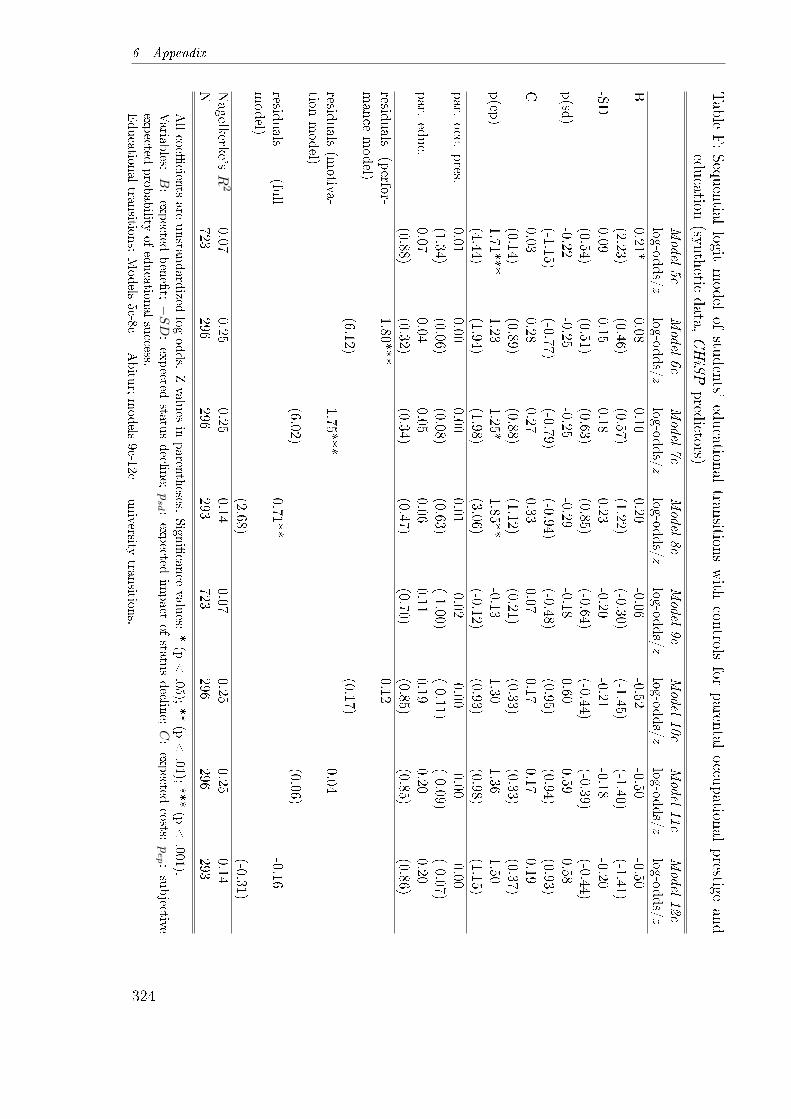
6 Appendix
Table
F:Sequential
logitmodel
ofstudents'
educationaltransitions
with
controlsfor
parentaloccupational
prestigeand
education(synthetic
data,CHiSPpredictors)
Model5c
Model6c
Model7c
Model8c
Model9c
Model10c
Model11c
Model12c
log-odds/z
log-odds/z
log-odds/z
log-odds/z
log-odds/z
log-odds/z
log-odds/z
log-odds/z
B0.21*
0.080.10
0.20-0.06
-0.52-0.50
-0.50(2.23)
(0.46)(0.57)
(1.22)(-0.30)
(-1.45)(-1.40)
(-1.41)-SD
0.090.15
0.180.23
-0.20-0.21
-0.18-0.20
(0.54)(0.51)
(0.63)(0.85)
(-0.64)(-0.44)
(-0.39)(-0.44)
p(sd
)-0.22
-0.25-0.25
-0.29-0.18
0.600.59
0.58(-1.15)
(-0.77)(-0.79)
(-0.94)(-0.48)
(0.95)(0.94)
(0.93)C
0.030.28
0.270.33
0.070.17
0.170.19
(0.14)(0.89)
(0.88)(1.12)
(0.21)(0.33)
(0.33)(0.37)
p(ep
)1.71***
1.231.25*
1.85**-0.13
1.301.36
1.50(4.44)
(1.94)(1.98)
(3.06)(-0.12)
(0.93)(0.98)
(1.15)
par.
occ.
pres.
0.010.00
0.000.01
-0.02-0.00
-0.00-0.00
(1.34)(0.06)
(0.08)(0.63)
(-1.00)(-0.11)
(-0.09)(-0.07)
par.
educ.
0.070.04
0.050.06
0.110.19
0.200.20
(0.88)(0.32)
(0.34)(0.47)
(0.70)(0.85)
(0.85)(0.86)
residuals
(perfor-
man
cemodel)
1.80***0.12
(6.12)(0.17)
residuals
(motiva-
tionmodel)
1.75***0.04
(6.02)(0.06)
residuals
(full
model)
0.71**-0.16
(2.68)(-0.31)
Nagelkerke's
R2
0.070.25
0.250.14
0.070.25
0.250.14
N723
296296
293723
296296
293
Allcoe�
cients
are
unsta
ndardized
log-odds.
Z-va
lues
inparen
theses.
Signi�cance
values:
*(p
<.05
);**(p
<.01);***(p
<.001).
Varia
bles:
B:expected
bene�t;−SD:expected
statusdeclin
e;psd :
expected
impact
ofsta
tusdeclin
e;C:expected
costs;
pep :
subjective
expected
probability
ofeducatio
nalsuccess.
Educatio
naltra
nsitio
ns:
Models
5c-8
c=
Abitu
r;models
9c-1
2c=
university
transitio
ns.
324
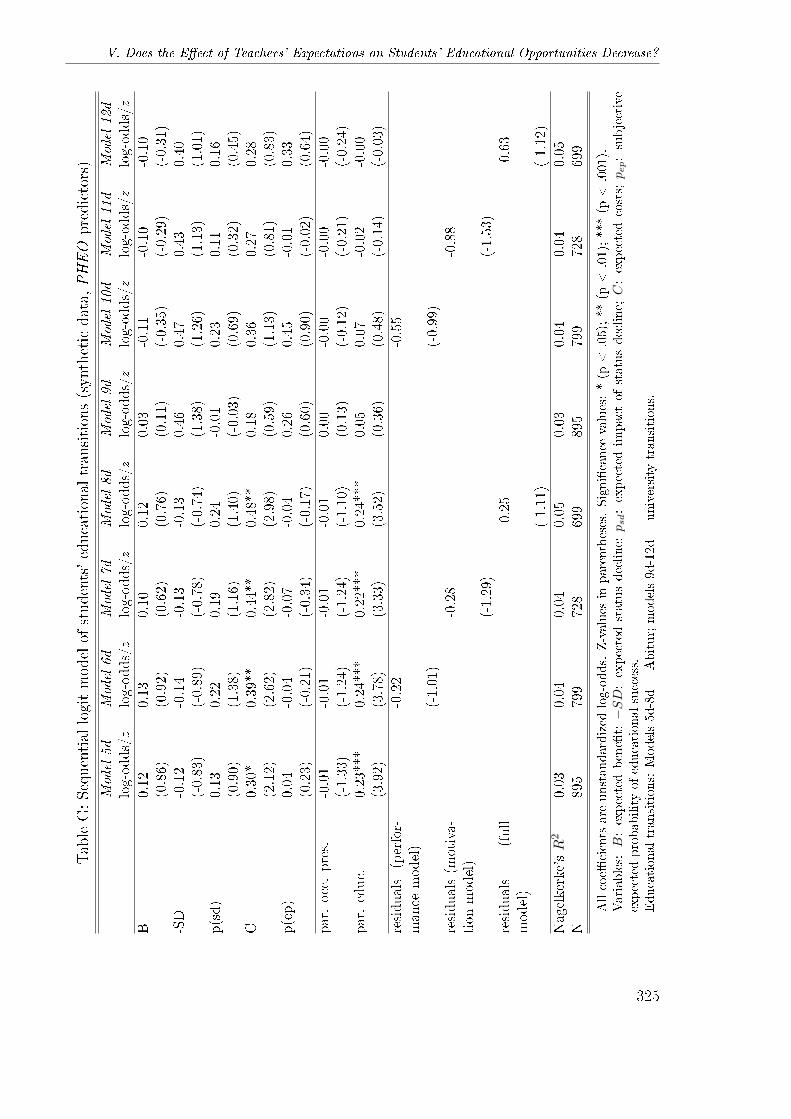
V. Does the E�ect of Teachers' Expectations on Students' Educational Opportunities Decrease?
TableG:Sequentiallogitmodelof
students'educationaltransitions(syntheticdata,PHEO
predictors)
Model5d
Model6d
Model7d
Model8d
Model9d
Model10d
Model11d
Model12d
log-odds/z
log-odds/z
log-odds/z
log-odds/z
log-odds/z
log-odds/z
log-odds/z
log-odds/z
B0.12
0.13
0.10
0.12
0.03
-0.11
-0.10
-0.10
(0.86)
(0.92)
(0.62)
(0.76)
(0.11)
(-0.35
)(-0.29
)(-0.31
)-SD
-0.12
-0.14
-0.13
-0.13
0.46
0.47
0.43
0.40
(-0.83
)(-0.89
)(-0.78
)(-0.74
)(1.38)
(1.26)
(1.13)
(1.01)
p(sd)
0.13
0.22
0.19
0.24
-0.01
0.23
0.11
0.16
(0.90)
(1.38)
(1.16)
(1.40)
(-0.03
)(0.69)
(0.32)
(0.45)
C0.30
*0.39
**0.44
**0.48
**0.18
0.36
0.27
0.28
(2.12)
(2.62)
(2.82)
(2.98)
(0.59)
(1.13)
(0.81)
(0.83)
p(ep)
0.04
-0.04
-0.07
-0.04
0.26
0.45
-0.01
0.33
(0.23)
(-0.21
)(-0.34
)(-0.17
)(0.60)
(0.90)
(-0.02
)(0.64)
par.occ.pres.
-0.01
-0.01
-0.01
-0.01
0.00
-0.00
-0.00
-0.00
(-1.33
)(-1.24
)(-1.24
)(-1.10
)(0.13)
(-0.12
)(-0.21
)(-0.24
)par.ed
uc.
0.23
***
0.24
***
0.22
***
0.24
***
0.05
0.07
-0.02
-0.00
(3.92)
(3.78)
(3.33)
(3.52)
(0.36)
(0.48)
(-0.14
)(-0.03
)
residuals
(perfor-
man
cemodel)
-0.22
-0.55
(-1.01
)(-0.99
)residuals(m
otiva-
tion
model)
-0.28
-0.88
(-1.29
)(-1.53
)residuals
(full
model)
-0.25
-0.63
(-1.11
)(-1.12
)
Nag
elkerke'sR
20.03
0.04
0.04
0.05
0.03
0.04
0.04
0.05
N89
579
972
869
989
579
972
869
9
Allcoe�
cients
are
unstandardized
log-odds.
Z-values
inparentheses.Signi�cance
values:*(p
<.05);**(p
<.01);***(p
<.001).
Variables:B:expectedbene�t;−SD:expectedstatusdecline;psd:expectedim
pact
ofstatusdecline;C:expectedcosts;pep:subjective
expectedprobabilityofeducationalsuccess.
Educationaltransitions:
Models5d-8d=
Abitur;models9d-12d=
university
transitions.
325
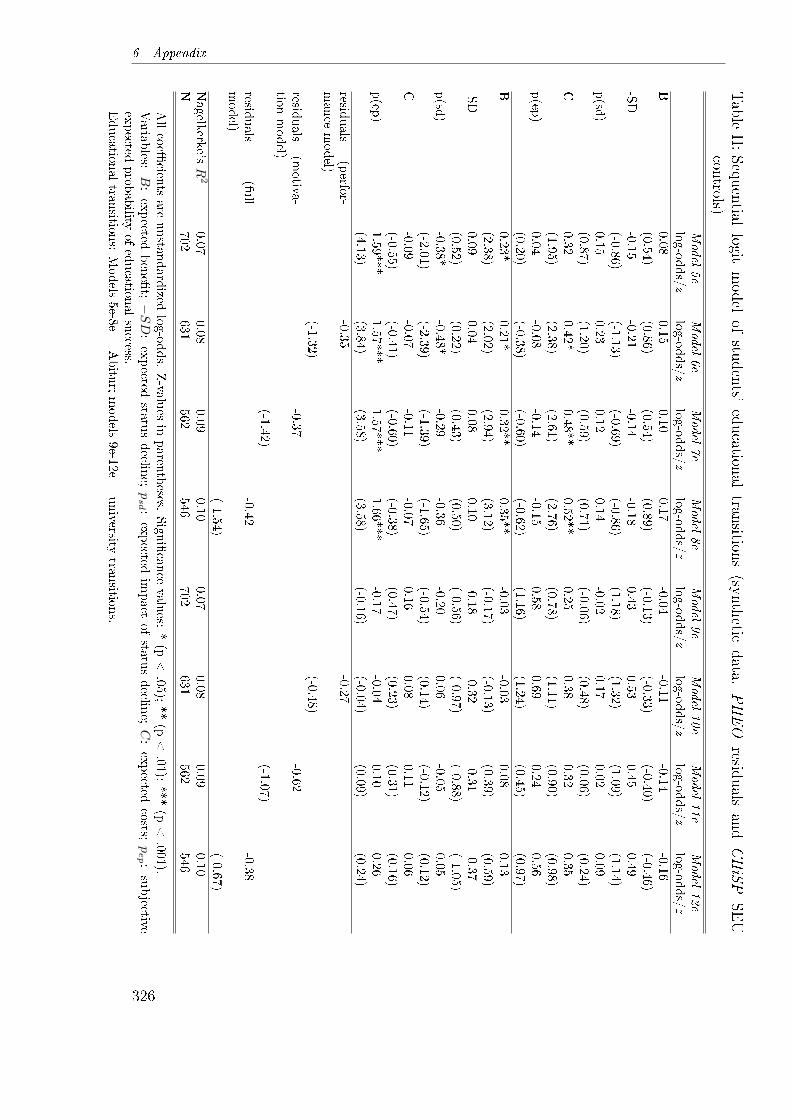
6 AppendixTable
H:Sequential
logitmodel
ofstudents'
educationaltransitions
(syntheticdata,
PHEO
residualsand
CHiSP
SEU
controls)Model5e
Model6e
Model7e
Model8e
Model9e
Model10e
Model11e
Model12e
log-odds/z
log-odds/z
log-odds/z
log-odds/z
log-odds/z
log-odds/z
log-odds/z
log-odds/z
B0.08
0.15
0.10
0.17
-0.04
-0.11
-0.14
-0.16
(0.54)
(0.86)
(0.54)
(0.89)
(-0.13)
(-0.33)
(-0.40)
(-0.46)
-SD
-0.15
-0.21
-0.14
-0.18
0.43
0.53
0.45
0.49
(-0.86)
(-1.13)
(-0.69)
(-0.86)
(1.18)
(1.32)
(1.09)
(1.14)
p(sd
)0.15
0.23
0.12
0.14
-0.02
0.17
0.02
0.09
(0.87)
(1.20)
(0.59)
(0.71)
(-0.06)
(0.48)
(0.06)
(0.24)
C0.32
0.42*
0.48**
0.52**
0.25
0.38
0.32
0.35
(1.95)
(2.38)
(2.61)
(2.76)
(0.78)
(1.11)
(0.90)
(0.98)
p(ep
)0.04
-0.08
-0.14
-0.15
0.58
0.69
0.24
0.56
(0.20)
(-0.38)
(-0.60)
(-0.62)
(1.16)
(1.24)
(0.45)
(0.97)
B0.23*
0.21*
0.32**
0.35**
-0.03
-0.03
0.08
0.13
(2.38)
(2.02)
(2.94)
(3.12)
(-0.17)
(-0.13)
(0.39)
(0.59)
-SD
0.09
0.04
0.08
0.10
-0.18
-0.32
-0.31
-0.37
(0.52)
(0.22)
(0.43)
(0.50)
(-0.56)
(-0.97)
(-0.88)
(-1.05)
p(sd
)-0.38*
-0.48*
-0.29
-0.36
-0.20
0.06
-0.05
0.05
(-2.01)
(-2.39)
(-1.39)
(-1.65)
(-0.54)
(0.14)
(-0.12)
(0.12)
C-0.0
9-0.07
-0.11
-0.07
0.16
0.08
0.11
0.06
(-0.55)
(-0.41)
(-0.60)
(-0.38)
(0.47)
(0.23)
(0.31)
(0.16)
p(ep
)1.59***
1.57***
1.57***
1.66***
-0.17
-0.04
0.10
0.26
(4.13)
(3.84)
(3.58)
(3.58)
(-0.16)
(-0.04)
(0.09)
(0.24)
residuals
(perfo
r-mance
model)
-0.35
-0.27
(-1.32)
(-0.48)
residuals
(motiva
-tio
nmodel)
-0.37
-0.62
(-1.42)
(-1.07)
residuals
(full
model)
-0.42
-0.38
(-1.54)
(-0.67)
Nagelkerke's
R2
0.07
0.08
0.09
0.10
0.07
0.08
0.09
0.10
N702
631
562
546
702
631
562
546
Allcoe�
cients
are
unsta
ndardized
log-o
dds.
Z-va
lues
inparen
theses.
Signi�cance
values:
*(p
<.05);**(p
<.01
);***(p
<.001).
Varia
bles:
B:expected
bene�t;−SD:expected
statusdeclin
e;psd :
expected
impact
ofsta
tusdeclin
e;C:expected
costs;
pep :
subjective
expected
probability
ofeducation
alsuccess.
Educatio
naltra
nsitio
ns:
Models
5e-8
e=
Abitu
r;models
9e-1
2e=
university
transitio
ns.
326
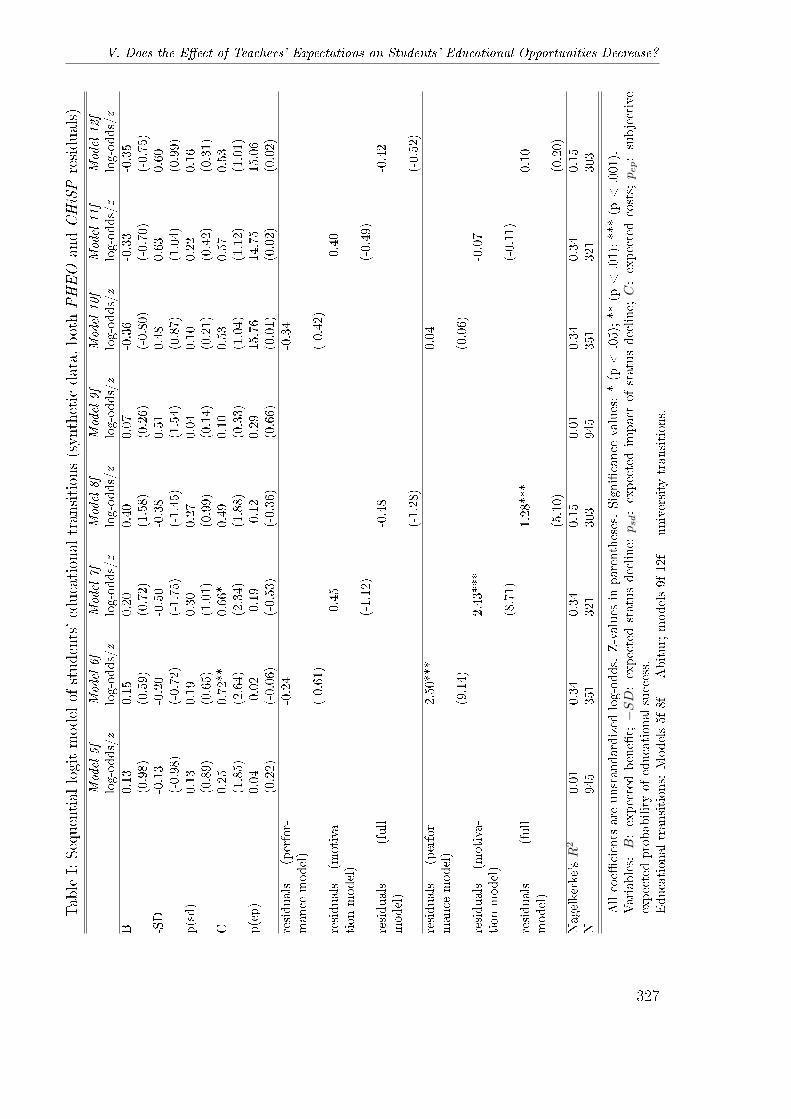
V. Does the E�ect of Teachers' Expectations on Students' Educational Opportunities Decrease?
TableI:Sequentiallogitmodelof
students'educationaltransitions(syntheticdata,bothPHEO
andCHiSPresiduals)
Model5f
Model6f
Model7f
Model8f
Model9f
Model10f
Model11f
Model12f
log-odds/z
log-odds/z
log-odds/z
log-odds/z
log-odds/z
log-odds/z
log-odds/z
log-odds/z
B0.13
0.15
0.20
0.40
0.07
-0.36
-0.33
-0.35
(0.98)
(0.59)
(0.72)
(1.58)
(0.26)
(-0.80)
(-0.70)
(-0.75)
-SD
-0.13
-0.20
-0.50
-0.38
0.51
0.48
0.63
0.60
(-0.98)
(-0.72)
(-1.75)
(-1.45)
(1.54)
(0.87)
(1.04)
(0.99)
p(sd)
0.13
0.19
0.30
0.27
0.04
0.10
0.22
0.16
(0.89)
(0.65)
(1.01)
(0.99)
(0.14)
(0.21)
(0.42)
(0.31)
C0.25
0.72**
0.66*
0.49
0.10
0.53
0.57
0.53
(1.85)
(2.64)
(2.34)
(1.88)
(0.33)
(1.04)
(1.12)
(1.01)
p(ep)
0.04
-0.02
-0.19
-0.12
0.29
15.76
14.75
15.06
(0.22)
(-0.06)
(-0.53)
(-0.36)
(0.66)
(0.01)
(0.02)
(0.02)
residuals
(perfor-
mance
model)
-0.24
-0.34
(-0.61)
(-0.42)
residuals
(motiva-
tionmodel)
-0.45
-0.40
(-1.12)
(-0.49)
residuals
(full
model)
-0.48
-0.42
(-1.28)
(-0.52)
residuals
(perfor-
mance
model)
2.50***
0.04
(9.14)
(0.06)
residuals
(motiva-
tionmodel)
2.43***
-0.07
(8.71)
(-0.11)
residuals
(full
model)
1.28***
0.10
(5.10)
(0.20)
Nagelkerke'sR
20.01
0.34
0.34
0.15
0.01
0.34
0.34
0.15
N945
351
321
303
945
351
321
303
Allcoe�
cients
are
unstandardized
log-odds.
Z-values
inparentheses.Signi�cance
values:*(p
<.05);**(p
<.01);***(p
<.001).
Variables:B:expectedbene�t;−SD:expectedstatusdecline;psd:expectedim
pact
ofstatusdecline;C:expectedcosts;pep:subjective
expectedprobabilityofeducationalsuccess.
Educationaltransitions:
Models5f-8f=
Abitur;models9f-12f=
university
transitions.
327
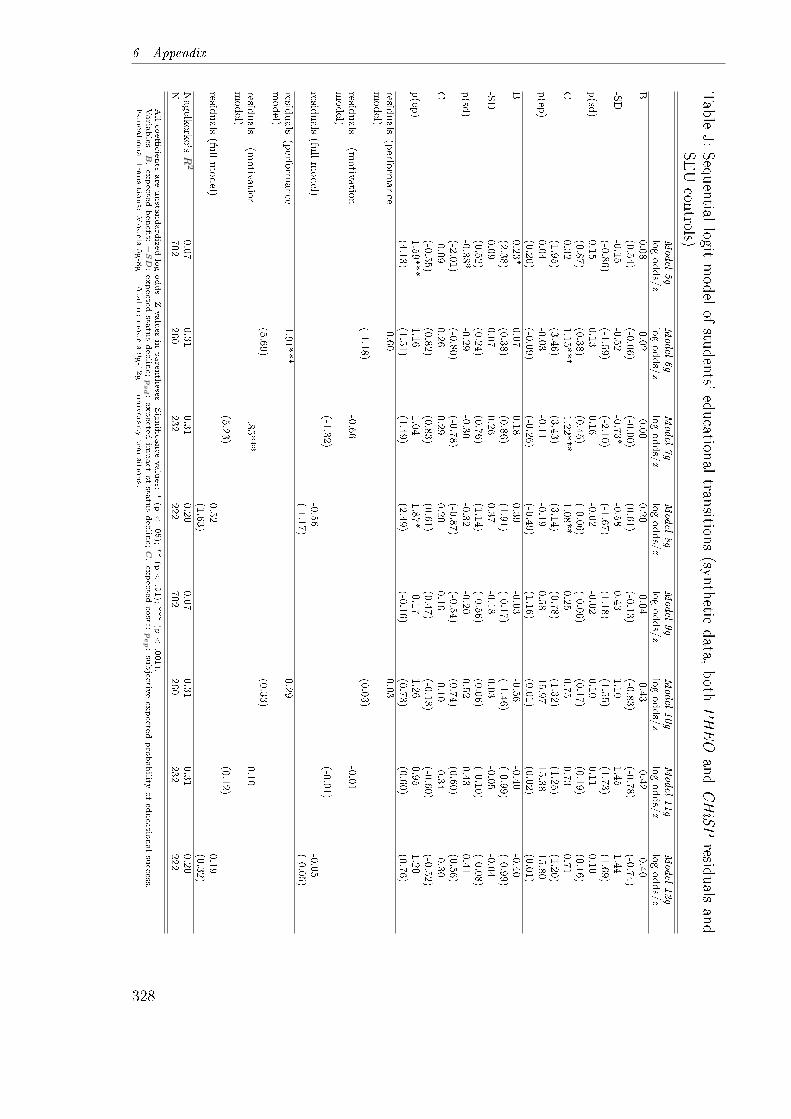
6 Appendix
Table
J:Sequential
logitmodel
ofstudents'
educationaltransitions
(syntheticdata,
both
PHEO
andCHiSP
residualsand
SEUcontrols)M
odel5g
Model6g
Model7g
Model8g
Model9g
Model10g
Model11g
Model12g
log-odds/z
log-odds/z
log-odds/z
log-odds/z
log-odds/z
log-odds/z
log-odds/z
log-odds/z
B0.08
-0.02
-0.00
0.20
-0.04
-0.43
-0.42
-0.40
(0.54)
(-0.06)
(-0.00)
(0.61)
(-0.13)
(-0.83)
(-0.78)
(-0.74)
-SD
-0.15
-0.52
-0.73*
-0.58
0.43
1.10
1.45
1.44
(-0.86)
(-1.59)
(-2.10)
(-1.67)
(1.18)
(1.55)
(1.73)
(1.69)
p(sd
)0.15
0.13
0.16
-0.02
-0.02
0.10
0.11
0.10
(0.87)
(0.38)
(0.45)
(-0.06)
(-0.06)
(0.17)
(0.19)
(0.16)
C0.32
1.15***
1.22***
1.08**
0.25
0.75
0.73
0.71
(1.95)
(3.46)
(3.43)
(3.14)
(0.78)
(1.32)
(1.25)
(1.20)
p(ep
)0.04
-0.03
-0.11
-0.19
0.58
15.97
15.38
15.80
(0.20)
(-0.09)
(-0.26)
(-0.49)
(1.16)
(0.01)
(0.02)
(0.01)
B0.23*
0.07
0.18
0.39
-0.03
-0.56
-0.40
-0.40
(2.38)
(0.38)
(0.86)
(1.91)
(-0.17)
(-1.46)
(-0.99)
(-0.99)
-SD
0.09
0.07
0.26
0.37
-0.18
0.03
-0.05
-0.04
(0.52)
(0.24)
(0.76)
(1.14)
(-0.56)
(0.06)
(-0.10)
(-0.08)
p(sd
)-0.38*
-0.29
-0.30
-0.32
-0.20
0.52
0.43
0.41
(-2.01)
(-0.80)
(-0.78)
(-0.87)
(-0.54)
(0.74)
(0.60)
(0.56)
C-0.09
0.26
0.29
0.20
0.16
-0.10
-0.34
-0.30
(-0.55)
(0.82)
(0.83)
(0.61)
(0.47)
(-0.18)
(-0.60)
(-0.52)
p(ep
)1.59***
1.16
1.04
1.87*
-0.17
1.26
0.95
1.20
(4.13)
(1.51)
(1.49)
(2.49)
(-0.16)
(0.73)
(0.60)
(0.76)
residuals
(perfo
rmance
model)
-0.60
0.03
(-1.18)
(0.03)
residuals
(motiva
tion
model)
-0.66
-0.01
(-1.32)
(-0.01)
residuals(fu
llmodel)
-0.56
-0.05
(-1.17)
(-0.05)
residuals
(perfo
rmance
model)
1.91***
0.29
(5.69)
(0.33)
residuals
(motiva
tion
model)
1.85***
0.10
(5.23)
(0.12)
residuals(fu
llmodel)
0.52
0.19
(1.63)
(0.32)
Nagelk
erke's
R2
0.07
0.31
0.31
0.20
0.07
0.31
0.31
0.20
N702
260
232
222
702
260
232
222
Allcoe�cients
are
unsta
ndardizedlog-odds.
Z-valuesin
parentheses.
Signi�cancevalues:
*(p
<.05);**(p
<.01);***(p
<.001).
Varia
bles:
B:expectedbene�t;
−SD:expectedsta
tusdeclin
e;psd:expectedim
pactofsta
tusdeclin
e;C:expectedcosts;
pep:subjectiv
eexpectedprobability
ofeducatio
nalsuccess.
Educatio
naltra
nsitio
ns:
Models5g-8g=
Abitu
r;models9g-12g=
university
transitio
ns.
328
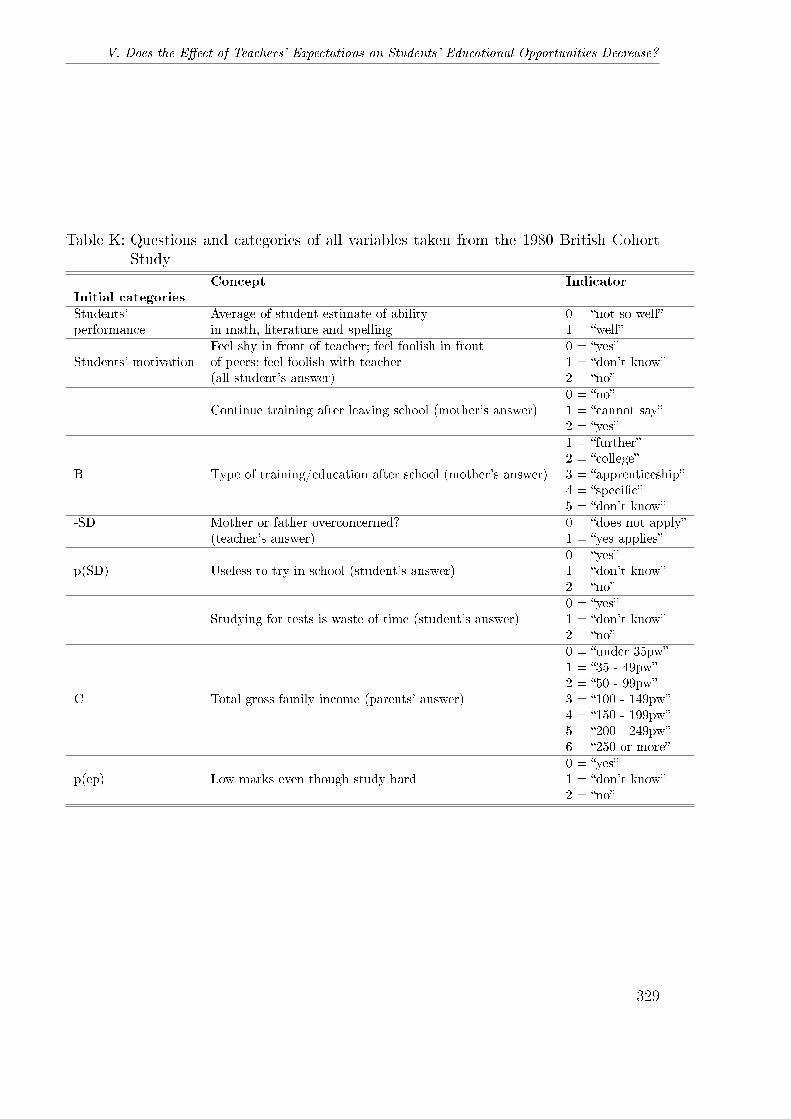
V. Does the E�ect of Teachers' Expectations on Students' Educational Opportunities Decrease?
Table K: Questions and categories of all variables taken from the 1980 British CohortStudy
Concept Indicator
Initial categories
Students' Average of student estimate of ability 0 = �not so well�performance in math, literature and spelling 1 = �well�
Feel shy in front of teacher; feel foolish in front 0 = �yes�Students' motivation of peers; feel foolish with teacher 1 = �don't know�
(all student's answer) 2 = �no�0 = �no�
Continue training after leaving school (mother's answer) 1 = �cannot say�2 = �yes�1 = �further�2 = �college�
B Type of training/education after school (mother's answer) 3 = �apprenticeship�4 = �speci�c�5 = �don't know�
-SD Mother or father overconcerned? 0 = �does not apply�(teacher's answer) 1 = �yes applies�
0 = �yes�p(SD) Useless to try in school (student's answer) 1 = �don't know�
2 = �no�0 = �yes�
Studying for tests is waste of time (student's answer) 1 = �don't know�2 = �no�0 = �under 35pw�1 = �35 - 49pw�2 = �50 - 99pw�
C Total gross family income (parents' answer) 3 = �100 - 149pw�4 = �150 - 199pw�5 = �200 - 249pw�6 = �250 or more�0 = �yes�
p(ep) Low marks even though study hard 1 = �don't know�2 = �no�
329

6 Appendix
Table L: Questions and categories of all variables taken from the 1986 British CohortStudy
0 = �bottom 5%�1 = �well below aver 10%�2 = �below average 20%�
Teachers' expectations Assessment of student's academic ability 3 = �Average 30%�4 = �above average 20%�5 = �well above aver 10%�6 = �top 5%�0 = �fail�1 = �CSE 4�2 = �'O'lev E/'A' E/CSE3�
Students' performance Average grade summer term exam (BCS1986) 3 = �'O'lev D/'A' D/CSE2�4 = �C/CSE 1�5 = �'O'lev C/'A' �6 = �'O'lev B/'A' B�7 = �'O'lev A/'A' A�0 = �very true�
Quiet in classroom and get on with work 1 = �partly true�2 = �not true at all�0 = �very true�
Students' motivation Think homework is a bore 1 = �partly true�2 = �not true at all�0 = �very true�
I don't like school 1 = �partly true�2 = �not true at all�0 = �might do it�
Job aspiration: Career in a profession (need a degree) [student's an-swer]
1 = "joint �rst choice"
B 2 = ��rst choice�Leave reason: always taken for granted (student's answer) 0 = �not stated�
1 = �yes�0 = �not satis�ed�
-SD Satisfaction with child's school progress 1 = �can't say�(mother's answer) 2 = �fairly satis�ed�
3 = �very satis�ed�0 = �many not useful�
Any of your subjects useful in future? (student's answer) 1 = �some are useful�2 = �all are useful�
p(SD) 0 = �very true�Feel school is largely a waste of time (student's answer) 1 = �partly true�
2 = �not true at all�0 = �no�
C Fam troubled by �nance hardshp past year (parents' answer) 1 = �uncertain / don'tknow�2 = �yes�
Leave reason: might be not bright enough 0 = �not stated�p(ep) (student's answer) 1 = �yes�
0 = �very true�Find it di�cult to keep mind on work 1 = �partly true�
2 = �not true at all�
330
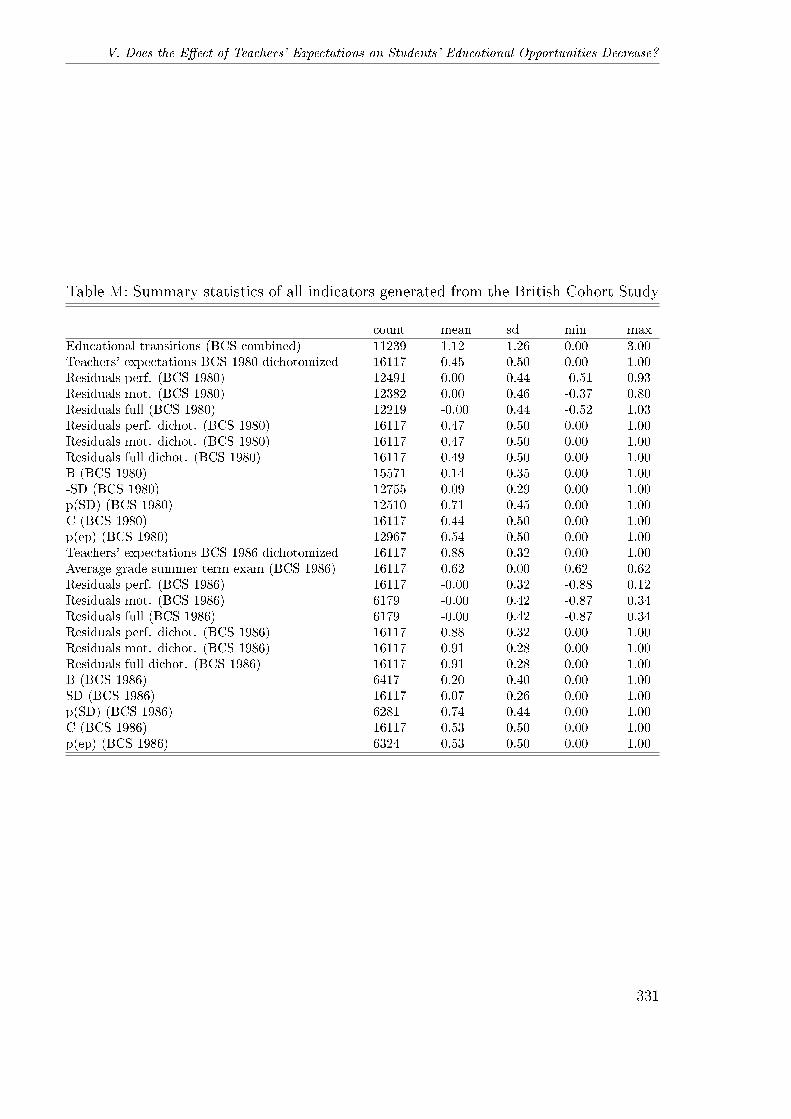
V. Does the E�ect of Teachers' Expectations on Students' Educational Opportunities Decrease?
Table M: Summary statistics of all indicators generated from the British Cohort Study
count mean sd min maxEducational transitions (BCS combined) 11239 1.12 1.26 0.00 3.00Teachers' expectations BCS 1980 dichotomized 16117 0.45 0.50 0.00 1.00Residuals perf. (BCS 1980) 12491 0.00 0.44 -0.51 0.93Residuals mot. (BCS 1980) 12382 0.00 0.46 -0.37 0.80Residuals full (BCS 1980) 12219 -0.00 0.44 -0.52 1.03Residuals perf. dichot. (BCS 1980) 16117 0.47 0.50 0.00 1.00Residuals mot. dichot. (BCS 1980) 16117 0.47 0.50 0.00 1.00Residuals full dichot. (BCS 1980) 16117 0.49 0.50 0.00 1.00B (BCS 1980) 15571 0.14 0.35 0.00 1.00-SD (BCS 1980) 12755 0.09 0.29 0.00 1.00p(SD) (BCS 1980) 12510 0.71 0.45 0.00 1.00C (BCS 1980) 16117 0.44 0.50 0.00 1.00p(ep) (BCS 1980) 12967 0.54 0.50 0.00 1.00Teachers' expectations BCS 1986 dichotomized 16117 0.88 0.32 0.00 1.00Average grade summer term exam (BCS 1986) 16117 0.62 0.00 0.62 0.62Residuals perf. (BCS 1986) 16117 -0.00 0.32 -0.88 0.12Residuals mot. (BCS 1986) 6179 -0.00 0.42 -0.87 0.34Residuals full (BCS 1986) 6179 -0.00 0.42 -0.87 0.34Residuals perf. dichot. (BCS 1986) 16117 0.88 0.32 0.00 1.00Residuals mot. dichot. (BCS 1986) 16117 0.91 0.28 0.00 1.00Residuals full dichot. (BCS 1986) 16117 0.91 0.28 0.00 1.00B (BCS 1986) 6417 0.20 0.40 0.00 1.00SD (BCS 1986) 16117 0.07 0.26 0.00 1.00p(SD) (BCS 1986) 6281 0.74 0.44 0.00 1.00C (BCS 1986) 16117 0.53 0.50 0.00 1.00p(ep) (BCS 1986) 6324 0.53 0.50 0.00 1.00
331

6 Appendix
Table
N:Sequentiallogit
modelof
students'educationaltransitions(British
Cohort
Study,primary
schoolresidualsand
SEU
controls)Model1h
Model2h
Model3h
Model4h
Model5h
Model6h
Model7h
Model8h
Model9h
Model10h
Model11h
Model12h
log-odds/z
log-odds/z
log-odds/z
log-odds/z
log-odds/z
log-odds/z
log-odds/z
log-odds/z
log-odds/z
log-odds/z
log-odds/z
log-odds/z
B0.98***
0.81***
0.81***
0.83***
1.29***
1.08***
1.07***
1.10***
0.16
0.16
0.17
0.17
(12.54)
(10.08)
(10.02)
(10.36)
(13.02)
(10.59)
(10.50)
(10.75)
(1.16)
(1.15)
(1.23)
(1.21)
-SD
0.05
0.05
0.04
0.04
0.07
0.06
0.07
0.06
-0.08
-0.08
-0.08
-0.08
(0.54)
(0.48)
(0.47)
(0.47)
(0.52)
(0.44)
(0.51)
(0.47)
(-0.40)
(-0.40)
(-0.41)
(-0.40)
p(sd
)0.28***
0.21**
0.21***
0.23***
0.39***
0.29**
0.30**
0.32***
-0.61**
-0.61**
-0.61**
-0.61**
(4.38)
(3.28)
(3.30)
(3.57)
(4.17)
(3.04)
(3.11)
(3.38)
(-2.95)
(-2.94)
(-2.93)
(-2.93)
C0.42***
0.36***
0.36***
0.37***
0.56***
0.48***
0.47***
0.49***
0.39**
0.39**
0.39**
0.39**
(7.77)
(6.52)
(6.47)
(6.67)
(7.56)
(6.29)
(6.22)
(6.44)
(3.12)
(3.11)
(3.15)
(3.14)
p(ep)
0.69***
0.58***
0.58***
0.62***
0.63***
0.45***
0.45***
0.49***
-0.15
-0.15
-0.14
-0.14
(10.68)
(8.72)
(8.81)
(9.41)
(6.29)
(4.38)
(4.41)
(4.77)
(-0.72)
(-0.70)
(-0.64)
(-0.66)
resid
uals
(perfo
rmance
model)
0.70***
0.95***
-0.01
(11.76)
(12.07)
(-0.08)
resid
uals
(motiv
atio
nmodel)
0.70***
0.95***
-0.06
(11.87)
(12.17)
(-0.45)
resid
uals(fu
llmodel)
0.62***
0.88***
-0.05
(10.83)
(11.41)
(-0.35)
Nagelkerke's
R2
0.15
0.20
0.20
0.19
0.15
0.20
0.20
0.19
0.15
0.20
0.20
0.19
N6386
6386
6386
6386
6386
6386
6386
6386
6386
6386
6386
6386
Allcoe�cients
are
unsta
ndardizedlog-odds.
Z-valuesin
parentheses.
Signi�cancevalues:
*(p
<.05);**(p
<.01);***(p
<.001).
Varia
bles:
B:expectedbene�t;
−SD:expectedsta
tusdeclin
e;psd:expectedim
pactofsta
tusdeclin
e;C:expectedcosts;
pep:subjectiv
eexpectedprobability
ofeducatio
nalsuccess.
Educatio
naltra
nsitio
ns:
Models1h-4h=
Olevel5h-8h=
Alevel;models9h-12h=
university
transitio
ns.
332
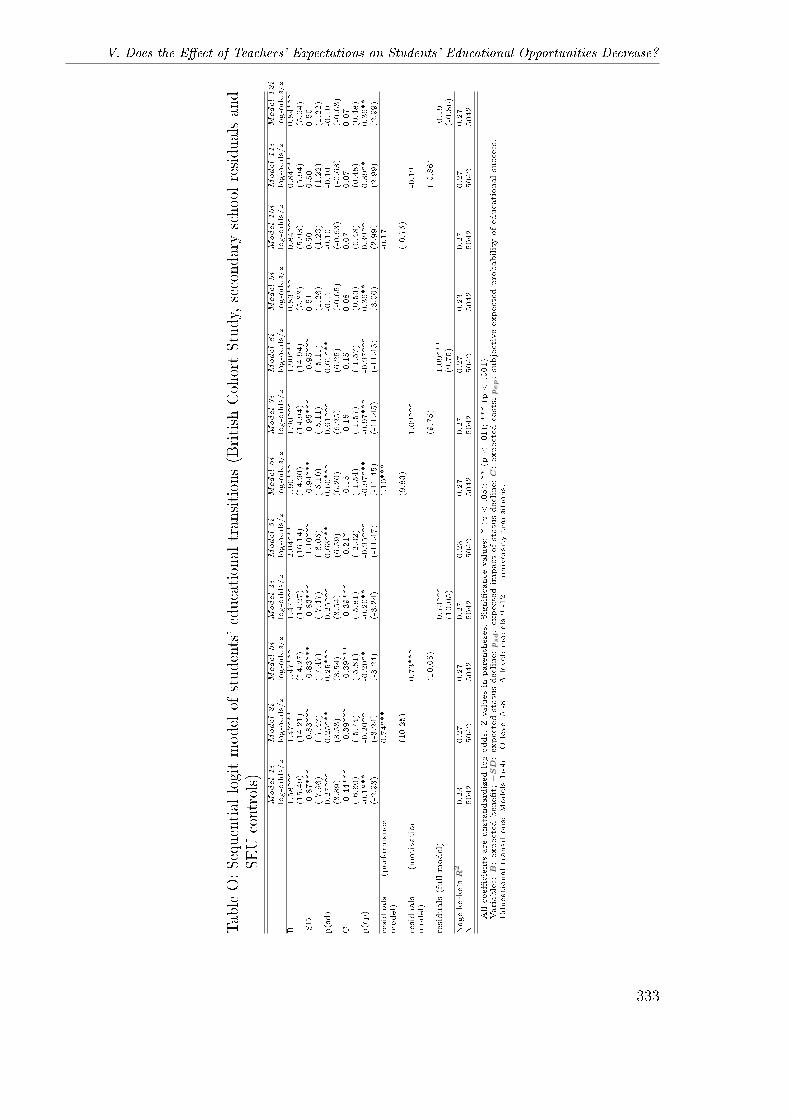
V. Does the E�ect of Teachers' Expectations on Students' Educational Opportunities Decrease?
TableO:Sequential
logitmodelof
students'educationaltransitions(British
CohortStudy,secondaryschool
residualsand
SEUcontrols)
Model1i
Model2i
Model3i
Model4i
Model5i
Model6i
Model7i
Model8i
Model9i
Model10i
Model11i
Model12i
log-odds/z
log-odds/z
log-odds/z
log-odds/z
log-odds/z
log-odds/z
log-odds/z
log-odds/z
log-odds/z
log-odds/z
log-odds/z
log-odds/z
B1.58***
1.47***
1.47***
1.47***
2.04***
1.90***
1.90***
1.90***
0.83***
0.84***
0.84***
0.84***
(15.49)
(14.21)
(14.27)
(14.27)
(16.14)
(14.90)
(14.94)
(14.94)
(5.88)
(5.93)
(5.94)
(5.94)
-SD
-0.87***
-0.83***
-0.83***
-0.83***
-1.10***
-0.94***
-0.95***
-0.95***
0.51
0.50
0.50
0.50
(-7.96)
(-7.47)
(-7.47)
(-7.47)
(-6.05)
(-5.10)
(-5.11)
(-5.11)
(1.26)
(1.23)
(1.22)
(1.22)
p(sd)
0.27***
0.25***
0.25***
0.25***
0.63***
0.60***
0.61***
0.61***
-0.11
-0.10
-0.10
-0.10
(3.89)
(3.53)
(3.54)
(3.54)
(6.59)
(6.20)
(6.25)
(6.25)
(-0.65)
(-0.63)
(-0.63)
(-0.63)
C-0.44***
-0.39***
-0.39***
-0.39***
-0.21*
-0.15
-0.15
-0.15
0.08
0.07
0.07
0.07
(-6.60)
(-5.74)
(-5.81)
(-5.81)
(-2.32)
(-1.54)
(-1.57)
(-1.57)
(0.53)
(0.48)
(0.48)
(0.48)
p(ep)
-0.18**
-0.20**
-0.20**
-0.20**
-0.95***
-0.97***
-0.97***
-0.97***
0.39**
0.39**
0.39**
0.39**
(-2.93)
(-3.24)
(-3.24)
(-3.24)
(-11.47)
(-11.45)
(-11.45)
(-11.45)
(3.00)
(2.99)
(2.99)
(2.99)
residuals
(perform
ance
model)
0.74***
1.10***
-0.17
(10.25)
(9.83)
(-0.75)
residuals
(motivation
model)
0.73***
1.09***
-0.19
(10.05)
(9.75)
(-0.86)
residuals(fullmodel)
0.73***
1.09***
-0.19
(10.05)
(9.75)
(-0.86)
Nagelkerke's
R2
0.23
0.27
0.27
0.27
0.23
0.27
0.27
0.27
0.23
0.27
0.27
0.27
N5042
5042
5042
5042
5042
5042
5042
5042
5042
5042
5042
5042
Allcoe�cients
are
unstandardizedlog-odds.
Z-valuesin
parentheses.
Signi�cancevalues:
*(p
<.05);**(p
<.01);***(p
<.001).
Variables:
B:expectedbene�t;
−SD:expectedstatusdecline;psd:expectedim
pactofstatusdecline;C:expectedcosts;
pep:subjectiveexpectedprobabilityofeducationalsuccess.
Educationaltransitions:
Models1i-4i=
Olevel5i-8i=
Alevel;models9i-12i=
universitytransitions.
333

Curriculum Vitae
Dominik Becker, M.A.
May 16, 1982Date of Birth
Cologne, GermanyPlace of Birth
Technical University of Dortmund Phone: +49 (0)231 755-6203Institute for School Development E-mail: [email protected] Web: http://www.ifs-dortmund.deMartin-Schmeißer-Weg 13 Fax: +49 (0)231 755-7809D - 44227 Dortmund
ContactInformation
Research assistant (full position) in the quantitative evaluation of the researchPositionproject “Ganz In – Mit Ganztag mehr Zukunft. Das neue GanztagsgymnasiumNRW [“Ganz In – All Day-Schools for a Brighter Future. The New All-Day Sec-ondary School in NRW”]
Main activities and responsibilities:• Quantitative assessment of project schools’ educational effectiveness• Design and implementation of quantitative surveys in 31 upper secondary schools
(N ≈ 7.000 students and parents in both 5th and 7th grade, N ≈ 2.000 teachers)• Co-supervision of Bachelor, Diploma/Master, and Doctoral theses• Project coordination• Teaching (statistical methods, philosophy of the social sciences, social action
theory)
EducationOctober 2008 – September 2011
Ph.D. fellow at the Cologne Graduate School in Management, Economics andSocial Sciences
• Thesis title: Pygmalion’s Long Shadow – Determinants and Outcomes ofTeachers’ Evaluations (defended December 5, 2012; summa cum laude)
• Supervisors: Professor em. Heiner Meulemann, Professor Rolf Becker• Area of study: Sociology of Education
October 2005 – February 2006
Semester abroad at the University of Fribourg (funded by ERASMUS and Stu-dienstiftung des Deutschen Volkes)
October 2002 – February 2008
Magister Artium, Sociology, Philosophy and German Literature
• Thesis Topic: Politische Homogenitat oder Heterogenitat der Leserschaft vonQualitatszeitungen? Eine Sekundaranalyse der Media-Analyse-Daten 2005[Political homogeneity or heterogeneity of quality paper readership? A sec-ondary analysis of the German Media Analysis data 2005]
• Supervisors: Professor em. Heiner Meulemann, Professor em. Jurgen Friedrichs• Area of Study: Communication science / media sociology• Overall grade: very good (1.2)
ResearchExperience October 2011 –
Research assistant (full position) at the Institute for School Development Re-search of the Technical University of Dortmund in the quantitative evaluation ofthe research project “Ganz In – Mit Ganztag mehr Zukunft. Das neue Ganz-tagsgymnasium NRW [“Ganz In – All Day-Schools for a Brighter Future. TheNew All-Day Secondary School in NRW”], a joint project initiated by StiftungMercator, Institut fur Schulentwicklungsforschung Dortmund – representing thethree universities in the Ruhr region – and the Ministerium fur Schule und Weit-erbildung des Landes Nordrhein-Westfalen [the Ministery for School and FurtherEducational of the German Federal State of North Rhine-Westphalia].
April – September 2008
Research assistant at the Institut fur Berufs- und Weiterbildung (University ofDuisburg-Essen). Cooperation in the research project Lehrerurteile im Lebenslauf[Teacher Evaluations in the Life Course], funded by the German Research Asso-ciation (DFG). Research Report: Birkelbach, K. and R. Dobischat (eds., 2010):Lehrerurteile im Lebensverlauf. Abschlussbericht an die DFG zum Projekt DO325 4/1. Essen: University of Duisburg-Essen.
January 2007 - March 2008
Student assistant at the Medienwissenschaftliches Lehr- und Forschungszentrum(University of Cologne). Cooperation in the research project ElektronischerDatenreport Media Analyse: Lesen von Zeitungen und Zeitschriften in Deutsch-land von 1954 bis 2002 [Electronic Data Report Media Analysis: Usage of News-papers and Magazines in Germany, 1954-2002], funded by the German FederalMinistry of Education and Research (BMBF).
October 2004 – August 2005
Universitary research practical at the Research Institute for Sociology, Universityof Cologne (supervisor: Prof. Michael Wagner). Research report: Becker, D. andSt. Lang (2005): Determinanten von Schulverweigerung im Internationalen Ver-gleich [A Cross-National Comparison of Determinants of School Absenteeism].Unpublished Manuscript, University of Cologne.
ProfessionalExperience October 2001 - June 2002
Temporarily employed at Axa Insurance Company.
• Field: Internal preparation of Holocaust compensations
September 2001
Civilian service at the Arbeiter-Samariter-Bund (ASB) Cologne.
• Field: Assistance with transport
Stipends &Awards July 2011
Travel allowance by the German Academic Exchange Service (DAAD) for theconference talks “Analyzing social and media change with cross-classified random-effects APC models”, “Creating artificial student cohorts by statistical matchingof distinct educational data sources”, and “Analyzing contextual-level outcomesin multilevel models”, presented at at the 4th Conference of the European SurveyResearch Association (ESRA), Lausanne, July 19, 2011

September 2010
Best paper proposal award by the Section on Methods of the German Associa-tion of Publication and Communication Research (DGPuK) for the conferencetalk “Nimmt die Lesewahrscheinlichkeit von Qualitatszeitungen mit der Bildung-sexpansion zu? Eine Mehrebenen-Anayse der Media-Analyse-Daten 1977-2006”[Does educational expansion foster the probability of reading quality papers? Amultilevel analysis of the German Media Analysis data 1977-2005] (September24, 2010, Vienna; with J. Hagenah)
August 2010
Travel allowance by the German Academic Exchange Service (DAAD) for theconference talk “The impact of teachers’ expectations on educational opportuni-ties in the life course - An ignored inequality?” (presented at at the XVII ISAWorld Congress of Sociology, July 17, 2010, Gothenburg)
Mai 2010
Travel award by the Modern Austrian Literature and Culture Association (MALCA)for the conference talk “Peter Handkes ’Bildverlust’ im Kontext einer systemthe-oretischen Interpretation seines fruhen Motivs der ’Innenwelt der Außenwelt derInnenwelt”’ (Mai 24, 2010, Vienna)
October 2008 – September 2011
PhD scholarship by the Cologne Graduate School in Management, Economics andSocial Sciences (funded by the federal government of North Rhine-Westphalia)
August 2006
Polish language course at Jagiellonen University of Krakow, funded by the Stu-dienstiftung des deutschen Volkes [German National Academic Foundation]
October 2005 – February 2006
Foreign exchange scholarship of the European Union (Erasmus grant). Addi-tional foreign exchange scholarship by the Studienstiftung des deutschen Volkes[German National Academic Foundation]
March 2005 – January 2008
Full scholarship of the Studienstiftung des deutschen Volkes [German NationalAcademic Foundation]
Inequalities in educational opportunities and school effectivenessPrimaryResearchInterests
Rational choice theory and analytical sociologyStatistical methods in social sciencesPolitical sociology, values and attitudesCommunication researchPhilosophy of the social sciences
TeachingExperience Summer term 2013
Research practical (master level): Secondary analysis of the “Ganz In” data(with S. Lindemann, J. Schwanenberg & D. Winkelsett).
Winter term 2012
PhD course “Wissenschaftstheorie” [Philosophy of the social sciences]. One-dayblock course taught in the context of the mandatory PhD program of the Insti-tute for School Development Research of the Technical University of Dortmund(with S. Lindemann).
PhD course “Qualitative und quantitative Methoden, Triangulation” [Qualita-tive and quantitative methods, mixed method design]. Three-day block coursetaught in the context of the mandatory PhD program of the Institute for SchoolDevelopment Research of the Technical University of Dortmund (with A. Walze-bug).
Master-level course “Wissenschafts- und handlungstheoretische Grundlagen em-pirischer Bildungsforschung” [Philosophy of the social sciences, social action the-ory, and empirical educational research]. Weekly seminar.
Summer term 2012
PhD course “Von der Forschungsfrage zur Statistik – Workshop quantitativeMethoden” [From research questions to coefficients: Workshop quantitative meth-ods of analysis]. Block course taught at the official inception of the research fo-rum at the Dortmunder Kompetenzzentrum fur Lehrerbildung und Lehr-/Lern-forschung of the Technical University of Dortmund (with K. Drossel).
Summer term 2008
Bachelor course “Raumsoziologie” [Sociology of Space]. Block course taught atthe Institute for urban district development, social casework and welfare men-toring of the University of Duisburg-Essen
Membership inAssociations
ISA Research Committee on Social Stratification and Mobility (RC28 of theInternational Sociological Association, ISA)
European Survey Research Association (ESRA)
ISA Research Committee on Logic and Methodology (RC33 of the InternationalSociological Association, ISA)
Association for Educational Assessment (AEA) Europe
American Educational Research Association (AERA), Division D “Measurementand Research Methodology”
Skills
Languages
• German: Native• English: Fluent• French: Advanced• Polish: Basic – intermediate
IT
• Operating systems: Windows, Linux, OSX• Text and office processing: MS Office, OpenOffice, LATEX• Statistical packages: Stata, SAS, SPSS, R, AMOS, Mplus, Conquest• Referencing software: Mendeley, Zotero, Citavi
Publications Becker, D. (forthcoming): The impact of teachers’ expectations on students’ edu-cational inequality in the life course – An empirical test of a subjective expectedutility explanation. Forthcoming in Rationality & Society.
Becker, D. & K. Birkelbach (forthcoming): Lehrer als ’Gatekeeper’? Eine theoretis-che Annaherung an Determinanten und Folgen von Lehrererwartungen [Teachersas ’gate-keepers’? A theoretical approximation towards determinants and out-comes of teachers’ evaluations]. To appear in: Schulze, A. & R. Becker (eds.):Bildungskontexte. Strukturelle Vorraussetzungen und Ursachen ungleicher Bil-dungschancen. Wiesbaden: VS Verlag.
Hagenah, J., D. Gilles & D. Becker (2013): Uberregionale Tageszeitungen: Eineaussterbende Informationsressource? [Nationwide Newspapers: Information re-sources in danger of extinction?] In: Ohly, H.-P. (Ed.): Wissen – Wissenschaft– Organisation. Proceedings der 12. Tagung der Deutschen Sektion der Interna-tionalen Gesellschaft fur Wissensorganisation, Bonn, 19. bis 21. Oktober 2009.Wurzburg: Ergon Verlag, pp. 98-105.
Schwanenberg, J., N. McElvany, D. Becker & N. Pfuhl (2013): Elternpartizipationan Grundschulen unter Berucksichtigung des sozialen und kulturellen Familien-hintergrunds [Parental involvement in the context of social and cultural familybackgrounds]. In: McElvany, N., M. M. Gebauer, W. Bos & H. G. Holtappels(Eds.): Sprachliche, kulturelle und soziale Heterogenitat in der Schule als Heraus-forderung und Chance der Schulentwicklung. IfS-Jahrbuch der Schulentwicklung,Bd. 17. Weinheim: Juventa, pp. 150-180.
Becker, D. & J. Hagenah (2012): Zur Anwendbarkeit von Mehrebenenmodellenbei der integrativen Untersuchung von Alters-, Perioden- und KohorteneffektenExemplarische Untersuchungen mit den Media-Analyse-Daten 1977-2006 [The useof multilevel models for simultaneous analyses of age, period and cohort effects].In: Stark, B. and M. Magin (eds.): Methodische Herausforderungen komparativerForschungsansatze. Koln: Herbert von Halem, pp. 211-238.
Hagenah, J. & D. Becker (2012): Uber Nutzungswahrscheinlichkeiten und fusion-ierte Datensatze. Werbetragerkontaktchancen als intermedial vergleichbare Medi-enwahrungen in Deutschland [Usage probabilities and data fusion. Media contactprobabilities as an intermedial ’currency’ in Germany]. In: Hagenah, J. & H.Meulemann (eds.): Mediatisierung der Gesellschaft? Munster: Lit Verlag, pp.99-117.
Becker, D. (2011): Konsonante oder dissonante Nutzung von Qualitatszeitungen?Eine Sekundaranalyse der Media-Analyse-Daten 2005 [Consonant or dissonantusage of quality papers? A secondary analysis of the German Media Analysisdata 2005]. In: Haschke, J.F. & A. Moser (eds.): Politik – Deutsch, Deutsch– Politik: Aktuelle Trends und Forschungsergebnisse. Beitrage zur 6. Tagungdes Dusseldorfer Forum Politische Kommunikation (DFPK). Berlin: Frank undTimme, pp. 199-222.
Becker, D. & K. Birkelbach (2010): Intelligenz und Schulleistung als Kontextmerk-male: Big-Fish-Little-Pond- oder Reflected-Glory-Effekt? Eine Mehrebenen-Ana-lyse von Lehrerurteilen [Intelligence and school achievement as contextual-levelpredictors: Big-Fish-Little-Pond- or Reflected-Glory-Effect? A multilevel anal-ysis of teachers’ evaluations]. In: Becker, T., K. Birkelbach, J. Hagenah & U.
Rosar (eds.): Komparative empirische Sozialforschung. Wiesbaden: VS Verlag,pp. 113-141.
Becker, D. (2009): Dahinter steckt meistens ein kluger Kopf. Mehr und dissonan-tere Leitmedienlekture infolge der Bildungsexpansion? [Did educational expansionlead to more frequent and more dissonant usage of quality papers?] In: Muller,D., A. Ligensa & P. Gendola (eds.): Alte und neue Leitmedien, Vol. 1. Bielefeld:Transcript Verlag, pp. 199-224.
Becker, D. (2008): Qualitatszeitungen – regionale Bindungseffekte trotz uberregio-naler Ausrichtung? Ein Langsschnittvergleich der Media-Analyse-Daten 1985,1995 und 2005 [Quality papers – regional recruitment of readership in face ofnationwide demand?]. In: Hagenah, J. & H. Meulemann (eds.): Alte und neueMedien. Zum Wandel der Medienpublika in Deutschland seit den 1950er Jahren.Munster: Lit Verlag, pp. 61-80.
FullConferencePapers
Becker, D., A.S. Willems, R. Springer & W. Bos (2013): A doubly-latent modelof class-level social status and achievement on students’ academic self-concept.Paper presented at the Annual Meeting of the American Educational ResearchAssociation (AERA), April 27, 2013, San Francisco.
Becker, D., J. Schwanenberg & D. Winkelsett (2012): School resources, inequalityin educational opportunities, and school effectiveness – Multilevel analyses of aGerman upper-track secondary school sample. Paper presented at the 13th con-ference of the Association for Educational Assessment (AEA) Europe, November9, 2012, Berlin.
Becker, D., K. Drossel, J. Schwanenberg, N. Pfuhl & H. Wendt (2012): Compar-ing IRT, CFA and LCA for Assessing the Social Composition of School Classes.Paper presented at the RC33 Eighth International Conference on Social ScienceMethodology, July 10, 2012, Sydney.
Schwanenberg, J., D. Becker, N. McElvany, N. Pfuhl & R. Springer (2012): Parents’engagement in the school context – An analysis of areas of engagement, differ-ences in intensity, and relevant motivational aspects within an expectancy-valueframework. Paper presented at the 2012 Annual Meeting of the American Edu-cational Research Association, April 16, 2012, Vancouver (paper presented by N.McElvany).
Becker, D. (2011): Creating artificial student cohorts by statistical matching ofdistinct educational data sources. Paper presented at the fourth Conference ofthe European Survey Research Association (ESRA), July 19, 2011, Lausanne.
Becker, D. (2011): Does the effect of teachers’ expectations on students’ educationalopportunities decrease over educational transitions? A statistical matching ap-proach. Paper presented at the 2011 Spring Meeting of the ISA RC28 on SocialStratification and Mobility, April 14, 2011, Essex.
Becker, D., W. Breustedt & C. Zuber (2011): Citizens, elites, and the democraticgame. A two-step HLM analysis of democratic stability. Paper presented at theECPR-IPSA Joint Conference Whatever happened to North-South? February 18,2011, Sao Paulo (Paper presented by C. Zuber).
Manuscripts inPreparation
Becker, D., A.S. Willems & W. Bos (accepted): Referenzgruppeneffekte im Mehr-ebenen-Strukturgleichungsmodell [Reference-group effects in multilevel structuralequation models]. To appear in: Holtappels, H.-G. & M. Pfeifer (eds.): Jahrbuchder Schulentwicklung 2014 (Jahrbuch 18). Weinheim: Juventa.
Becker, D., K. Drossel, J. Schwanenberg, H. Wendt & W. Bos (submitted): DerSozialindex: Theoretische Fundierung und forschungspraktische Relevanz fur die
Erfassung der Schulerkomposition von Gymnasien [The social composition in-dex: theoretical foundation and practical relevance for German upper-secondaryschools’ social composition]. To appear in: Grooth-Wilken, B., K. Isaac and J.-P.Schrapler (eds.): “Sozialindex – Modelle und Anwendungsgebiete” (working title).Munster: Waxmann.
Becker, D., R. Strietholt, J. Schwanenberg & W. Bos (submitted): Ganztags-schule– ganz gut? [All-day school – a success story?] To appear in: Schulte, D. (ed.):Zukunft des Lernens. Paderborn: Wilhelm Fink Verlag.
Working Papers Becker, D. & K. Birkelbach (2011): Teachers’ evaluations and the definition of thesituation in the classroom. CGS Working Paper Series No. 02-04. CologneGraduate School in Management, Economics and Social Sciences.
Becker, D. (2010): The impact of teachers’ expectations on students’ educationalopportunities in the life course. CGS Working Paper Series No. 01-07. CologneGraduate School in Management, Economics and Social Sciences.
Becker, D. (2007): Politische Homogenitat oder Heterogenitat der Leserschaft vonQualitatszeitungen? Eine Sekundaranalyse der Media-Analyse-Daten 2005 [Polit-ical homogeneity or heterogeneity of quality paper readership? A cross-sectionalanalysis of the German Media Analysis data 2005]. Unpublished Magister Thesis,Seminar fur Soziologie, University of Cologne.
Becker, D. & St. Lang (2005): Determinanten von Schulverweigerung im Inter-nationalen Vergleich [A Cross-National Comparison of Determinants of SchoolAbsenteeism]. Unpublished research report, University of Cologne.
Symposia andconferencesessions
Becker, D. (2013): Generalized Latent Variable Modeling. Conference session orga-nized for the 5th European Survey Research Association (ESRA) conference, July18, 2013, Ljubljana.
Becker, D. (2013): Substantive studies using cross-national data. Conference sessionaccepted at the 5th European Survey Research Association (ESRA) conference,July 16, 2013, Ljubljana.
Becker, D. & K. Drossel (2012): Motivation in the teaching profession and beyond.Symposium organized for the 2012 International Conference of Motivation (ICM)of the Special Interest Group on Motivation and Emotion (SIG 8) of the EuropeanAssociation for Research on Learning and Instruction (EARLI), August 28, 2012,Frankfurt a.M.
AcceptedAbstracts
Becker, D., A.S. Willems & W. Bos (accepted): Schuleffektivitat und nicht-kognitiveOutcomes - Neue Erkenntnisse aus einer aktuellen Panelstudie [School effective-ness and non-cognitive outcomes - new evidence from current panel data]. Ab-stract accepted at the 78th meeting of the German Association of Empirical Ped-agogic Research (AEPF), September 25-27, Dortmund.
Schwanenberg, J., D. Becker, W. Bos & N. McElvany (accepted): Warum engagierensich Eltern in der Schule ihres Kindes und zu Hause? Eine Analyse der Motiveunter Anwendung des Erwartungs-Wert-Modells [Why do parents become involvedat school and at home? An expectancy-value analysis of parental motives]. Ab-stract accepted at the 78th meeting of the German Association of Empirical Ped-agogic Research (AEPF), September 25-27, Dortmund.
Winkelsett, D., A.S. Willems, D. Becker & W. Bos (accepted): Der Big-Fish-Little-Pond-Effekt: Moderation durch Dimensionen des sozialen Selbstkonzepts [The BigFish Little Pond effect: Moderation by dimensions of students’ social self-concept].Abstract accepted at the 78th meeting of the German Association of EmpiricalPedagogic Research (AEPF), September 25-27, Dortmund.
Becker, D., A.S. Willems, R. Springer & W. Bos (accepted): Analyzing reference-group effects in secondary science education by using multilevel latent models.Abstract accepted at the 15th Biennial Conference of the European Associationfor Research on Learning and Instruction (EARLI), August 27-31, 2013, Munich.
ConferenceTalks
Becker, D. & Schwanenberg, J. (2013): Multiple-group comparison and differentialitem functioning: Comparing two methods for assessing measurement invariance.Talk presented at the 5th European Survey Research Association (ESRA) confer-ence, July 18, 2013, Ljubljana.
Becker, D., T. Beckers, K. Birkelbach & U. Tranow (2013): The frogs and props ofthe social sciences: A plea for the advancement of mechanism-type explanations in(multilevel) educational and survey research. Talk presented at the 5th EuropeanSurvey Research Association (ESRA) conference, July 18, 2013, Ljubljana.
Becker, D., A.S. Willems, R. Springer & W. Bos (2013): Big-Fish-Little-Pondoder Reflected-Glory-Effekt? Referenzgruppeneffekte von Leistungskontext undsozialer Komposition auf das akademische Selbstkonzept im Mehrebenenstruk-turgleichungsmodell [Big-Fish-Little-Pond or Reflected-Glory Effect? Reference-group effects of class-level achievement and social composition on academic self-concept in a multilevel-SEM framework]. Talk presented at the first conferenceof the Gesellschaft fur Empirische Bildungsforschung (GEBF), March 11, 2013,Kiel.
Becker, D. & J. Schwanenberg (2012): Multiple Group Comparisons vs. Differen-tial Item Functioning: Ein Vergleich von zwei Verfahren zur Uberprufung vonMessinvarianz am Beispiel Elternpartizipation [Multiple Group Comparisons vs.Differential Item Functioning: A review of two approaches assessing measurementinvariance with an application to parent involvement]. Talk presented at the 77th
meeting of the German Association of Empirical Pedagogic Research (AEPF),September 10, 2012, Bielefeld.
Becker, D. & B. Glesemann (2012): Der Zusammenhang zwischen schulischer Kom-position, dem Einsatz von Instrumenten individueller Forderung und Chancen-(un)gleichheit [The relationship between school composition, students’ individualpromotion, and educational (in)equality]. Talk presented at the 77th meeting ofthe German Association of Empirical Pedagogic Research (AEPF), September 11,2012, Bielefeld.
Lindemann, S., D. Becker & J. Schroder (2012): Individuelle Forderung, akade-misches Selbstkonzept und Schulerleistungen in Abhangigkeit von der Prozess-qualitat des gebundenen Ganztags [Individual promotion, academic self-conceptand student achievement in context of teaching quality in full-day education]. Talkpresented at the 77th meeting of the German Association of Empirical PedagogicResearch (AEPF), September 11, 2012, Bielefeld (presented by S. Lindemann andJ. Schroder).
Winkelsett, D. & D. Becker (2012): Kooperation zwischen Lehrkraften und weiterempadagogisch tatigem Personal: Schulstrukturelle Determinanten und Schulerleis-tungseffekte [Cooperation between teachers and school’s pedagogic staff: Struc-tural determinants on school level and student achievement outcomes]. Talk pre-sented at the 77th meeting of the German Association of Empirical PedagogicResearch (AEPF), September 11, 2012, Bielefeld.
Drossel, K., J. Schwanenberg & D. Becker (2012): Motivational prerequisites ofteacher cooperation. Talk presented at the 2012 International Conference of Mo-tivation (ICM) of the Special Interest Group on Motivation and Emotion (SIG 8)of the European Association for Research on Learning and Instruction (EARLI),August 28, 2012, Frankfurt a.M.
Schwanenberg, J., N. McElvancy, D. Becker, N. Pfuhl & W. Bos (2012): Zusamme-narbeit von Eltern und Schule – Formen und Umfang [An analysis of both formsand extent of parent-teacher collaboration]. Talk presented at the 23. Kongressder Deutschen Gesellschaft fur Erziehungswissenschaft (DGfE), March 12, 2012,Osnabruck.
Becker, D. & J. Hagenah (2011): Analyzing social and media change with cross-classified random-effects APC models. Talk presented at the fourth Conference ofthe European Survey Research Association (ESRA), July 22, 2011, Lausanne.
Becker, D., W. Breustedt & C. Zuber (2011): Analyzing contextual-level outcomesin multilevel models. Talk presented at the fourth Conference of the EuropeanSurvey Research Association (ESRA), July 21st, 2011, Lausanne.
Hagenah, J. & D. Becker (2010): Uber Nutzungswahrscheinlichkeiten und fusion-ierte Datensatze. Werbetragerkontaktchancen als intermedial vergleichbare Medi-enwahrungen in Deutschland [Usage probabilities and data fusion. [Media contactprobabilities as an intermedial ’currency’ in Germany]. Talk presented at the 3rd
MLFZ Workshop “Mediatisierung der Gesellschaft?”, November 19, Cologne.
Becker, D. & J. Hagenah (2010): Nimmt die Lesewahrscheinlichkeit von Qualitats-zeitungen mit der Bildungsexpansion zu? Eine Mehrebenen-Anayse der Media-Analyse-Daten 1977-2006 [Does educational expansion foster the probability ofreading quality papers? A multilevel analysis of the German Media Analysisdata 1977-2005]. Talk presented at the 3rd MLFZ Workshop “Mediatisierung derGesellschaft?”, November 19, Cologne.
Becker, D. (2010): Pornografisierung, Sakularisierung und Wertewandel. Eine Mehr-ebenen-Analyse der Media-Analyse-Daten 1954-2006 [Pornographization, secular-ization and value change. A multilevel analysis of the German media analysis data1954-2006]. Talk presented at the Joint Conference of the German Association ofMedia Pedagogy and Culture of Communication (GMK) and the German Associa-tion of Publication and Communication Research (DGPuK) on ’Pornografisierungvon Gesellschaft!?’, October 29, 2010, Cologne.
Becker, D. & J. Hagenah (2010): Nimmt die Lesewahrscheinlichkeit von Qualitats-zeitungen mit der Bildungsexpansion zu? Eine Mehrebenen-Anayse der Media-Analyse-Daten 1977-2006 [Does educational expansion foster the probability ofreading quality papers? A multilevel analysis of the German media analysis data1977-2005]. Talk presented at the 12th Annual Meeting of the section on methodsof the German Association of Publication and Communication Research (DG-PuK), September 24, 2010, Vienna.
Becker, D. & K. Birkelbach (2010): The impact of teachers’ expectations on students’educational opportunities in the life course. Talk presented at the XVII ISA WorldCongress of Sociology, July 17, 2010, Gothenburg.
Becker, D. (2010): The impact of teachers’ expectations on educational opportunitiesin the life course - An ignored inequality? Talk presented at the internationalconference Higher education and beyond – Inequalities regarding entrance to highereducation and educational credentials, July 6, 2010, Monte Verita.
Becker, D. (2010): Peter Handkes ’Bildverlust’ im Kontext einer systemtheoretischenInterpretation seines fruhen Motivs der ’Innenwelt der Außenwelt der Innenwelt’.Talk presented at the Annual Meeting of the Modern Austrian Literature andCulture Association, Mai 24, 2010, Vienna.
Becker, D. (2010): Politische Homogenitat oder Heterogenitat der Leserschaft vonQualitatszeitungen? [Political homogeneity or heterogeneity of quality paper read-ership?] Talk presented at the 6. Dusseldorfer Forum Politische Kommunikation,April 10, 2010, Schloss Mickeln (Dusseldorf).
Becker, D. & K. Birkelbach (2009): Intelligenz und Schulleistung als Kontextmerk-male: Big-Fish-Little-Pond- oder Reflected-Glory-Effekt? [Intelligence and schoolachievement as contextual-level predictors: Big-Fish-Little-Pond- or Reflected-Glory-Effect?] Talk presented at the Symposium Komparative empirische Sozial-forschung, October 31, 2009, Cologne.
Hagenah, J., Becker, D. & Gilles, D. (2009): Uberregionale Tageszeitungen: Eineaussterbende Informationsressource? [Nationwide Newspapers: Information re-sources in danger of extinction?] Talk presented at the 12th Conference of the In-ternational Society for Knowledge Organization (ISKO), October 21, 2009, Bonn.
Becker, D. (2009): Referenzgruppeneffekte als Determinanten des Bildungserfolgs:Ein Mehrebenen-Pfadmodell auf Basis des Kolner Gymnasiasten-Panels 1969/1970,1985 & 1997 [Reference group effects as determinants of educational success: Ev-idence from a multilevel path analysis]. Talk presented at the 73th meeting ofthe German Association of Empirical Pedagogic Research (AEPF), September 29,2009, Bochum.
Hagenah, J., D. Becker & M. Ehrenberg (2009): Werbetragerkontaktchancen alsintermediale Medienwahrung [Media contact probabilities - an intermedial ’cur-rency’]. Talk presented at the Conference “State of the Art und Zukunft derMedia- und Werbungsforschung”, Annual Meeting of the Swiss Association ofCommunication and Media Research (SGKM), March 26, 2009, Zurich.
Becker, D., J. Hagenah & M. Ehrenberg (2008): Von der Nutzungshaufigkeit zurKontaktwahrscheinlichkeit. Nutzungschancen als dominierende Kennziffern in derMedia- bzw. Werbeplanungspraxis im Validitatstest [From usage frequencies tocontact probabilities. A validity test of convenient parameters in media and ad-vertisement research]. Talk presented at the Annual Meeting of the section onmethods of the German Association of Publication and Communication Research(DGPuK), September 18, 2008, Bad Tolz.
Becker, D. (2007): Konsonante und dissonante Leitmediennutzung am Beispiel vonQualitatszeitungen. [Consonant and dissonant usage of quality papers]. Talk pre-sented at the Second MLFZ-Workshop “Alte und Neue Medien - Zum Wandel derMedienpublika in Deutschland seit den 1950er Jahren”, MedienwissenschaftlichesLehr- und Forschungszentrum, October 5, 2007, Cologne.