PY2N20 Material Properties and Phase Diagrams
28
PY2N20-4 PY2N20 Material Properties and Phase Diagrams Lecture 4 P. Stamenov, PhD School of Physics, TCD
Transcript of PY2N20 Material Properties and Phase Diagrams

PY2N20-4
PY2N20
Material Properties and
Phase Diagrams
Lecture 4
P. Stamenov, PhD
School of Physics, TCD

Elastic means reversible!
Elastic Deformation
1. Initial 2. Small load 3. Unload
F d
bonds
stretch
return to
initial
F
d
Linear- elastic
Non-Linear- elastic

Plastic means permanent !
Plastic Deformation (Metals)
F
d
linear elastic
linear elastic
d plastic
1. Initial 2. Small load 3. Unload
planes
still
sheared
F
d elastic + plastic
bonds
stretch
& planes
shear
d plastic

Stress has units:
N/m2 or Pa
Engineering Stress
• Shear stress, t:
Area, A
F t
F t
F s
F
F
F s
t = F s
A o
• Tensile stress, s:
original area
before loading
Area, A
F t
F t
s = F t
A o 2 m
N or = Pa

• Tensile strain: • Lateral strain:
• Shear strain:
Strain is always
dimensionless.
Engineering Strain
q
90º
90º - q y
x q g = x/y = tan
e = d
L o
- d e L = L
w o
Adapted from Fig. 6.1 (a) and (c), Callister 7e.
d /2
d L /2
L o w o

Stress-Strain Testing
• Typical tensile test
machine
Adapted from Fig. 6.3, Callister 7e. (Fig. 6.3 is taken from H.W.
Hayden, W.G. Moffatt, and J. Wulff, The Structure and Properties of
Materials, Vol. III, Mechanical Behavior, p. 2, John Wiley and Sons,
New York, 1965.)
specimen extensometer
• Typical tensile
specimen
Adapted from
Fig. 6.2,
Callister 7e.
gauge length

Linear Elastic Properties
• Modulus of Elasticity, E: (also known as Young's modulus)
• Hooke's Law:
s = E e s
Linear-
elastic
E
e
F
F simple tension test

Poisson's ratio, n
• Poisson's ratio, n:
Units:
E: [GPa] or [psi]
n: dimensionless
n > 0.50 density increases
n < 0.50 density decreases (voids form)
eL
e
- n
e n = -
L
e
metals: n ~ 0.33
ceramics: n ~ 0.25
polymers: n ~ 0.40

Mechanical Properties
Slope of stress-strain plot (which is proportional to
the elastic modulus) depends on bond strength in
metals
Adapted from Fig. 6.7,
Callister 7e.

Anisotropy – Crystals and Textures
11 12 13
21 22 23
31 32 33
s s s
s s s
s s s
xx xy xz
yx yy yz
zx zy zz
s s s
s s s
s s s
1 11 12 13 1
2 21 22 23 2
3 31 32 33 3
T n
T n
T n
s s s
s s s
s s s
or
x xy xz
xy y yz
xz yz z
s t t
t s t
t t s
Tensor
For an arbitrary direction
Not all components are independent – the tensor is symmetric!
Just for an idea – detailed understanding is not required…

• Elastic Shear
modulus, G:
t G
g t = G g
Other Elastic Properties
simple
torsion
test
M
M
• Special relations for isotropic materials:
2(1 + n)
E G =
3(1 - 2n)
E K =
• Elastic Bulk
modulus, K:
pressure
test: Init.
vol =Vo.
Vol chg.
= V
P
P P P = - K
V V o
P
V
K V o

Metals
Alloys
Graphite
Ceramics
Semicond
Polymers Composites
/fibers
E(GPa)
Based on data in Table B2,
Callister 7e.
Composite data based on
reinforced epoxy with 60 vol%
of aligned
carbon (CFRE),
aramid (AFRE), or
glass (GFRE)
fibers.
Young’s Moduli - Comparison
109 Pa
0.2
8
0.6
1
Magnesium,
Aluminum
Platinum
Silver, Gold
Tantalum
Zinc, Ti
Steel, Ni
Molybdenum
G raphite
Si crystal
Glass - soda
Concrete
Si nitride Al oxide
PC
Wood( grain)
AFRE( fibers) *
CFRE *
GFRE*
Glass fibers only
Carbon fibers only
A ramid fibers only
Epoxy only
0.4
0.8
2
4
6
10
2 0
4 0
6 0 8 0
10 0
2 00
6 00 8 00
10 00 1200
4 00
Tin
Cu alloys
Tungsten
<100>
<111>
Si carbide
Diamond
PTF E
HDP E
LDPE
PP
Polyester
PS PET
C FRE( fibers) *
G FRE( fibers)*
G FRE(|| fibers)*
A FRE(|| fibers)*
C FRE(|| fibers)*

• Simple tension:
d = FL o
E A o
d L
= - n Fw o
E A o
• Material, geometric, and loading parameters all
contribute to deflection.
• Larger elastic moduli minimize elastic deflection.
Useful Linear Elastic Relationships
F
A o d /2
d L /2
Lo
w o
• Simple torsion:
a = 2 ML o
p r o 4 G
M = moment a = angle of twist
2ro
Lo

(at lower temperatures, i.e. T < Tmelt/3)
Plastic (Permanent) Deformation
• Simple tension test:
engineering stress, s
engineering strain, e
Elastic+Plastic at larger stress
permanent (plastic) after load is removed
ep
plastic strain
Elastic initially
Adapted from Fig. 6.10 (a),
Callister 7e.

• Stress at which noticeable plastic deformation has
occurred. when ep = 0.002
Yield Strength, sy
sy = yield strength
Note: for 2 inch sample
e = 0.002 = z/z
z = 0.004 in or
about 100 μm
Adapted from Fig. 6.10 (a),
Callister 7e.
tensile stress, s
engineering strain, e
sy
e p = 0.002
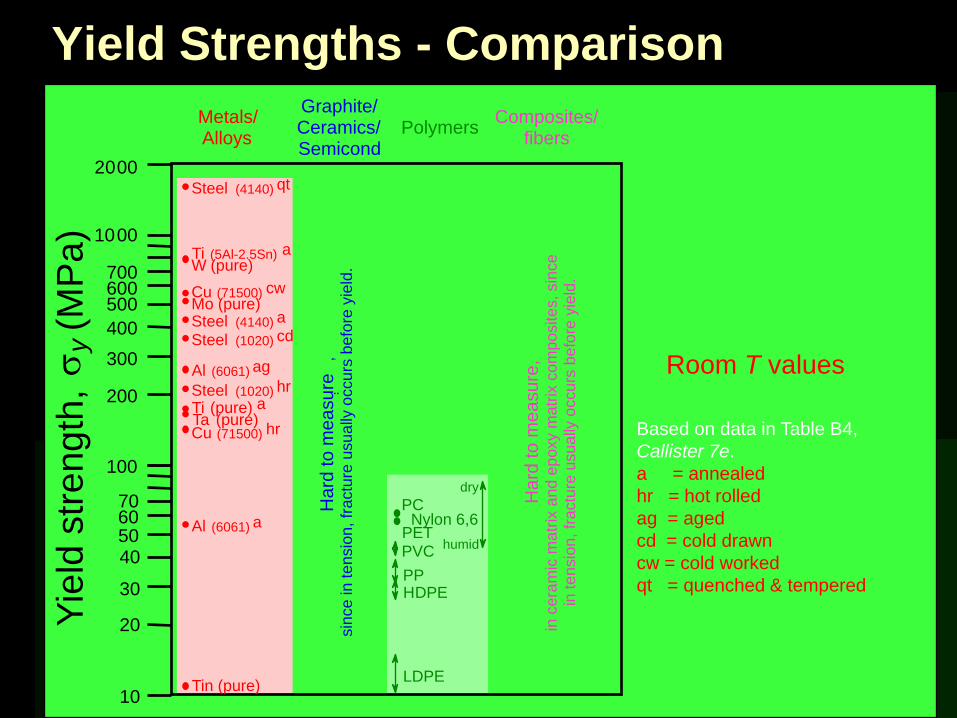
Room T values
Based on data in Table B4,
Callister 7e.
a = annealed
hr = hot rolled
ag = aged
cd = cold drawn
cw = cold worked
qt = quenched & tempered
Yield Strengths - Comparison Graphite/ Ceramics/ Semicond
Metals/ Alloys
Composites/ fibers
Polymers
Yie
ld s
tre
ng
th, s
y (M
Pa
)
PVC
Hard
to m
ea
su
re
,
sin
ce in tensio
n, fr
actu
re u
sually
occurs
befo
re y
ield
.
Nylon 6,6
LDPE
70
20
40
60 50
100
10
30
2 00
3 00
4 00
5 00 6 00 7 00
10 00
2 0 00
Tin (pure)
Al (6061) a
Al (6061) ag
Cu (71500) hr Ta (pure) Ti (pure) a Steel (1020) hr
Steel (1020) cd Steel (4140) a
Steel (4140) qt
Ti (5Al-2.5Sn) a W (pure)
Mo (pure) Cu (71500) cw
Hard
to m
ea
su
re,
in c
era
mic
matr
ix a
nd e
poxy m
atr
ix c
om
posites, sin
ce
in
tensio
n, fr
actu
re u
sually
occurs
befo
re y
ield
.
H DPE PP
humid
dry
PC
PET
¨

Tensile Strength, TS
• Metals: occurs when noticeable necking starts.
• Polymers: occurs when polymer backbone chains are
aligned and about to break.
Adapted from Fig. 6.11,
Callister 7e.
sy
strain
Typical response of a metal
F = fracture or
ultimate
strength
Neck – acts
as stress
concentrator
en
gin
ee
ring
TS s
tre
ss
engineering strain
• Maximum stress on engineering stress-strain curve.

Tensile Strengths - Comparison
Si crystal <100>
Graphite/ Ceramics/ Semicond
Metals/ Alloys
Composites/ fibers
Polymers
Te
nsile
str
en
gth
, T
S
(MP
a)
PVC
Nylon 6,6
10
100
200
300
1000
Al (6061) a
Al (6061) ag
Cu (71500) hr
Ta (pure) Ti (pure) a
Steel (1020)
Steel (4140) a
Steel (4140) qt
Ti (5Al-2.5Sn) a W (pure)
Cu (71500) cw
L DPE
PP
PC PET
20
30 40
2000
3000
5000
Graphite
Al oxide
Concrete
Diamond
Glass-soda
Si nitride
H DPE
wood ( fiber)
wood(|| fiber)
1
GFRE (|| fiber)
GFRE ( fiber)
C FRE (|| fiber)
C FRE ( fiber)
A FRE (|| fiber)
A FRE( fiber)
E-glass fib
C fibers Aramid fib
Room Temp. values
Based on data in Table B4,
Callister 7e.
a = annealed
hr = hot rolled
ag = aged
cd = cold drawn
cw = cold worked
qt = quenched & tempered
AFRE, GFRE, & CFRE =
aramid, glass, & carbon
fiber-reinforced epoxy
composites, with 60 vol%
fibers.

• Plastic tensile strain at failure:
Adapted from Fig. 6.13,
Callister 7e.
Ductility
• Another ductility measure: 100 x A
A A RA %
o
f o -
=
x 100 L
L L EL %
o
o f -
=
Engineering tensile strain, e
E ngineering
tensile
stress, s
smaller %EL
larger %EL Lf
Ao Af
Lo

• Energy to break a unit volume of material
• Approximate by the area under the stress-strain
curve.
Toughness
Brittle fracture: elastic energy
Ductile fracture: elastic + plastic energy
very small toughness (unreinforced polymers)
Engineering tensile strain, e
E ngineering
tensile
stress, s
small toughness (ceramics)
large toughness (metals)
Adapted from Fig. 6.13,
Callister 7e.

Resilience, Ur
Ability of a material to store energy
Energy stored best in elastic region
If we assume a linear stress-
strain curve this simplifies to:
Adapted from Fig. 6.15,
Callister 7e.
y y r 2
1 U e s @
0
y
rU de
s e

Elastic Strain Recovery
Adapted from Fig. 6.17,
Callister 7e.

Hardness
• Resistance to permanently indenting the surface.
• Large hardness means:
-resistance to plastic deformation or cracking in
compression.
-better wear properties.
e.g., 10 mm sphere
apply known force measure size of indent after removing load
d D Smaller indents mean larger hardness.
increasing hardness
most plastics
brasses Al alloys
easy to machine steels file hard
cutting tools
nitrided steels diamond

Hardness Measures
Rockwell
No major sample damage
Each scale runs to 130 but only useful in range
20-100.
Minor load 10 kg
Major load 60 (A), 100 (B) & 150 (C) kg
A = diamond, B = 1/16 in. ball, C = diamond
HB = Brinell Hardness
TS (psia) = 500 x HB
TS (MPa) = 3.45 x HB

Hardness Measurements

True Stress and Strain
Note: S.A. changes when sample stretched
True stress
True Strain
T iF As
lnT i oe
1
ln 1
T
T
s s e
e e
Adapted from Fig. 6.16,
Callister 7e.

Hardening
• Curve fit to the stress-strain response:
s
T = K e
T ( ) n
“true” stress (F/A) “true” strain: ln(L/Lo)
hardening exponent: n = 0.15 (some steels) to n = 0.5 (some coppers)
• An increase in sy due to plastic deformation.
s
e
large hardening
small hardening s y 0
s y 1

• Design uncertainties mean we do not push the limit.
• Factor of safety, N
N
y
working
ss
Often N is
between
1.2 and 4
• Example: Calculate a diameter, d, to ensure that yield does
not occur in the 1045 carbon steel rod below. Use a
factor of safety of 5.
Design or Safety Factors
4
0002202 /d
N,
p5
N
y
working
ss 1045 plain
carbon steel: s y = 310 MPa
TS = 565 MPa
F = 220,000N
d
L o
d = 0.067 m = 6.7 cm