PwC's Global Technology IPO Trends: 2010 - 2014
28
pwc.com Global Technology IPO Trends 2010 - 2014 December 5, 2014 Raman Chitkara, Global Technology Industry Leader Technology and Changing Capital Markets NYU Center on U.S.-China Relations
Transcript of PwC's Global Technology IPO Trends: 2010 - 2014

pwc.comGlobal Technology IPOTrends 2010 - 2014
December 5, 2014
Raman Chitkara,Global Technology IndustryLeader
Technology andChanging CapitalMarkets
NYU Centeron U.S.-ChinaRelations
PwC
Agenda
• Global technology IPOs 2010-2014
• Cross border IPOs
• Geographic distribution
• Stock exchange distribution
• Sub-sector distribution
• $10 billion+ technology IPOs
December 20142
PwC
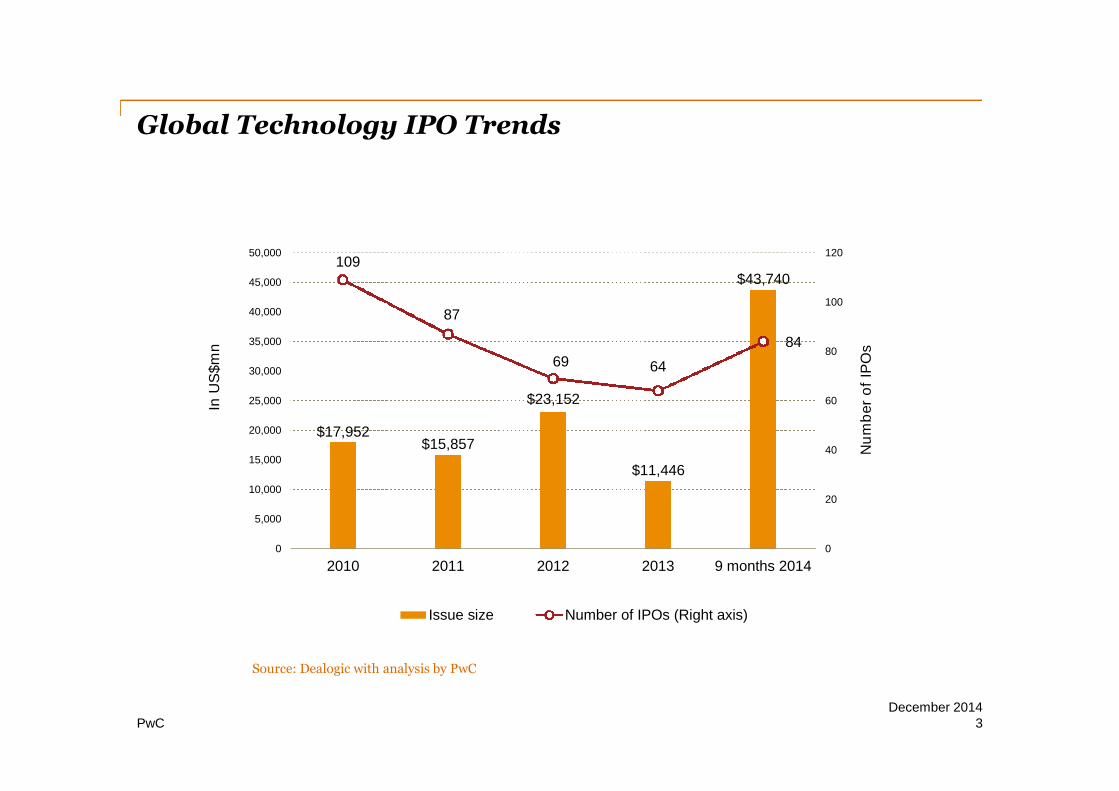
Global Technology IPO Trends
December 20143
$17,952$15,857
$23,152
$11,446
$43,740109
87
69 64
84
0
20
40
60
80
100
120
0
5,000
10,000
15,000
20,000
25,000
30,000
35,000
40,000
45,000
50,000
2010 2011 2012 2013 9 months 2014
Nu
mb
er
of
IPO
s
InU
S$m
n
Issue size Number of IPOs (Right axis)
Source: Dealogic with analysis by PwC

PwC
US Technology IPO Trends
December 20144
$2,150
$5,104
$20,310
$7,591$6,134
19
24
32
35
28
0
5
10
15
20
25
30
35
40
0
5,000
10,000
15,000
20,000
25,000
2010 2011 2012 2013 9 months 2014
Nu
mb
er
of
IPO
s
InU
S$m
n
Issue size Number of IPOs (Right axis)
Source: Dealogic with analysis by PwC
PwC
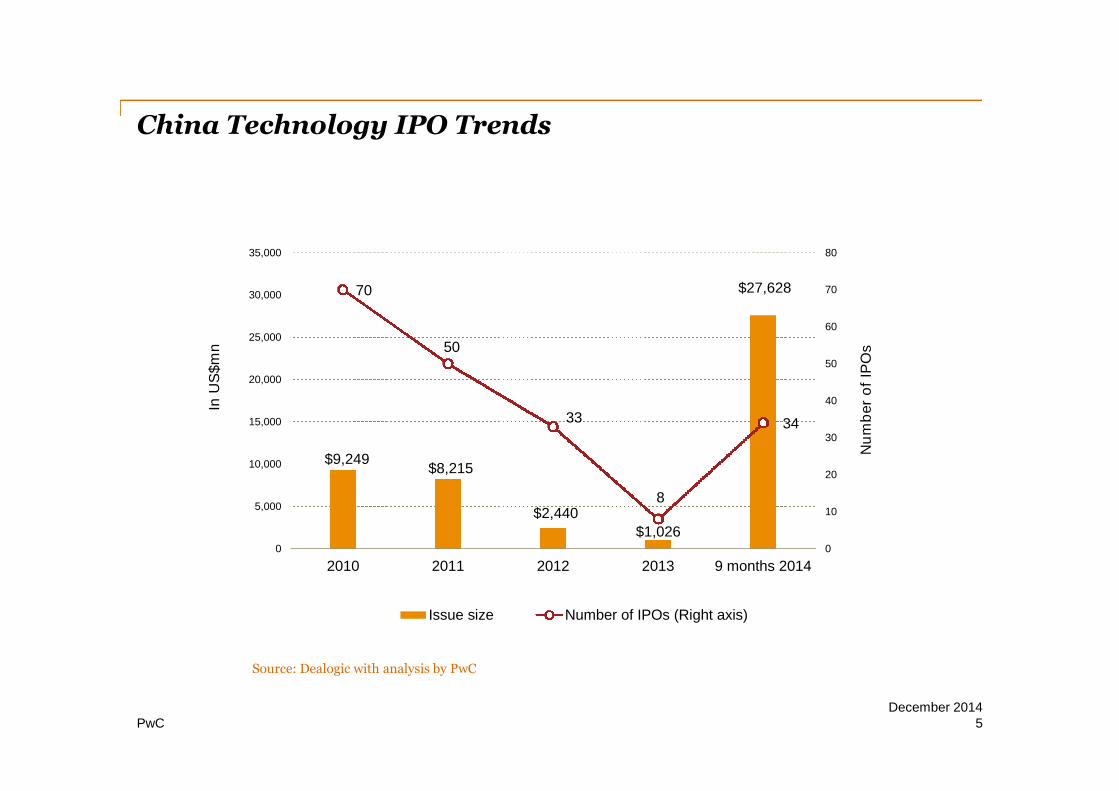
China Technology IPO Trends
December 20145
$9,249$8,215
$2,440
$1,026
$27,62870
50
33
8
34
0
10
20
30
40
50
60
70
80
0
5,000
10,000
15,000
20,000
25,000
30,000
35,000
2010 2011 2012 2013 9 months 2014
Nu
mb
er
of
IPO
s
InU
S$m
n
Issue size Number of IPOs (Right axis)
Source: Dealogic with analysis by PwC
PwC
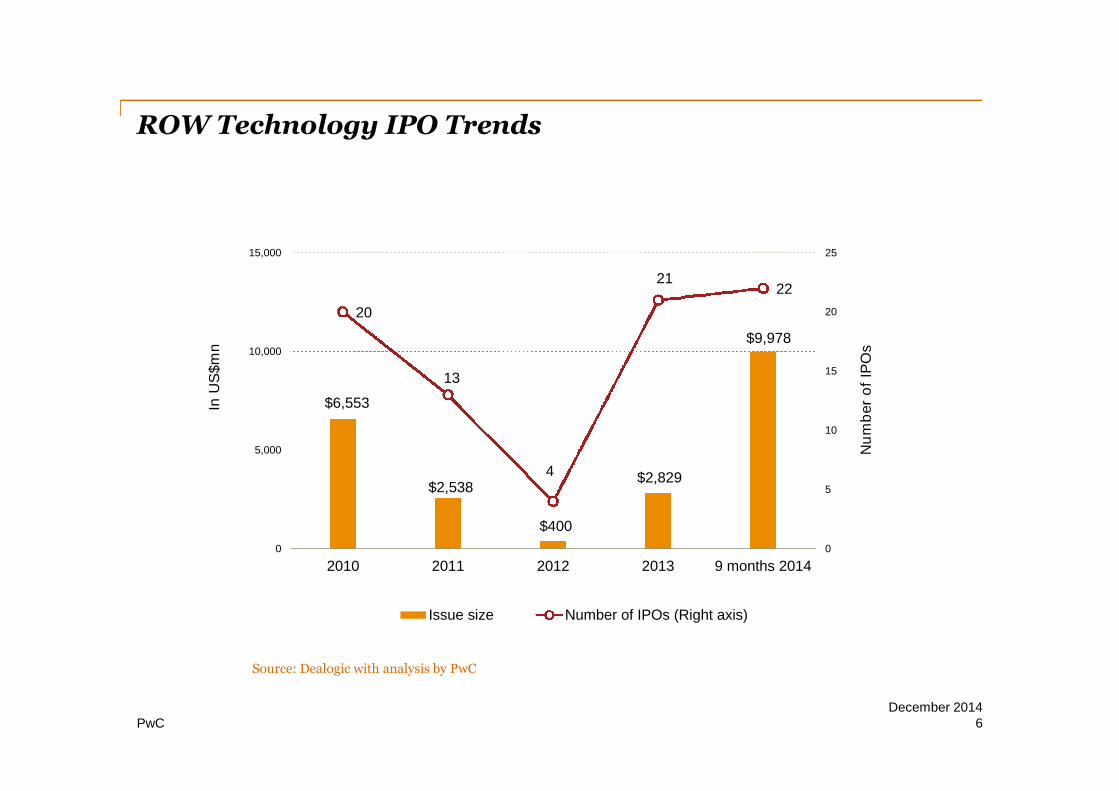
ROW Technology IPO Trends
December 20146
$6,553
$2,538
$400
$2,829
$9,978
20
13
4
2122
0
5
10
15
20
25
0
5,000
10,000
15,000
2010 2011 2012 2013 9 months 2014
Nu
mb
er
of
IPO
s
InU
S$m
n
Issue size Number of IPOs (Right axis)
Source: Dealogic with analysis by PwC
pwc.comGlobal Technology IPOTrends
Cross Border IPOsTechnology andChanging CapitalMarkets
NYU Centeron U.S.-ChinaRelations

PwC
Cross Border IPOs
December 20148
$4,227$3,542
$343$1,829
$27,82820
14
3
13
18
0
5
10
15
20
25
0
5,000
10,000
15,000
20,000
25,000
30,000
35,000
2010 2011 2012 2013 9 months 2014
Nu
mb
er
of
IPO
s
InU
S$m
n
Issue size Number of IPOs (Right axis)
Source: Dealogic with analysis by PwC
PwC
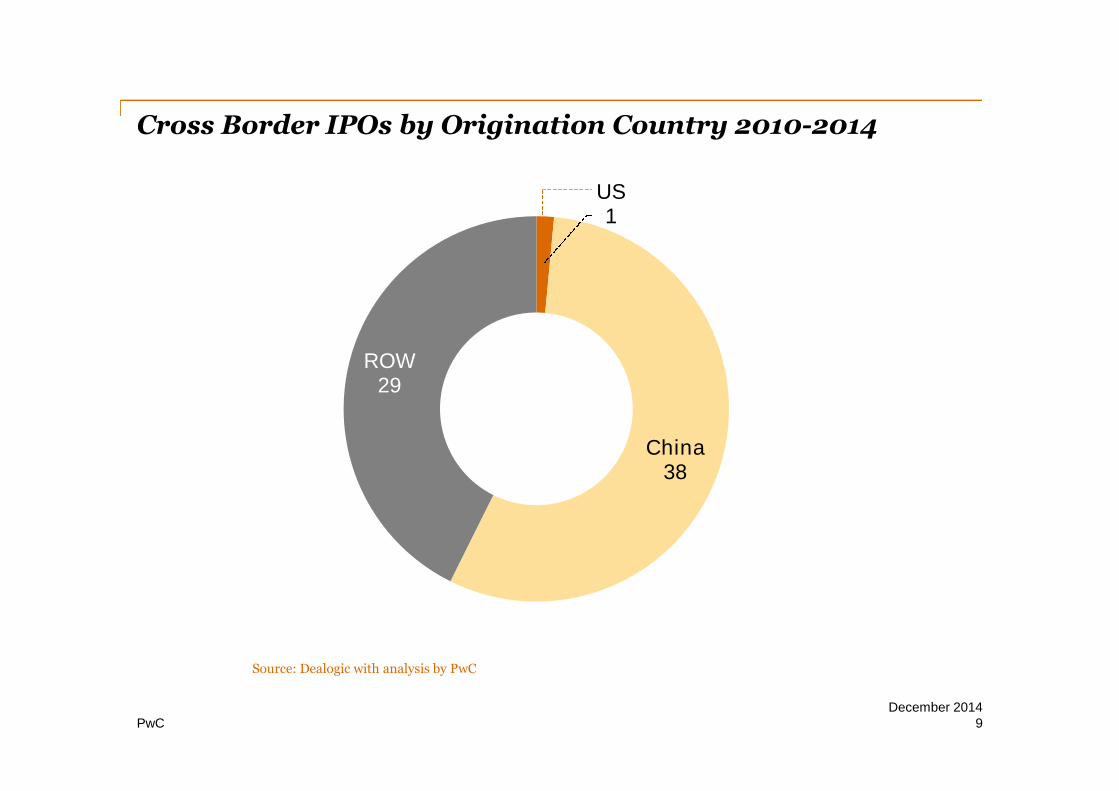
Cross Border IPOs by Origination Country 2010-2014
US1
China38
ROW29
December 20149
Source: Dealogic with analysis by PwC
PwC
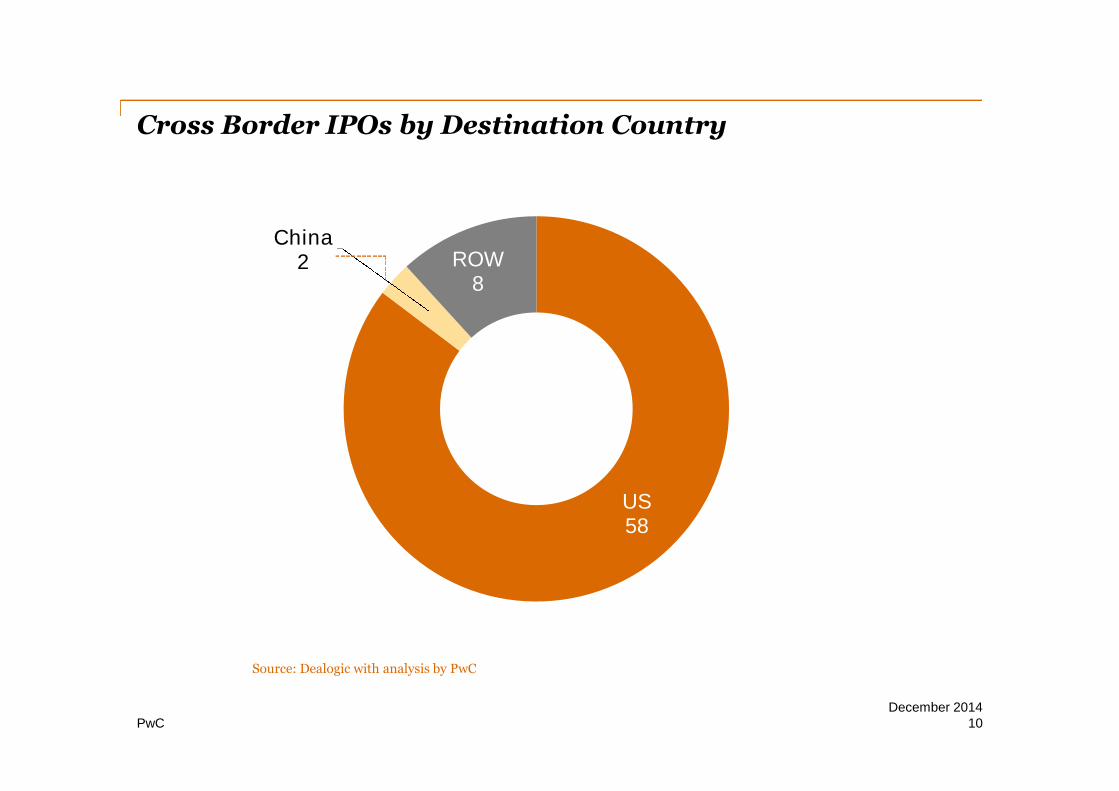
Cross Border IPOs by Destination Country
US58
China2 ROW
8
December 201410
Source: Dealogic with analysis by PwC

pwc.comGlobal Technology IPOTrends
Geographical DistributionTechnology andChanging CapitalMarkets
NYU Centeron U.S.-ChinaRelations
PwC
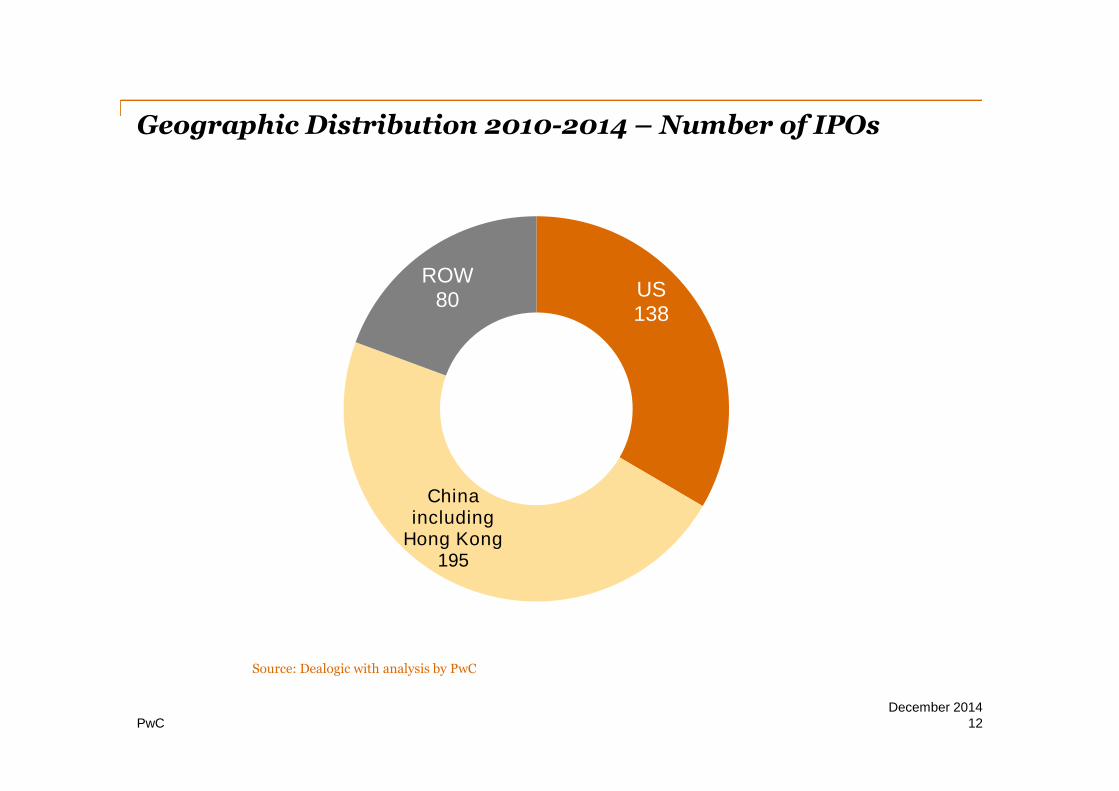
Geographic Distribution 2010-2014 – Number of IPOs
US138
Chinaincluding
Hong Kong195
ROW80
December 201412
Source: Dealogic with analysis by PwC

PwC LLP
Geographic Distribution 2010-2014
December 2014
US75
China*153
ROW37
US35
China*8
ROW21
US28
China*34
ROW22
2010 - 2012 2013 9 mos 2014
13
* Including Hong Kong
Source: Dealogic with analysis by PwC
pwc.comGlobal Technology IPOTrends
Stock Exchange DistributionTechnology andChanging CapitalMarkets
NYU Centeron U.S.-ChinaRelations
PwC
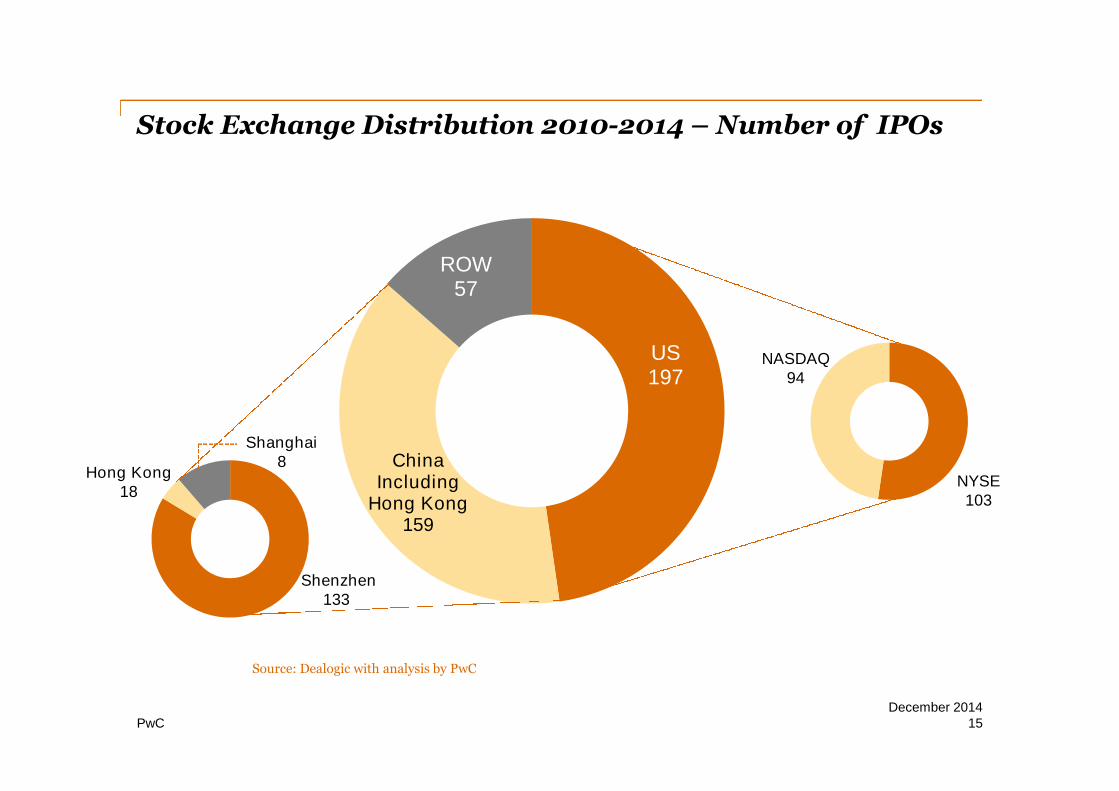
Stock Exchange Distribution 2010-2014 – Number of IPOs
December 2014
US197
ChinaIncluding
Hong Kong159
ROW57
15
Source: Dealogic with analysis by PwC
Shenzhen133
Hong Kong18
Shanghai8
NYSE103
NASDAQ94
PwC LLP
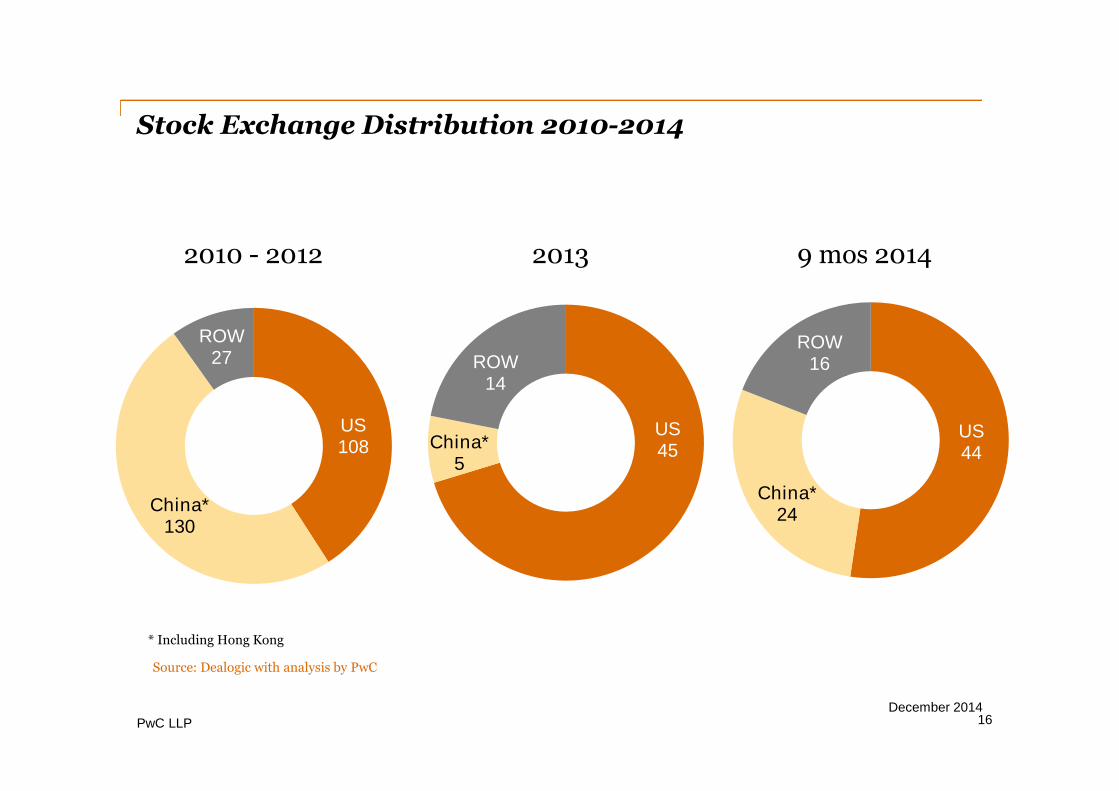
Stock Exchange Distribution 2010-2014
December 2014
US108
China*130
ROW27
US45China*
5
ROW14
US44
China*24
ROW16
2010 - 2012 2013 9 mos 2014
16
* Including Hong Kong
Source: Dealogic with analysis by PwC
PwC
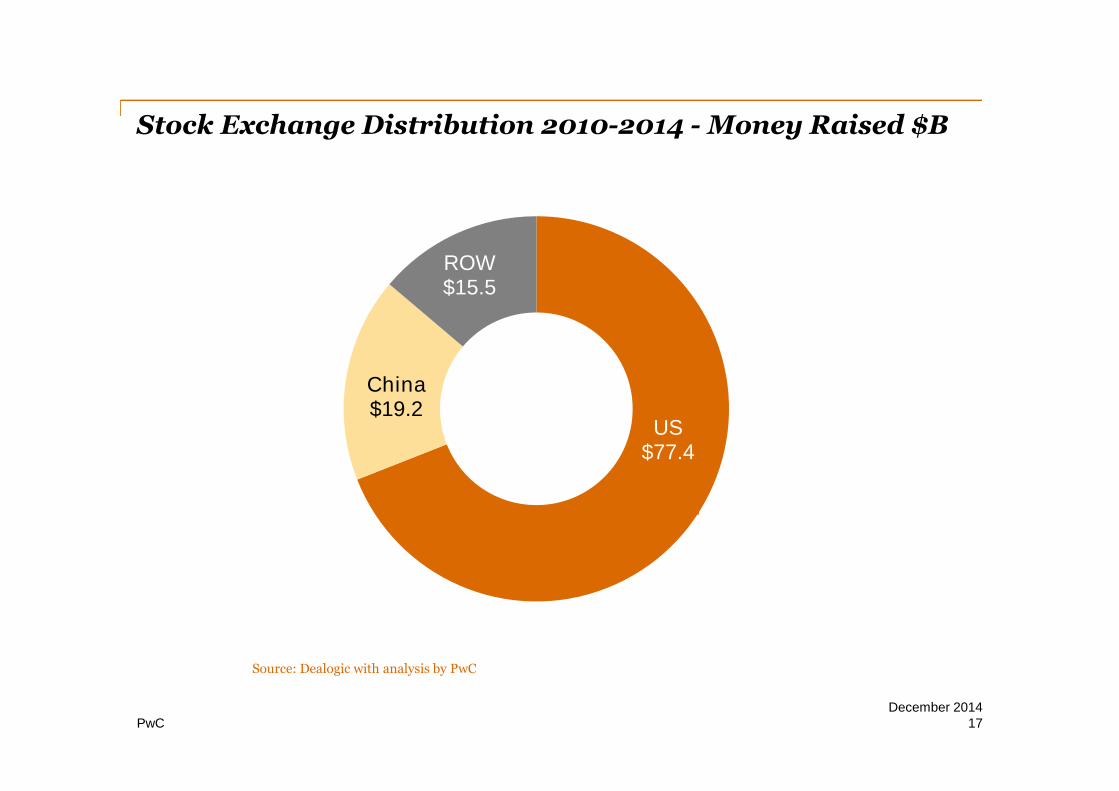
Stock Exchange Distribution 2010-2014 - Money Raised $B
December 2014
US$77.4
China$19.2
ROW$15.5
17
Source: Dealogic with analysis by PwC
pwc.comGlobal Technology IPOTrends
Sub-sector DistributionTechnology andChanging CapitalMarkets
NYU Centeron U.S.-ChinaRelations

PwC
Sub-sector Distribution 2010-2014 – Number of IPOs
Computers &Peripherals
30
InternetSoftware &Services
109
Semiconductorand Alternate
Energy84
Software86
CommsEquipment
32
Electronics9
IT Consulting &Services
45 Other18
December 201419
Source: Dealogic with analysis by PwC
PwC
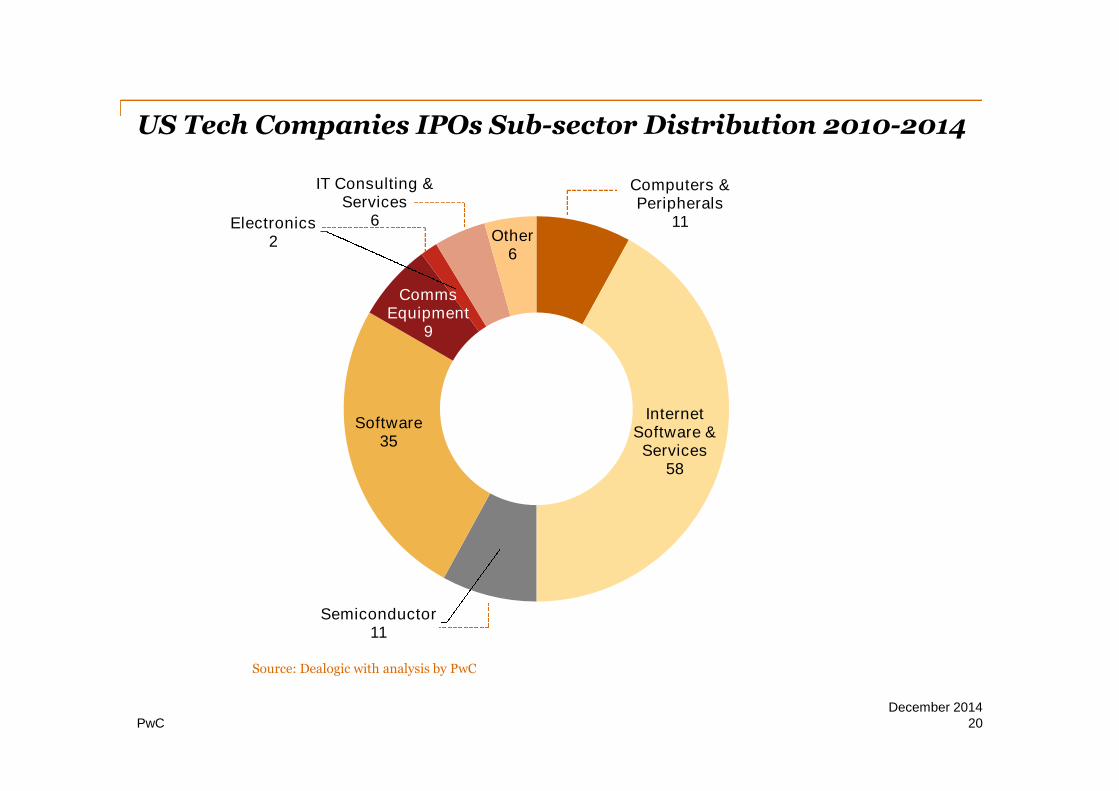
US Tech Companies IPOs Sub-sector Distribution 2010-2014
Computers &Peripherals
11
InternetSoftware &Services
58
Semiconductor11
Software35
CommsEquipment
9
Electronics2
IT Consulting &Services
6Other
6
December 201420
Source: Dealogic with analysis by PwC
PwC
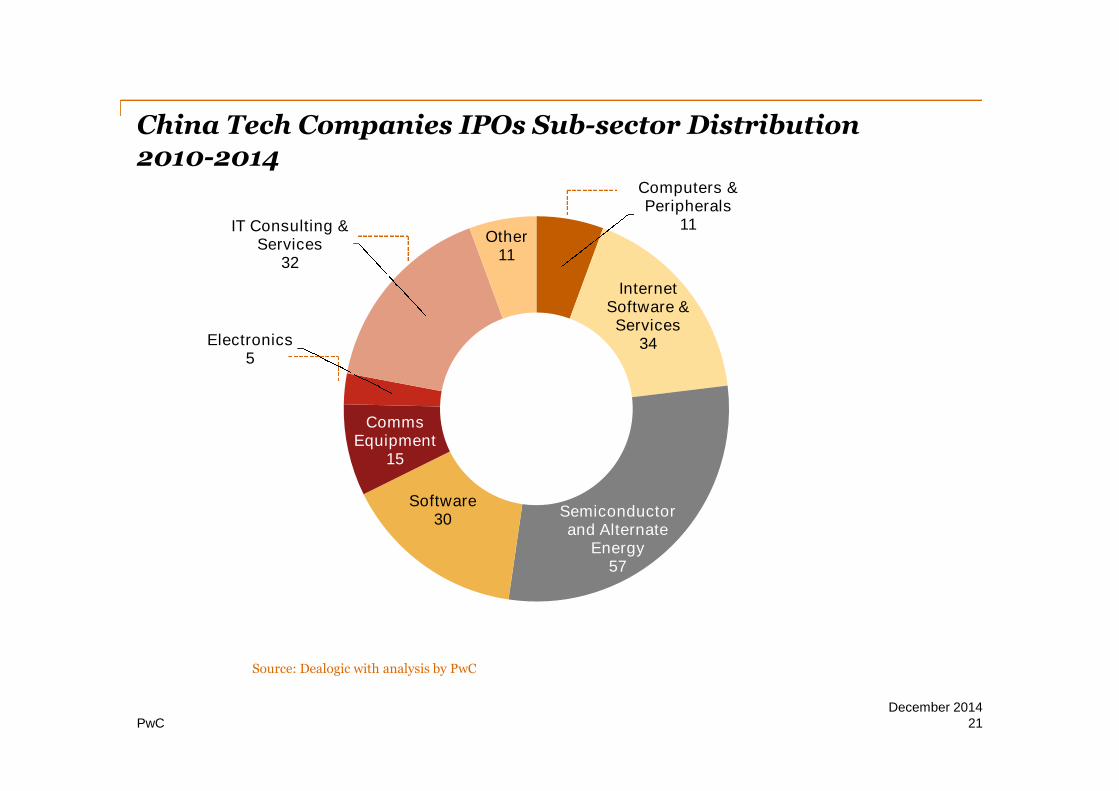
China Tech Companies IPOs Sub-sector Distribution2010-2014
Computers &Peripherals
11
InternetSoftware &Services
34
Semiconductorand Alternate
Energy57
Software30
CommsEquipment
15
Electronics5
IT Consulting &Services
32
Other11
December 201421
Source: Dealogic with analysis by PwC
PwC
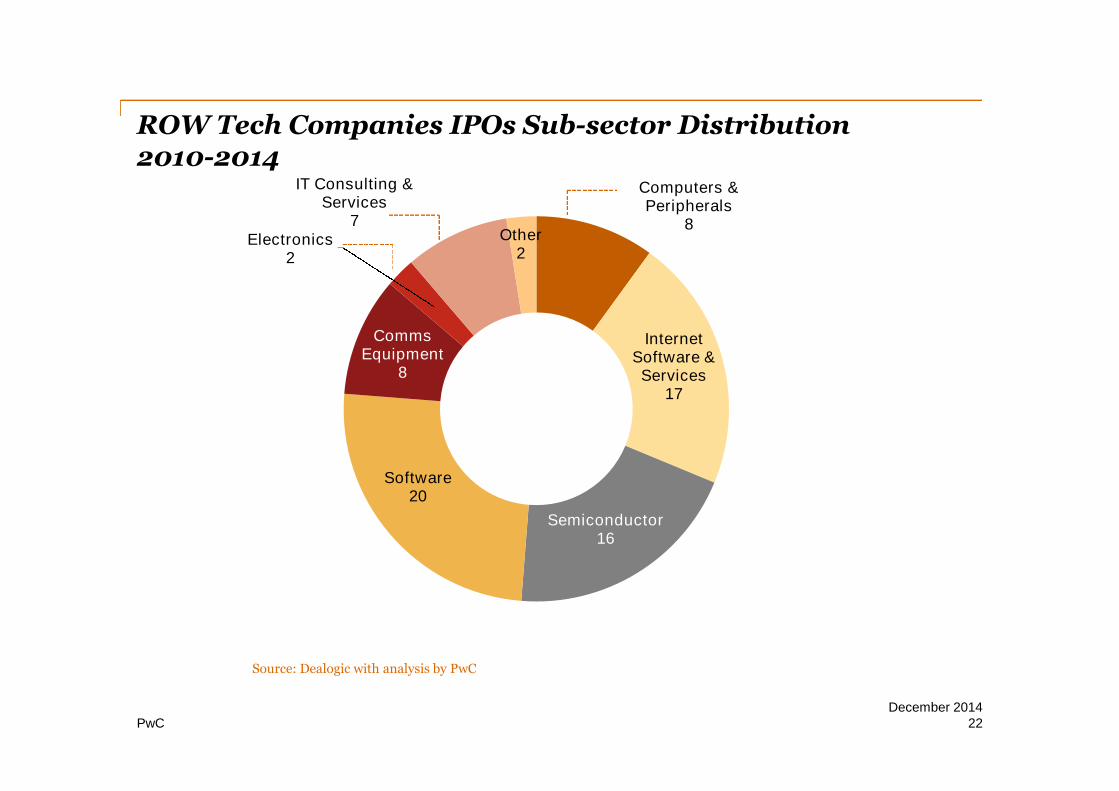
ROW Tech Companies IPOs Sub-sector Distribution2010-2014
Computers &Peripherals
8
InternetSoftware &Services
17
Semiconductor16
Software20
CommsEquipment
8
Electronics2
IT Consulting &Services
7Other
2
December 201422
Source: Dealogic with analysis by PwC
pwc.comGlobal Technology IPOTrends
Ten Billion Plus Technology IPOsTechnology andChanging CapitalMarkets
NYU Centeron U.S.-ChinaRelations

PwC
$16.2B
$10B+ Market Cap Technology IPOs 2010-2014
December 2014
$275.2B
$28.1B
$30.7B
$32.0B
$216.6B
$17.7B
$18.0B
$26.5B
$9.4B
$9.5B
$9.8B
26
Market cap as of November 28, 2014 close
PwC
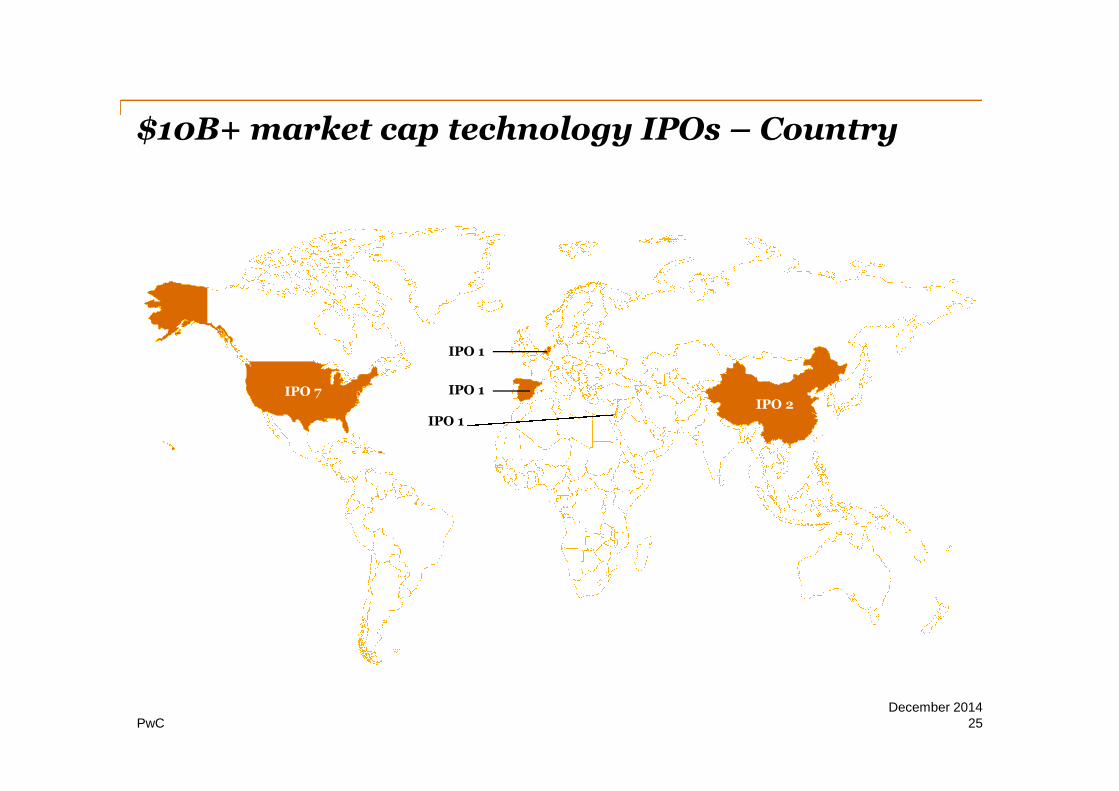
$10B+ market cap technology IPOs – Country
December 201425
IPO 7
IPO 1Population
Growth rate2000-2050
<0%
0-1%
1-2%
2% +
IPO 2IPO 1
IPO 1

PwC
$10B+ Market Cap Technology IPOs - Segment
December 201426
Semi
Software
Wearables
PwC
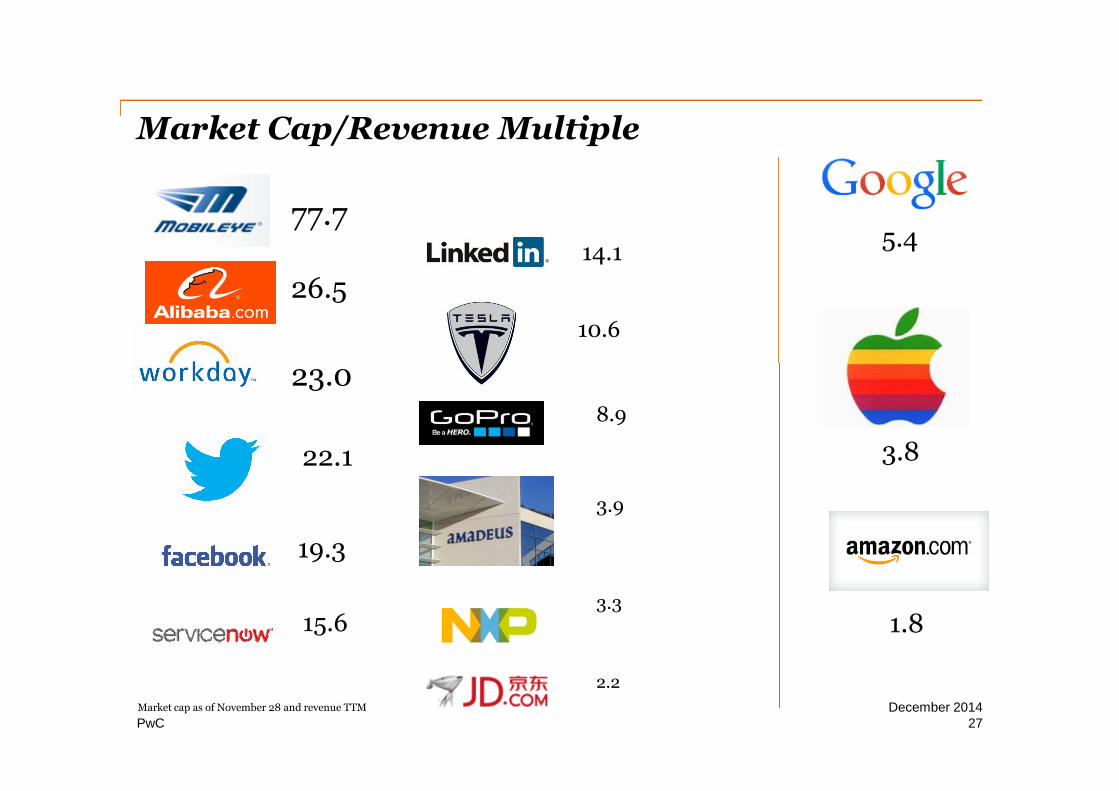
23.0
Market Cap/Revenue Multiple
December 201427
77.7
26.5
22.1
19.3
15.6
14.1
10.6
8.9
3.9
3.3
2.2
3.8
5.4
1.8
Market cap as of November 28 and revenue TTM
PwC
Thank you
pwc.com/globaltechipo
pwc.com/technology